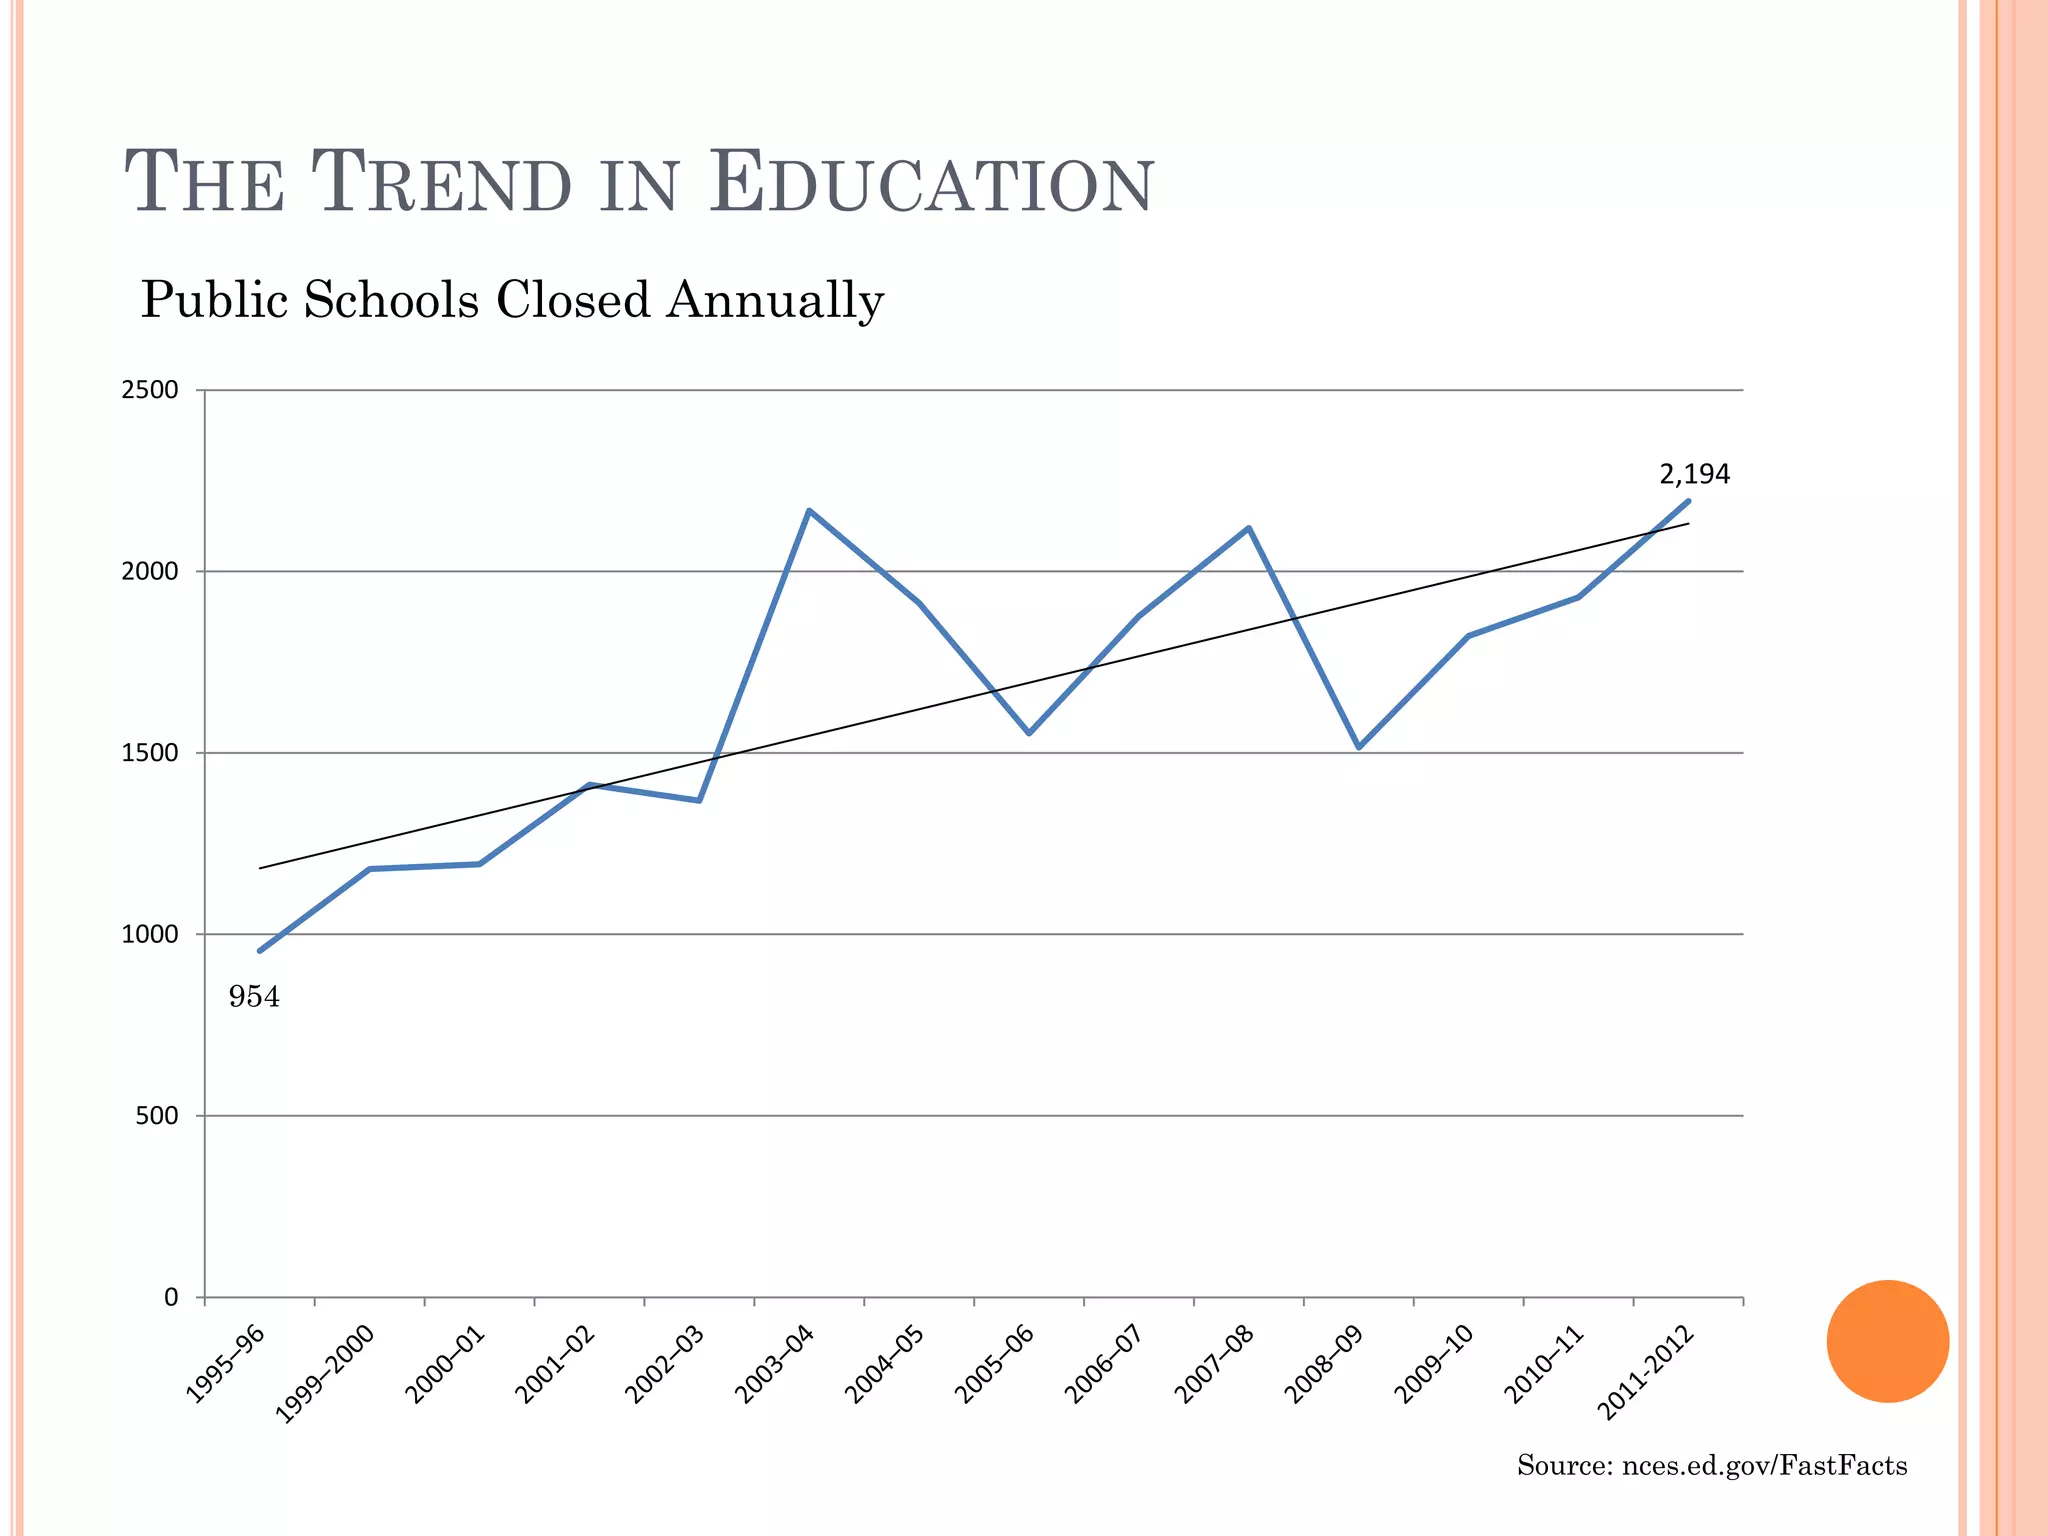
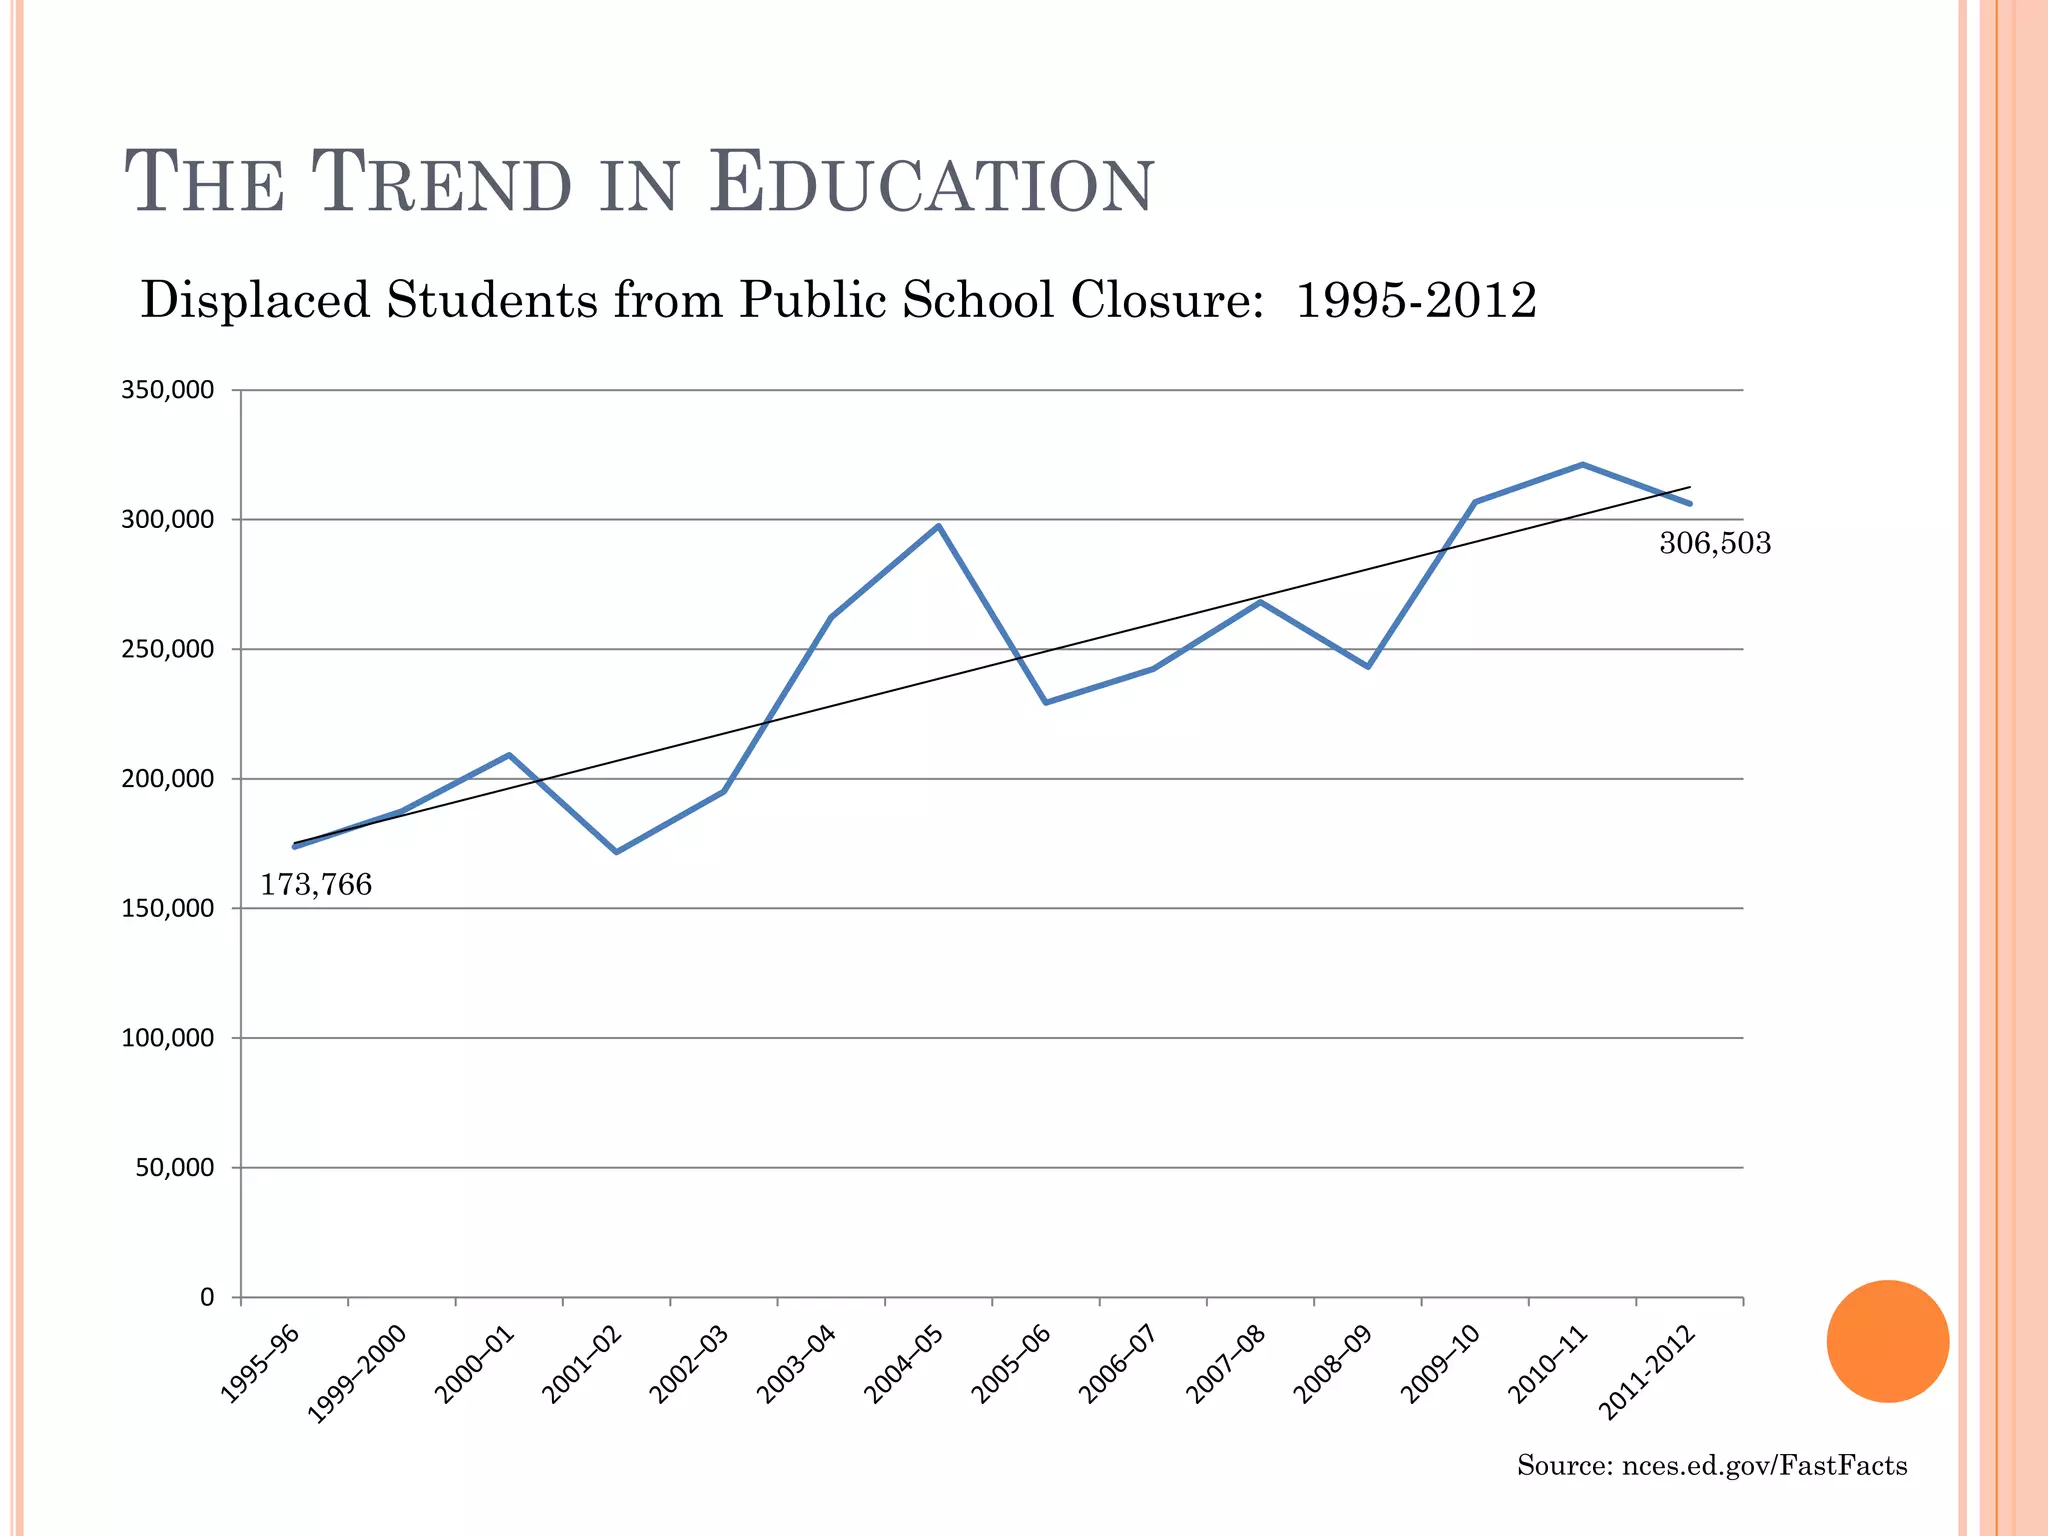
The document discusses developing a heterodox theory of spatial economics by extending the heterodox social surplus approach to urban economic issues and incorporating spatial factors. It presents models to describe the structure of production within a city, social accounting, financial flows, output and employment. The models show how the local and external ruling classes influence economic activity and connectivity between cities. Spatial elements are discussed, including how space is socially produced and regulated. Factors influencing school closures like enrollment and demographics are examined.

![THE STRUCTURE OF PRODUCTION WITHIN A CITY
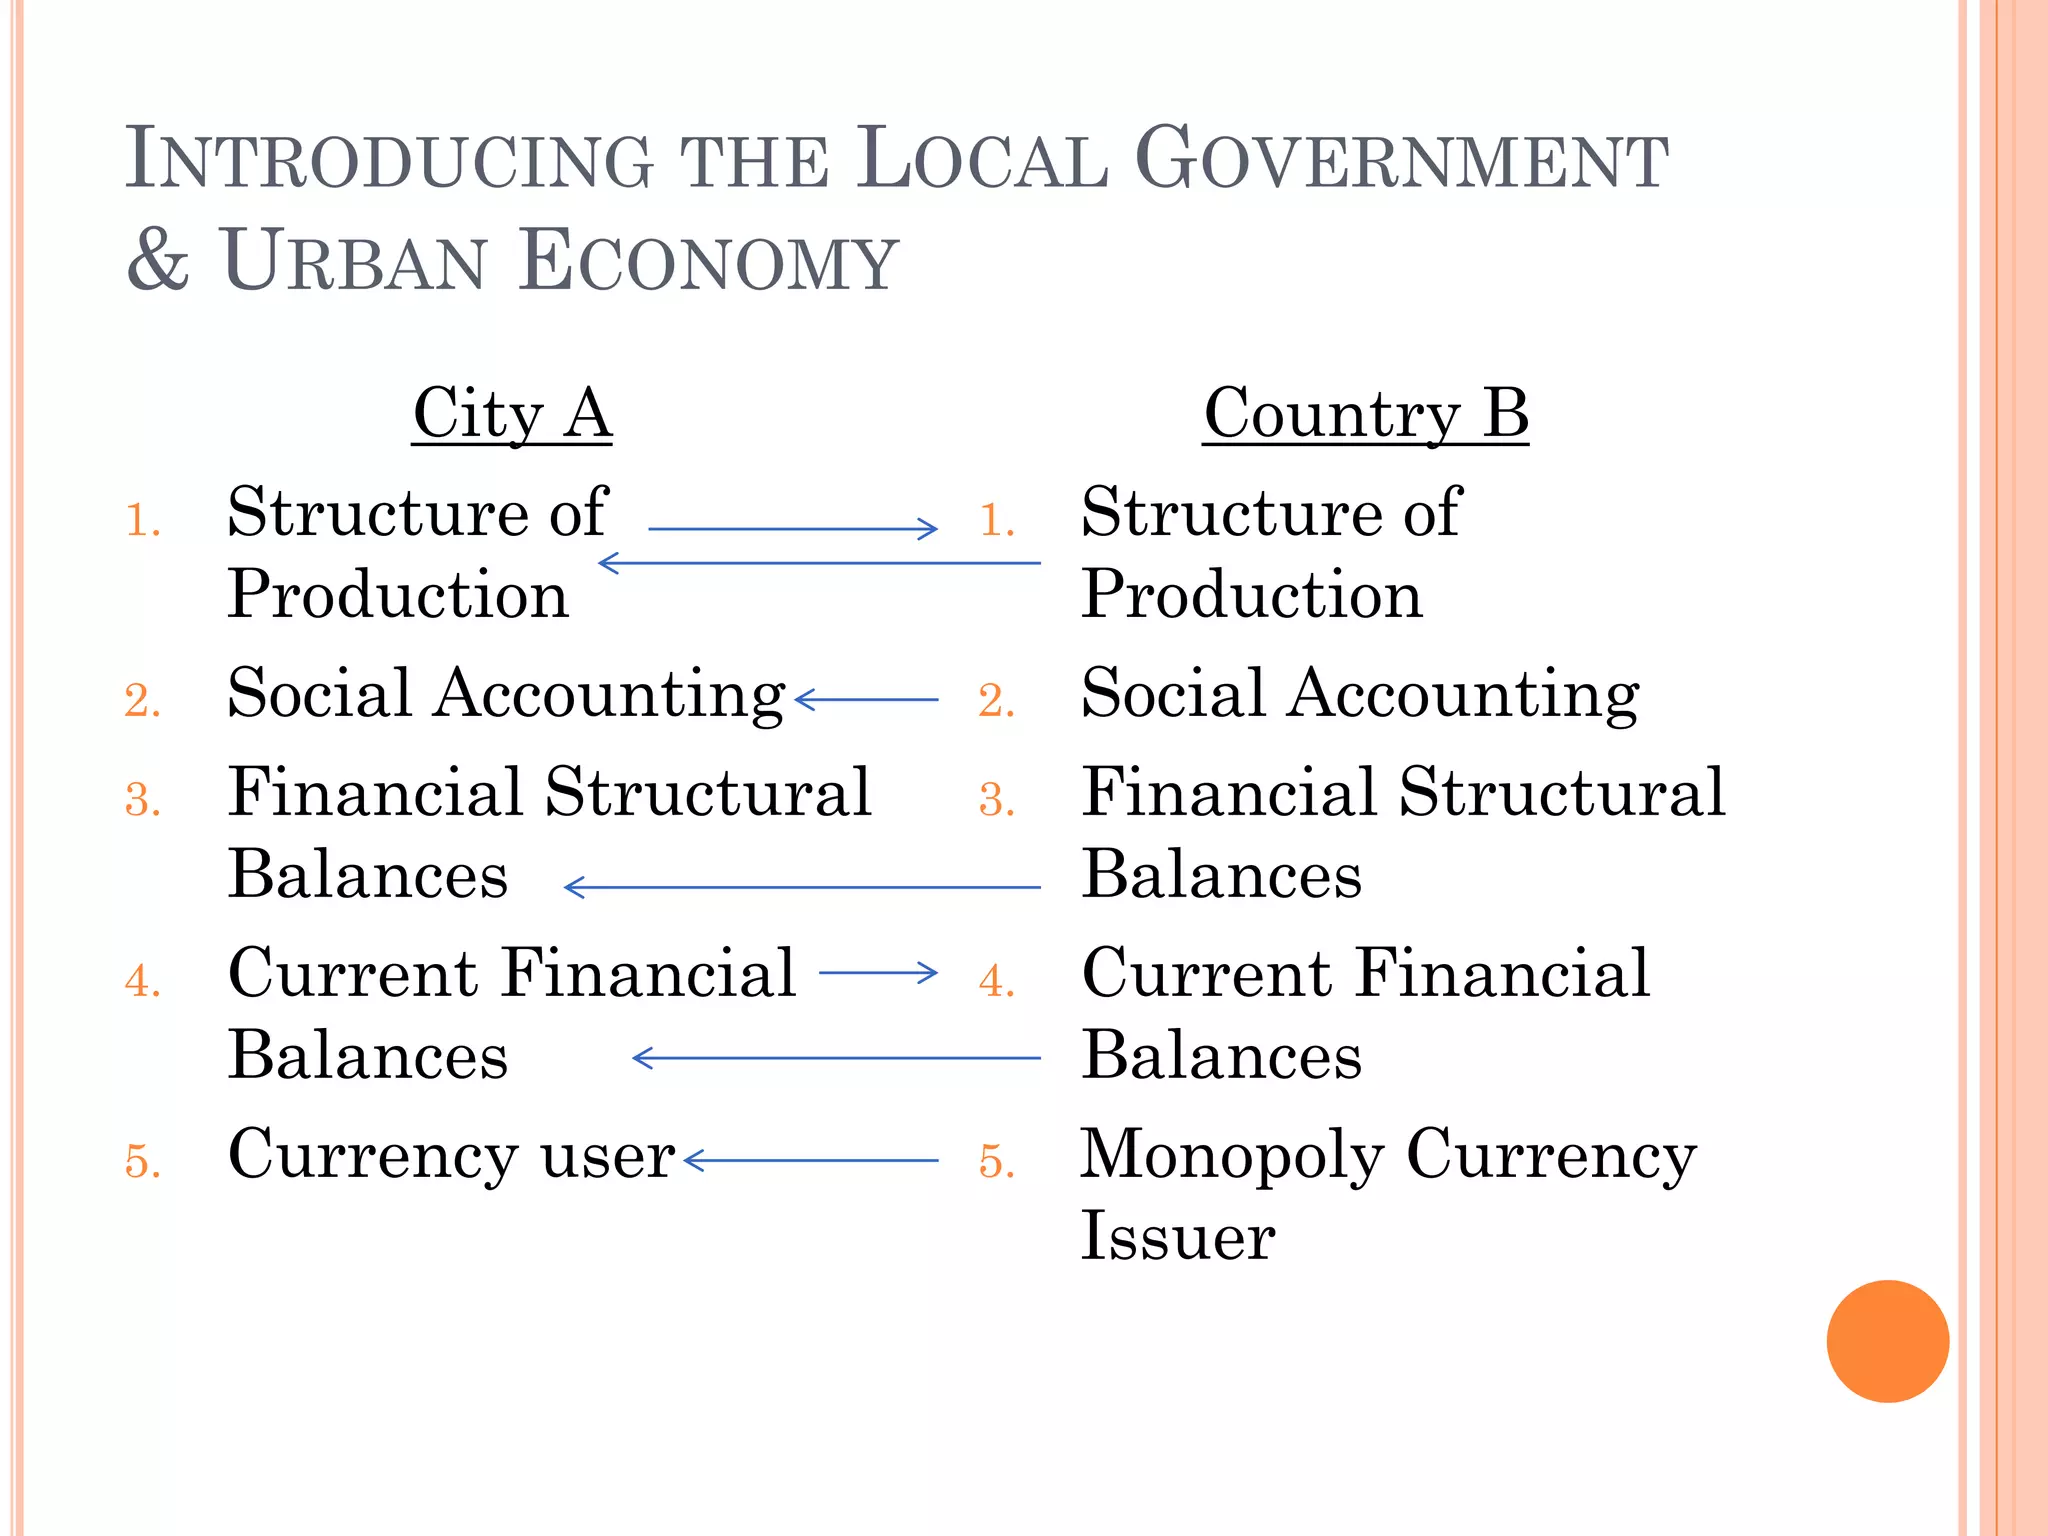
1.The cost of production is dependent upon local government services: 퐾 43,퐾 1,푅푅1,퐹퐴1,퐿퐵1: 퐺11푃1+퐿11푤 + 휋 → 푄1푃1 (1) [Basic]
퐾 43,퐾 2 ,푅푅2,퐹퐴2,퐿퐵2: 퐺21푃1+퐿21푤 + 휋→ 푄2푃2 (2) [Surplus]
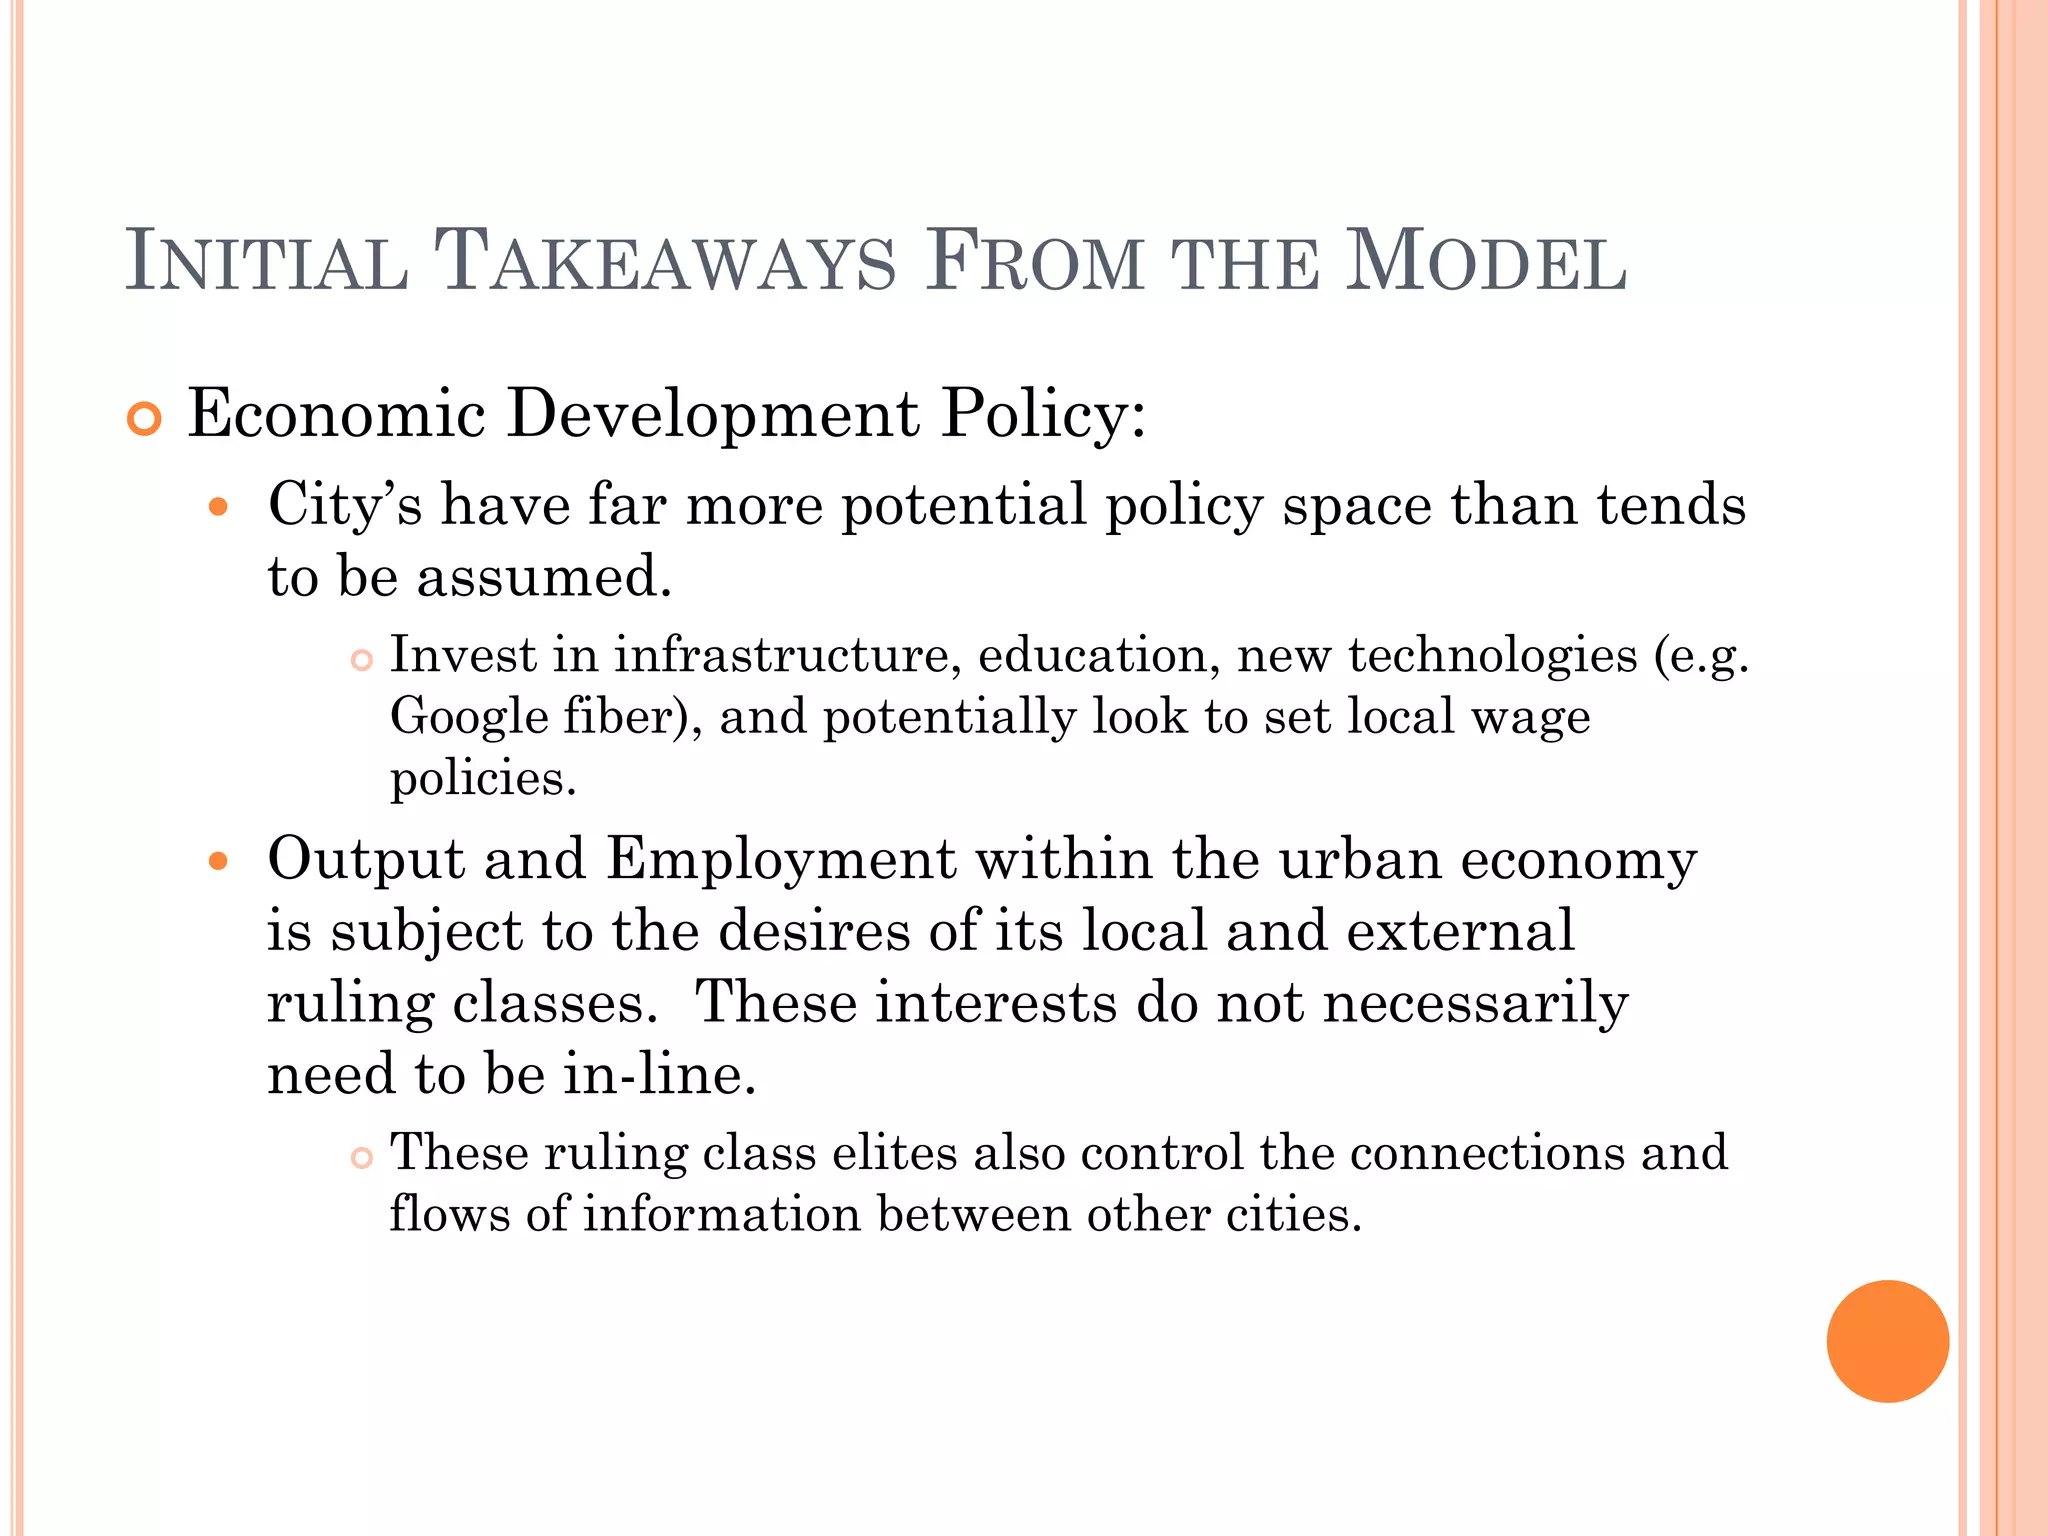
Local Government (including county, school board, etc.) has policy space to address prices, wages, and profits.
No smokestack chasing! Invest in the local economy.
Infrastructure spending 푃푖↓ and/or ↑ 휋 via mark-up
Invest in education, including early child-hood ed.
Local min. wage policies](https://image.slidesharecdn.com/westberg-141015135732-conversion-gate02/75/TOWARDS-A-HETERODOX-THEORY-OF-THE-SPATIAL-ECONOMY-11-2048.jpg)
![OUTPUT & EMPLOYMENT IN THE CITY
Given the Leontief/Sraffian system, a change in S will lead to an even greater change in 푄1in the same direction. 푄1=[I-A11T]-1A21TS (6)
L* = 푙푇 1 [I-A11T]-1A21TS + 푙푇 1S + LBanks (7)
As the A matrix is based on the G matrix, which is augmented by the level of local investment in infrastructure (at ever improving vintages of technology), the maximum eigenvalue will fall faster as S is maintained and/or increased over repeated production cycles.
Given that output and employment are tied to S, we can conclude that urban employment is dependent upon the decisions of the local ruling class plus the ruling class of the country as a whole.
This same result also means that the ruling classes establish the network linkages to other cities within the country.
Given that all output, wages, and profits are in State-money prices, and given that the ruling class governs both the control of State-money and of state investment decisions at all levels of government, the fate of a city can be held captive by the willful decisions of the ruling class outside the city – as is often the case for smaller more rural communities. This is applicable across space within a city as well, depending on the degree of dependency.](https://image.slidesharecdn.com/westberg-141015135732-conversion-gate02/75/TOWARDS-A-HETERODOX-THEORY-OF-THE-SPATIAL-ECONOMY-15-2048.jpg)
![A BRIEF SUMMARY OF EXTENSIONS THUS FAR
퐾 43,퐾 1,푅푅1,퐹퐴1,퐿퐵1: 퐺11푃1+퐿11푤 + 휋 → 푄1푃1 (1)
퐾 43,퐾 2 ,푅푅2,퐹퐴2,퐿퐵2: 퐺21푃1+퐿21푤 + 휋→ 푄2푃2 (2)
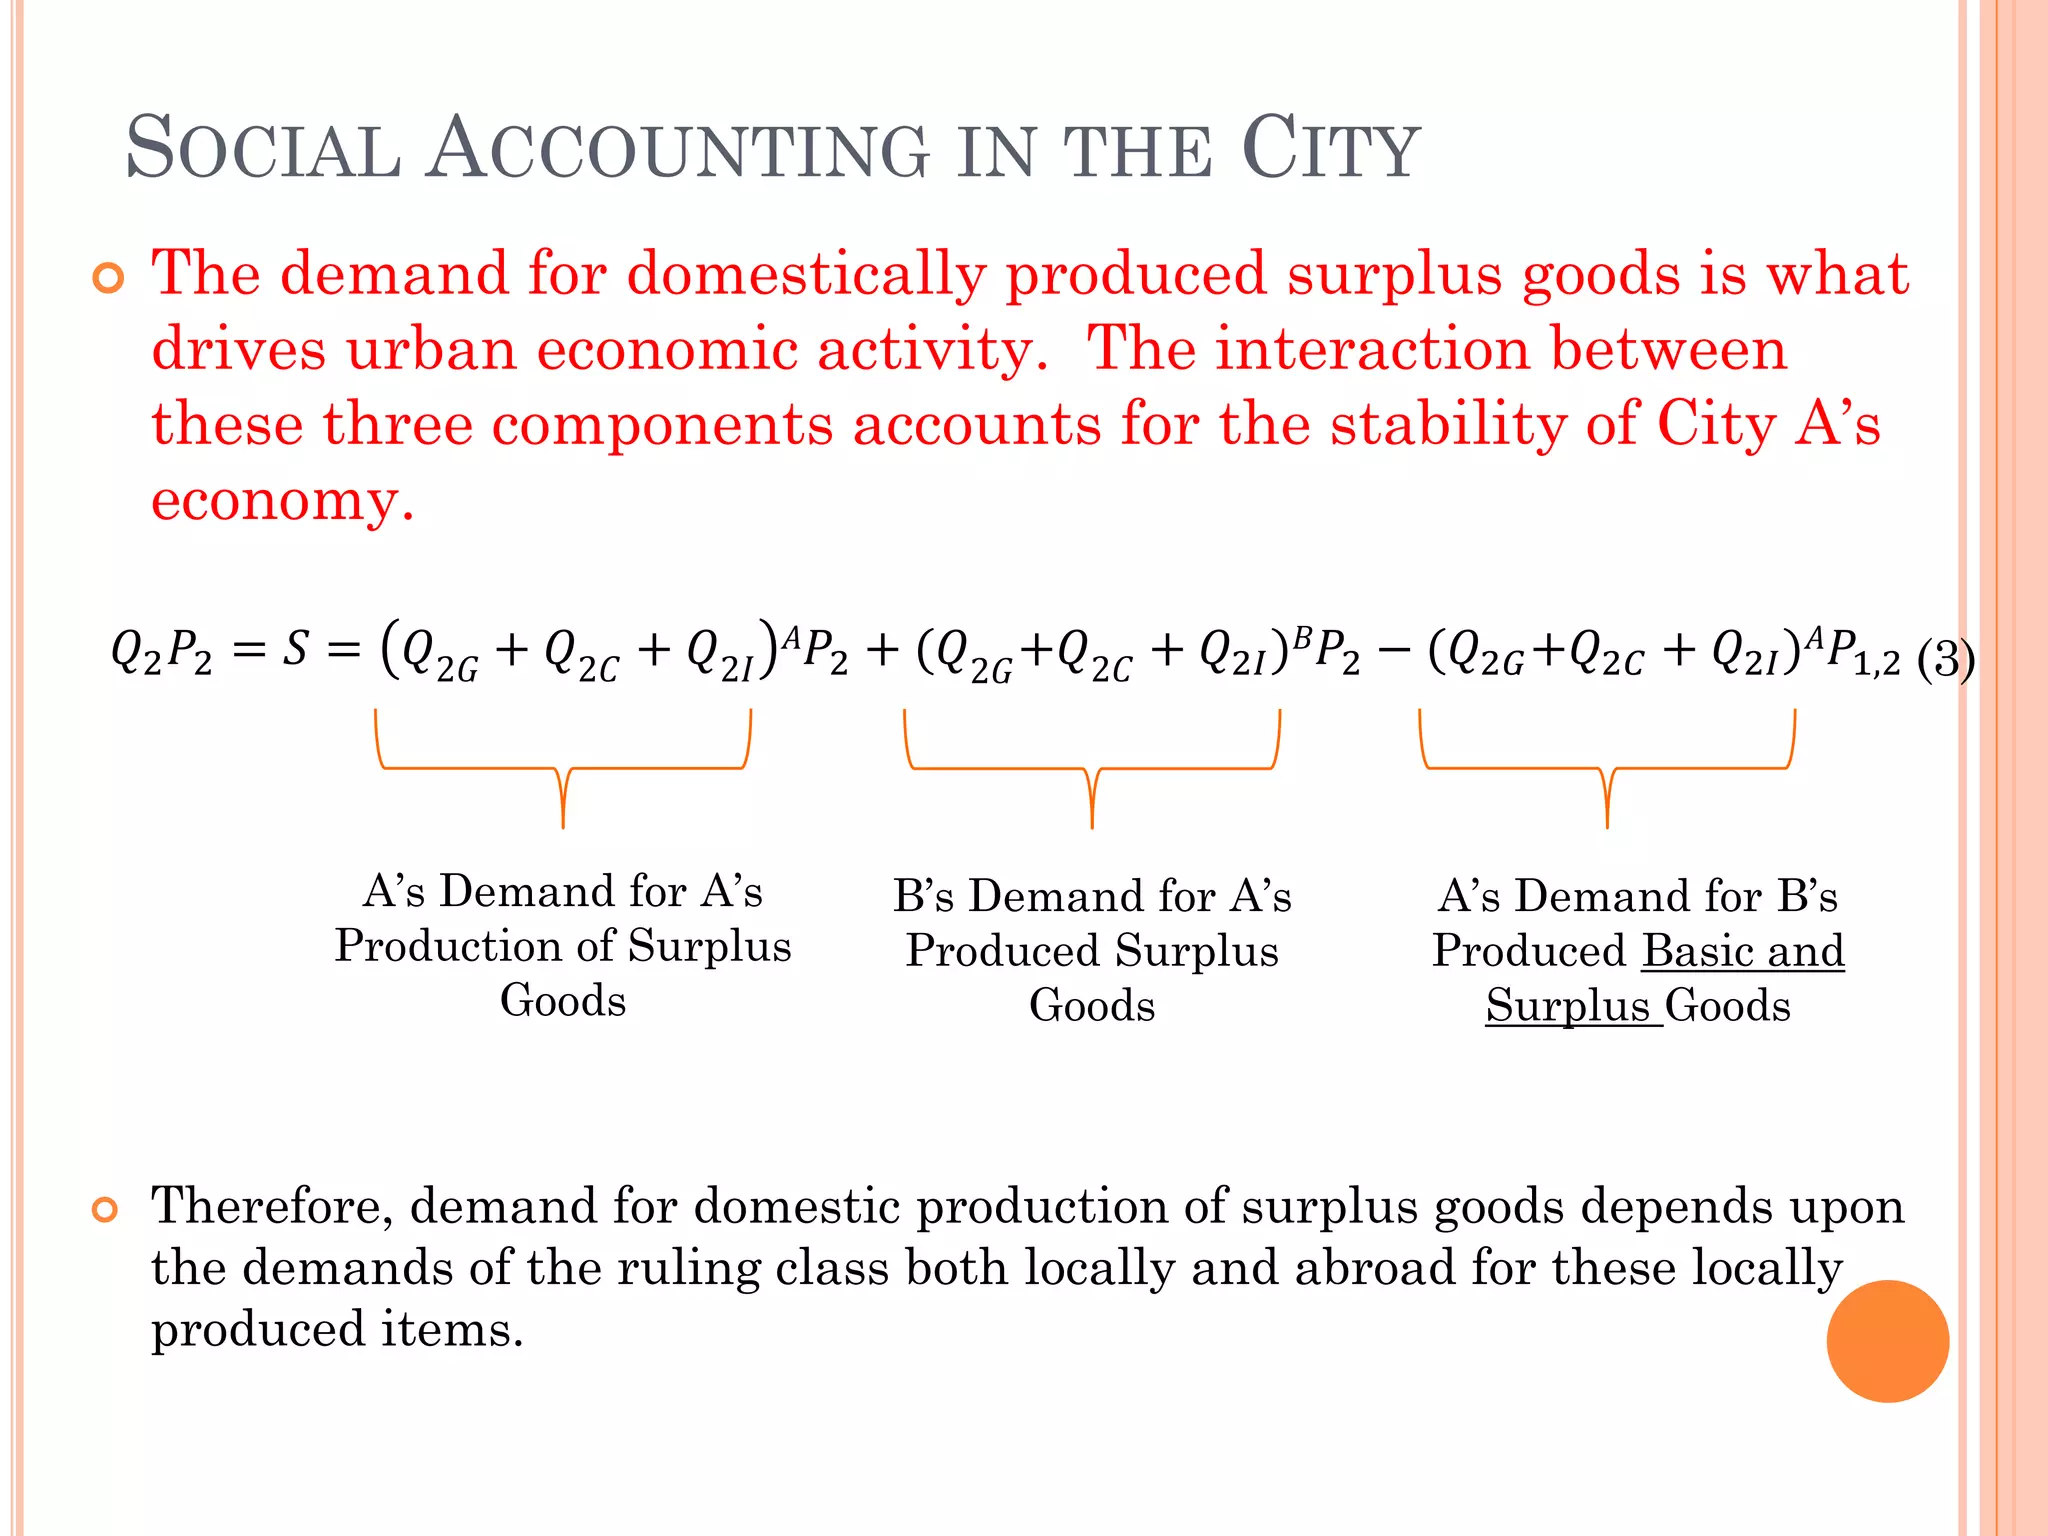
푄2푃2=푆=XB −MA+G (3)
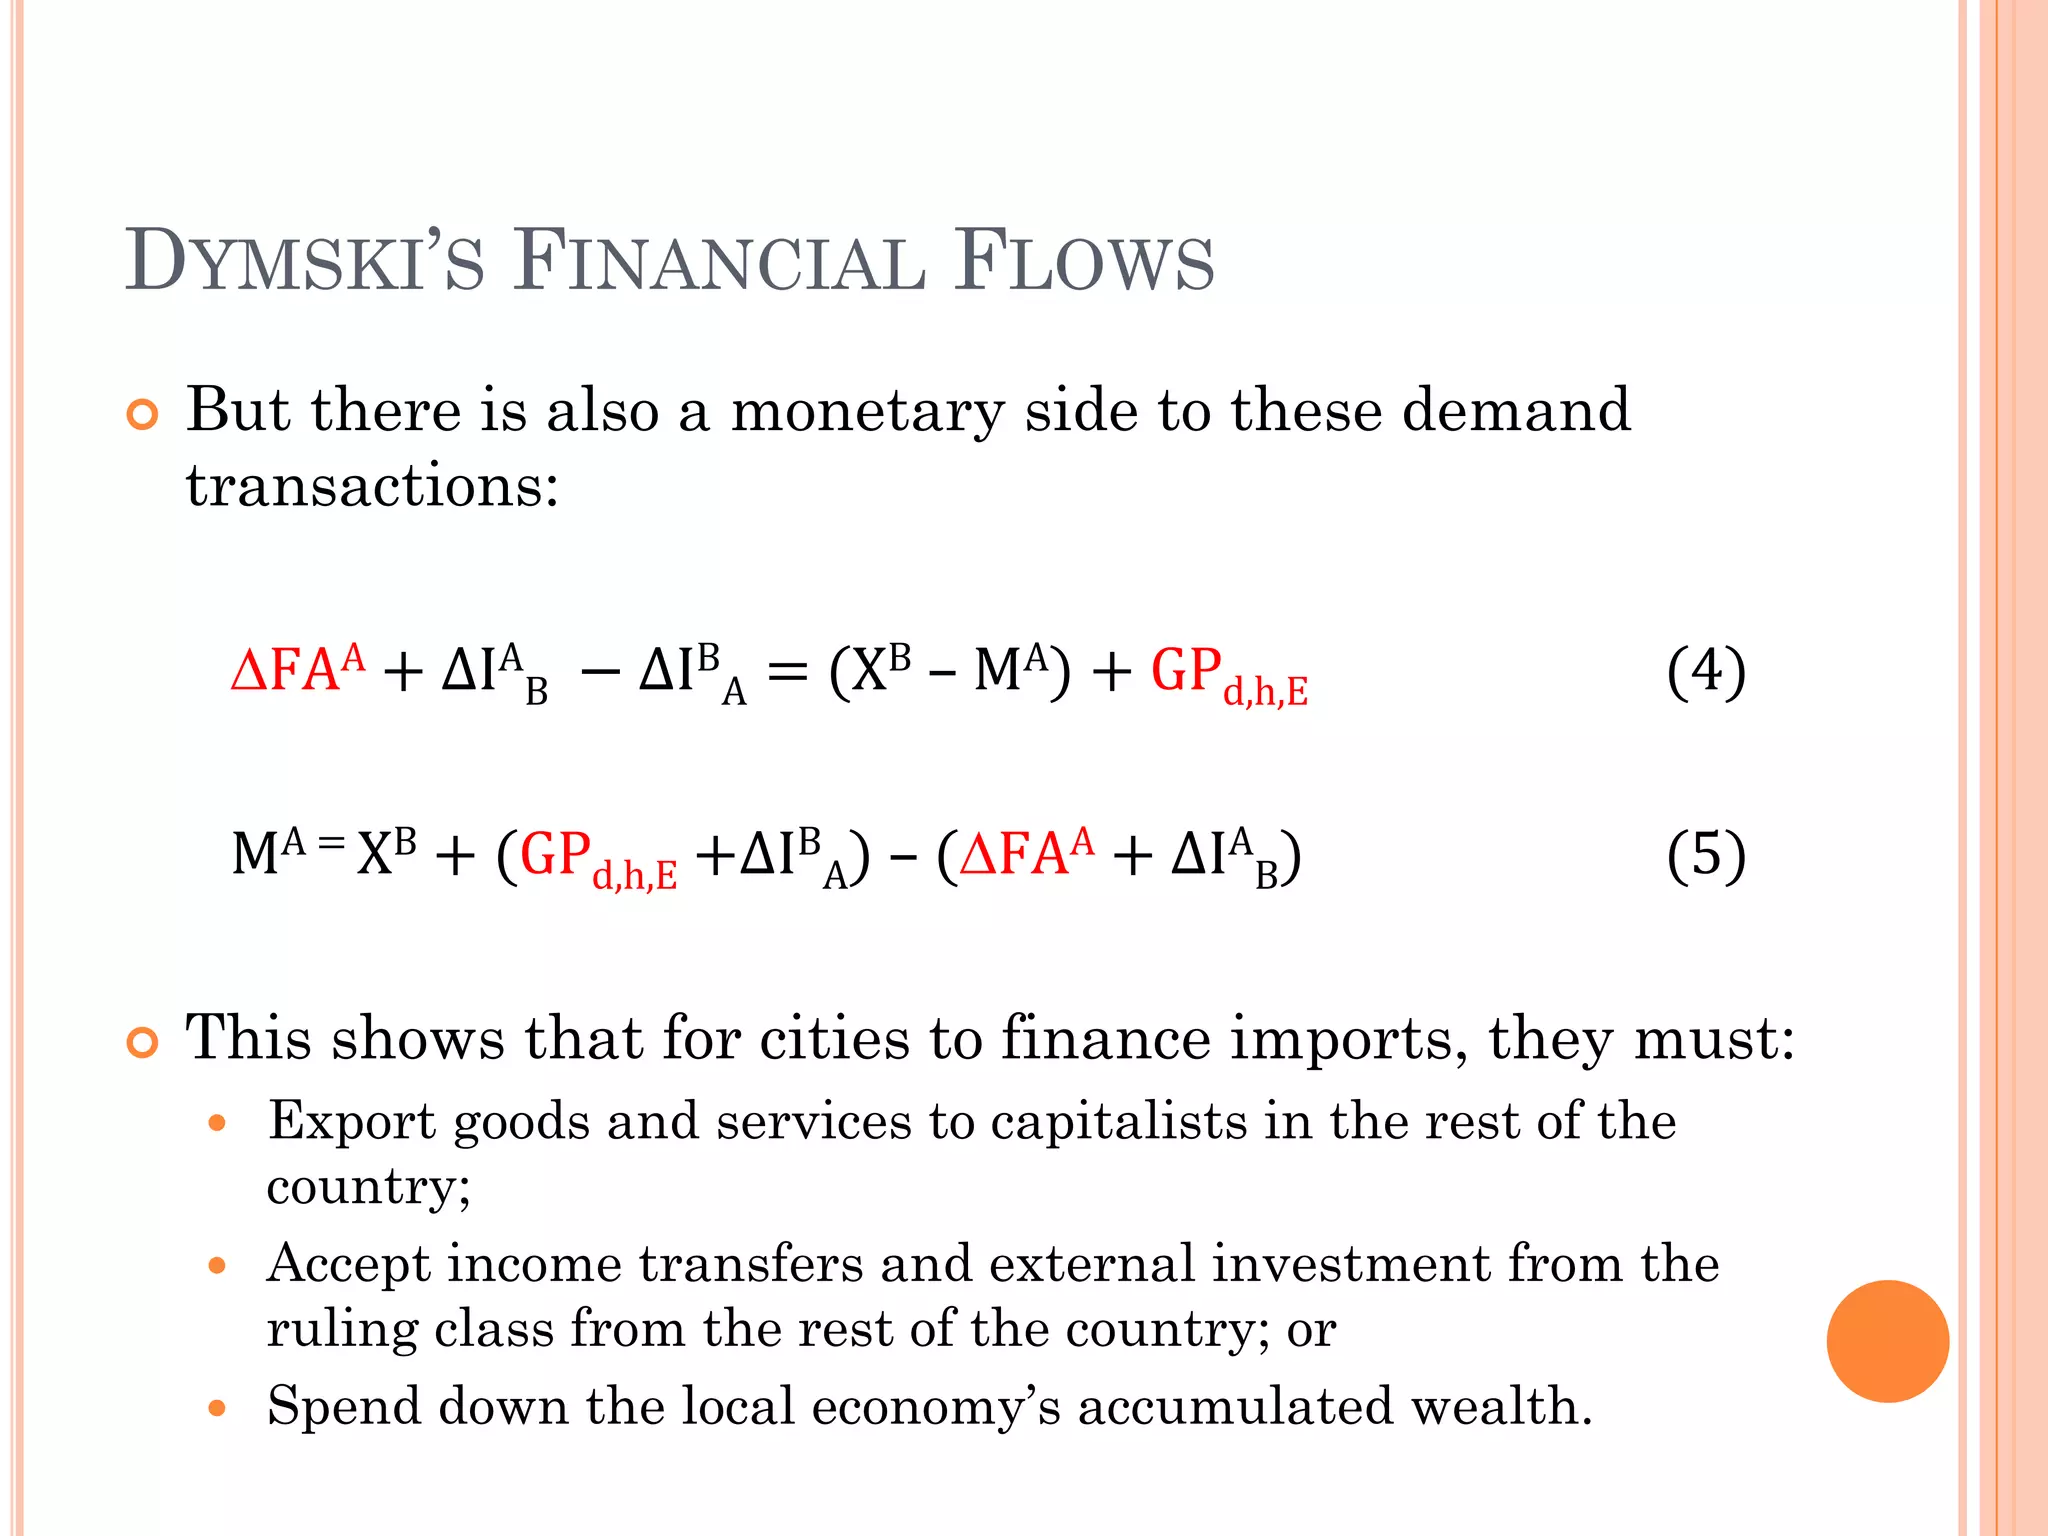
ΔFAA+ΔIAB −ΔIBA= (XB – MA) + GPd,h,E (4)
MA = XB + (GPd,h,E +IBA) – (FAA+IAB) (5)
푄1=[I-A11T]-1A21TS (6)
L* = 푙푇 1 [I-A11T]-1A21TS + 푙푇 1S + LBank (7)
Basic Goods
Surplus Goods
Urban Networks
Urban Trade Flow Condition
Dymski Condition
Output of Basic Goods
Employment Model](https://image.slidesharecdn.com/westberg-141015135732-conversion-gate02/75/TOWARDS-A-HETERODOX-THEORY-OF-THE-SPATIAL-ECONOMY-16-2048.jpg)


![FACTORS DRIVING SCHOOL CLOSURE:
2008-2009
Logistic regression Number of obs = 83760
Wald chi2(11) = 435.07
Prob > chi2 = 0.0000
Log pseudolikelihood = -4953.5763 Pseudo R2 = 0.1081
(Std. Err. adjusted for 12257 clusters in stid08)
------------------------------------------------------------------------------
| Robust
Closed | Odds Ratio Std. Err. z P>|z| [95% Conf. Interval]
-------------+----------------------------------------------------------------
fte08 | .9304691 .0046535 -14.41 0.000 .921393 .9396345***
titlei08 | .9625282 .100877 -0.36 0.716 .7837976 1.182015
chartr08 | .8487812 .1397205 -1.00 0.319 .6147192 1.171965
HISPPCT | 1.004919 .0020588 2.40 0.017 1.000892 1.008963**
BLACKPCT | 1.013971 .0017002 8.27 0.000 1.010644 1.017308***
ulocal1 | 1.063835 .22252 0.30 0.767 .7060415 1.602943
ulocal2 | .9826764 .2467171 -0.07 0.945 .6007619 1.60738
ulocal3 | 1.864095 .4264939 2.72 0.006 1.190469 2.918891***
ulocal4 | 1.103108 .1537998 0.70 0.482 .8393438 1.449759
ulocal7 | 1.197396 .217458 0.99 0.321 .8387868 1.709321
ulocal10 | .8191589 .1100281 -1.49 0.138 .6295585 1.06586
_cons | .0421768 .0053566 -24.93 0.000 .0328827 .0540978***
------------------------------------------------------------------------------
Smaller central cities ( < 100,000), slightly skewed toward minority
schools.](https://image.slidesharecdn.com/westberg-141015135732-conversion-gate02/75/TOWARDS-A-HETERODOX-THEORY-OF-THE-SPATIAL-ECONOMY-26-2048.jpg)
![FACTORS DRIVING SCHOOL
CONSTRUCTION: 2008-2009
Logistic regression Number of obs = 83760
Wald chi2(11) = 1045.97
Prob > chi2 = 0.0000
Log pseudolikelihood = -5647.5458 Pseudo R2 = 0.1176
(Std. Err. adjusted for 12257 clusters in stid08)
------------------------------------------------------------------------------
| Robust
New | Odds Ratio Std. Err. z P>|z| [95% Conf. Interval]
-------------+----------------------------------------------------------------
fte08 | .9720276 .0027112 -10.17 0.000 .9667282 .977356***
titlei08 | .3518723 .0323725 -11.35 0.000 .293815 .4214017***
chartr08 | 4.342266 .4338637 14.70 0.000 3.569993 5.281599***
HISPPCT | 1.016806 .0013472 12.58 0.000 1.014169 1.01945***
BLACKPCT | 1.013122 .0014065 9.39 0.000 1.010369 1.015882***
ulocal1 | 1.162444 .1453408 1.20 0.229 .9097997 1.485244
ulocal2 | .9936273 .1595202 -0.04 0.968 .7253854 1.361063
ulocal3 | .954336 .2535298 -0.18 0.860 .5669834 1.606321
ulocal4 | 1.076797 .1221828 0.65 0.514 .8620831 1.344989
ulocal7 | 1.137618 .2157903 0.68 0.497 .7843963 1.6499
ulocal10 | 2.996785 .2942182 11.18 0.000 2.472215 3.63266***
_cons | .020951 .0019555 -41.42 0.000 .0174485 .0251566
------------------------------------------------------------------------------
Non-federally funded through Title 1. Strong presence of Charter schools.
Located in rural areas within five miles of an urbanized area.](https://image.slidesharecdn.com/westberg-141015135732-conversion-gate02/75/TOWARDS-A-HETERODOX-THEORY-OF-THE-SPATIAL-ECONOMY-27-2048.jpg)
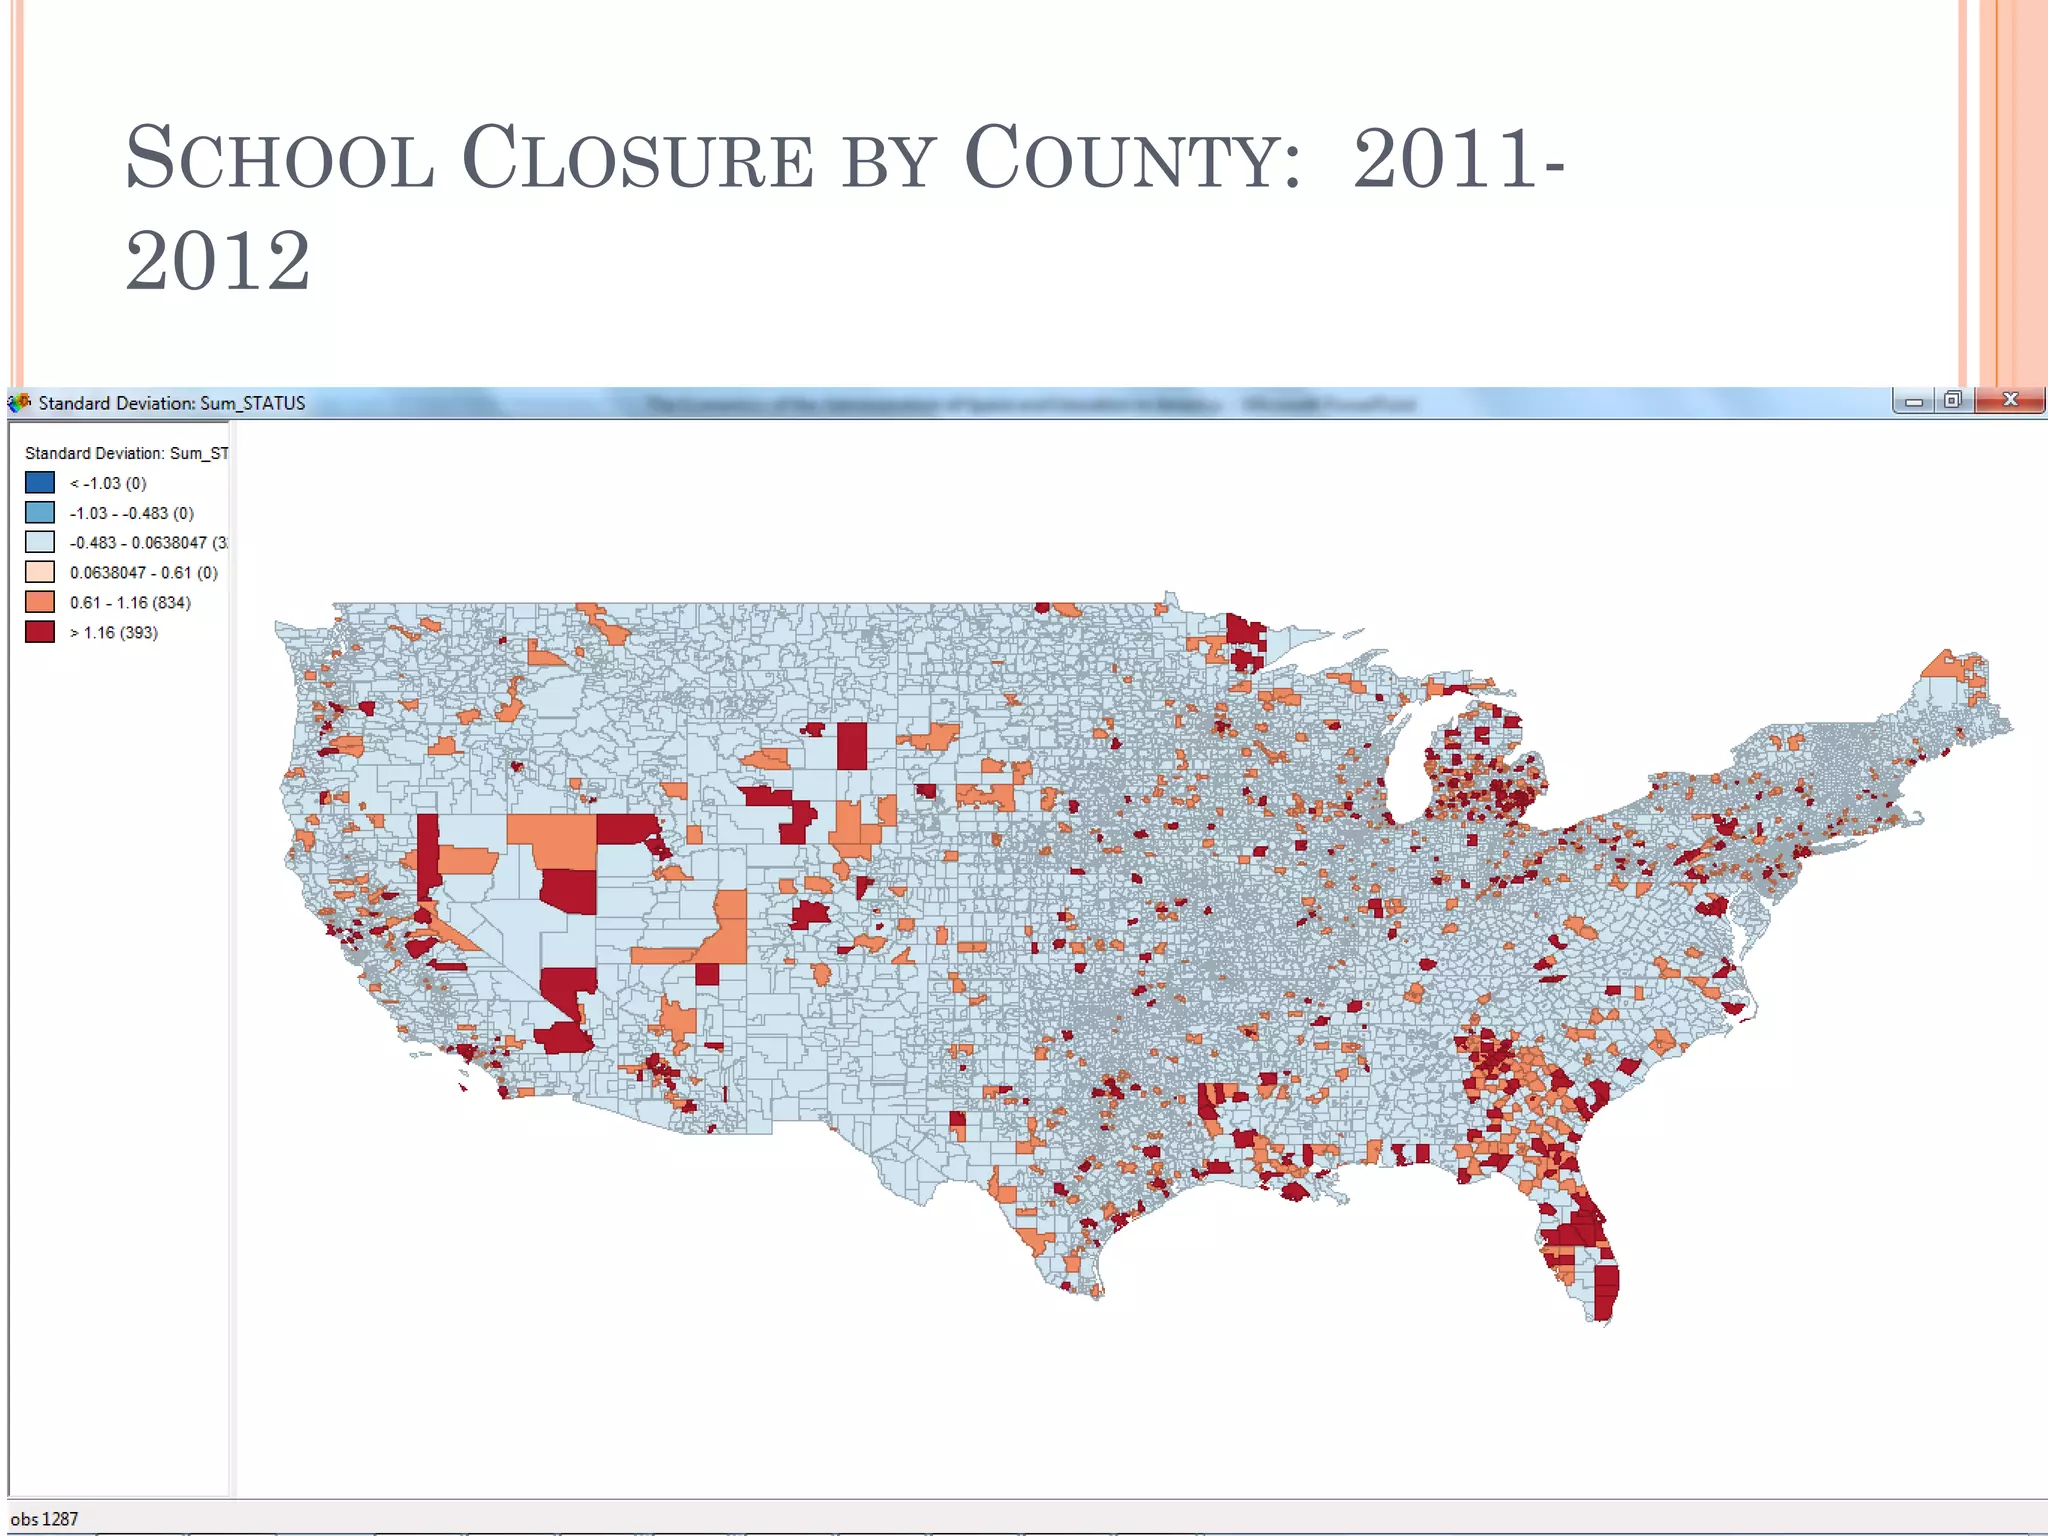
![FACTORS DRIVING SCHOOL CLOSURE: 2011-2012
Logistic regression Number of obs = 80917
Wald chi2(11) = 515.84
Prob > chi2 = 0.0000
Log pseudolikelihood = -5327.4963 Pseudo R2 = 0.1120
(Std. Err. adjusted for 12373 clusters in stid)
------------------------------------------------------------------------------
| Robust
Closed | Odds Ratio Std. Err. z P>|z| [95% Conf. Interval]
-------------+----------------------------------------------------------------
fte | .9277881 .0040424 -17.20 0.000 .919899 .9357449***
titlei | .9188991 .0804422 -0.97 0.334 .7740198 1.090897
chartr | 1.641101 .2209695 3.68 0.000 1.260444 2.136718***
HISPPCT | .9950249 .0023623 -2.10 0.036 .9904057 .9996657**
BLACKPCT | 1.01518 .0016256 9.41 0.000 1.011999 1.018371***
ulocal11 | 1.222924 .2442028 1.01 0.314 .8268464 1.80873
ulocal12 | 1.686955 .3008436 2.93 0.003 1.189335 2.392779***
ulocal13 | 1.188237 .1792946 1.14 0.253 .8840245 1.597137
ulocal21 | 1.014854 .1298852 0.12 0.908 .7897016 1.304199
ulocal31 | 1.086921 .275931 0.33 0.743 .6608572 1.787673
ulocal41 | 1.112418 .1326646 0.89 0.372 .8805533 1.405337
_cons | .0235065 .007057 -12.49 0.000 .013051 .0423381
------------------------------------------------------------------------------
Charter schools in the Urban Core of mid-sized Metros](https://image.slidesharecdn.com/westberg-141015135732-conversion-gate02/75/TOWARDS-A-HETERODOX-THEORY-OF-THE-SPATIAL-ECONOMY-28-2048.jpg)
![FACTORS DRIVING SCHOOL CONSTRUCTION:
2011-2012
Logistic regression Number of obs = 80917
Wald chi2(11) = 607.44
Prob > chi2 = 0.0000
Log pseudolikelihood = -3990.099 Pseudo R2 = 0.1402
(Std. Err. adjusted for 12373 clusters in stid)
------------------------------------------------------------------------------
| Robust
New | Odds Ratio Std. Err. z P>|z| [95% Conf. Interval]
-------------+----------------------------------------------------------------
fte | .9530533 .0043783 -10.47 0.000 .9445105 .9616733***
titlei | 2.400399 .2452979 8.57 0.000 1.964712 2.932704***
chartr | .2024001 .0249385 -12.97 0.000 .1589757 .2576859***
HISPPCT | 1.007996 .0021545 3.73 0.000 1.003782 1.012227***
BLACKPCT | 1.010103 .0016087 6.31 0.000 1.006955 1.01326***
ulocal11 | 1.665956 .272162 3.12 0.002 1.209499 2.294677***
ulocal12 | 1.379295 .2940517 1.51 0.131 .9082174 2.094714
ulocal13 | 1.358901 .22997 1.81 0.070 .9752975 1.893384
ulocal21 | 1.391157 .197376 2.33 0.020 1.053437 1.837147**
ulocal31 | 1.792355 .6017819 1.74 0.082 .928183 3.461101
ulocal41 | 2.317466 .3053464 6.38 0.000 1.790029 3.000313***
_cons | .0922707 .0269121 -8.17 0.000 .0520953 .1634289***
------------------------------------------------------------------------------
Title 1 funded schools in large urban centers and rural fringe.](https://image.slidesharecdn.com/westberg-141015135732-conversion-gate02/75/TOWARDS-A-HETERODOX-THEORY-OF-THE-SPATIAL-ECONOMY-29-2048.jpg)


