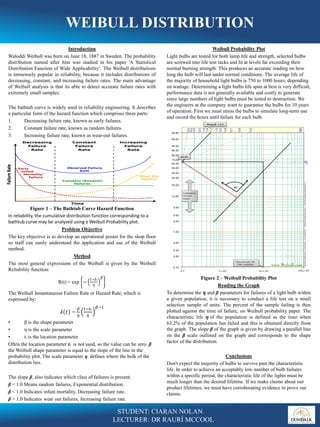
The document discusses using Weibull probability plots to analyze light bulb lifespan data. Engineers tested bulbs by stressing them beyond normal conditions to simulate long-term use and recorded failure times. A Weibull plot of the failure percentage against time shows the characteristic life (63.2% failure point) and shape factor. Conclusions note that to guarantee bulbs for 10 years, the characteristic life must be much longer than 10 years to keep failure rates acceptably low.