Download to read offline
![International Journal of Advances in Engineering & Technology, June, 2017.
©IJAET ISSN: 22311963
383 Vol. 10, Issue 3, pp. 383-389
STRUCTURAL RELIABILITY ASSESSMENT WITH
STOCHASTIC PARAMETERS
Biswajit Barman
Asst. Prof., Dept. of Civil Engineering,
Bengal College of Engineering &Technology, Durgapur, West Bengal, India.
ABSTRACT
The performance of a structure [23] is assessed by its safety [1], serviceability [1] and economy [1]. Since we
do not know the exact details of loads [4] acting on a structure at any time, there is always some uncertainty
about the total loads on structure. Thus random variables (means stochastic variable) of loads and other
parameters are the main criteria of design variables [18]. They vary with space and time. The input variables is
never certain and complete. The safety factor provided in the existing codes and standers primarily based on
practice, judgment and experience, may not be adequate and economical. Using the techniques presented
earlier, we can design or analyze individual members in the contest of structural reliability [2][3][22][24].
However we are not examined how the system performs [23] or how to calculate the reliability of the structure
as a whole.
KEYWORDS: Economy, Loads, Random Variables, Reliability, Stochastic, Safety, Uncertainty.
I. INTRODUCTION
The design parameters[21] of loading and load carrying capacities of structural members are not
deterministic[20] quantities, but variable quantities except dead load (i.e. self weight of structure).
Since we do not know the exact details of loads acting on a structure at any time, there is always some
uncertainty about the total loads on structure. Thus random variable of loads are the main criterion of
design variables. Hence safety of structure is uncertain. A reasonable safety level is always accepted
which recommends IS Code. When safety of structure becomes certain, there is zero probability of
failure[12]. It means that reducing the probability of failure is the increasing of reliability i.e.
structural safety[12] level.
II. PROBABILITY THEORY
Partially knowing about an event sometimes we make statements are probabilistic[8][15][19][20] in
nature, such as a child to born will be a son, or it may rain tomorrow, or India will win in a cricket
match, or a bus will arrive on time, and so on. Now questions may arise, what is the characteristic
feature in all the above phenomena? Answer is that they all lack a deterministic nature. The above
phenomena are random phenomena. In the deterministic study parameters, parameters may be
considered as a function of time (i.e. time variant). Similarly probabilistic study are time variant but in
some cases it is time variant (e.g. Wind load, earthquake load etc.). When a random variable assumes
values as a function of time the variable is called a stochastic variables
III. LITERATURE REVIEW
In the earlier days engineers were not confident to applying probability theory or evaluating of safety.
A master builder often tried to copy a successful structure. Heavy stone arches often had a
considerable safety reserve. Actually the procedure was essentially trial and error method. The first](https://image.slidesharecdn.com/12i39-ijaet1002236-v10-i3-pp383-389-170719095719/85/STRUCTURAL-RELIABILITY-ASSESSMENT-WITH-STOCHASTIC-PARAMETERS-1-320.jpg)
![International Journal of Advances in Engineering & Technology, June, 2017.
©IJAET ISSN: 22311963
383 Vol. 10, Issue 3, pp. 383-389
STRUCTURAL RELIABILITY ASSESSMENT WITH
STOCHASTIC PARAMETERS
Biswajit Barman
Asst. Prof., Dept. of Civil Engineering,
Bengal College of Engineering &Technology, Durgapur, West Bengal, India.
ABSTRACT
The performance of a structure [23] is assessed by its safety [1], serviceability [1] and economy [1]. Since we
do not know the exact details of loads [4] acting on a structure at any time, there is always some uncertainty
about the total loads on structure. Thus random variables (means stochastic variable) of loads and other
parameters are the main criteria of design variables [18]. They vary with space and time. The input variables is
never certain and complete. The safety factor provided in the existing codes and standers primarily based on
practice, judgment and experience, may not be adequate and economical. Using the techniques presented
earlier, we can design or analyze individual members in the contest of structural reliability [2][3][22][24].
However we are not examined how the system performs [23] or how to calculate the reliability of the structure
as a whole.
KEYWORDS: Economy, Loads, Random Variables, Reliability, Stochastic, Safety, Uncertainty.
I. INTRODUCTION
The design parameters[21] of loading and load carrying capacities of structural members are not
deterministic[20] quantities, but variable quantities except dead load (i.e. self weight of structure).
Since we do not know the exact details of loads acting on a structure at any time, there is always some
uncertainty about the total loads on structure. Thus random variable of loads are the main criterion of
design variables. Hence safety of structure is uncertain. A reasonable safety level is always accepted
which recommends IS Code. When safety of structure becomes certain, there is zero probability of
failure[12]. It means that reducing the probability of failure is the increasing of reliability i.e.
structural safety[12] level.
II. PROBABILITY THEORY
Partially knowing about an event sometimes we make statements are probabilistic[8][15][19][20] in
nature, such as a child to born will be a son, or it may rain tomorrow, or India will win in a cricket
match, or a bus will arrive on time, and so on. Now questions may arise, what is the characteristic
feature in all the above phenomena? Answer is that they all lack a deterministic nature. The above
phenomena are random phenomena. In the deterministic study parameters, parameters may be
considered as a function of time (i.e. time variant). Similarly probabilistic study are time variant but in
some cases it is time variant (e.g. Wind load, earthquake load etc.). When a random variable assumes
values as a function of time the variable is called a stochastic variables
III. LITERATURE REVIEW
In the earlier days engineers were not confident to applying probability theory or evaluating of safety.
A master builder often tried to copy a successful structure. Heavy stone arches often had a
considerable safety reserve. Actually the procedure was essentially trial and error method. The first](https://image.slidesharecdn.com/12i39-ijaet1002236-v10-i3-pp383-389-170719095719/75/STRUCTURAL-RELIABILITY-ASSESSMENT-WITH-STOCHASTIC-PARAMETERS-1-2048.jpg)
![International Journal of Advances in Engineering & Technology, June, 2017.
©IJAET ISSN: 22311963
384 Vol. 10, Issue 3, pp. 383-389
mathematical formulation of structural safety problem can be attributed to Mayer(1926),
Streletzki(1947). They recognized that load and resistance parameters are random variables and
therefore, for each structure, there is a finite probability of failure. It was further developed by
Freudenthal (1950)
Deepthi C. Epaarachchi et .al.(2002) develops a probabilistic model to estimate the probability of
structural collapse significant proportion of reinforced concrete Building structural failures occur
during construction Carper 1997 observe, a system failure will occur when the slab capacity in
flexure or shear is exceeded. Failure of shores or re-shore nonstructural element failure is not
considered a system failure unless it leads to structural failure of the slab. J.W. van de Lindt et
.al.(2004) develops a basic method to better estimate the effect of earthquake duration on structural
reliability using (1) an ultimate strength and a (2) low-cycle structural damage-based on limit state
function. This study is unique in that it allows variation in the peaks of the highly non-linear
structural response without actually performing time domain analyses, which are commonly
employed in earthquake engineering analysis. A simple measure was introduced and termed the
duration effect factor (DEFβ) and is defined as the slope of a best-fit line for multiple reliability
indices plotted against duration.
IV. OVERVIEW
PROBABILITY DENSITY FUNCTION (PDF):
For continuous random variables, the probability density function (PDF) is defined as the first
derivative of cumulative distribution function(CDF). The PDF [fx(x)] and the CDF [Fx (x)] for
continuous random variables are related as follows.
Standard deviation of random variable, ‘X.’ The standard deviation of X is defined as the positive
square root of the variance:
σx =√ σx
2
The non dimensional co-efficient of variation Vx, is defined as the standard deviation divided by the
mean
Vx = σx/µx
This parameter is always taken to be positive by convention even through the mean may be negative.
An important relationship existing among the mean, variance, and second moment of a random
variable X:
σx
2
=[E (X2
) - µx
2
]
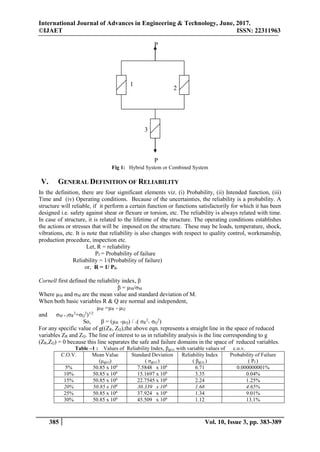
HYBRID SYSTEM ORCOMBINEDSYSTEM
Many structures can be considered as a combination of series and parallel systems. Such systems are
referred to as hybrid or combined systems. The following figure is a schematic of a hybrid system in
which elements 1 and 2 are in parallel, and the combination of 1 and 2 is in series with element 3.](https://image.slidesharecdn.com/12i39-ijaet1002236-v10-i3-pp383-389-170719095719/85/STRUCTURAL-RELIABILITY-ASSESSMENT-WITH-STOCHASTIC-PARAMETERS-2-320.jpg)
![International Journal of Advances in Engineering & Technology, June, 2017.
©IJAET ISSN: 22311963
388 Vol. 10, Issue 3, pp. 383-389
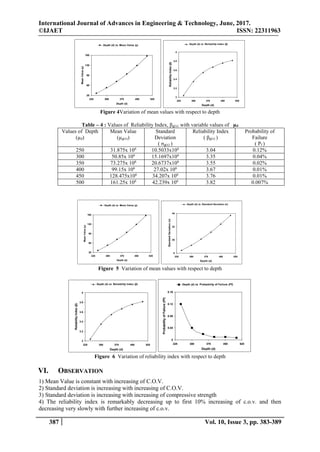
VII. CONCLUSION
The results are the nature of variation are consistent with result obtained by Schueremans (Int.
conf.,Canada, 1999) The decreasing safety index is found to be remarkably more after certain level
of load and uncertainty(instead of a straight line) variation. Hence sensitivity of reliability index is
widely varying depending on the uncertainty and parametric values. Hence extrapolating of reliability
index without knowing its variation is dangerous.
Future Scope of Work: To incorporate different types of uncertainty
Application on realistic structures, e.g. building frame under seismic excitation.
REFERENCES
[1]Allen, J. K., Krishnamachari, R. S., Masseta, J., Pearce, D., Rigby, D., and Mistree, F. (1992). “Fuzzy
Compromise: An Effective Way to Solve Hierarchical Design Problems.”Structural Optimization, 4, 115-120.
[2]Akgül, F., and Frangopol, D. M. (2003). “Rating and reliability of existing bridges in a network.”J. Bridge
Eng., 8(6), 383–393.
[3]Akgül, F., and Frangopol, D. M. (2004). “Computational platform for predicting lifetime system reliability
profiles for different structure types in a network,”J. Comput. Civ. Eng., 18(2), 92–104
[4]Bommer, J. J., and Mendis, R.(2005). “Scaling of spectral displacement ordinates with damping ratios.”
Earthquake Eng. Struct. Dyn., 34(2), 145–165.
[5]Chan, C. M., and Zou, X. K. (2004). “Elastic and inelastic drift performance optimization for reinforced
concrete building under earthquake loads.”Earthquake Eng. Struct. Dyn., 33(8), 929–950.
[6]Cheng, F. Y., and Li, D. _1996_. “Multiobjective optimization of structures with and without control.”J.
Guid. Control Dyn., 19(2), 393–397.
[7]Chopra, A. K., and Goel, R. K. (2002). “A modal pushover analysis procedure for estimating seismic
demands for buildings.” EarthquakeEng. Struct. Dyn., 31(3), 561–582
[8]Chen, Q., Nikolaidis, E., Cudney, H., Rosca, R., and Haftka, R. T. (1998). “Comparison of Probabilistic and
Fuzzy Set-Based Methods for Designing under Uncertainty,” 40 th AIAA/ASME/ASCE/AHS/ASC Structures,
Structural Dynamics, and Materials Conference and Exhibit, St. Louis, MO, 2860-2874.
[9]Das, P. C. (1999). “Prioritization of bridge maintenance needs.”Case studies in optimal design and
maintenance planning of civil infrastructure systems, D. M. Frangopol, ed., ASCE, Reston, Va., 26–44.
[10]Elseifi, M., A., Gurdal, Z., and Nikolaidis, E. (1999). “Convex and Probabilistic Models of Uncertainties in
Geometric Imperfections of Stiffened Composite Panels.” AIAA Journal, 37(4), 468-474.
[11]French, S. (1986). Decision theory: An introduction to the Mathematics of Rationality, Ellis Horwood Ltd.,
Chichester.
[12]Frangopol, D. M. (1997). “Application of life-cycle risk-based criteria to bridge assessment and design.”
Safety of bridges, P. C. Das, ed., Thomas Telford, London, 151–157.
[13]Frangopol, D. M. (1999). “Chapter 9: Life-cycle cost analysis for bridges.”Bridge safety and reliability, D.
M. Frangopol, ed., ASCE, Reston, Va., 210–236.
[14]Giles, R. (1982). “Foundations for a Theory of Possibility.” Fuzzy Information and Decision Processes,
North-Holland.
[15]Gao, X. W., and Bao, A. B. (1985). “Probabilistic model and its statistical parameters for seismic load.”
Earthquake Eng. Eng. Vibration, 5(1), 13–22.
[16]Klir, G. J., and Yuan, B. (1995). "Fuzzy Sets and Fuzzy Logic-Theory and Applications", Prentice Hall,
Upper Saddle River.
[17]Li, G. _1998_. “Reliability and performance based optimal design for seismic high-rising structures.”
Ph.D. dissertation, Dalian Univ. of Technology, China.
[18]Lee, S. H., Min, K. W., Hwang, J. S., and Kim, J. (2004). “Evaluation of equivalent damping ratio of a
structure with added dampers.”Eng. Struct., 26(3), 335–346.
[19]Maglaras, G., Nikolaidis, E., Haftka, R. T., and Cudney, H. H. (1997). “Analytical-Experimental
Comparison of Probabilistic Methods and Fuzzy-Set based Methods for Designing under Uncertainty.”
Structural Optimization, 13(2-3), 69-80.
[20]Maglaras, G., Ponslet, P., Haftka, R. T., Nikolaidis, E., Sensharma, P., and Cudney, H. H. (1996).
“Analytical and Experimental Comparison of Probabilistic and Deterministic Optimization.” AIAA Journal,
34(7), 1512-1518.
[21]Nikolaidis, E., Chen, Q., and Cudney, H. (1999). “Comparison of Bayesian and Possibility-based Methods
for Design Under Uncertainty.” 13th ASCEEngineering Mechanics Division Conference, ASCE, Baltimore,
Maryland.](https://image.slidesharecdn.com/12i39-ijaet1002236-v10-i3-pp383-389-170719095719/85/STRUCTURAL-RELIABILITY-ASSESSMENT-WITH-STOCHASTIC-PARAMETERS-6-320.jpg)
![International Journal of Advances in Engineering & Technology, June, 2017.
©IJAET ISSN: 22311963
389 Vol. 10, Issue 3, pp. 383-389
[22]Nikolaidis, E., Hernandez, R. R., and Maglaras, G. (1995) “Comparison of Methods for Reliability
Assessment under Incomplete Information.”AIAA/ ASME/ ASCE/ AHS/ ASC, 36th Structures, Structural
Dynamics and Materials Conference, 1346-1353.
[23]Structural Engineers Association of California (SEAOC). (1995). Vision 2000, "performance based seismic
engineering of buildings". Part 2: Conceptual framework, Sacramento, Calif.
[24]Thoft-Christensen, P., Jensen, F. M., Middleton, C. R., and Blackmore, A. (1997). “Assessment of the
reliability of concrete slab bridges. Reliabilityand optimization of structural systems", D. M. Frangopol, R. B.
[25]Wen, Y. K., and Kang, Y. J. (2001). “Minimum building life-cycle cost design criteria. I: Methodology.” J.
Struct. Eng., 127(3), 330–337.
[26]Zou, X. K., and Chan, C. M. (2005a). “An optimal resizing technique for seismic drift design of concrete
buildings subjected to response spectrum and time history loadings.”Comput. Struct., 83, 1689–1704.
SAMPLE AUTHORS BIOGRAPHY
BISWAJIT BARMAN, was born in MALDA, West Bengal, India ,in the Year. 8th
January
1964. Passed BE(Civil Engg.) from Jalpaiguri Govt. Engg. College, Jalpaiguri under the
University of North Bengal in 1989. And passed ME(in Structure) from BESU, Shibpur,
Howrahin the year 2008 Presently I am working as an Asst. Prof. in CE Dept. at MCET,
Berhampur, Murshidabad West Bengal, India and try to complete my Ph. D. Work from NIT
Durgapur.](https://image.slidesharecdn.com/12i39-ijaet1002236-v10-i3-pp383-389-170719095719/85/STRUCTURAL-RELIABILITY-ASSESSMENT-WITH-STOCHASTIC-PARAMETERS-7-320.jpg)

The document discusses structural reliability assessment using stochastic parameters, emphasizing the uncertainty in loads acting on structures and the importance of random variables in design. It highlights the inadequacy of existing safety factors derived from practice and judgment in ensuring economic and safe structural performance. The study introduces mathematical formulations for reliability, summarizing various research findings in probability theory related to structural safety and proposing future work to apply different uncertainties in realistic structures.