Download to read offline
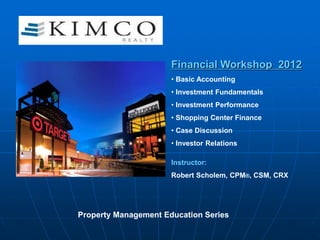

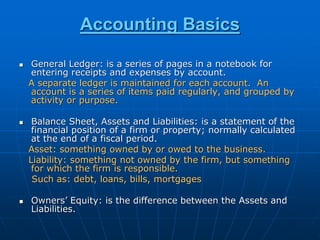
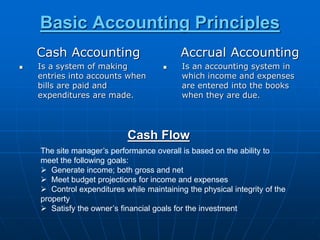
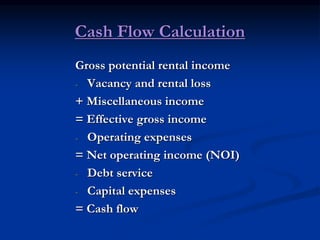
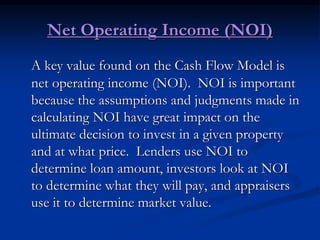
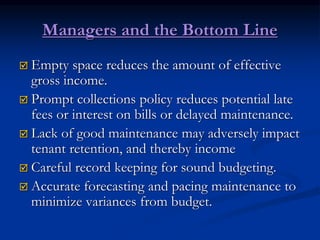
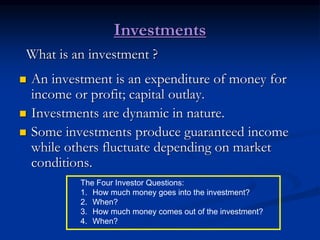
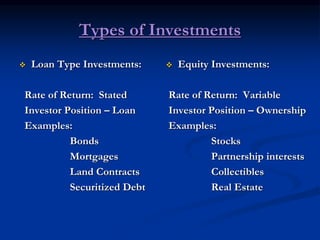
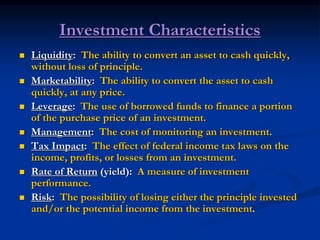
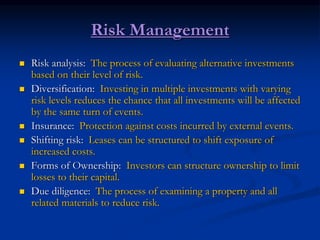
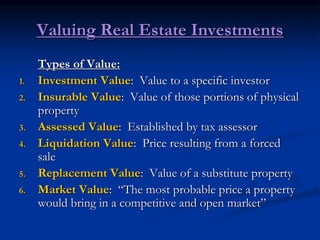
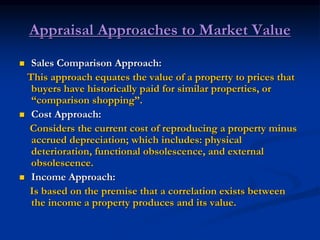
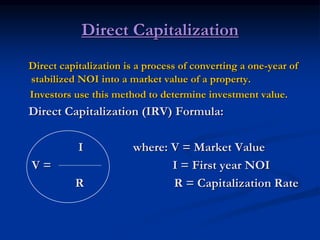
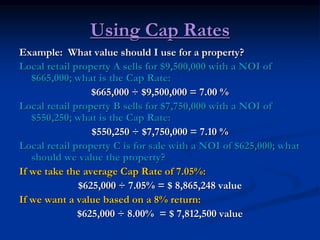
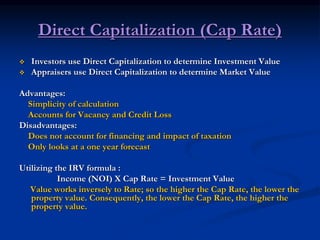
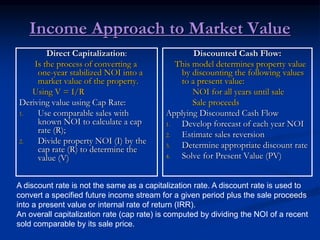
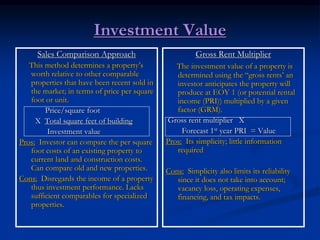
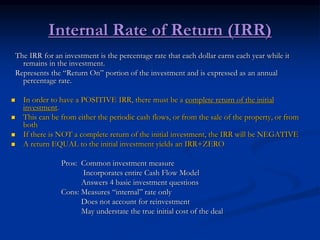
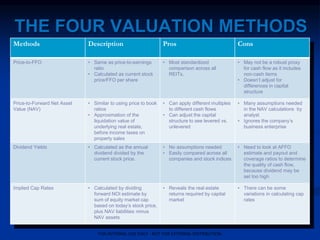
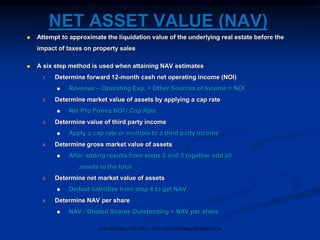
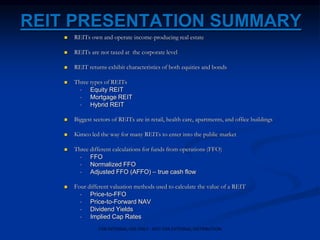


The document summarizes key topics from a financial workshop, including basic accounting principles, investment fundamentals, and commercial real estate finance concepts. It covers accounting ledgers and financial statements, cash flow analysis, net operating income, investment characteristics, appraisal approaches, capitalization rates, and methods for determining investment value.


