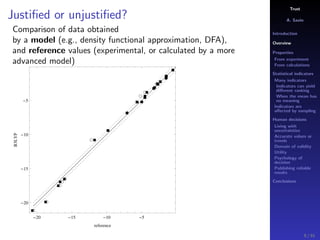
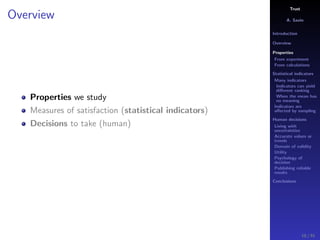
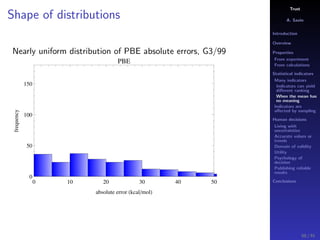
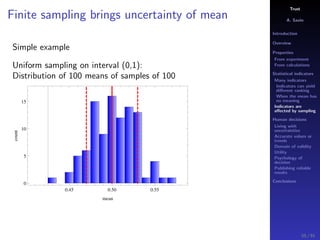
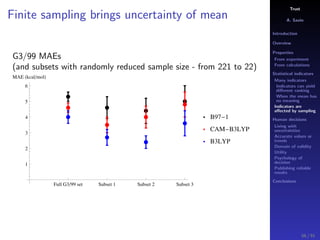
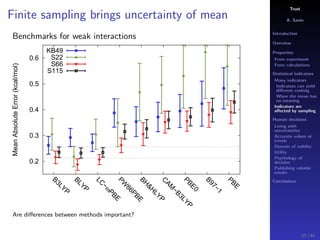
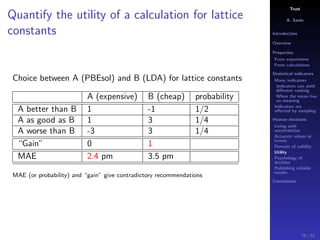
Trust
A. Savin
Introduction
Overview
Properties
From experiment
From calculations
Statistical indicators
Many indicators
Indicators can yield
different ranking
When the mean has
no meaning
Indicators are
affected by sampling
Human decisions
Living with
uncertainties
Accurate values or
trends
Domain of validity
Utility
Psychology of
decision
Publishing reliable
results
Conclusions
Most take things upon trust
Bartolomeo Civalleri1
, Roberto Dovesi1
, Erin R. Johnson3
,
Pascal Pernot 4
, Davide Presti2
, Andreas Savin5
1
Department of Chemistry and NIS Centre of Excellence
University of Torino (Italy)
2
Department of Chemical and Geological Sciences and INSTM research unit
University of Modena and Reggio-Emilia, Modena (Italy)
3
Chemistry and Chemical Biology, School of Natural Sciences
University of California, Merced (USA)
4
Laboratoire de Chimie Physique d’Orsay
Universit´e Paris-Sud (France)
5
Laboratoire de Chimie Th´eorique
CNRS and Sorbonne University UPMC Univ Paris 6 (France)
Winterschool on Computational Chemistry 2015
1 / 91
Trust
A. Savin
Introduction
Overview
Properties
From experiment
From calculations
Statistical indicators
Many indicators
Indicators can yield
different ranking
When the mean has
no meaning
Indicators are
affected by sampling
Human decisions
Living with
uncertainties
Accurate values or
trends
Domain of validity
Utility
Psychology of
decision
Publishing reliable
results
Conclusions
Most take things upon trust
... some (and those of the most) taking
things upon trust, misemploy their power of
assent ...
John Locke
2 / 91
Trust
A. Savin
Introduction
Overview
Properties
From experiment
From calculations
Statistical indicators
Many indicators
Indicators can yield
different ranking
When the mean has
no meaning
Indicators are
affected by sampling
Human decisions
Living with
uncertainties
Accurate values or
trends
Domain of validity
Utility
Psychology of
decision
Publishing reliable
results
Conclusions
Success of benchmarks
Quantifying experience
0
50
100
150
200
250
300
1993 1998 2003 2008 2013
0
2000
4000
6000
8000
10000
12000
Numberofpublications
Numberofcitations
Year
publications
citations
3 / 91
Trust
A. Savin
Introduction
Overview
Properties
From experiment
From calculations
Statistical indicators
Many indicators
Indicators can yield
different ranking
When the mean has
no meaning
Indicators are
affected by sampling
Human decisions
Living with
uncertainties
Accurate values or
trends
Domain of validity
Utility
Psychology of
decision
Publishing reliable
results
Conclusions
What this talk is about: statistics
Dealing with a large amount of numbers:
efficient algorithms
performant computers
new methods, e.g., DFT
Statistical methods used to concentrate information
largely used in environmental sciences, medicine, finance, ....
very useful
pitfalls
In spite of mathematical rigor, using statistical indicators does not
avoid human decision.
4 / 91
Trust
A. Savin
Introduction
Overview
Properties
From experiment
From calculations
Statistical indicators
Many indicators
Indicators can yield
different ranking
When the mean has
no meaning
Indicators are
affected by sampling
Human decisions
Living with
uncertainties
Accurate values or
trends
Domain of validity
Utility
Psychology of
decision
Publishing reliable
results
Conclusions
Predicting with or without understanding
Physical models with systematic improvement:
understanding
Improvement can be seen with optimism
Limitations:
cost and time
absence of rigorous bounds
Statistical models (correlations):
without knowing the underlying cause
Legitimate when used with necessary care
Limitations:
Choice of quantities (properties) entering the model
Statistical treatment
Conclusions drawn
5 / 91
Trust
A. Savin
Introduction
Overview
Properties
From experiment
From calculations
Statistical indicators
Many indicators
Indicators can yield
different ranking
When the mean has
no meaning
Indicators are
affected by sampling
Human decisions
Living with
uncertainties
Accurate values or
trends
Domain of validity
Utility
Psychology of
decision
Publishing reliable
results
Conclusions
Overview
Properties (quantities) analyzed
Quality of approximation (model)
Decisions to take (human)
(How do the preceding points affect the design of methods?)
6 / 91
Trust
A. Savin
Introduction
Overview
Properties
From experiment
From calculations
Statistical indicators
Many indicators
Indicators can yield
different ranking
When the mean has
no meaning
Indicators are
affected by sampling
Human decisions
Living with
uncertainties
Accurate values or
trends
Domain of validity
Utility
Psychology of
decision
Publishing reliable
results
Conclusions
Unjustified correlations
Happiness(t) = w0 + w1
t
j=1
γ
t−j
CRj + w2
t
j=1
γ
t−j
EVj + w3
t
j=1
γ
t−j
RPEj
R.B. Rutledge et al, PNAS 2014
Was happiness properly
defined?
Were the factors
determining it properly
chosen?
How is the agreement of
the data with the model?
Do we learn how to get
happier?
7 / 91
Trust
A. Savin
Introduction
Overview
Properties
From experiment
From calculations
Statistical indicators
Many indicators
Indicators can yield
different ranking
When the mean has
no meaning
Indicators are
affected by sampling
Human decisions
Living with
uncertainties
Accurate values or
trends
Domain of validity
Utility
Psychology of
decision
Publishing reliable
results
Conclusions
Justified correlations: predicting without
understanding
Captain James Cook forced his crew to eat sauerkraut, without
knowing that lack of vitamin C produces scurvy.
Properties: sauerkraut (containing vitamin C) and number of
sailors getting scurvy
Agreement: very good (although no statistics)
Acting: Cook acted, and avoided scurvy
8 / 91
Trust
A. Savin
Introduction
Overview
Properties
From experiment
From calculations
Statistical indicators
Many indicators
Indicators can yield
different ranking
When the mean has
no meaning
Indicators are
affected by sampling
Human decisions
Living with
uncertainties
Accurate values or
trends
Domain of validity
Utility
Psychology of
decision
Publishing reliable
results
Conclusions
Justified or unjustified?
Comparison of data obtained
by a model (e.g., density functional approximation, DFA),
and reference values (experimental, or calculated by a more
advanced model)
20 15 10 5
20
15
10
5
reference
B3LYP
9 / 91
Trust
A. Savin
Introduction
Overview
Properties
From experiment
From calculations
Statistical indicators
Many indicators
Indicators can yield
different ranking
When the mean has
no meaning
Indicators are
affected by sampling
Human decisions
Living with
uncertainties
Accurate values or
trends
Domain of validity
Utility
Psychology of
decision
Publishing reliable
results
Conclusions
Overview
Properties we study
Measures of satisfaction (statistical indicators)
Decisions to take (human)
10 / 91
Trust
A. Savin
Introduction
Overview
Properties
From experiment
From calculations
Statistical indicators
Many indicators
Indicators can yield
different ranking
When the mean has
no meaning
Indicators are
affected by sampling
Human decisions
Living with
uncertainties
Accurate values or
trends
Domain of validity
Utility
Psychology of
decision
Publishing reliable
results
Conclusions
Origin of properties
Do we get properties we need
from experiment?
from calculations?
11 / 91
Trust
A. Savin
Introduction
Overview
Properties
From experiment
From calculations
Statistical indicators
Many indicators
Indicators can yield
different ranking
When the mean has
no meaning
Indicators are
affected by sampling
Human decisions
Living with
uncertainties
Accurate values or
trends
Domain of validity
Utility
Psychology of
decision
Publishing reliable
results
Conclusions
Reference data from experiment
Do we get properties from experimental data?
Error bars
Corrections
Models used to analyze the data
12 / 91
Trust
A. Savin
Introduction
Overview
Properties
From experiment
From calculations
Statistical indicators
Many indicators
Indicators can yield
different ranking
When the mean has
no meaning
Indicators are
affected by sampling
Human decisions
Living with
uncertainties
Accurate values or
trends
Domain of validity
Utility
Psychology of
decision
Publishing reliable
results
Conclusions
Error bars
13 / 91
Trust
A. Savin
Introduction
Overview
Properties
From experiment
From calculations
Statistical indicators
Many indicators
Indicators can yield
different ranking
When the mean has
no meaning
Indicators are
affected by sampling
Human decisions
Living with
uncertainties
Accurate values or
trends
Domain of validity
Utility
Psychology of
decision
Publishing reliable
results
Conclusions
Is 1 kcal/mol chemical accuracy?
Results for the G1 set (atomization energies for 55 molecules)
The experimental data reported here are taken from a combination of NIST-JANAF
tables and Huber and Herzberg, ...
Most experimental errors are small, i.e., < 0.5 kcal/mol, although several are somewhat
larger, e.g., CS has an experimental error of 6 kcal/mol. ..
For several species experimental errors are unavailable.
J.C. Grossman, 2002
14 / 91
Trust
A. Savin
Introduction
Overview
Properties
From experiment
From calculations
Statistical indicators
Many indicators
Indicators can yield
different ranking
When the mean has
no meaning
Indicators are
affected by sampling
Human decisions
Living with
uncertainties
Accurate values or
trends
Domain of validity
Utility
Psychology of
decision
Publishing reliable
results
Conclusions
Is 1 kcal/mol chemical accuracy?
Results for the G1 set (atomization energies for 55 molecules)
The experimental data reported here are taken from a combination of NIST-JANAF
tables and Huber and Herzberg, ...
Most experimental errors are small, i.e., < 0.5 kcal/mol, although several are somewhat
larger, e.g., CS has an experimental error of 6 kcal/mol. ..
For several species experimental errors are unavailable.
J.C. Grossman, 2002
Difficulty to extract experimental error bars from published data
Cf. J. Cioslowski et al, 2000
14 / 91
Trust
A. Savin
Introduction
Overview
Properties
From experiment
From calculations
Statistical indicators
Many indicators
Indicators can yield
different ranking
When the mean has
no meaning
Indicators are
affected by sampling
Human decisions
Living with
uncertainties
Accurate values or
trends
Domain of validity
Utility
Psychology of
decision
Publishing reliable
results
Conclusions
Corrections to experimental data
15 / 91
Trust
A. Savin
Introduction
Overview
Properties
From experiment
From calculations
Statistical indicators
Many indicators
Indicators can yield
different ranking
When the mean has
no meaning
Indicators are
affected by sampling
Human decisions
Living with
uncertainties
Accurate values or
trends
Domain of validity
Utility
Psychology of
decision
Publishing reliable
results
Conclusions
Temperature dependence of lattice constants
Lattice constants measured to 5 significant digits
How many digits at 0 K? Hebstein, Acta Cryst B 2000
16 / 91
Trust
A. Savin
Introduction
Overview
Properties
From experiment
From calculations
Statistical indicators
Many indicators
Indicators can yield
different ranking
When the mean has
no meaning
Indicators are
affected by sampling
Human decisions
Living with
uncertainties
Accurate values or
trends
Domain of validity
Utility
Psychology of
decision
Publishing reliable
results
Conclusions
Models behind experimental data
17 / 91
Trust
A. Savin
Introduction
Overview
Properties
From experiment
From calculations
Statistical indicators
Many indicators
Indicators can yield
different ranking
When the mean has
no meaning
Indicators are
affected by sampling
Human decisions
Living with
uncertainties
Accurate values or
trends
Domain of validity
Utility
Psychology of
decision
Publishing reliable
results
Conclusions
Fundamental band gaps
R. T. Poole, J. G. Jenkin, J. Liesegang, R. C. Leckey
Phys. Rev. B 11, 5679, 1975
Independent particle
model
Origin of data
PES, and inverse
PES?
exciton structure?
. . .
18 / 91
Trust
A. Savin
Introduction
Overview
Properties
From experiment
From calculations
Statistical indicators
Many indicators
Indicators can yield
different ranking
When the mean has
no meaning
Indicators are
affected by sampling
Human decisions
Living with
uncertainties
Accurate values or
trends
Domain of validity
Utility
Psychology of
decision
Publishing reliable
results
Conclusions
Spurious effects on experimental data?
For example, Taylor and Hartman tentatively placed the valence
band of LiF at about 13 eV below the vacuum level on the basis of
an edge in the photoelectric yield curve. However, their yield curve
continues to fall rapidly at lower photon energies, and this may be
interpreted as a threshold of approximately 10 eV, which compares
favorably with our estimate of 9.8 eV for this quantity.
R. T. Poole, J. G. Jenkin, J. Liesegang, R. C. Leckey Phys. Rev. B 11, 5679, 1975
Problems for band gaps: nuclear motion, surface, ... effects, etc.
19 / 91
Trust
A. Savin
Introduction
Overview
Properties
From experiment
From calculations
Statistical indicators
Many indicators
Indicators can yield
different ranking
When the mean has
no meaning
Indicators are
affected by sampling
Human decisions
Living with
uncertainties
Accurate values or
trends
Domain of validity
Utility
Psychology of
decision
Publishing reliable
results
Conclusions
Ideal and real experimental data
ZnO Weinen et al. (report from cpfs.mpg.de)
Reproduce the spectrum not the gap
(H. Tjeng, in Lausanne 2014)
20 / 91
Trust
A. Savin
Introduction
Overview
Properties
From experiment
From calculations
Statistical indicators
Many indicators
Indicators can yield
different ranking
When the mean has
no meaning
Indicators are
affected by sampling
Human decisions
Living with
uncertainties
Accurate values or
trends
Domain of validity
Utility
Psychology of
decision
Publishing reliable
results
Conclusions
Reference data from calculations
Same quantity can be calculated with reference and model
Is the theory behind the calculation capable to provide the
desired quantity?
Can we trust calculated data?
21 / 91
Trust
A. Savin
Introduction
Overview
Properties
From experiment
From calculations
Statistical indicators
Many indicators
Indicators can yield
different ranking
When the mean has
no meaning
Indicators are
affected by sampling
Human decisions
Living with
uncertainties
Accurate values or
trends
Domain of validity
Utility
Psychology of
decision
Publishing reliable
results
Conclusions
Is the theory behind the calculation capable to
provide the desired quantity?
22 / 91
Trust
A. Savin
Introduction
Overview
Properties
From experiment
From calculations
Statistical indicators
Many indicators
Indicators can yield
different ranking
When the mean has
no meaning
Indicators are
affected by sampling
Human decisions
Living with
uncertainties
Accurate values or
trends
Domain of validity
Utility
Psychology of
decision
Publishing reliable
results
Conclusions
Calculating fundamental band gaps with different
methods
IP − EA
Provided by exact Green’s functions
Not provided by Hartree-Fock∗
Not provided by exact Kohn-Sham orbital energies
1966: Sham-Kohn, 1983: Perdew-Levy, Sham-Schl¨uter, ...∗
Exact Kohn-Sham calculations would provide exact results using two
separate calculations, for X, and for X−
Density functional hybrids∗
?
∗
Just correlation for most calculations?
23 / 91
Trust
A. Savin
Introduction
Overview
Properties
From experiment
From calculations
Statistical indicators
Many indicators
Indicators can yield
different ranking
When the mean has
no meaning
Indicators are
affected by sampling
Human decisions
Living with
uncertainties
Accurate values or
trends
Domain of validity
Utility
Psychology of
decision
Publishing reliable
results
Conclusions
Do we use the right theory?
smartandgreen.eu
Do we need fundamental or optical band gaps?
24 / 91
Trust
A. Savin
Introduction
Overview
Properties
From experiment
From calculations
Statistical indicators
Many indicators
Indicators can yield
different ranking
When the mean has
no meaning
Indicators are
affected by sampling
Human decisions
Living with
uncertainties
Accurate values or
trends
Domain of validity
Utility
Psychology of
decision
Publishing reliable
results
Conclusions
Can we trust calculated data?
Higher quality calculations may not
have the accuracy needed for comparisons with lower level
methods
be allowed to “filter” (to decide whether a lower level
calculation is good or bad)
25 / 91
Trust
A. Savin
Introduction
Overview
Properties
From experiment
From calculations
Statistical indicators
Many indicators
Indicators can yield
different ranking
When the mean has
no meaning
Indicators are
affected by sampling
Human decisions
Living with
uncertainties
Accurate values or
trends
Domain of validity
Utility
Psychology of
decision
Publishing reliable
results
Conclusions
Accuracy of “reliable” calculations
26 / 91
Trust
A. Savin
Introduction
Overview
Properties
From experiment
From calculations
Statistical indicators
Many indicators
Indicators can yield
different ranking
When the mean has
no meaning
Indicators are
affected by sampling
Human decisions
Living with
uncertainties
Accurate values or
trends
Domain of validity
Utility
Psychology of
decision
Publishing reliable
results
Conclusions
How accessible are sufficiently accurate data?
Mean absolute errors (kcal/mol)
G1 set (atomization energies for 55 molecules)
J.C. Grossman, 2002
B3LYP DMC CCSD(T)/aug-cc-pVQZ CCSD(T)/CBS
2.5 2.9 2.8 1.3
27 / 91
Trust
A. Savin
Introduction
Overview
Properties
From experiment
From calculations
Statistical indicators
Many indicators
Indicators can yield
different ranking
When the mean has
no meaning
Indicators are
affected by sampling
Human decisions
Living with
uncertainties
Accurate values or
trends
Domain of validity
Utility
Psychology of
decision
Publishing reliable
results
Conclusions
How accessible are sufficiently accurate data?
Mean absolute errors (kcal/mol)
G1 set (atomization energies for 55 molecules)
J.C. Grossman, 2002
B3LYP DMC CCSD(T)/aug-cc-pVQZ CCSD(T)/CBS
2.5 2.9 2.8 1.3
Does the reference have the same (in)accuracy?
27 / 91
Trust
A. Savin
Introduction
Overview
Properties
From experiment
From calculations
Statistical indicators
Many indicators
Indicators can yield
different ranking
When the mean has
no meaning
Indicators are
affected by sampling
Human decisions
Living with
uncertainties
Accurate values or
trends
Domain of validity
Utility
Psychology of
decision
Publishing reliable
results
Conclusions
Effect of improving the calculated reference data
Weak interaction benchmark data set (S22)
given set of molecules
2006 calculations (Jurecka et al.)
2011 calculations (Marshall et al.)
Percentage of “correct” results changes from 55% to 86%
“Correct”: within ±0.5 kcal/mol with B3LYP corrected for dispersion by XDM
20 15 10 5
20
15
10
5
reference
B3LYP
28 / 91
Trust
A. Savin
Introduction
Overview
Properties
From experiment
From calculations
Statistical indicators
Many indicators
Indicators can yield
different ranking
When the mean has
no meaning
Indicators are
affected by sampling
Human decisions
Living with
uncertainties
Accurate values or
trends
Domain of validity
Utility
Psychology of
decision
Publishing reliable
results
Conclusions
Filtering using “reliable” calculations
Perform reference calculations with a different method, and refrain
from accepting results when the two methods disagree.
Example: Perform point-wise an expensive calculation to verify
cheap calculation.
29 / 91
Trust
A. Savin
Introduction
Overview
Properties
From experiment
From calculations
Statistical indicators
Many indicators
Indicators can yield
different ranking
When the mean has
no meaning
Indicators are
affected by sampling
Human decisions
Living with
uncertainties
Accurate values or
trends
Domain of validity
Utility
Psychology of
decision
Publishing reliable
results
Conclusions
Why filtering not necessarily is an improvement
Cases:
Model says Filter selects Filter rejects
result reliable a (correct) b (error)
result unreliable c (error) d (correct)
Fraction of reliable results:
before selection by filter: (a + b)/(a + b + c + d)
after selection by filter: a/(a + c)
Filtering brings no improvement when
(a + b)/(a + b + c + d) ≥ a/(a + c), or bc ≥ ad
30 / 91
Trust
A. Savin
Introduction
Overview
Properties
From experiment
From calculations
Statistical indicators
Many indicators
Indicators can yield
different ranking
When the mean has
no meaning
Indicators are
affected by sampling
Human decisions
Living with
uncertainties
Accurate values or
trends
Domain of validity
Utility
Psychology of
decision
Publishing reliable
results
Conclusions
Filters not always successful
Band gaps in 28 cubic crystals
Filter is too restrictive, but reliable
PBEsol PBE filter selects (39%) PBE filter rejects (61%)
Result reliable (93%) 11 15
Result unreliable(7%) 0 2
100% (11 out of 11) results selected by PBE filter are reliable
Filter selects reasonably well, and is useless
PBEsol PBE0 filter selects (92%) PBE0 filter rejects (8%)
Result reliable (93%) 24 2
Result unreliable(7%) 2 0
Results selected by PBE0 filter are reliable, ≈ as without filter, but systems excluded.
PBEsol and PBE0 make the same mistake: unreliable results are close, and thus wrongly selected (ad = 0). Some reliable
PBEsol results are not close to PBE0, and rejected (bc = 0). Thus, ad < bc.
31 / 91
Trust
A. Savin
Introduction
Overview
Properties
From experiment
From calculations
Statistical indicators
Many indicators
Indicators can yield
different ranking
When the mean has
no meaning
Indicators are
affected by sampling
Human decisions
Living with
uncertainties
Accurate values or
trends
Domain of validity
Utility
Psychology of
decision
Publishing reliable
results
Conclusions
Reference data. Summary
Pitfalls:
Experimental data
Error bars
Corrections applied
Model used
Calculated data
may not be accurate enough
32 / 91
Trust
A. Savin
Introduction
Overview
Properties
From experiment
From calculations
Statistical indicators
Many indicators
Indicators can yield
different ranking
When the mean has
no meaning
Indicators are
affected by sampling
Human decisions
Living with
uncertainties
Accurate values or
trends
Domain of validity
Utility
Psychology of
decision
Publishing reliable
results
Conclusions
Benchmarks
Model and benchmark?
33 / 91
Trust
A. Savin
Introduction
Overview
Properties
From experiment
From calculations
Statistical indicators
Many indicators
Indicators can yield
different ranking
When the mean has
no meaning
Indicators are
affected by sampling
Human decisions
Living with
uncertainties
Accurate values or
trends
Domain of validity
Utility
Psychology of
decision
Publishing reliable
results
Conclusions
Benchmarks
Benchmark and reality
33 / 91
Trust
A. Savin
Introduction
Overview
Properties
From experiment
From calculations
Statistical indicators
Many indicators
Indicators can yield
different ranking
When the mean has
no meaning
Indicators are
affected by sampling
Human decisions
Living with
uncertainties
Accurate values or
trends
Domain of validity
Utility
Psychology of
decision
Publishing reliable
results
Conclusions
Reference data. Conclusion
To judge the quality of a method we compare to benchmarks.
These can be inappropriate.
Need for critical analysis of the accuracy of the reference data
from the perspective of the problem under study.
34 / 91
Trust
A. Savin
Introduction
Overview
Properties
From experiment
From calculations
Statistical indicators
Many indicators
Indicators can yield
different ranking
When the mean has
no meaning
Indicators are
affected by sampling
Human decisions
Living with
uncertainties
Accurate values or
trends
Domain of validity
Utility
Psychology of
decision
Publishing reliable
results
Conclusions
Reference data. Conclusion
To judge the quality of a method we compare to benchmarks.
These can be inappropriate.
Need for critical analysis of the accuracy of the reference data
from the perspective of the problem under study.
Once we have decided about reference data, we have to
define a measure quantifying our choice: statistical indicators
34 / 91
Trust
A. Savin
Introduction
Overview
Properties
From experiment
From calculations
Statistical indicators
Many indicators
Indicators can yield
different ranking
When the mean has
no meaning
Indicators are
affected by sampling
Human decisions
Living with
uncertainties
Accurate values or
trends
Domain of validity
Utility
Psychology of
decision
Publishing reliable
results
Conclusions
Overview
Properties we study
Measures of satisfaction (statistical indicators)
Decisions to take (human)
35 / 91
Trust
A. Savin
Introduction
Overview
Properties
From experiment
From calculations
Statistical indicators
Many indicators
Indicators can yield
different ranking
When the mean has
no meaning
Indicators are
affected by sampling
Human decisions
Living with
uncertainties
Accurate values or
trends
Domain of validity
Utility
Psychology of
decision
Publishing reliable
results
Conclusions
Diagnostic tools
Weighing of the heart Book of the Dead, Papyrus of Ani, British Museum
With large amount of numbers: need for representative numbers
36 / 91
Trust
A. Savin
Introduction
Overview
Properties
From experiment
From calculations
Statistical indicators
Many indicators
Indicators can yield
different ranking
When the mean has
no meaning
Indicators are
affected by sampling
Human decisions
Living with
uncertainties
Accurate values or
trends
Domain of validity
Utility
Psychology of
decision
Publishing reliable
results
Conclusions
Statistical indicators. Overview
Many indicators (mean, median, mode, ...)
Role of sampling
37 / 91
Trust
A. Savin
Introduction
Overview
Properties
From experiment
From calculations
Statistical indicators
Many indicators
Indicators can yield
different ranking
When the mean has
no meaning
Indicators are
affected by sampling
Human decisions
Living with
uncertainties
Accurate values or
trends
Domain of validity
Utility
Psychology of
decision
Publishing reliable
results
Conclusions
Many indicators
Indicators can yield different ranking
When the mean has no meaning
38 / 91
Trust
A. Savin
Introduction
Overview
Properties
From experiment
From calculations
Statistical indicators
Many indicators
Indicators can yield
different ranking
When the mean has
no meaning
Indicators are
affected by sampling
Human decisions
Living with
uncertainties
Accurate values or
trends
Domain of validity
Utility
Psychology of
decision
Publishing reliable
results
Conclusions
Indicators can yield different ranking
39 / 91
Trust
A. Savin
Introduction
Overview
Properties
From experiment
From calculations
Statistical indicators
Many indicators
Indicators can yield
different ranking
When the mean has
no meaning
Indicators are
affected by sampling
Human decisions
Living with
uncertainties
Accurate values or
trends
Domain of validity
Utility
Psychology of
decision
Publishing reliable
results
Conclusions
Indicators do not yield the same ordering of
methods
Absolute errors: |xi |
Mean: 1
n i=1,n |xi |
Median: half of the |xi | are < median, half > median
Maximum: max(|x1|, |x2|, . . . , |xN |)
Results for the G3/99 benchmark set (kcal/mol)
Method Mean Median Max
B3LYP 4 2 34
LC-ωPBE 5 4 25
Which method is better?
40 / 91
Trust
A. Savin
Introduction
Overview
Properties
From experiment
From calculations
Statistical indicators
Many indicators
Indicators can yield
different ranking
When the mean has
no meaning
Indicators are
affected by sampling
Human decisions
Living with
uncertainties
Accurate values or
trends
Domain of validity
Utility
Psychology of
decision
Publishing reliable
results
Conclusions
Condensing data by indicators
Radiation around Fukushima Daiichi NPS
NNSA 04/03/2011
Evacuation at 30 km, exclusion zone 20 km
Radiation may more important at >30 km than at 10 km.
Mean: bad indicator
41 / 91
Trust
A. Savin
Introduction
Overview
Properties
From experiment
From calculations
Statistical indicators
Many indicators
Indicators can yield
different ranking
When the mean has
no meaning
Indicators are
affected by sampling
Human decisions
Living with
uncertainties
Accurate values or
trends
Domain of validity
Utility
Psychology of
decision
Publishing reliable
results
Conclusions
Origin of problems
Error distribution, and its mean
mean is relevant irrelevant
42 / 91
Trust
A. Savin
Introduction
Overview
Properties
From experiment
From calculations
Statistical indicators
Many indicators
Indicators can yield
different ranking
When the mean has
no meaning
Indicators are
affected by sampling
Human decisions
Living with
uncertainties
Accurate values or
trends
Domain of validity
Utility
Psychology of
decision
Publishing reliable
results
Conclusions
A simple model for parametrized approximations
A mathematically (=clearly) defined problem
Model Analogy
x ∈ (0, 1) Choice of system (random)
(1 + x)2
Exact result
1 + mx Approximation
m ∈ (2, 3) Parameter
y = (1 + mx) − (1 + x)2
Error of the approximation
Objective: “Recommend the best m”
43 / 91
Trust
A. Savin
Introduction
Overview
Properties
From experiment
From calculations
Statistical indicators
Many indicators
Indicators can yield
different ranking
When the mean has
no meaning
Indicators are
affected by sampling
Human decisions
Living with
uncertainties
Accurate values or
trends
Domain of validity
Utility
Psychology of
decision
Publishing reliable
results
Conclusions
A set of simple models
m = 2 using exact value of function and derivative at origin
m = 3 using exact value of function at origin and endpoint
2 < m < 3 using exact value of function at origin, and some
other criterion of similitude
44 / 91
Trust
A. Savin
Introduction
Overview
Properties
From experiment
From calculations
Statistical indicators
Many indicators
Indicators can yield
different ranking
When the mean has
no meaning
Indicators are
affected by sampling
Human decisions
Living with
uncertainties
Accurate values or
trends
Domain of validity
Utility
Psychology of
decision
Publishing reliable
results
Conclusions
Approximations do not yield normally distributed
errors
Model and its error distribution
45 / 91
Trust
A. Savin
Introduction
Overview
Properties
From experiment
From calculations
Statistical indicators
Many indicators
Indicators can yield
different ranking
When the mean has
no meaning
Indicators are
affected by sampling
Human decisions
Living with
uncertainties
Accurate values or
trends
Domain of validity
Utility
Psychology of
decision
Publishing reliable
results
Conclusions
Absolute error distributions
Origin of difference between medians (red), max, mode, . . .
B3LYP LC wPBE
count
0204060
count
0 20 40 60
0
10
20
30
absolute error
Two density functional methods, for G3/99
46 / 91
Trust
A. Savin
Introduction
Overview
Properties
From experiment
From calculations
Statistical indicators
Many indicators
Indicators can yield
different ranking
When the mean has
no meaning
Indicators are
affected by sampling
Human decisions
Living with
uncertainties
Accurate values or
trends
Domain of validity
Utility
Psychology of
decision
Publishing reliable
results
Conclusions
When the mean has no meaning
47 / 91
Trust
A. Savin
Introduction
Overview
Properties
From experiment
From calculations
Statistical indicators
Many indicators
Indicators can yield
different ranking
When the mean has
no meaning
Indicators are
affected by sampling
Human decisions
Living with
uncertainties
Accurate values or
trends
Domain of validity
Utility
Psychology of
decision
Publishing reliable
results
Conclusions
When the mean has no meaning
h
1
Α
α is uniformly distributed on (0, π/2).
What is the mean value of h?
48 / 91
Trust
A. Savin
Introduction
Overview
Properties
From experiment
From calculations
Statistical indicators
Many indicators
Indicators can yield
different ranking
When the mean has
no meaning
Indicators are
affected by sampling
Human decisions
Living with
uncertainties
Accurate values or
trends
Domain of validity
Utility
Psychology of
decision
Publishing reliable
results
Conclusions
When the mean has no meaning
h
1
Α
α is uniformly distributed on (0, π/2).
What is the mean value of h?
π/2
0
dα tan(α) =
∞
0
h d arctan(h) =
∞
0
h dh
1+h2 = ∞
Variance also diverges.
cf. Lorentzian shape for peaks in spectroscopy
48 / 91
Trust
A. Savin
Introduction
Overview
Properties
From experiment
From calculations
Statistical indicators
Many indicators
Indicators can yield
different ranking
When the mean has
no meaning
Indicators are
affected by sampling
Human decisions
Living with
uncertainties
Accurate values or
trends
Domain of validity
Utility
Psychology of
decision
Publishing reliable
results
Conclusions
No mean, no variance, ...?
B3LYP distribution of atomization energy errors (G3/99)
Distributed as 2
πa (1 + (h/a)2
)−1
?
0 5 10 15 20 25 30 35
0
50
100
150
200
absolute error kcal mol
frequency
B3LYP
Mean on sample: 4 kcal/mol
Explanation: small errors accumulate in larger systems
49 / 91
Trust
A. Savin
Introduction
Overview
Properties
From experiment
From calculations
Statistical indicators
Many indicators
Indicators can yield
different ranking
When the mean has
no meaning
Indicators are
affected by sampling
Human decisions
Living with
uncertainties
Accurate values or
trends
Domain of validity
Utility
Psychology of
decision
Publishing reliable
results
Conclusions
Shape of distributions
Nearly uniform distribution of PBE absolute errors, G3/99
0 10 20 30 40 50
0
50
100
150
absolute error kcal mol
frequency
PBE
50 / 91
Trust
A. Savin
Introduction
Overview
Properties
From experiment
From calculations
Statistical indicators
Many indicators
Indicators can yield
different ranking
When the mean has
no meaning
Indicators are
affected by sampling
Human decisions
Living with
uncertainties
Accurate values or
trends
Domain of validity
Utility
Psychology of
decision
Publishing reliable
results
Conclusions
Small errors accumulate in larger systems. A
simple model
Error of approximation when detaching an atom from a chain with
n bonds (n + 1 atoms) ≈ x
x
Error in the atomization energy: x n
Mean error for chains of n = 1, . . . , m:
1
m
m
n=1
x n =
1
m
x m(m + 1)/2 = x(m + 1)/2
diverges when m → ∞
The error of the atomization energy per atom → x, when m → ∞.
51 / 91
Trust
A. Savin
Introduction
Overview
Properties
From experiment
From calculations
Statistical indicators
Many indicators
Indicators can yield
different ranking
When the mean has
no meaning
Indicators are
affected by sampling
Human decisions
Living with
uncertainties
Accurate values or
trends
Domain of validity
Utility
Psychology of
decision
Publishing reliable
results
Conclusions
Small errors accumulate in larger systems.
Atomization energies
G3, G2, and G1 benchmark sets with different functionals
MAE MAE/atom
G1
G2
G3
B3LYP
CAM-B3LYP
LC-ωPBE
B97-1
BLYP
PBE0
PW86PBE
PBE
BH&HLYP
G1
G2
G3
B3LYP
CAM B3LYP
LC ΩPBE
B97 1
BLYP
PBE0
PW86PBE
PBE
BH&HLYP
52 / 91
Trust
A. Savin
Introduction
Overview
Properties
From experiment
From calculations
Statistical indicators
Many indicators
Indicators can yield
different ranking
When the mean has
no meaning
Indicators are
affected by sampling
Human decisions
Living with
uncertainties
Accurate values or
trends
Domain of validity
Utility
Psychology of
decision
Publishing reliable
results
Conclusions
Indicators are affected by sampling
53 / 91
Trust
A. Savin
Introduction
Overview
Properties
From experiment
From calculations
Statistical indicators
Many indicators
Indicators can yield
different ranking
When the mean has
no meaning
Indicators are
affected by sampling
Human decisions
Living with
uncertainties
Accurate values or
trends
Domain of validity
Utility
Psychology of
decision
Publishing reliable
results
Conclusions
Uncertainty of mean
54 / 91
Trust
A. Savin
Introduction
Overview
Properties
From experiment
From calculations
Statistical indicators
Many indicators
Indicators can yield
different ranking
When the mean has
no meaning
Indicators are
affected by sampling
Human decisions
Living with
uncertainties
Accurate values or
trends
Domain of validity
Utility
Psychology of
decision
Publishing reliable
results
Conclusions
Finite sampling brings uncertainty of mean
Simple example
Uniform sampling on interval (0,1):
Distribution of 100 means of samples of 100
0.45 0.50 0.55
0
5
10
15
mean
count
55 / 91
Trust
A. Savin
Introduction
Overview
Properties
From experiment
From calculations
Statistical indicators
Many indicators
Indicators can yield
different ranking
When the mean has
no meaning
Indicators are
affected by sampling
Human decisions
Living with
uncertainties
Accurate values or
trends
Domain of validity
Utility
Psychology of
decision
Publishing reliable
results
Conclusions
Finite sampling brings uncertainty of mean
G3/99 MAEs
(and subsets with randomly reduced sample size - from 221 to 22)
Full G3 99 set Subset 1 Subset 2 Subset 3
1
2
3
4
5
6
MAE kcal mol
B97 1
CAM B3LYP
B3LYP
56 / 91
Trust
A. Savin
Introduction
Overview
Properties
From experiment
From calculations
Statistical indicators
Many indicators
Indicators can yield
different ranking
When the mean has
no meaning
Indicators are
affected by sampling
Human decisions
Living with
uncertainties
Accurate values or
trends
Domain of validity
Utility
Psychology of
decision
Publishing reliable
results
Conclusions
Finite sampling brings uncertainty of mean
Benchmarks for weak interactions
0.2
0.3
0.4
0.5
0.6
B3LYP
BLYP
LC
−ωPBE
PW
86PBEBH
&H
LYPC
AM
−B3LYPPBE0
B97−1
PBE
MeanAbsoluteError(kcal/mol)
KB49
S22
S66
S115
Are differences between methods important?
57 / 91
Trust
A. Savin
Introduction
Overview
Properties
From experiment
From calculations
Statistical indicators
Many indicators
Indicators can yield
different ranking
When the mean has
no meaning
Indicators are
affected by sampling
Human decisions
Living with
uncertainties
Accurate values or
trends
Domain of validity
Utility
Psychology of
decision
Publishing reliable
results
Conclusions
Statistical indicators. Summary
Different statistical indicators can lead to different
conclusions, and may even not exist
Sampling is unavailable, and brings uncertainty
58 / 91
Trust
A. Savin
Introduction
Overview
Properties
From experiment
From calculations
Statistical indicators
Many indicators
Indicators can yield
different ranking
When the mean has
no meaning
Indicators are
affected by sampling
Human decisions
Living with
uncertainties
Accurate values or
trends
Domain of validity
Utility
Psychology of
decision
Publishing reliable
results
Conclusions
Composite Portraiture
59 / 91
Trust
A. Savin
Introduction
Overview
Properties
From experiment
From calculations
Statistical indicators
Many indicators
Indicators can yield
different ranking
When the mean has
no meaning
Indicators are
affected by sampling
Human decisions
Living with
uncertainties
Accurate values or
trends
Domain of validity
Utility
Psychology of
decision
Publishing reliable
results
Conclusions
Statistical indicators. Conclusions
Statistical indicators (MAE, etc.)
are useful, maybe unavoidable, but
can induce into error, and thus
should be used with care
In spite of mathematical formulation,
supplementary criteria needed
60 / 91
Trust
A. Savin
Introduction
Overview
Properties
From experiment
From calculations
Statistical indicators
Many indicators
Indicators can yield
different ranking
When the mean has
no meaning
Indicators are
affected by sampling
Human decisions
Living with
uncertainties
Accurate values or
trends
Domain of validity
Utility
Psychology of
decision
Publishing reliable
results
Conclusions
Overview
Properties we study
Measures of satisfaction (statistical indicators)
Decisions to take (human)
61 / 91
Trust
A. Savin
Introduction
Overview
Properties
From experiment
From calculations
Statistical indicators
Many indicators
Indicators can yield
different ranking
When the mean has
no meaning
Indicators are
affected by sampling
Human decisions
Living with
uncertainties
Accurate values or
trends
Domain of validity
Utility
Psychology of
decision
Publishing reliable
results
Conclusions
Actions (decisions) after knowing the results of
the (statistical) analysis
Living with uncertainties
Accurate values or accurate trends
Domain of validity
Utility
Psychology of decision
Publishing only correct results
62 / 91
Trust
A. Savin
Introduction
Overview
Properties
From experiment
From calculations
Statistical indicators
Many indicators
Indicators can yield
different ranking
When the mean has
no meaning
Indicators are
affected by sampling
Human decisions
Living with
uncertainties
Accurate values or
trends
Domain of validity
Utility
Psychology of
decision
Publishing reliable
results
Conclusions
Living with uncertainties
63 / 91
Trust
A. Savin
Introduction
Overview
Properties
From experiment
From calculations
Statistical indicators
Many indicators
Indicators can yield
different ranking
When the mean has
no meaning
Indicators are
affected by sampling
Human decisions
Living with
uncertainties
Accurate values or
trends
Domain of validity
Utility
Psychology of
decision
Publishing reliable
results
Conclusions
Uncertainties in reference values affect judgment
of calculated data
Lattice constants in some cubic crystals: MSE±RMSD
LDA: -3.5±2.7 pm
HSEsol (best among tested functionals): 0.0±1.5 pm
Is the source of the error in the reference data?
Is there a need for better functionals?
64 / 91
Trust
A. Savin
Introduction
Overview
Properties
From experiment
From calculations
Statistical indicators
Many indicators
Indicators can yield
different ranking
When the mean has
no meaning
Indicators are
affected by sampling
Human decisions
Living with
uncertainties
Accurate values or
trends
Domain of validity
Utility
Psychology of
decision
Publishing reliable
results
Conclusions
Uncertainty in reference data propagates to
ranking of functionals
What is agreement with experimental data, if we do not know how
accurate experimental data are?
Percentage of computed (dispersion corrected) results
in agreement with experimental (G3/99) atomization energies,
within ±x kcal/mol
Method x = 0.5 x = 1 x = 2 x = 4
BLYP 9 14 24 42
B3LYP 9 22 44 73
CAMB3LYP 7 13 29 57
65 / 91
Trust
A. Savin
Introduction
Overview
Properties
From experiment
From calculations
Statistical indicators
Many indicators
Indicators can yield
different ranking
When the mean has
no meaning
Indicators are
affected by sampling
Human decisions
Living with
uncertainties
Accurate values or
trends
Domain of validity
Utility
Psychology of
decision
Publishing reliable
results
Conclusions
Accurate values or trends?
66 / 91
Trust
A. Savin
Introduction
Overview
Properties
From experiment
From calculations
Statistical indicators
Many indicators
Indicators can yield
different ranking
When the mean has
no meaning
Indicators are
affected by sampling
Human decisions
Living with
uncertainties
Accurate values or
trends
Domain of validity
Utility
Psychology of
decision
Publishing reliable
results
Conclusions
Accurate values or trends?
Which method is better?
0
Good mean (more accurate) Good variance (better trend)
MAE not a good indicator: mixes systematic with random errors
66 / 91
Trust
A. Savin
Introduction
Overview
Properties
From experiment
From calculations
Statistical indicators
Many indicators
Indicators can yield
different ranking
When the mean has
no meaning
Indicators are
affected by sampling
Human decisions
Living with
uncertainties
Accurate values or
trends
Domain of validity
Utility
Psychology of
decision
Publishing reliable
results
Conclusions
Mean errors and variance for band gap
calculations
2 0 2 4 6
0.8
1.0
1.2
1.4
1.6
1.8
2.0
ME
Σ
HF LDA PBE PBEsol
PBE0 PBEsol0 B97 B3LYP
HSE06 HSEsol HISS LC wPBE
LC wPBEsol RSHXLDA wB97 wB97 X
Prefer HISS?
67 / 91
Trust
A. Savin
Introduction
Overview
Properties
From experiment
From calculations
Statistical indicators
Many indicators
Indicators can yield
different ranking
When the mean has
no meaning
Indicators are
affected by sampling
Human decisions
Living with
uncertainties
Accurate values or
trends
Domain of validity
Utility
Psychology of
decision
Publishing reliable
results
Conclusions
Correcting for the mean error of band gaps
Constant shift easy to correct (new approximation):
error → error-ME (choice by σ)
2 0 2 4 6
0.8
1.0
1.2
1.4
1.6
1.8
2.0
ME
Σ
HF LDA PBE PBEsol
PBE0 PBEsol0 B97 B3LYP
HSE06 HSEsol HISS LC wPBE
LC wPBEsol RSHXLDA wB97 wB97 X
Prefer LC-ωPBEsol?
With one parameter HF can be made as good as HISS.
68 / 91
Trust
A. Savin
Introduction
Overview
Properties
From experiment
From calculations
Statistical indicators
Many indicators
Indicators can yield
different ranking
When the mean has
no meaning
Indicators are
affected by sampling
Human decisions
Living with
uncertainties
Accurate values or
trends
Domain of validity
Utility
Psychology of
decision
Publishing reliable
results
Conclusions
Correcting lattice constants
69 / 91
Trust
A. Savin
Introduction
Overview
Properties
From experiment
From calculations
Statistical indicators
Many indicators
Indicators can yield
different ranking
When the mean has
no meaning
Indicators are
affected by sampling
Human decisions
Living with
uncertainties
Accurate values or
trends
Domain of validity
Utility
Psychology of
decision
Publishing reliable
results
Conclusions
Domain of validity
70 / 91
Trust
A. Savin
Introduction
Overview
Properties
From experiment
From calculations
Statistical indicators
Many indicators
Indicators can yield
different ranking
When the mean has
no meaning
Indicators are
affected by sampling
Human decisions
Living with
uncertainties
Accurate values or
trends
Domain of validity
Utility
Psychology of
decision
Publishing reliable
results
Conclusions
Relevance of the benchmark data set
Questions
Is the benchmark relevant for the problem of interest?
E.g., not when benchmark designed for one property, and used for another
Is the benchmark biased? The benchmark is based upon
systems that may be different from the system under study,
e.g., because of a shift of interest with time
Example: Do not expect good large band gaps, based upon the experience with
small band gaps
0 2 4 6 8 10 12 14
0
1
2
3
0
1
2
3
band gap eV
bandgapeV
HSE06
71 / 91
Trust
A. Savin
Introduction
Overview
Properties
From experiment
From calculations
Statistical indicators
Many indicators
Indicators can yield
different ranking
When the mean has
no meaning
Indicators are
affected by sampling
Human decisions
Living with
uncertainties
Accurate values or
trends
Domain of validity
Utility
Psychology of
decision
Publishing reliable
results
Conclusions
Which method is better?
Band gaps of a set of crystals: better use HSE06 or HISS?
0 2 4 6 8 10 12
0.0
0.5
1.0
1.5
band gap eV
absoluteerroreV
HSE06
HISS
72 / 91
Trust
A. Savin
Introduction
Overview
Properties
From experiment
From calculations
Statistical indicators
Many indicators
Indicators can yield
different ranking
When the mean has
no meaning
Indicators are
affected by sampling
Human decisions
Living with
uncertainties
Accurate values or
trends
Domain of validity
Utility
Psychology of
decision
Publishing reliable
results
Conclusions
Avoiding mixing?
Not always possible: systems where
different “components” are simultaneously needed,
the relative importance of “components” is not reproduced
the same way by different methods.
73 / 91
Trust
A. Savin
Introduction
Overview
Properties
From experiment
From calculations
Statistical indicators
Many indicators
Indicators can yield
different ranking
When the mean has
no meaning
Indicators are
affected by sampling
Human decisions
Living with
uncertainties
Accurate values or
trends
Domain of validity
Utility
Psychology of
decision
Publishing reliable
results
Conclusions
When mixing produces inversions
We split the S115 benchmark set into:
1. H-bonded (HB)
2. weakly interacting (WI)
One of the method gives better MAEs for both benchmark sets.
Situations where the worse method gives better results?
74 / 91
Trust
A. Savin
Introduction
Overview
Properties
From experiment
From calculations
Statistical indicators
Many indicators
Indicators can yield
different ranking
When the mean has
no meaning
Indicators are
affected by sampling
Human decisions
Living with
uncertainties
Accurate values or
trends
Domain of validity
Utility
Psychology of
decision
Publishing reliable
results
Conclusions
When mixing produces inversions
We split the S115 benchmark set into:
1. H-bonded (HB)
2. weakly interacting (WI)
One of the method gives better MAEs for both benchmark sets.
Situations where the worse method gives better results?
Yes, when weighing of HB and WI is different!
HB WI
4
5
6
7
8
9
10
Interaction
MAE
B3LYP
PBE0
74 / 91
Trust
A. Savin
Introduction
Overview
Properties
From experiment
From calculations
Statistical indicators
Many indicators
Indicators can yield
different ranking
When the mean has
no meaning
Indicators are
affected by sampling
Human decisions
Living with
uncertainties
Accurate values or
trends
Domain of validity
Utility
Psychology of
decision
Publishing reliable
results
Conclusions
Best method not for all properties
Mean absolute errors
Method Lattice constant (pm) Bulk modulus (GPa)
HSEsol 1 7
PBE0 4 5
75 / 91
Trust
A. Savin
Introduction
Overview
Properties
From experiment
From calculations
Statistical indicators
Many indicators
Indicators can yield
different ranking
When the mean has
no meaning
Indicators are
affected by sampling
Human decisions
Living with
uncertainties
Accurate values or
trends
Domain of validity
Utility
Psychology of
decision
Publishing reliable
results
Conclusions
Utility
76 / 91
Trust
A. Savin
Introduction
Overview
Properties
From experiment
From calculations
Statistical indicators
Many indicators
Indicators can yield
different ranking
When the mean has
no meaning
Indicators are
affected by sampling
Human decisions
Living with
uncertainties
Accurate values or
trends
Domain of validity
Utility
Psychology of
decision
Publishing reliable
results
Conclusions
Utility of a calculation
Choose between A and B
Result A (expensive) B (cheap)
A better than B good bad
A as good as B good good
A worse than B bad good
77 / 91
Trust
A. Savin
Introduction
Overview
Properties
From experiment
From calculations
Statistical indicators
Many indicators
Indicators can yield
different ranking
When the mean has
no meaning
Indicators are
affected by sampling
Human decisions
Living with
uncertainties
Accurate values or
trends
Domain of validity
Utility
Psychology of
decision
Publishing reliable
results
Conclusions
Quantify the utility of a calculation
“Gain” obtained by choosing between A and B
cheap: +1, expensive, -1; good: +2, bad, -2
A (expensive) B (cheap)
A better than B good (+2-1) bad (-2+1)
A as good as B good (+2-1) good (+2+1)
A worse than B bad (-2-1) good (+2+1)
78 / 91
Trust
A. Savin
Introduction
Overview
Properties
From experiment
From calculations
Statistical indicators
Many indicators
Indicators can yield
different ranking
When the mean has
no meaning
Indicators are
affected by sampling
Human decisions
Living with
uncertainties
Accurate values or
trends
Domain of validity
Utility
Psychology of
decision
Publishing reliable
results
Conclusions
Quantify the utility of a calculation for lattice
constants
Choice between A (PBEsol) and B (LDA) for lattice constants
A (expensive) B (cheap) probability
A better than B 1 -1 1/2
A as good as B 1 3 1/4
A worse than B -3 3 1/4
“Gain” 0 1
MAE 2.4 pm 3.5 pm
MAE (or probability) and “gain” give contradictory recommendations
79 / 91
Trust
A. Savin
Introduction
Overview
Properties
From experiment
From calculations
Statistical indicators
Many indicators
Indicators can yield
different ranking
When the mean has
no meaning
Indicators are
affected by sampling
Human decisions
Living with
uncertainties
Accurate values or
trends
Domain of validity
Utility
Psychology of
decision
Publishing reliable
results
Conclusions
Psychology of decision
Market behavior
80 / 91
Trust
A. Savin
Introduction
Overview
Properties
From experiment
From calculations
Statistical indicators
Many indicators
Indicators can yield
different ranking
When the mean has
no meaning
Indicators are
affected by sampling
Human decisions
Living with
uncertainties
Accurate values or
trends
Domain of validity
Utility
Psychology of
decision
Publishing reliable
results
Conclusions
What is the best method?
Safest result?
Minimize maximal error
Most stable error on average?
81 / 91
Trust
A. Savin
Introduction
Overview
Properties
From experiment
From calculations
Statistical indicators
Many indicators
Indicators can yield
different ranking
When the mean has
no meaning
Indicators are
affected by sampling
Human decisions
Living with
uncertainties
Accurate values or
trends
Domain of validity
Utility
Psychology of
decision
Publishing reliable
results
Conclusions
Share portfolio
Dow Jones Industrial Average on 2 June 2014
Company Yearly change
Pfitzer Inc -3.26
Walt Disney Co 9.96
http://money.cnn.com/data/markets/dow
Share portfolio does not insure highest gain, but enhances stability
Supposing long-term gain at stock exchange
82 / 91
Trust
A. Savin
Introduction
Overview
Properties
From experiment
From calculations
Statistical indicators
Many indicators
Indicators can yield
different ranking
When the mean has
no meaning
Indicators are
affected by sampling
Human decisions
Living with
uncertainties
Accurate values or
trends
Domain of validity
Utility
Psychology of
decision
Publishing reliable
results
Conclusions
Using a portfolio of methods?
Using different methods, in the right proportion can enhance
stability of results
Do 25% of calculations with RPA and 75% with RPAx
HB7
WI8
Type of interaction
RPA
RPAx
Method
2.0
2.5
3.0
Error
Data from W. Zhu et al, JCP 2010
83 / 91
Trust
A. Savin
Introduction
Overview
Properties
From experiment
From calculations
Statistical indicators
Many indicators
Indicators can yield
different ranking
When the mean has
no meaning
Indicators are
affected by sampling
Human decisions
Living with
uncertainties
Accurate values or
trends
Domain of validity
Utility
Psychology of
decision
Publishing reliable
results
Conclusions
Using a portfolio of methods?
Using different methods, in the right proportion can enhance
stability of results
Do 25% of calculations with RPA and 75% with RPAx
HB7
WI8
Type of interaction
RPA
RPAx
Method
2.0
2.5
3.0
Error
Data from W. Zhu et al, JCP 2010
Mixing by community
Invisible hand of the market
83 / 91
Trust
A. Savin
Introduction
Overview
Properties
From experiment
From calculations
Statistical indicators
Many indicators
Indicators can yield
different ranking
When the mean has
no meaning
Indicators are
affected by sampling
Human decisions
Living with
uncertainties
Accurate values or
trends
Domain of validity
Utility
Psychology of
decision
Publishing reliable
results
Conclusions
The probability to predict the correct result
Assumptions:
New calculations yield acceptable results, distributed as in the
benchmark set.
The probability to obtain a good result is given by
p =
a
t
a: number of results within the accepted threshold,
t: total number of results in the benchmark set
Probability to obtain at least k correct answers, out of 10
(binomial distribution)
10
j=k
10
j
pj
(1 − p)10−j
84 / 91
Trust
A. Savin
Introduction
Overview
Properties
From experiment
From calculations
Statistical indicators
Many indicators
Indicators can yield
different ranking
When the mean has
no meaning
Indicators are
affected by sampling
Human decisions
Living with
uncertainties
Accurate values or
trends
Domain of validity
Utility
Psychology of
decision
Publishing reliable
results
Conclusions
Probability to publish n correct results out of ten
The probability to obtain B3LYP+XDM atomization energies with
absolute errors per atom less than a chosen maximum acceptable
value, for a set of n systems and assuming the same error
distribution as the G3 data set.B3LYP errors, based upon G3/99
atomization energies/atom
0.0
0.2
0.4
0.6
0.8
1.0
0.0 0.5 1.0 1.5 2.0 2.5 3.0 3.5 4.0 4.5 5.0
Probability
Maximum acceptable absolute error (kcal/mol)
10
5
2
1
Even with a very large tolerance (3 kcal/mol per atom) it is more probable to not have all
ten results right, than to have them all right.
85 / 91
Trust
A. Savin
Introduction
Overview
Properties
From experiment
From calculations
Statistical indicators
Many indicators
Indicators can yield
different ranking
When the mean has
no meaning
Indicators are
affected by sampling
Human decisions
Living with
uncertainties
Accurate values or
trends
Domain of validity
Utility
Psychology of
decision
Publishing reliable
results
Conclusions
Human decisions. Summary
Not necessarily the same choice, if made for best accuracy, or
for best trend
The community’s choice (experience with one class of
systems, properties, ...) might not be the best adapted to the
problem under study
Criteria from decision theory can orient choices otherwise
than “diagnostic tools” (like MAE, etc.)
Statistics tell us that there are many unreliable results in the
literature
86 / 91
Trust
A. Savin
Introduction
Overview
Properties
From experiment
From calculations
Statistical indicators
Many indicators
Indicators can yield
different ranking
When the mean has
no meaning
Indicators are
affected by sampling
Human decisions
Living with
uncertainties
Accurate values or
trends
Domain of validity
Utility
Psychology of
decision
Publishing reliable
results
Conclusions
Human decision. Conclusions
Decision taking is unavoidable.
Specifying the criteria for the decision taken should be part of
the study.
87 / 91
Trust
A. Savin
Introduction
Overview
Properties
From experiment
From calculations
Statistical indicators
Many indicators
Indicators can yield
different ranking
When the mean has
no meaning
Indicators are
affected by sampling
Human decisions
Living with
uncertainties
Accurate values or
trends
Domain of validity
Utility
Psychology of
decision
Publishing reliable
results
Conclusions
Conclusions
What should I do ...?
Auguste Rodin Le Penseur Mus´ee Rodin
88 / 91
Trust
A. Savin
Introduction
Overview
Properties
From experiment
From calculations
Statistical indicators
Many indicators
Indicators can yield
different ranking
When the mean has
no meaning
Indicators are
affected by sampling
Human decisions
Living with
uncertainties
Accurate values or
trends
Domain of validity
Utility
Psychology of
decision
Publishing reliable
results
Conclusions
Conclusions
Many pitfalls. Recommendations
Learning statistics and decision theory is useful when working
with large amounts of data
89 / 91
Trust
A. Savin
Introduction
Overview
Properties
From experiment
From calculations
Statistical indicators
Many indicators
Indicators can yield
different ranking
When the mean has
no meaning
Indicators are
affected by sampling
Human decisions
Living with
uncertainties
Accurate values or
trends
Domain of validity
Utility
Psychology of
decision
Publishing reliable
results
Conclusions
Conclusions
Many pitfalls. Recommendations
Learning statistics and decision theory is useful when working
with large amounts of data
Good old effort for understanding should not be forgotten
35th Midwest Theoretical Chemistry Conference, Ames (2003)
Speaker: I use DFT, because it is an easy to use black box, and
does not require much thinking.
K. Ruedenberg: Why is it a bad thing to think?
Calculations get easy, but expertize still needed
89 / 91
Trust
A. Savin
Introduction
Overview
Properties
From experiment
From calculations
Statistical indicators
Many indicators
Indicators can yield
different ranking
When the mean has
no meaning
Indicators are
affected by sampling
Human decisions
Living with
uncertainties
Accurate values or
trends
Domain of validity
Utility
Psychology of
decision
Publishing reliable
results
Conclusions
Some (difficult) questions to try to answer
What do we want to know from the calculation?
Is the theory we use capable to provide it?
What accuracy do we need?
Do we expect the approximations we make give the necessary
accuracy?
On what is based our judgment (knowledge, experience,
advice, impact factor, ...)?
Are the reference data significant for our problem?
How do we judge the accuracy of the approximation
(sufficient data, significant indicators, . . . ) ?
Is their accuracy sufficient for our purpose?
If the accuracy is not sufficient, what are we willing to give
up?
. . .
90 / 91
Trust
A. Savin
Introduction
Overview
Properties
From experiment
From calculations
Statistical indicators
Many indicators
Indicators can yield
different ranking
When the mean has
no meaning
Indicators are
affected by sampling
Human decisions
Living with
uncertainties
Accurate values or
trends
Domain of validity
Utility
Psychology of
decision
Publishing reliable
results
Conclusions
Progress in science does not necessarily come
from better accuracy
Nearly uniform distribution of BH&HLYP absolute errors, G3/99
0 10 20 30 40 50
0
50
100
150
absolute error kcal mol
frequency
BH&HLYP
BH&H: at the origin of hybrids
91 / 91

How to judge approximations? Pitfalls of statistics

  • 1.
    Trust A. Savin Introduction Overview Properties From experiment Fromcalculations Statistical indicators Many indicators Indicators can yield different ranking When the mean has no meaning Indicators are affected by sampling Human decisions Living with uncertainties Accurate values or trends Domain of validity Utility Psychology of decision Publishing reliable results Conclusions Most take things upon trust Bartolomeo Civalleri1 , Roberto Dovesi1 , Erin R. Johnson3 , Pascal Pernot 4 , Davide Presti2 , Andreas Savin5 1 Department of Chemistry and NIS Centre of Excellence University of Torino (Italy) 2 Department of Chemical and Geological Sciences and INSTM research unit University of Modena and Reggio-Emilia, Modena (Italy) 3 Chemistry and Chemical Biology, School of Natural Sciences University of California, Merced (USA) 4 Laboratoire de Chimie Physique d’Orsay Universit´e Paris-Sud (France) 5 Laboratoire de Chimie Th´eorique CNRS and Sorbonne University UPMC Univ Paris 6 (France) Winterschool on Computational Chemistry 2015 1 / 91
  • 2.
    Trust A. Savin Introduction Overview Properties From experiment Fromcalculations Statistical indicators Many indicators Indicators can yield different ranking When the mean has no meaning Indicators are affected by sampling Human decisions Living with uncertainties Accurate values or trends Domain of validity Utility Psychology of decision Publishing reliable results Conclusions Most take things upon trust ... some (and those of the most) taking things upon trust, misemploy their power of assent ... John Locke 2 / 91
  • 3.
    Trust A. Savin Introduction Overview Properties From experiment Fromcalculations Statistical indicators Many indicators Indicators can yield different ranking When the mean has no meaning Indicators are affected by sampling Human decisions Living with uncertainties Accurate values or trends Domain of validity Utility Psychology of decision Publishing reliable results Conclusions Most take things upon trust ... some (and those of the most) taking things upon trust, misemploy their power of assent ... John Locke 2 / 91
  • 4.
    Trust A. Savin Introduction Overview Properties From experiment Fromcalculations Statistical indicators Many indicators Indicators can yield different ranking When the mean has no meaning Indicators are affected by sampling Human decisions Living with uncertainties Accurate values or trends Domain of validity Utility Psychology of decision Publishing reliable results Conclusions Success of benchmarks Quantifying experience 0 50 100 150 200 250 300 1993 1998 2003 2008 2013 0 2000 4000 6000 8000 10000 12000 Numberofpublications Numberofcitations Year publications citations 3 / 91
  • 5.
    Trust A. Savin Introduction Overview Properties From experiment Fromcalculations Statistical indicators Many indicators Indicators can yield different ranking When the mean has no meaning Indicators are affected by sampling Human decisions Living with uncertainties Accurate values or trends Domain of validity Utility Psychology of decision Publishing reliable results Conclusions What this talk is about: statistics Dealing with a large amount of numbers: efficient algorithms performant computers new methods, e.g., DFT Statistical methods used to concentrate information largely used in environmental sciences, medicine, finance, .... very useful pitfalls In spite of mathematical rigor, using statistical indicators does not avoid human decision. 4 / 91
  • 6.
    Trust A. Savin Introduction Overview Properties From experiment Fromcalculations Statistical indicators Many indicators Indicators can yield different ranking When the mean has no meaning Indicators are affected by sampling Human decisions Living with uncertainties Accurate values or trends Domain of validity Utility Psychology of decision Publishing reliable results Conclusions Predicting with or without understanding Physical models with systematic improvement: understanding Improvement can be seen with optimism Limitations: cost and time absence of rigorous bounds Statistical models (correlations): without knowing the underlying cause Legitimate when used with necessary care Limitations: Choice of quantities (properties) entering the model Statistical treatment Conclusions drawn 5 / 91
  • 7.
    Trust A. Savin Introduction Overview Properties From experiment Fromcalculations Statistical indicators Many indicators Indicators can yield different ranking When the mean has no meaning Indicators are affected by sampling Human decisions Living with uncertainties Accurate values or trends Domain of validity Utility Psychology of decision Publishing reliable results Conclusions Overview Properties (quantities) analyzed Quality of approximation (model) Decisions to take (human) (How do the preceding points affect the design of methods?) 6 / 91
  • 8.
    Trust A. Savin Introduction Overview Properties From experiment Fromcalculations Statistical indicators Many indicators Indicators can yield different ranking When the mean has no meaning Indicators are affected by sampling Human decisions Living with uncertainties Accurate values or trends Domain of validity Utility Psychology of decision Publishing reliable results Conclusions Unjustified correlations Happiness(t) = w0 + w1 t j=1 γ t−j CRj + w2 t j=1 γ t−j EVj + w3 t j=1 γ t−j RPEj R.B. Rutledge et al, PNAS 2014 Was happiness properly defined? Were the factors determining it properly chosen? How is the agreement of the data with the model? Do we learn how to get happier? 7 / 91
  • 9.
    Trust A. Savin Introduction Overview Properties From experiment Fromcalculations Statistical indicators Many indicators Indicators can yield different ranking When the mean has no meaning Indicators are affected by sampling Human decisions Living with uncertainties Accurate values or trends Domain of validity Utility Psychology of decision Publishing reliable results Conclusions Justified correlations: predicting without understanding Captain James Cook forced his crew to eat sauerkraut, without knowing that lack of vitamin C produces scurvy. Properties: sauerkraut (containing vitamin C) and number of sailors getting scurvy Agreement: very good (although no statistics) Acting: Cook acted, and avoided scurvy 8 / 91
  • 10.
    Trust A. Savin Introduction Overview Properties From experiment Fromcalculations Statistical indicators Many indicators Indicators can yield different ranking When the mean has no meaning Indicators are affected by sampling Human decisions Living with uncertainties Accurate values or trends Domain of validity Utility Psychology of decision Publishing reliable results Conclusions Justified or unjustified? Comparison of data obtained by a model (e.g., density functional approximation, DFA), and reference values (experimental, or calculated by a more advanced model) 20 15 10 5 20 15 10 5 reference B3LYP 9 / 91
  • 11.
    Trust A. Savin Introduction Overview Properties From experiment Fromcalculations Statistical indicators Many indicators Indicators can yield different ranking When the mean has no meaning Indicators are affected by sampling Human decisions Living with uncertainties Accurate values or trends Domain of validity Utility Psychology of decision Publishing reliable results Conclusions Overview Properties we study Measures of satisfaction (statistical indicators) Decisions to take (human) 10 / 91
  • 12.
    Trust A. Savin Introduction Overview Properties From experiment Fromcalculations Statistical indicators Many indicators Indicators can yield different ranking When the mean has no meaning Indicators are affected by sampling Human decisions Living with uncertainties Accurate values or trends Domain of validity Utility Psychology of decision Publishing reliable results Conclusions Origin of properties Do we get properties we need from experiment? from calculations? 11 / 91
  • 13.
    Trust A. Savin Introduction Overview Properties From experiment Fromcalculations Statistical indicators Many indicators Indicators can yield different ranking When the mean has no meaning Indicators are affected by sampling Human decisions Living with uncertainties Accurate values or trends Domain of validity Utility Psychology of decision Publishing reliable results Conclusions Reference data from experiment Do we get properties from experimental data? Error bars Corrections Models used to analyze the data 12 / 91
  • 14.
    Trust A. Savin Introduction Overview Properties From experiment Fromcalculations Statistical indicators Many indicators Indicators can yield different ranking When the mean has no meaning Indicators are affected by sampling Human decisions Living with uncertainties Accurate values or trends Domain of validity Utility Psychology of decision Publishing reliable results Conclusions Error bars 13 / 91
  • 15.
    Trust A. Savin Introduction Overview Properties From experiment Fromcalculations Statistical indicators Many indicators Indicators can yield different ranking When the mean has no meaning Indicators are affected by sampling Human decisions Living with uncertainties Accurate values or trends Domain of validity Utility Psychology of decision Publishing reliable results Conclusions Is 1 kcal/mol chemical accuracy? Results for the G1 set (atomization energies for 55 molecules) The experimental data reported here are taken from a combination of NIST-JANAF tables and Huber and Herzberg, ... Most experimental errors are small, i.e., < 0.5 kcal/mol, although several are somewhat larger, e.g., CS has an experimental error of 6 kcal/mol. .. For several species experimental errors are unavailable. J.C. Grossman, 2002 14 / 91
  • 16.
    Trust A. Savin Introduction Overview Properties From experiment Fromcalculations Statistical indicators Many indicators Indicators can yield different ranking When the mean has no meaning Indicators are affected by sampling Human decisions Living with uncertainties Accurate values or trends Domain of validity Utility Psychology of decision Publishing reliable results Conclusions Is 1 kcal/mol chemical accuracy? Results for the G1 set (atomization energies for 55 molecules) The experimental data reported here are taken from a combination of NIST-JANAF tables and Huber and Herzberg, ... Most experimental errors are small, i.e., < 0.5 kcal/mol, although several are somewhat larger, e.g., CS has an experimental error of 6 kcal/mol. .. For several species experimental errors are unavailable. J.C. Grossman, 2002 Difficulty to extract experimental error bars from published data Cf. J. Cioslowski et al, 2000 14 / 91
  • 17.
    Trust A. Savin Introduction Overview Properties From experiment Fromcalculations Statistical indicators Many indicators Indicators can yield different ranking When the mean has no meaning Indicators are affected by sampling Human decisions Living with uncertainties Accurate values or trends Domain of validity Utility Psychology of decision Publishing reliable results Conclusions Corrections to experimental data 15 / 91
  • 18.
    Trust A. Savin Introduction Overview Properties From experiment Fromcalculations Statistical indicators Many indicators Indicators can yield different ranking When the mean has no meaning Indicators are affected by sampling Human decisions Living with uncertainties Accurate values or trends Domain of validity Utility Psychology of decision Publishing reliable results Conclusions Temperature dependence of lattice constants Lattice constants measured to 5 significant digits How many digits at 0 K? Hebstein, Acta Cryst B 2000 16 / 91
  • 19.
    Trust A. Savin Introduction Overview Properties From experiment Fromcalculations Statistical indicators Many indicators Indicators can yield different ranking When the mean has no meaning Indicators are affected by sampling Human decisions Living with uncertainties Accurate values or trends Domain of validity Utility Psychology of decision Publishing reliable results Conclusions Models behind experimental data 17 / 91
  • 20.
    Trust A. Savin Introduction Overview Properties From experiment Fromcalculations Statistical indicators Many indicators Indicators can yield different ranking When the mean has no meaning Indicators are affected by sampling Human decisions Living with uncertainties Accurate values or trends Domain of validity Utility Psychology of decision Publishing reliable results Conclusions Fundamental band gaps R. T. Poole, J. G. Jenkin, J. Liesegang, R. C. Leckey Phys. Rev. B 11, 5679, 1975 Independent particle model Origin of data PES, and inverse PES? exciton structure? . . . 18 / 91
  • 21.
    Trust A. Savin Introduction Overview Properties From experiment Fromcalculations Statistical indicators Many indicators Indicators can yield different ranking When the mean has no meaning Indicators are affected by sampling Human decisions Living with uncertainties Accurate values or trends Domain of validity Utility Psychology of decision Publishing reliable results Conclusions Spurious effects on experimental data? For example, Taylor and Hartman tentatively placed the valence band of LiF at about 13 eV below the vacuum level on the basis of an edge in the photoelectric yield curve. However, their yield curve continues to fall rapidly at lower photon energies, and this may be interpreted as a threshold of approximately 10 eV, which compares favorably with our estimate of 9.8 eV for this quantity. R. T. Poole, J. G. Jenkin, J. Liesegang, R. C. Leckey Phys. Rev. B 11, 5679, 1975 Problems for band gaps: nuclear motion, surface, ... effects, etc. 19 / 91
  • 22.
    Trust A. Savin Introduction Overview Properties From experiment Fromcalculations Statistical indicators Many indicators Indicators can yield different ranking When the mean has no meaning Indicators are affected by sampling Human decisions Living with uncertainties Accurate values or trends Domain of validity Utility Psychology of decision Publishing reliable results Conclusions Ideal and real experimental data ZnO Weinen et al. (report from cpfs.mpg.de) Reproduce the spectrum not the gap (H. Tjeng, in Lausanne 2014) 20 / 91
  • 23.
    Trust A. Savin Introduction Overview Properties From experiment Fromcalculations Statistical indicators Many indicators Indicators can yield different ranking When the mean has no meaning Indicators are affected by sampling Human decisions Living with uncertainties Accurate values or trends Domain of validity Utility Psychology of decision Publishing reliable results Conclusions Reference data from calculations Same quantity can be calculated with reference and model Is the theory behind the calculation capable to provide the desired quantity? Can we trust calculated data? 21 / 91
  • 24.
    Trust A. Savin Introduction Overview Properties From experiment Fromcalculations Statistical indicators Many indicators Indicators can yield different ranking When the mean has no meaning Indicators are affected by sampling Human decisions Living with uncertainties Accurate values or trends Domain of validity Utility Psychology of decision Publishing reliable results Conclusions Is the theory behind the calculation capable to provide the desired quantity? 22 / 91
  • 25.
    Trust A. Savin Introduction Overview Properties From experiment Fromcalculations Statistical indicators Many indicators Indicators can yield different ranking When the mean has no meaning Indicators are affected by sampling Human decisions Living with uncertainties Accurate values or trends Domain of validity Utility Psychology of decision Publishing reliable results Conclusions Calculating fundamental band gaps with different methods IP − EA Provided by exact Green’s functions Not provided by Hartree-Fock∗ Not provided by exact Kohn-Sham orbital energies 1966: Sham-Kohn, 1983: Perdew-Levy, Sham-Schl¨uter, ...∗ Exact Kohn-Sham calculations would provide exact results using two separate calculations, for X, and for X− Density functional hybrids∗ ? ∗ Just correlation for most calculations? 23 / 91
  • 26.
    Trust A. Savin Introduction Overview Properties From experiment Fromcalculations Statistical indicators Many indicators Indicators can yield different ranking When the mean has no meaning Indicators are affected by sampling Human decisions Living with uncertainties Accurate values or trends Domain of validity Utility Psychology of decision Publishing reliable results Conclusions Do we use the right theory? smartandgreen.eu Do we need fundamental or optical band gaps? 24 / 91
  • 27.
    Trust A. Savin Introduction Overview Properties From experiment Fromcalculations Statistical indicators Many indicators Indicators can yield different ranking When the mean has no meaning Indicators are affected by sampling Human decisions Living with uncertainties Accurate values or trends Domain of validity Utility Psychology of decision Publishing reliable results Conclusions Can we trust calculated data? Higher quality calculations may not have the accuracy needed for comparisons with lower level methods be allowed to “filter” (to decide whether a lower level calculation is good or bad) 25 / 91
  • 28.
    Trust A. Savin Introduction Overview Properties From experiment Fromcalculations Statistical indicators Many indicators Indicators can yield different ranking When the mean has no meaning Indicators are affected by sampling Human decisions Living with uncertainties Accurate values or trends Domain of validity Utility Psychology of decision Publishing reliable results Conclusions Accuracy of “reliable” calculations 26 / 91
  • 29.
    Trust A. Savin Introduction Overview Properties From experiment Fromcalculations Statistical indicators Many indicators Indicators can yield different ranking When the mean has no meaning Indicators are affected by sampling Human decisions Living with uncertainties Accurate values or trends Domain of validity Utility Psychology of decision Publishing reliable results Conclusions How accessible are sufficiently accurate data? Mean absolute errors (kcal/mol) G1 set (atomization energies for 55 molecules) J.C. Grossman, 2002 B3LYP DMC CCSD(T)/aug-cc-pVQZ CCSD(T)/CBS 2.5 2.9 2.8 1.3 27 / 91
  • 30.
    Trust A. Savin Introduction Overview Properties From experiment Fromcalculations Statistical indicators Many indicators Indicators can yield different ranking When the mean has no meaning Indicators are affected by sampling Human decisions Living with uncertainties Accurate values or trends Domain of validity Utility Psychology of decision Publishing reliable results Conclusions How accessible are sufficiently accurate data? Mean absolute errors (kcal/mol) G1 set (atomization energies for 55 molecules) J.C. Grossman, 2002 B3LYP DMC CCSD(T)/aug-cc-pVQZ CCSD(T)/CBS 2.5 2.9 2.8 1.3 Does the reference have the same (in)accuracy? 27 / 91
  • 31.
    Trust A. Savin Introduction Overview Properties From experiment Fromcalculations Statistical indicators Many indicators Indicators can yield different ranking When the mean has no meaning Indicators are affected by sampling Human decisions Living with uncertainties Accurate values or trends Domain of validity Utility Psychology of decision Publishing reliable results Conclusions Effect of improving the calculated reference data Weak interaction benchmark data set (S22) given set of molecules 2006 calculations (Jurecka et al.) 2011 calculations (Marshall et al.) Percentage of “correct” results changes from 55% to 86% “Correct”: within ±0.5 kcal/mol with B3LYP corrected for dispersion by XDM 20 15 10 5 20 15 10 5 reference B3LYP 28 / 91
  • 32.
    Trust A. Savin Introduction Overview Properties From experiment Fromcalculations Statistical indicators Many indicators Indicators can yield different ranking When the mean has no meaning Indicators are affected by sampling Human decisions Living with uncertainties Accurate values or trends Domain of validity Utility Psychology of decision Publishing reliable results Conclusions Filtering using “reliable” calculations Perform reference calculations with a different method, and refrain from accepting results when the two methods disagree. Example: Perform point-wise an expensive calculation to verify cheap calculation. 29 / 91
  • 33.
    Trust A. Savin Introduction Overview Properties From experiment Fromcalculations Statistical indicators Many indicators Indicators can yield different ranking When the mean has no meaning Indicators are affected by sampling Human decisions Living with uncertainties Accurate values or trends Domain of validity Utility Psychology of decision Publishing reliable results Conclusions Why filtering not necessarily is an improvement Cases: Model says Filter selects Filter rejects result reliable a (correct) b (error) result unreliable c (error) d (correct) Fraction of reliable results: before selection by filter: (a + b)/(a + b + c + d) after selection by filter: a/(a + c) Filtering brings no improvement when (a + b)/(a + b + c + d) ≥ a/(a + c), or bc ≥ ad 30 / 91
  • 34.
    Trust A. Savin Introduction Overview Properties From experiment Fromcalculations Statistical indicators Many indicators Indicators can yield different ranking When the mean has no meaning Indicators are affected by sampling Human decisions Living with uncertainties Accurate values or trends Domain of validity Utility Psychology of decision Publishing reliable results Conclusions Filters not always successful Band gaps in 28 cubic crystals Filter is too restrictive, but reliable PBEsol PBE filter selects (39%) PBE filter rejects (61%) Result reliable (93%) 11 15 Result unreliable(7%) 0 2 100% (11 out of 11) results selected by PBE filter are reliable Filter selects reasonably well, and is useless PBEsol PBE0 filter selects (92%) PBE0 filter rejects (8%) Result reliable (93%) 24 2 Result unreliable(7%) 2 0 Results selected by PBE0 filter are reliable, ≈ as without filter, but systems excluded. PBEsol and PBE0 make the same mistake: unreliable results are close, and thus wrongly selected (ad = 0). Some reliable PBEsol results are not close to PBE0, and rejected (bc = 0). Thus, ad < bc. 31 / 91
  • 35.
    Trust A. Savin Introduction Overview Properties From experiment Fromcalculations Statistical indicators Many indicators Indicators can yield different ranking When the mean has no meaning Indicators are affected by sampling Human decisions Living with uncertainties Accurate values or trends Domain of validity Utility Psychology of decision Publishing reliable results Conclusions Reference data. Summary Pitfalls: Experimental data Error bars Corrections applied Model used Calculated data may not be accurate enough 32 / 91
  • 36.
    Trust A. Savin Introduction Overview Properties From experiment Fromcalculations Statistical indicators Many indicators Indicators can yield different ranking When the mean has no meaning Indicators are affected by sampling Human decisions Living with uncertainties Accurate values or trends Domain of validity Utility Psychology of decision Publishing reliable results Conclusions Benchmarks Model and benchmark? 33 / 91
  • 37.
    Trust A. Savin Introduction Overview Properties From experiment Fromcalculations Statistical indicators Many indicators Indicators can yield different ranking When the mean has no meaning Indicators are affected by sampling Human decisions Living with uncertainties Accurate values or trends Domain of validity Utility Psychology of decision Publishing reliable results Conclusions Benchmarks Benchmark and reality 33 / 91
  • 38.
    Trust A. Savin Introduction Overview Properties From experiment Fromcalculations Statistical indicators Many indicators Indicators can yield different ranking When the mean has no meaning Indicators are affected by sampling Human decisions Living with uncertainties Accurate values or trends Domain of validity Utility Psychology of decision Publishing reliable results Conclusions Reference data. Conclusion To judge the quality of a method we compare to benchmarks. These can be inappropriate. Need for critical analysis of the accuracy of the reference data from the perspective of the problem under study. 34 / 91
  • 39.
    Trust A. Savin Introduction Overview Properties From experiment Fromcalculations Statistical indicators Many indicators Indicators can yield different ranking When the mean has no meaning Indicators are affected by sampling Human decisions Living with uncertainties Accurate values or trends Domain of validity Utility Psychology of decision Publishing reliable results Conclusions Reference data. Conclusion To judge the quality of a method we compare to benchmarks. These can be inappropriate. Need for critical analysis of the accuracy of the reference data from the perspective of the problem under study. Once we have decided about reference data, we have to define a measure quantifying our choice: statistical indicators 34 / 91
  • 40.
    Trust A. Savin Introduction Overview Properties From experiment Fromcalculations Statistical indicators Many indicators Indicators can yield different ranking When the mean has no meaning Indicators are affected by sampling Human decisions Living with uncertainties Accurate values or trends Domain of validity Utility Psychology of decision Publishing reliable results Conclusions Overview Properties we study Measures of satisfaction (statistical indicators) Decisions to take (human) 35 / 91
  • 41.
    Trust A. Savin Introduction Overview Properties From experiment Fromcalculations Statistical indicators Many indicators Indicators can yield different ranking When the mean has no meaning Indicators are affected by sampling Human decisions Living with uncertainties Accurate values or trends Domain of validity Utility Psychology of decision Publishing reliable results Conclusions Diagnostic tools Weighing of the heart Book of the Dead, Papyrus of Ani, British Museum With large amount of numbers: need for representative numbers 36 / 91
  • 42.
    Trust A. Savin Introduction Overview Properties From experiment Fromcalculations Statistical indicators Many indicators Indicators can yield different ranking When the mean has no meaning Indicators are affected by sampling Human decisions Living with uncertainties Accurate values or trends Domain of validity Utility Psychology of decision Publishing reliable results Conclusions Statistical indicators. Overview Many indicators (mean, median, mode, ...) Role of sampling 37 / 91
  • 43.
    Trust A. Savin Introduction Overview Properties From experiment Fromcalculations Statistical indicators Many indicators Indicators can yield different ranking When the mean has no meaning Indicators are affected by sampling Human decisions Living with uncertainties Accurate values or trends Domain of validity Utility Psychology of decision Publishing reliable results Conclusions Many indicators Indicators can yield different ranking When the mean has no meaning 38 / 91
  • 44.
    Trust A. Savin Introduction Overview Properties From experiment Fromcalculations Statistical indicators Many indicators Indicators can yield different ranking When the mean has no meaning Indicators are affected by sampling Human decisions Living with uncertainties Accurate values or trends Domain of validity Utility Psychology of decision Publishing reliable results Conclusions Indicators can yield different ranking 39 / 91
  • 45.
    Trust A. Savin Introduction Overview Properties From experiment Fromcalculations Statistical indicators Many indicators Indicators can yield different ranking When the mean has no meaning Indicators are affected by sampling Human decisions Living with uncertainties Accurate values or trends Domain of validity Utility Psychology of decision Publishing reliable results Conclusions Indicators do not yield the same ordering of methods Absolute errors: |xi | Mean: 1 n i=1,n |xi | Median: half of the |xi | are < median, half > median Maximum: max(|x1|, |x2|, . . . , |xN |) Results for the G3/99 benchmark set (kcal/mol) Method Mean Median Max B3LYP 4 2 34 LC-ωPBE 5 4 25 Which method is better? 40 / 91
  • 46.
    Trust A. Savin Introduction Overview Properties From experiment Fromcalculations Statistical indicators Many indicators Indicators can yield different ranking When the mean has no meaning Indicators are affected by sampling Human decisions Living with uncertainties Accurate values or trends Domain of validity Utility Psychology of decision Publishing reliable results Conclusions Condensing data by indicators Radiation around Fukushima Daiichi NPS NNSA 04/03/2011 Evacuation at 30 km, exclusion zone 20 km Radiation may more important at >30 km than at 10 km. Mean: bad indicator 41 / 91
  • 47.
    Trust A. Savin Introduction Overview Properties From experiment Fromcalculations Statistical indicators Many indicators Indicators can yield different ranking When the mean has no meaning Indicators are affected by sampling Human decisions Living with uncertainties Accurate values or trends Domain of validity Utility Psychology of decision Publishing reliable results Conclusions Origin of problems Error distribution, and its mean mean is relevant irrelevant 42 / 91
  • 48.
    Trust A. Savin Introduction Overview Properties From experiment Fromcalculations Statistical indicators Many indicators Indicators can yield different ranking When the mean has no meaning Indicators are affected by sampling Human decisions Living with uncertainties Accurate values or trends Domain of validity Utility Psychology of decision Publishing reliable results Conclusions A simple model for parametrized approximations A mathematically (=clearly) defined problem Model Analogy x ∈ (0, 1) Choice of system (random) (1 + x)2 Exact result 1 + mx Approximation m ∈ (2, 3) Parameter y = (1 + mx) − (1 + x)2 Error of the approximation Objective: “Recommend the best m” 43 / 91
  • 49.
    Trust A. Savin Introduction Overview Properties From experiment Fromcalculations Statistical indicators Many indicators Indicators can yield different ranking When the mean has no meaning Indicators are affected by sampling Human decisions Living with uncertainties Accurate values or trends Domain of validity Utility Psychology of decision Publishing reliable results Conclusions A set of simple models m = 2 using exact value of function and derivative at origin m = 3 using exact value of function at origin and endpoint 2 < m < 3 using exact value of function at origin, and some other criterion of similitude 44 / 91
  • 50.
    Trust A. Savin Introduction Overview Properties From experiment Fromcalculations Statistical indicators Many indicators Indicators can yield different ranking When the mean has no meaning Indicators are affected by sampling Human decisions Living with uncertainties Accurate values or trends Domain of validity Utility Psychology of decision Publishing reliable results Conclusions Approximations do not yield normally distributed errors Model and its error distribution 45 / 91
  • 51.
    Trust A. Savin Introduction Overview Properties From experiment Fromcalculations Statistical indicators Many indicators Indicators can yield different ranking When the mean has no meaning Indicators are affected by sampling Human decisions Living with uncertainties Accurate values or trends Domain of validity Utility Psychology of decision Publishing reliable results Conclusions Absolute error distributions Origin of difference between medians (red), max, mode, . . . B3LYP LC wPBE count 0204060 count 0 20 40 60 0 10 20 30 absolute error Two density functional methods, for G3/99 46 / 91
  • 52.
    Trust A. Savin Introduction Overview Properties From experiment Fromcalculations Statistical indicators Many indicators Indicators can yield different ranking When the mean has no meaning Indicators are affected by sampling Human decisions Living with uncertainties Accurate values or trends Domain of validity Utility Psychology of decision Publishing reliable results Conclusions When the mean has no meaning 47 / 91
  • 53.
    Trust A. Savin Introduction Overview Properties From experiment Fromcalculations Statistical indicators Many indicators Indicators can yield different ranking When the mean has no meaning Indicators are affected by sampling Human decisions Living with uncertainties Accurate values or trends Domain of validity Utility Psychology of decision Publishing reliable results Conclusions When the mean has no meaning h 1 Α α is uniformly distributed on (0, π/2). What is the mean value of h? 48 / 91
  • 54.
    Trust A. Savin Introduction Overview Properties From experiment Fromcalculations Statistical indicators Many indicators Indicators can yield different ranking When the mean has no meaning Indicators are affected by sampling Human decisions Living with uncertainties Accurate values or trends Domain of validity Utility Psychology of decision Publishing reliable results Conclusions When the mean has no meaning h 1 Α α is uniformly distributed on (0, π/2). What is the mean value of h? π/2 0 dα tan(α) = ∞ 0 h d arctan(h) = ∞ 0 h dh 1+h2 = ∞ Variance also diverges. cf. Lorentzian shape for peaks in spectroscopy 48 / 91
  • 55.
    Trust A. Savin Introduction Overview Properties From experiment Fromcalculations Statistical indicators Many indicators Indicators can yield different ranking When the mean has no meaning Indicators are affected by sampling Human decisions Living with uncertainties Accurate values or trends Domain of validity Utility Psychology of decision Publishing reliable results Conclusions No mean, no variance, ...? B3LYP distribution of atomization energy errors (G3/99) Distributed as 2 πa (1 + (h/a)2 )−1 ? 0 5 10 15 20 25 30 35 0 50 100 150 200 absolute error kcal mol frequency B3LYP Mean on sample: 4 kcal/mol Explanation: small errors accumulate in larger systems 49 / 91
  • 56.
    Trust A. Savin Introduction Overview Properties From experiment Fromcalculations Statistical indicators Many indicators Indicators can yield different ranking When the mean has no meaning Indicators are affected by sampling Human decisions Living with uncertainties Accurate values or trends Domain of validity Utility Psychology of decision Publishing reliable results Conclusions Shape of distributions Nearly uniform distribution of PBE absolute errors, G3/99 0 10 20 30 40 50 0 50 100 150 absolute error kcal mol frequency PBE 50 / 91
  • 57.
    Trust A. Savin Introduction Overview Properties From experiment Fromcalculations Statistical indicators Many indicators Indicators can yield different ranking When the mean has no meaning Indicators are affected by sampling Human decisions Living with uncertainties Accurate values or trends Domain of validity Utility Psychology of decision Publishing reliable results Conclusions Small errors accumulate in larger systems. A simple model Error of approximation when detaching an atom from a chain with n bonds (n + 1 atoms) ≈ x x Error in the atomization energy: x n Mean error for chains of n = 1, . . . , m: 1 m m n=1 x n = 1 m x m(m + 1)/2 = x(m + 1)/2 diverges when m → ∞ The error of the atomization energy per atom → x, when m → ∞. 51 / 91
  • 58.
    Trust A. Savin Introduction Overview Properties From experiment Fromcalculations Statistical indicators Many indicators Indicators can yield different ranking When the mean has no meaning Indicators are affected by sampling Human decisions Living with uncertainties Accurate values or trends Domain of validity Utility Psychology of decision Publishing reliable results Conclusions Small errors accumulate in larger systems. Atomization energies G3, G2, and G1 benchmark sets with different functionals MAE MAE/atom G1 G2 G3 B3LYP CAM-B3LYP LC-ωPBE B97-1 BLYP PBE0 PW86PBE PBE BH&HLYP G1 G2 G3 B3LYP CAM B3LYP LC ΩPBE B97 1 BLYP PBE0 PW86PBE PBE BH&HLYP 52 / 91
  • 59.
    Trust A. Savin Introduction Overview Properties From experiment Fromcalculations Statistical indicators Many indicators Indicators can yield different ranking When the mean has no meaning Indicators are affected by sampling Human decisions Living with uncertainties Accurate values or trends Domain of validity Utility Psychology of decision Publishing reliable results Conclusions Indicators are affected by sampling 53 / 91
  • 60.
    Trust A. Savin Introduction Overview Properties From experiment Fromcalculations Statistical indicators Many indicators Indicators can yield different ranking When the mean has no meaning Indicators are affected by sampling Human decisions Living with uncertainties Accurate values or trends Domain of validity Utility Psychology of decision Publishing reliable results Conclusions Uncertainty of mean 54 / 91
  • 61.
    Trust A. Savin Introduction Overview Properties From experiment Fromcalculations Statistical indicators Many indicators Indicators can yield different ranking When the mean has no meaning Indicators are affected by sampling Human decisions Living with uncertainties Accurate values or trends Domain of validity Utility Psychology of decision Publishing reliable results Conclusions Finite sampling brings uncertainty of mean Simple example Uniform sampling on interval (0,1): Distribution of 100 means of samples of 100 0.45 0.50 0.55 0 5 10 15 mean count 55 / 91
  • 62.
    Trust A. Savin Introduction Overview Properties From experiment Fromcalculations Statistical indicators Many indicators Indicators can yield different ranking When the mean has no meaning Indicators are affected by sampling Human decisions Living with uncertainties Accurate values or trends Domain of validity Utility Psychology of decision Publishing reliable results Conclusions Finite sampling brings uncertainty of mean G3/99 MAEs (and subsets with randomly reduced sample size - from 221 to 22) Full G3 99 set Subset 1 Subset 2 Subset 3 1 2 3 4 5 6 MAE kcal mol B97 1 CAM B3LYP B3LYP 56 / 91
  • 63.
    Trust A. Savin Introduction Overview Properties From experiment Fromcalculations Statistical indicators Many indicators Indicators can yield different ranking When the mean has no meaning Indicators are affected by sampling Human decisions Living with uncertainties Accurate values or trends Domain of validity Utility Psychology of decision Publishing reliable results Conclusions Finite sampling brings uncertainty of mean Benchmarks for weak interactions 0.2 0.3 0.4 0.5 0.6 B3LYP BLYP LC −ωPBE PW 86PBEBH &H LYPC AM −B3LYPPBE0 B97−1 PBE MeanAbsoluteError(kcal/mol) KB49 S22 S66 S115 Are differences between methods important? 57 / 91
  • 64.
    Trust A. Savin Introduction Overview Properties From experiment Fromcalculations Statistical indicators Many indicators Indicators can yield different ranking When the mean has no meaning Indicators are affected by sampling Human decisions Living with uncertainties Accurate values or trends Domain of validity Utility Psychology of decision Publishing reliable results Conclusions Statistical indicators. Summary Different statistical indicators can lead to different conclusions, and may even not exist Sampling is unavailable, and brings uncertainty 58 / 91
  • 65.
    Trust A. Savin Introduction Overview Properties From experiment Fromcalculations Statistical indicators Many indicators Indicators can yield different ranking When the mean has no meaning Indicators are affected by sampling Human decisions Living with uncertainties Accurate values or trends Domain of validity Utility Psychology of decision Publishing reliable results Conclusions Composite Portraiture 59 / 91
  • 66.
    Trust A. Savin Introduction Overview Properties From experiment Fromcalculations Statistical indicators Many indicators Indicators can yield different ranking When the mean has no meaning Indicators are affected by sampling Human decisions Living with uncertainties Accurate values or trends Domain of validity Utility Psychology of decision Publishing reliable results Conclusions Statistical indicators. Conclusions Statistical indicators (MAE, etc.) are useful, maybe unavoidable, but can induce into error, and thus should be used with care In spite of mathematical formulation, supplementary criteria needed 60 / 91
  • 67.
    Trust A. Savin Introduction Overview Properties From experiment Fromcalculations Statistical indicators Many indicators Indicators can yield different ranking When the mean has no meaning Indicators are affected by sampling Human decisions Living with uncertainties Accurate values or trends Domain of validity Utility Psychology of decision Publishing reliable results Conclusions Overview Properties we study Measures of satisfaction (statistical indicators) Decisions to take (human) 61 / 91
  • 68.
    Trust A. Savin Introduction Overview Properties From experiment Fromcalculations Statistical indicators Many indicators Indicators can yield different ranking When the mean has no meaning Indicators are affected by sampling Human decisions Living with uncertainties Accurate values or trends Domain of validity Utility Psychology of decision Publishing reliable results Conclusions Actions (decisions) after knowing the results of the (statistical) analysis Living with uncertainties Accurate values or accurate trends Domain of validity Utility Psychology of decision Publishing only correct results 62 / 91
  • 69.
    Trust A. Savin Introduction Overview Properties From experiment Fromcalculations Statistical indicators Many indicators Indicators can yield different ranking When the mean has no meaning Indicators are affected by sampling Human decisions Living with uncertainties Accurate values or trends Domain of validity Utility Psychology of decision Publishing reliable results Conclusions Living with uncertainties 63 / 91
  • 70.
    Trust A. Savin Introduction Overview Properties From experiment Fromcalculations Statistical indicators Many indicators Indicators can yield different ranking When the mean has no meaning Indicators are affected by sampling Human decisions Living with uncertainties Accurate values or trends Domain of validity Utility Psychology of decision Publishing reliable results Conclusions Uncertainties in reference values affect judgment of calculated data Lattice constants in some cubic crystals: MSE±RMSD LDA: -3.5±2.7 pm HSEsol (best among tested functionals): 0.0±1.5 pm Is the source of the error in the reference data? Is there a need for better functionals? 64 / 91
  • 71.
    Trust A. Savin Introduction Overview Properties From experiment Fromcalculations Statistical indicators Many indicators Indicators can yield different ranking When the mean has no meaning Indicators are affected by sampling Human decisions Living with uncertainties Accurate values or trends Domain of validity Utility Psychology of decision Publishing reliable results Conclusions Uncertainty in reference data propagates to ranking of functionals What is agreement with experimental data, if we do not know how accurate experimental data are? Percentage of computed (dispersion corrected) results in agreement with experimental (G3/99) atomization energies, within ±x kcal/mol Method x = 0.5 x = 1 x = 2 x = 4 BLYP 9 14 24 42 B3LYP 9 22 44 73 CAMB3LYP 7 13 29 57 65 / 91
  • 72.
    Trust A. Savin Introduction Overview Properties From experiment Fromcalculations Statistical indicators Many indicators Indicators can yield different ranking When the mean has no meaning Indicators are affected by sampling Human decisions Living with uncertainties Accurate values or trends Domain of validity Utility Psychology of decision Publishing reliable results Conclusions Accurate values or trends? 66 / 91
  • 73.
    Trust A. Savin Introduction Overview Properties From experiment Fromcalculations Statistical indicators Many indicators Indicators can yield different ranking When the mean has no meaning Indicators are affected by sampling Human decisions Living with uncertainties Accurate values or trends Domain of validity Utility Psychology of decision Publishing reliable results Conclusions Accurate values or trends? Which method is better? 0 Good mean (more accurate) Good variance (better trend) MAE not a good indicator: mixes systematic with random errors 66 / 91
  • 74.
    Trust A. Savin Introduction Overview Properties From experiment Fromcalculations Statistical indicators Many indicators Indicators can yield different ranking When the mean has no meaning Indicators are affected by sampling Human decisions Living with uncertainties Accurate values or trends Domain of validity Utility Psychology of decision Publishing reliable results Conclusions Mean errors and variance for band gap calculations 2 0 2 4 6 0.8 1.0 1.2 1.4 1.6 1.8 2.0 ME Σ HF LDA PBE PBEsol PBE0 PBEsol0 B97 B3LYP HSE06 HSEsol HISS LC wPBE LC wPBEsol RSHXLDA wB97 wB97 X Prefer HISS? 67 / 91
  • 75.
    Trust A. Savin Introduction Overview Properties From experiment Fromcalculations Statistical indicators Many indicators Indicators can yield different ranking When the mean has no meaning Indicators are affected by sampling Human decisions Living with uncertainties Accurate values or trends Domain of validity Utility Psychology of decision Publishing reliable results Conclusions Correcting for the mean error of band gaps Constant shift easy to correct (new approximation): error → error-ME (choice by σ) 2 0 2 4 6 0.8 1.0 1.2 1.4 1.6 1.8 2.0 ME Σ HF LDA PBE PBEsol PBE0 PBEsol0 B97 B3LYP HSE06 HSEsol HISS LC wPBE LC wPBEsol RSHXLDA wB97 wB97 X Prefer LC-ωPBEsol? With one parameter HF can be made as good as HISS. 68 / 91
  • 76.
    Trust A. Savin Introduction Overview Properties From experiment Fromcalculations Statistical indicators Many indicators Indicators can yield different ranking When the mean has no meaning Indicators are affected by sampling Human decisions Living with uncertainties Accurate values or trends Domain of validity Utility Psychology of decision Publishing reliable results Conclusions Correcting lattice constants 69 / 91
  • 77.
    Trust A. Savin Introduction Overview Properties From experiment Fromcalculations Statistical indicators Many indicators Indicators can yield different ranking When the mean has no meaning Indicators are affected by sampling Human decisions Living with uncertainties Accurate values or trends Domain of validity Utility Psychology of decision Publishing reliable results Conclusions Domain of validity 70 / 91
  • 78.
    Trust A. Savin Introduction Overview Properties From experiment Fromcalculations Statistical indicators Many indicators Indicators can yield different ranking When the mean has no meaning Indicators are affected by sampling Human decisions Living with uncertainties Accurate values or trends Domain of validity Utility Psychology of decision Publishing reliable results Conclusions Relevance of the benchmark data set Questions Is the benchmark relevant for the problem of interest? E.g., not when benchmark designed for one property, and used for another Is the benchmark biased? The benchmark is based upon systems that may be different from the system under study, e.g., because of a shift of interest with time Example: Do not expect good large band gaps, based upon the experience with small band gaps 0 2 4 6 8 10 12 14 0 1 2 3 0 1 2 3 band gap eV bandgapeV HSE06 71 / 91
  • 79.
    Trust A. Savin Introduction Overview Properties From experiment Fromcalculations Statistical indicators Many indicators Indicators can yield different ranking When the mean has no meaning Indicators are affected by sampling Human decisions Living with uncertainties Accurate values or trends Domain of validity Utility Psychology of decision Publishing reliable results Conclusions Which method is better? Band gaps of a set of crystals: better use HSE06 or HISS? 0 2 4 6 8 10 12 0.0 0.5 1.0 1.5 band gap eV absoluteerroreV HSE06 HISS 72 / 91
  • 80.
    Trust A. Savin Introduction Overview Properties From experiment Fromcalculations Statistical indicators Many indicators Indicators can yield different ranking When the mean has no meaning Indicators are affected by sampling Human decisions Living with uncertainties Accurate values or trends Domain of validity Utility Psychology of decision Publishing reliable results Conclusions Avoiding mixing? Not always possible: systems where different “components” are simultaneously needed, the relative importance of “components” is not reproduced the same way by different methods. 73 / 91
  • 81.
    Trust A. Savin Introduction Overview Properties From experiment Fromcalculations Statistical indicators Many indicators Indicators can yield different ranking When the mean has no meaning Indicators are affected by sampling Human decisions Living with uncertainties Accurate values or trends Domain of validity Utility Psychology of decision Publishing reliable results Conclusions When mixing produces inversions We split the S115 benchmark set into: 1. H-bonded (HB) 2. weakly interacting (WI) One of the method gives better MAEs for both benchmark sets. Situations where the worse method gives better results? 74 / 91
  • 82.
    Trust A. Savin Introduction Overview Properties From experiment Fromcalculations Statistical indicators Many indicators Indicators can yield different ranking When the mean has no meaning Indicators are affected by sampling Human decisions Living with uncertainties Accurate values or trends Domain of validity Utility Psychology of decision Publishing reliable results Conclusions When mixing produces inversions We split the S115 benchmark set into: 1. H-bonded (HB) 2. weakly interacting (WI) One of the method gives better MAEs for both benchmark sets. Situations where the worse method gives better results? Yes, when weighing of HB and WI is different! HB WI 4 5 6 7 8 9 10 Interaction MAE B3LYP PBE0 74 / 91
  • 83.
    Trust A. Savin Introduction Overview Properties From experiment Fromcalculations Statistical indicators Many indicators Indicators can yield different ranking When the mean has no meaning Indicators are affected by sampling Human decisions Living with uncertainties Accurate values or trends Domain of validity Utility Psychology of decision Publishing reliable results Conclusions Best method not for all properties Mean absolute errors Method Lattice constant (pm) Bulk modulus (GPa) HSEsol 1 7 PBE0 4 5 75 / 91
  • 84.
    Trust A. Savin Introduction Overview Properties From experiment Fromcalculations Statistical indicators Many indicators Indicators can yield different ranking When the mean has no meaning Indicators are affected by sampling Human decisions Living with uncertainties Accurate values or trends Domain of validity Utility Psychology of decision Publishing reliable results Conclusions Utility 76 / 91
  • 85.
    Trust A. Savin Introduction Overview Properties From experiment Fromcalculations Statistical indicators Many indicators Indicators can yield different ranking When the mean has no meaning Indicators are affected by sampling Human decisions Living with uncertainties Accurate values or trends Domain of validity Utility Psychology of decision Publishing reliable results Conclusions Utility of a calculation Choose between A and B Result A (expensive) B (cheap) A better than B good bad A as good as B good good A worse than B bad good 77 / 91
  • 86.
    Trust A. Savin Introduction Overview Properties From experiment Fromcalculations Statistical indicators Many indicators Indicators can yield different ranking When the mean has no meaning Indicators are affected by sampling Human decisions Living with uncertainties Accurate values or trends Domain of validity Utility Psychology of decision Publishing reliable results Conclusions Quantify the utility of a calculation “Gain” obtained by choosing between A and B cheap: +1, expensive, -1; good: +2, bad, -2 A (expensive) B (cheap) A better than B good (+2-1) bad (-2+1) A as good as B good (+2-1) good (+2+1) A worse than B bad (-2-1) good (+2+1) 78 / 91
  • 87.
    Trust A. Savin Introduction Overview Properties From experiment Fromcalculations Statistical indicators Many indicators Indicators can yield different ranking When the mean has no meaning Indicators are affected by sampling Human decisions Living with uncertainties Accurate values or trends Domain of validity Utility Psychology of decision Publishing reliable results Conclusions Quantify the utility of a calculation for lattice constants Choice between A (PBEsol) and B (LDA) for lattice constants A (expensive) B (cheap) probability A better than B 1 -1 1/2 A as good as B 1 3 1/4 A worse than B -3 3 1/4 “Gain” 0 1 MAE 2.4 pm 3.5 pm MAE (or probability) and “gain” give contradictory recommendations 79 / 91
  • 88.
    Trust A. Savin Introduction Overview Properties From experiment Fromcalculations Statistical indicators Many indicators Indicators can yield different ranking When the mean has no meaning Indicators are affected by sampling Human decisions Living with uncertainties Accurate values or trends Domain of validity Utility Psychology of decision Publishing reliable results Conclusions Psychology of decision Market behavior 80 / 91
  • 89.
    Trust A. Savin Introduction Overview Properties From experiment Fromcalculations Statistical indicators Many indicators Indicators can yield different ranking When the mean has no meaning Indicators are affected by sampling Human decisions Living with uncertainties Accurate values or trends Domain of validity Utility Psychology of decision Publishing reliable results Conclusions What is the best method? Safest result? Minimize maximal error Most stable error on average? 81 / 91
  • 90.
    Trust A. Savin Introduction Overview Properties From experiment Fromcalculations Statistical indicators Many indicators Indicators can yield different ranking When the mean has no meaning Indicators are affected by sampling Human decisions Living with uncertainties Accurate values or trends Domain of validity Utility Psychology of decision Publishing reliable results Conclusions Share portfolio Dow Jones Industrial Average on 2 June 2014 Company Yearly change Pfitzer Inc -3.26 Walt Disney Co 9.96 http://money.cnn.com/data/markets/dow Share portfolio does not insure highest gain, but enhances stability Supposing long-term gain at stock exchange 82 / 91
  • 91.
    Trust A. Savin Introduction Overview Properties From experiment Fromcalculations Statistical indicators Many indicators Indicators can yield different ranking When the mean has no meaning Indicators are affected by sampling Human decisions Living with uncertainties Accurate values or trends Domain of validity Utility Psychology of decision Publishing reliable results Conclusions Using a portfolio of methods? Using different methods, in the right proportion can enhance stability of results Do 25% of calculations with RPA and 75% with RPAx HB7 WI8 Type of interaction RPA RPAx Method 2.0 2.5 3.0 Error Data from W. Zhu et al, JCP 2010 83 / 91
  • 92.
    Trust A. Savin Introduction Overview Properties From experiment Fromcalculations Statistical indicators Many indicators Indicators can yield different ranking When the mean has no meaning Indicators are affected by sampling Human decisions Living with uncertainties Accurate values or trends Domain of validity Utility Psychology of decision Publishing reliable results Conclusions Using a portfolio of methods? Using different methods, in the right proportion can enhance stability of results Do 25% of calculations with RPA and 75% with RPAx HB7 WI8 Type of interaction RPA RPAx Method 2.0 2.5 3.0 Error Data from W. Zhu et al, JCP 2010 Mixing by community Invisible hand of the market 83 / 91
  • 93.
    Trust A. Savin Introduction Overview Properties From experiment Fromcalculations Statistical indicators Many indicators Indicators can yield different ranking When the mean has no meaning Indicators are affected by sampling Human decisions Living with uncertainties Accurate values or trends Domain of validity Utility Psychology of decision Publishing reliable results Conclusions The probability to predict the correct result Assumptions: New calculations yield acceptable results, distributed as in the benchmark set. The probability to obtain a good result is given by p = a t a: number of results within the accepted threshold, t: total number of results in the benchmark set Probability to obtain at least k correct answers, out of 10 (binomial distribution) 10 j=k 10 j pj (1 − p)10−j 84 / 91
  • 94.
    Trust A. Savin Introduction Overview Properties From experiment Fromcalculations Statistical indicators Many indicators Indicators can yield different ranking When the mean has no meaning Indicators are affected by sampling Human decisions Living with uncertainties Accurate values or trends Domain of validity Utility Psychology of decision Publishing reliable results Conclusions Probability to publish n correct results out of ten The probability to obtain B3LYP+XDM atomization energies with absolute errors per atom less than a chosen maximum acceptable value, for a set of n systems and assuming the same error distribution as the G3 data set.B3LYP errors, based upon G3/99 atomization energies/atom 0.0 0.2 0.4 0.6 0.8 1.0 0.0 0.5 1.0 1.5 2.0 2.5 3.0 3.5 4.0 4.5 5.0 Probability Maximum acceptable absolute error (kcal/mol) 10 5 2 1 Even with a very large tolerance (3 kcal/mol per atom) it is more probable to not have all ten results right, than to have them all right. 85 / 91
  • 95.
    Trust A. Savin Introduction Overview Properties From experiment Fromcalculations Statistical indicators Many indicators Indicators can yield different ranking When the mean has no meaning Indicators are affected by sampling Human decisions Living with uncertainties Accurate values or trends Domain of validity Utility Psychology of decision Publishing reliable results Conclusions Human decisions. Summary Not necessarily the same choice, if made for best accuracy, or for best trend The community’s choice (experience with one class of systems, properties, ...) might not be the best adapted to the problem under study Criteria from decision theory can orient choices otherwise than “diagnostic tools” (like MAE, etc.) Statistics tell us that there are many unreliable results in the literature 86 / 91
  • 96.
    Trust A. Savin Introduction Overview Properties From experiment Fromcalculations Statistical indicators Many indicators Indicators can yield different ranking When the mean has no meaning Indicators are affected by sampling Human decisions Living with uncertainties Accurate values or trends Domain of validity Utility Psychology of decision Publishing reliable results Conclusions Human decision. Conclusions Decision taking is unavoidable. Specifying the criteria for the decision taken should be part of the study. 87 / 91
  • 97.
    Trust A. Savin Introduction Overview Properties From experiment Fromcalculations Statistical indicators Many indicators Indicators can yield different ranking When the mean has no meaning Indicators are affected by sampling Human decisions Living with uncertainties Accurate values or trends Domain of validity Utility Psychology of decision Publishing reliable results Conclusions Conclusions What should I do ...? Auguste Rodin Le Penseur Mus´ee Rodin 88 / 91
  • 98.
    Trust A. Savin Introduction Overview Properties From experiment Fromcalculations Statistical indicators Many indicators Indicators can yield different ranking When the mean has no meaning Indicators are affected by sampling Human decisions Living with uncertainties Accurate values or trends Domain of validity Utility Psychology of decision Publishing reliable results Conclusions Conclusions Many pitfalls. Recommendations Learning statistics and decision theory is useful when working with large amounts of data 89 / 91
  • 99.
    Trust A. Savin Introduction Overview Properties From experiment Fromcalculations Statistical indicators Many indicators Indicators can yield different ranking When the mean has no meaning Indicators are affected by sampling Human decisions Living with uncertainties Accurate values or trends Domain of validity Utility Psychology of decision Publishing reliable results Conclusions Conclusions Many pitfalls. Recommendations Learning statistics and decision theory is useful when working with large amounts of data Good old effort for understanding should not be forgotten 35th Midwest Theoretical Chemistry Conference, Ames (2003) Speaker: I use DFT, because it is an easy to use black box, and does not require much thinking. K. Ruedenberg: Why is it a bad thing to think? Calculations get easy, but expertize still needed 89 / 91
  • 100.
    Trust A. Savin Introduction Overview Properties From experiment Fromcalculations Statistical indicators Many indicators Indicators can yield different ranking When the mean has no meaning Indicators are affected by sampling Human decisions Living with uncertainties Accurate values or trends Domain of validity Utility Psychology of decision Publishing reliable results Conclusions Some (difficult) questions to try to answer What do we want to know from the calculation? Is the theory we use capable to provide it? What accuracy do we need? Do we expect the approximations we make give the necessary accuracy? On what is based our judgment (knowledge, experience, advice, impact factor, ...)? Are the reference data significant for our problem? How do we judge the accuracy of the approximation (sufficient data, significant indicators, . . . ) ? Is their accuracy sufficient for our purpose? If the accuracy is not sufficient, what are we willing to give up? . . . 90 / 91
  • 101.
    Trust A. Savin Introduction Overview Properties From experiment Fromcalculations Statistical indicators Many indicators Indicators can yield different ranking When the mean has no meaning Indicators are affected by sampling Human decisions Living with uncertainties Accurate values or trends Domain of validity Utility Psychology of decision Publishing reliable results Conclusions Progress in science does not necessarily come from better accuracy Nearly uniform distribution of BH&HLYP absolute errors, G3/99 0 10 20 30 40 50 0 50 100 150 absolute error kcal mol frequency BH&HLYP BH&H: at the origin of hybrids 91 / 91