Statistical Significance vs Practical Significance in Data Analysis
•Download as PPTX, PDF•
0 likes•160 views

Recommended

Recommended
More Related Content
What's hot
What's hot (19)
Similar to Statistical Significance vs Practical Significance in Data Analysis
Similar to Statistical Significance vs Practical Significance in Data Analysis (20)
More from Brian Lin
More from Brian Lin (9)
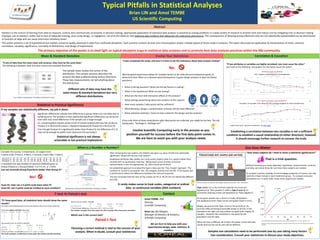
Statistical Significance vs Practical Significance in Data Analysis
- 1. If my samples are statistically different, my job is done. Significant differences indicate that differences in group means are not likely due to sampling error. The problem is that statistically significant differences can be found even with very small differences if the sample size is large enough. Ex: compare global volume values (cm2) of tresses treated with two hair products. Product A is 58.32±0.81 (mean ± Standard Deviation) & Product B is 56.01±0.43. Even though Product A is significantly better than Product B, the difference of 2.31 may not be enough to justify more resources into pursuing it. Statistical significance is not always actionable or has practical implications. It rarely makes sense to treat scales, categorical or ordinal data as continuous variables (AKA numbers). Typical Pitfalls in Statistical Analyses Brian LIN and Amol TEMBE US Scientific Computing Amol TEMBE, PhD Director, Scientific Computing Brian Lin, MS MAppSc Manager of Statistics & Analytics, Scientific Computing We are here to help you with your experimental design, data, statistics, & numbers. Contact Mean & Standard Deviation Abstract “If sets of data have the same mean and variance, they must be the same data.” The following 4 datasets have the same means and standard deviations. From "Pattern Classification" 2nd Edition by Richard O. Duda The sample mean locates the center of the distribution. The sample variance describes the amount the data scattered along various directions. Those two measurements not tell anything about the distribution. Different sets of data may have the same means & standard deviations but very different distributions. Correlation & Causation “If two attributes or variables are highly correlated, one must cause the other.” Let’s look at the following two graphs. Do one factor cause the other? Graphs from book “Spurious Correlations” by Tyler Vigen Establishing a correlation between two variables is not a sufficient condition to establish a causal relationship (in either direction). However, it should encourage further research to uncover the truth. Involve Your Statistician Statistical vs Practical Significance T-test Vs Paired t-test When is a Number a Number? Consider this survey: 2 treatments, 15 subject each 5-point scale: 5-love it, 4-like it, 3-neutral, 2-don’t like, 1-hate it. A standard one-way Analysis of Variance (ANOVA) gives us Group A Mean:2.1 Group B Mean: 3.3 F=5.15, p = 0.001 Can we conclude Group B perform better than Group A? No! Issue #1: how can a 5-point scale have value 9? Issue #2: can 5-point scale be treated as pure numbers? Distribution of Group A & B data after removing 2 outliers After removing the two outliers, the ANOVA now gives a p-value of 0.06 (not statistically significant). Should this be your final answer? Qualitative attributes (like, dislike, etc.) only convey implicit order (i.e., good is better than neutral) with no quantitative meaning. Taking mean scores of these numerical representation is also not appropriate. So, what should we do then? An established approach to analyze this type is data uses the “Top 2 boxes” approach: The numbers of 4s and 5s are pooled into YES category, and the rest into NO. A Chi-Square test is performed to detect the differences between the ratios of responses . The test concluded that the ratio of Top 2 boxes 26.7% Vs 46.2% are not statistically different (p=0.28). “How many subjects do I need to show a statistical significance?” That is a trick question. Without knowing your study objectives, hypothesis, measurements, variance, and data, we cannot know for sure how many subjects are needed. To compare machine readings of anti-breakage properties of tresses, one may need 50 or fewer tresses in each treatment group. To compare consumer perceptions on a 5-point scale, many more subjects are needed. Size Does Matter Samples size calculations need to be performed case by case taking many factors into consideration. Consult your statistician to discuss your study objectives. “I have completed the study, and now it is time to ask the statistician about data analysis method.” No. Well-designed experiment allows for multiple factors to be collected and analyzed properly, to determine their effect on a desired outcome/response. A good design answers at least the follow questions: • What is the big question? What are the key factors in asking? • What is the hypothesis? What are we testing? • What are the main and interaction effects in the process? • What settings would bring about less variation in the output? • How many samples / data points will be sufficient? • What blocking / design / randomization schemes will be most effective? • What statistical methods / tools are best suited for the design and the analysis? If you only think of those study factors after data points are collected, you might be too late. The old saying goes: “Garbage in. Garbage out.” “If I have good data, all statistical tests should show the same results.” Let’s look at the following data from Course Statistics 250 of Penn State University. Pulse Rates Before and After Marching Student BEFORE AFTER DIFFA-B 1 60 78 18 2 56 66 10 3 90 96 6 4 78 88 10 Two sample t-test for AFTER vs BEFORE N Mean StdDev SE Mean AFTER 4 82.0 13.0 6.5 BEFORE 4 71.0 15.9 7.9 T-Test mu AFTER = mu BEFORE (vs not =): T = 1.07, p = 0.33 The result concludes no difference in mean pulse rates before and after marching. Paired t-test for AFTER - BEFORE N Mean StdDev SE Mean Difference 4 11.00 5.03 2.52 T-Test of mean difference = 0 (vs not = 0): T = 4.37, p = 0.02 The analysis concludes that mean pulse rate after is greater than mean pulse rate before. Which one is the correct test? Paired t-Test Choosing a correct method is vital to the success of your analysis. When in doubt, consult your statistician. Group A 4 2 2 4 4 2 1 1 2 1 5 1 2 1 2 Group B 3 5 5 1 1 9 5 4 3 9 3 4 4 2 2 Without sample size specified, percentages along cannot provide much information . Type I error ( α ) is the incorrect rejection of a true null hypothesis (a "false positive"), while a Type II error (β ) is incorrectly retaining a false null hypothesis (a "false negative"). At any given sample size n, there is a trade-off between the significance level (Type I error) and power (Type II error). Ideally, we want to limit Type I error to 5% (α=0.05) or 1% (α=0.01) while achieving at least 80% power (1-β=0.8). In this example to the right, we may achieve our goals with roughly 25 samples. However, this calculation is only good for this population and this data. When we have a different set of data, the power curves will have similar look but the axis & units will be different. The relationship between significance level and power with one-tailed tests: μ = 75, real μ = 80, and σ = 10. Data Source: Rice University (Lead Developer), University of Houston Clear Lake, and Tufts University Online Statistics Education Statistics is the science of learning from data to measure, control, and communicate uncertainty in decision making. Appropriate application of statistical data analysis is essential to solving problems in a wide variety of research to shorten time and reduce cost by mitigating risks in decision making. Improper use of statistics, either due to lack of adequate training, poor study design, or negligence, can trick the observer into believing data artifacts that obfuscate the underlying phenomena. The consequences of drawing wrong inferences that are not statistically substantiated can be detrimental to business at large and can cause enormous monetary losses. This poster presents a set of hypothetical but realistic scenarios widely observed in data from multitude disciplines. Each scenario contains at least one misconception and/or mistake typical of those made in analyses. The topics discussed are application & interpretation of mean, variance, correlation, causality, significance, normality of distribution, and design of experiments. The primary objective of the poster is to shed light on typical deceptive traps in statistical data analyses and to promote best data analyses practices within the R&I community. Involve Scientific Computing early in the process so you position yourself for success before the first data point comes in. We are here to assist you with your analysis needs.