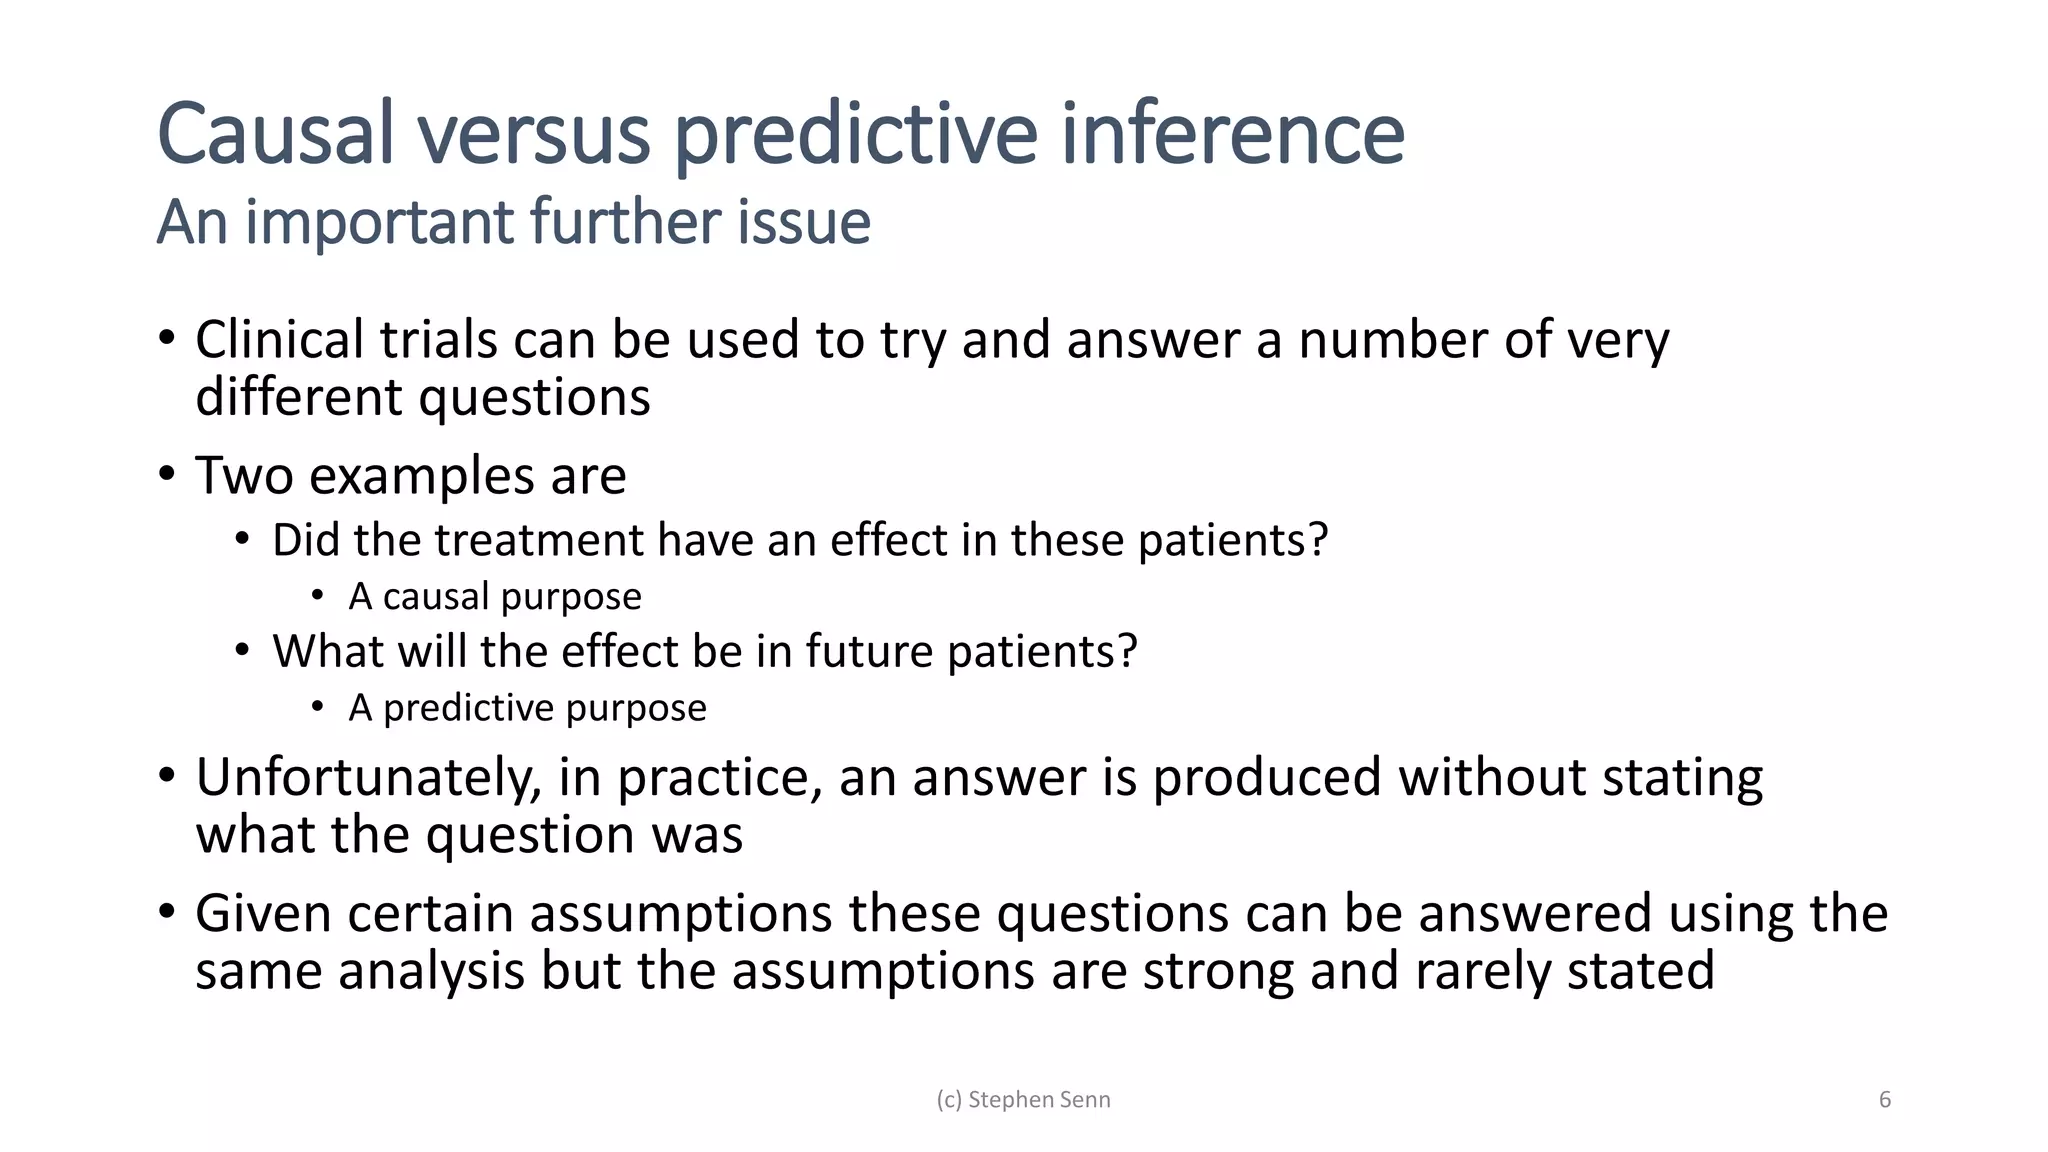
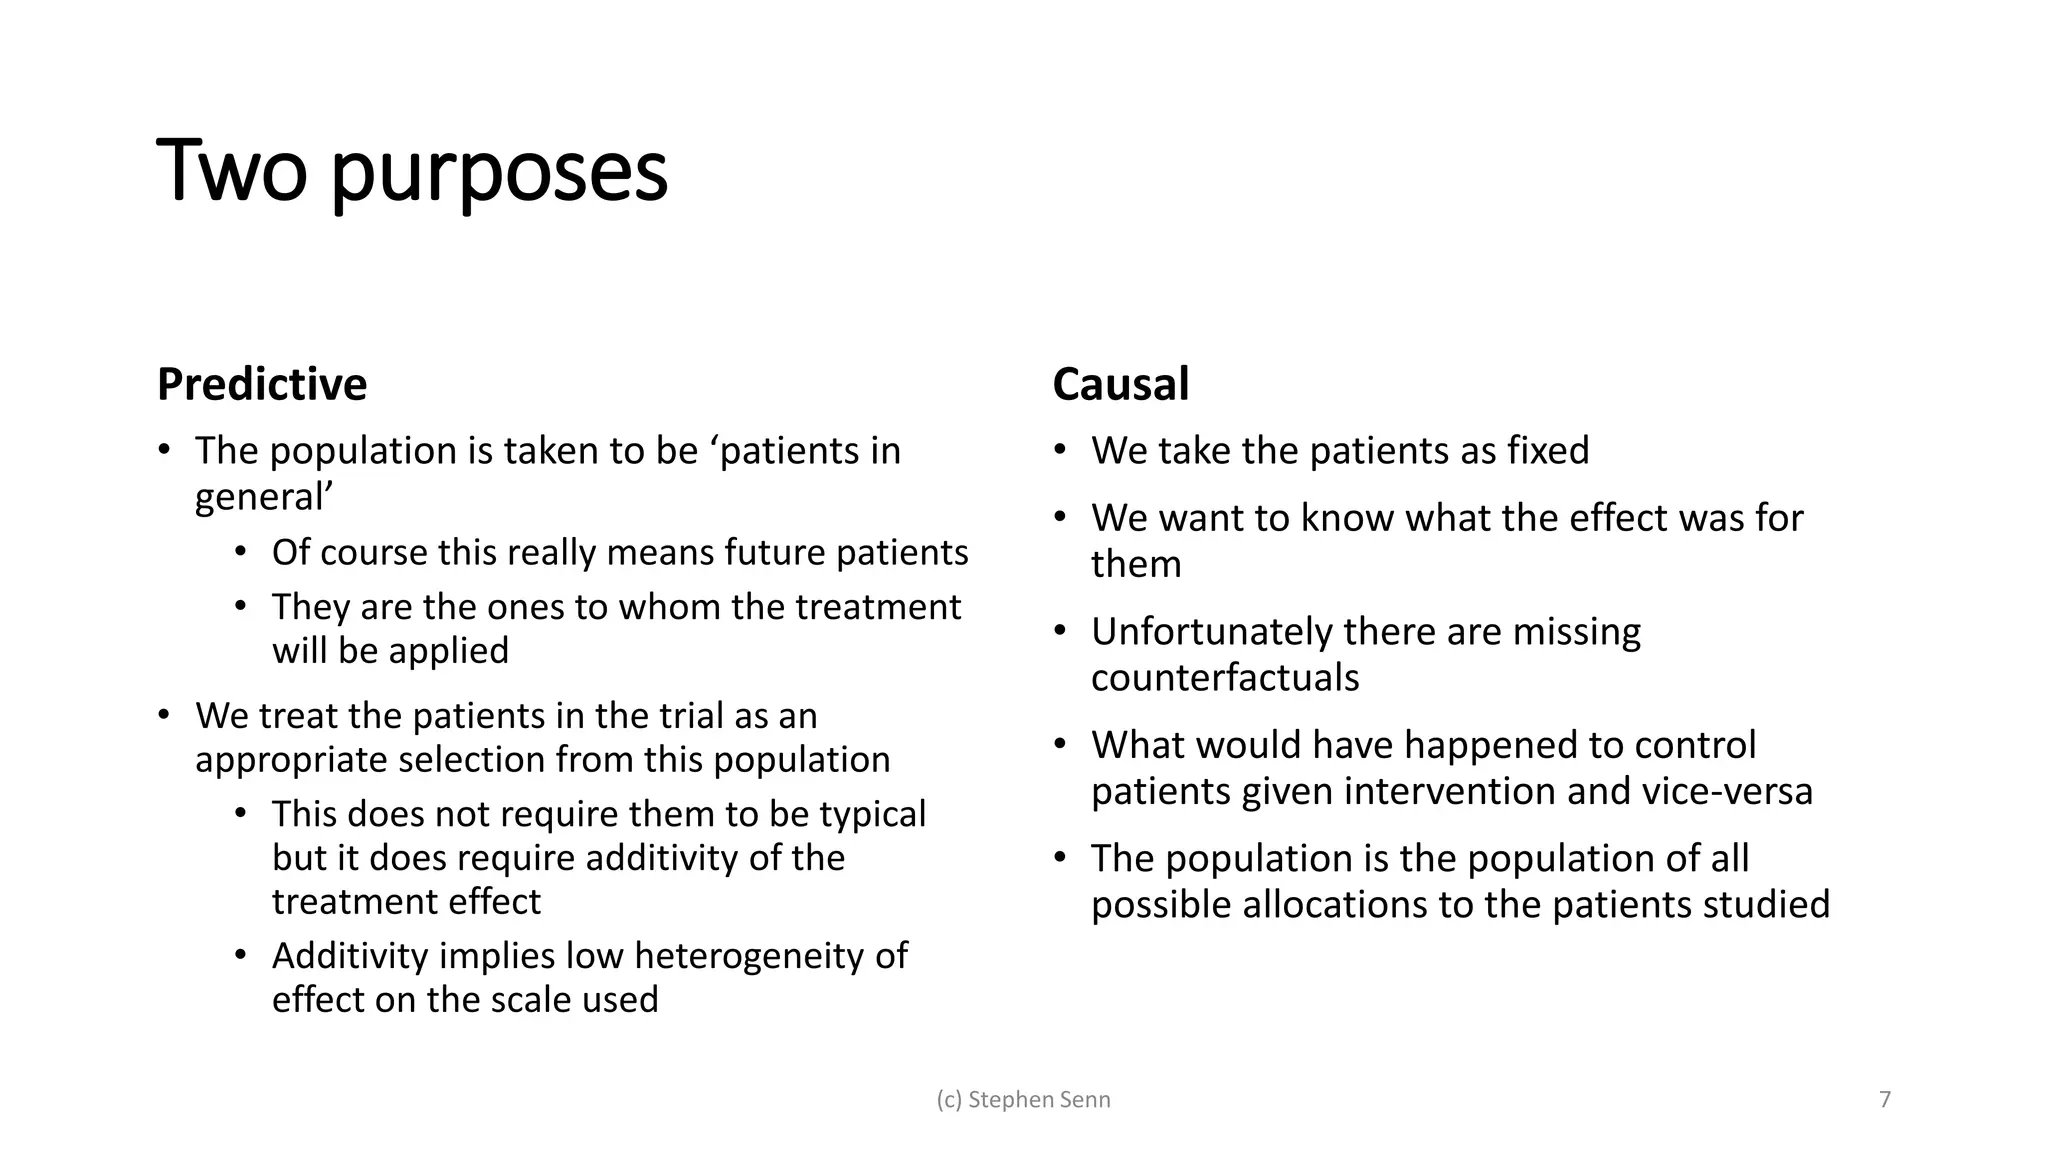
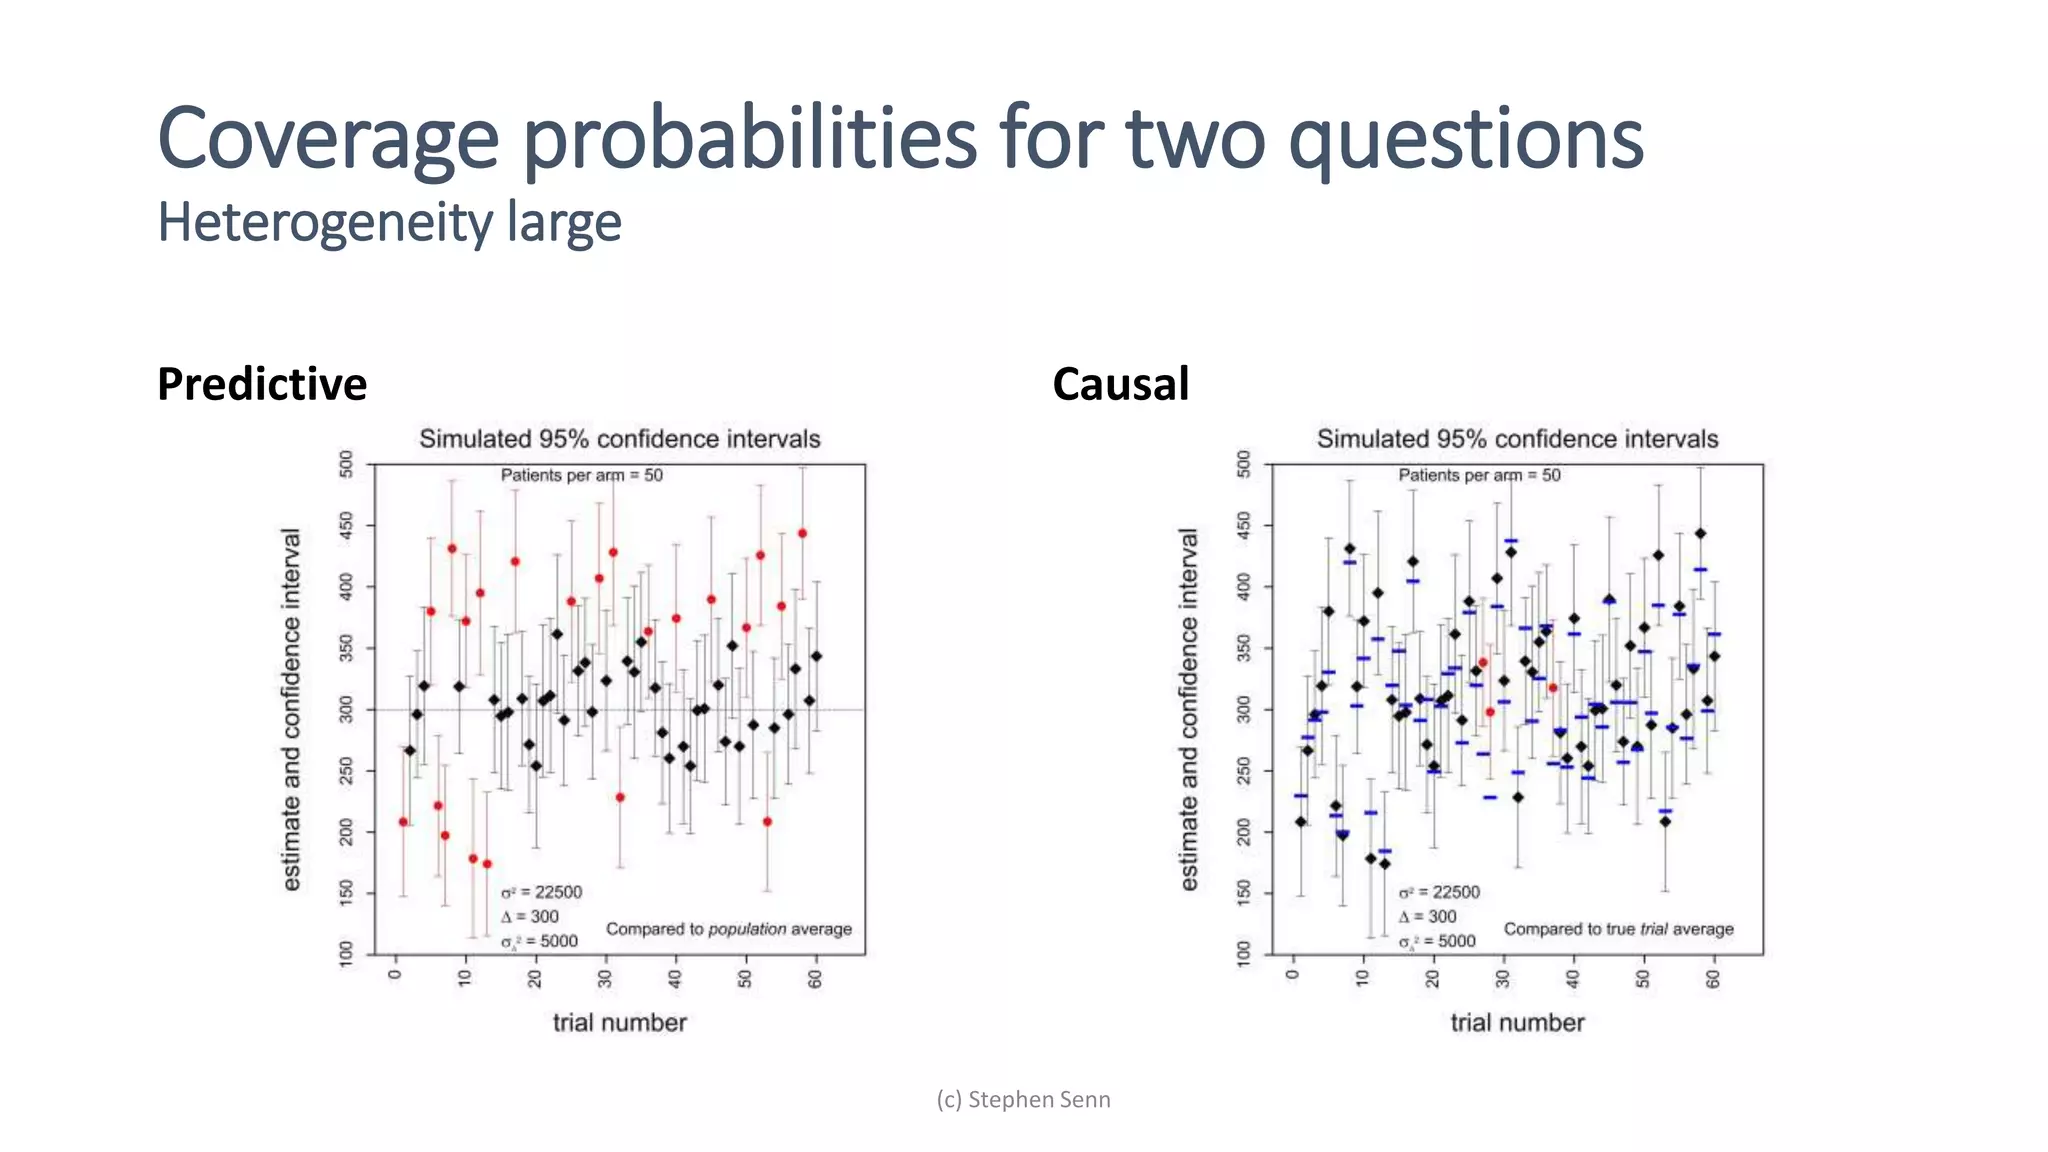
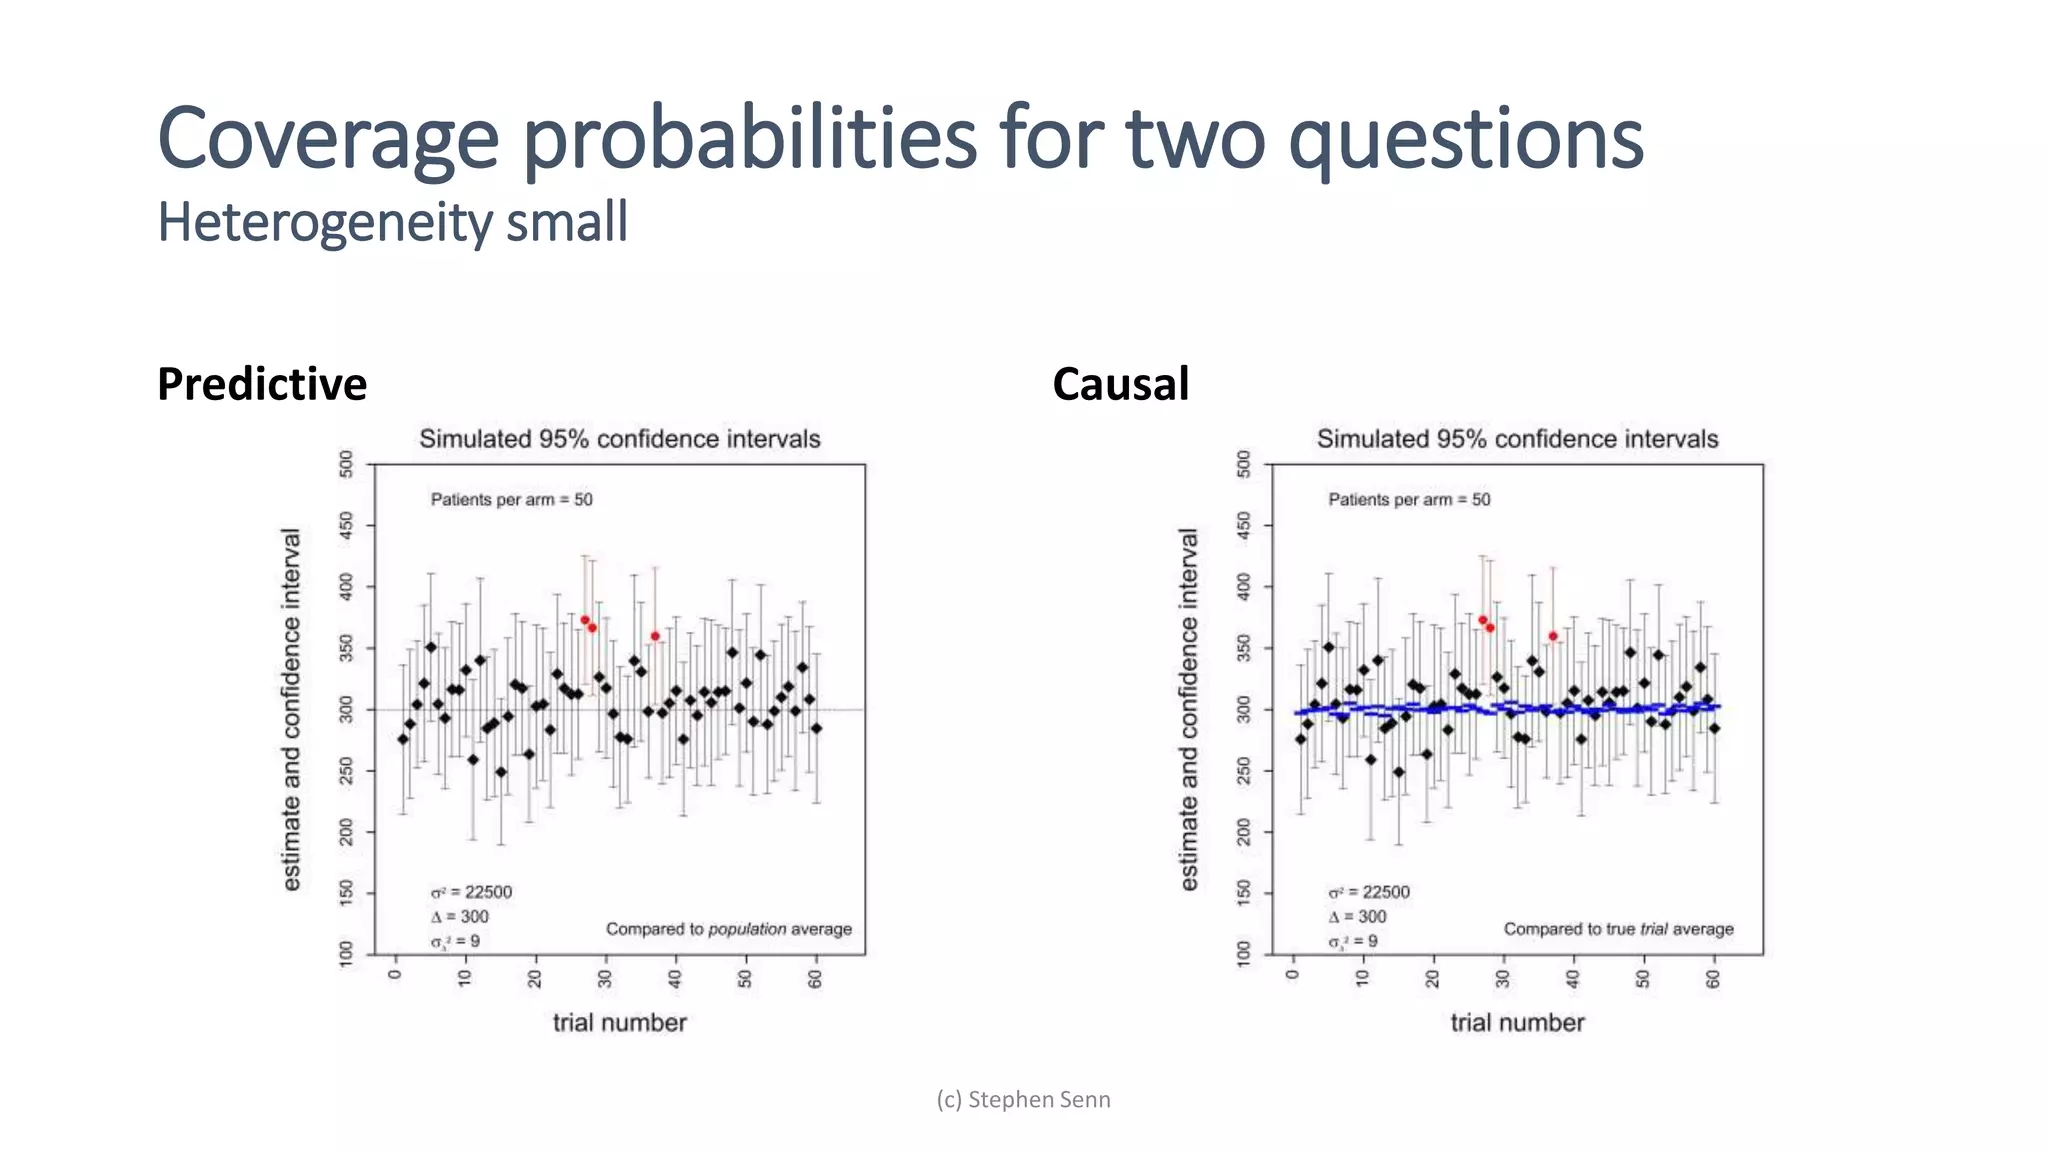
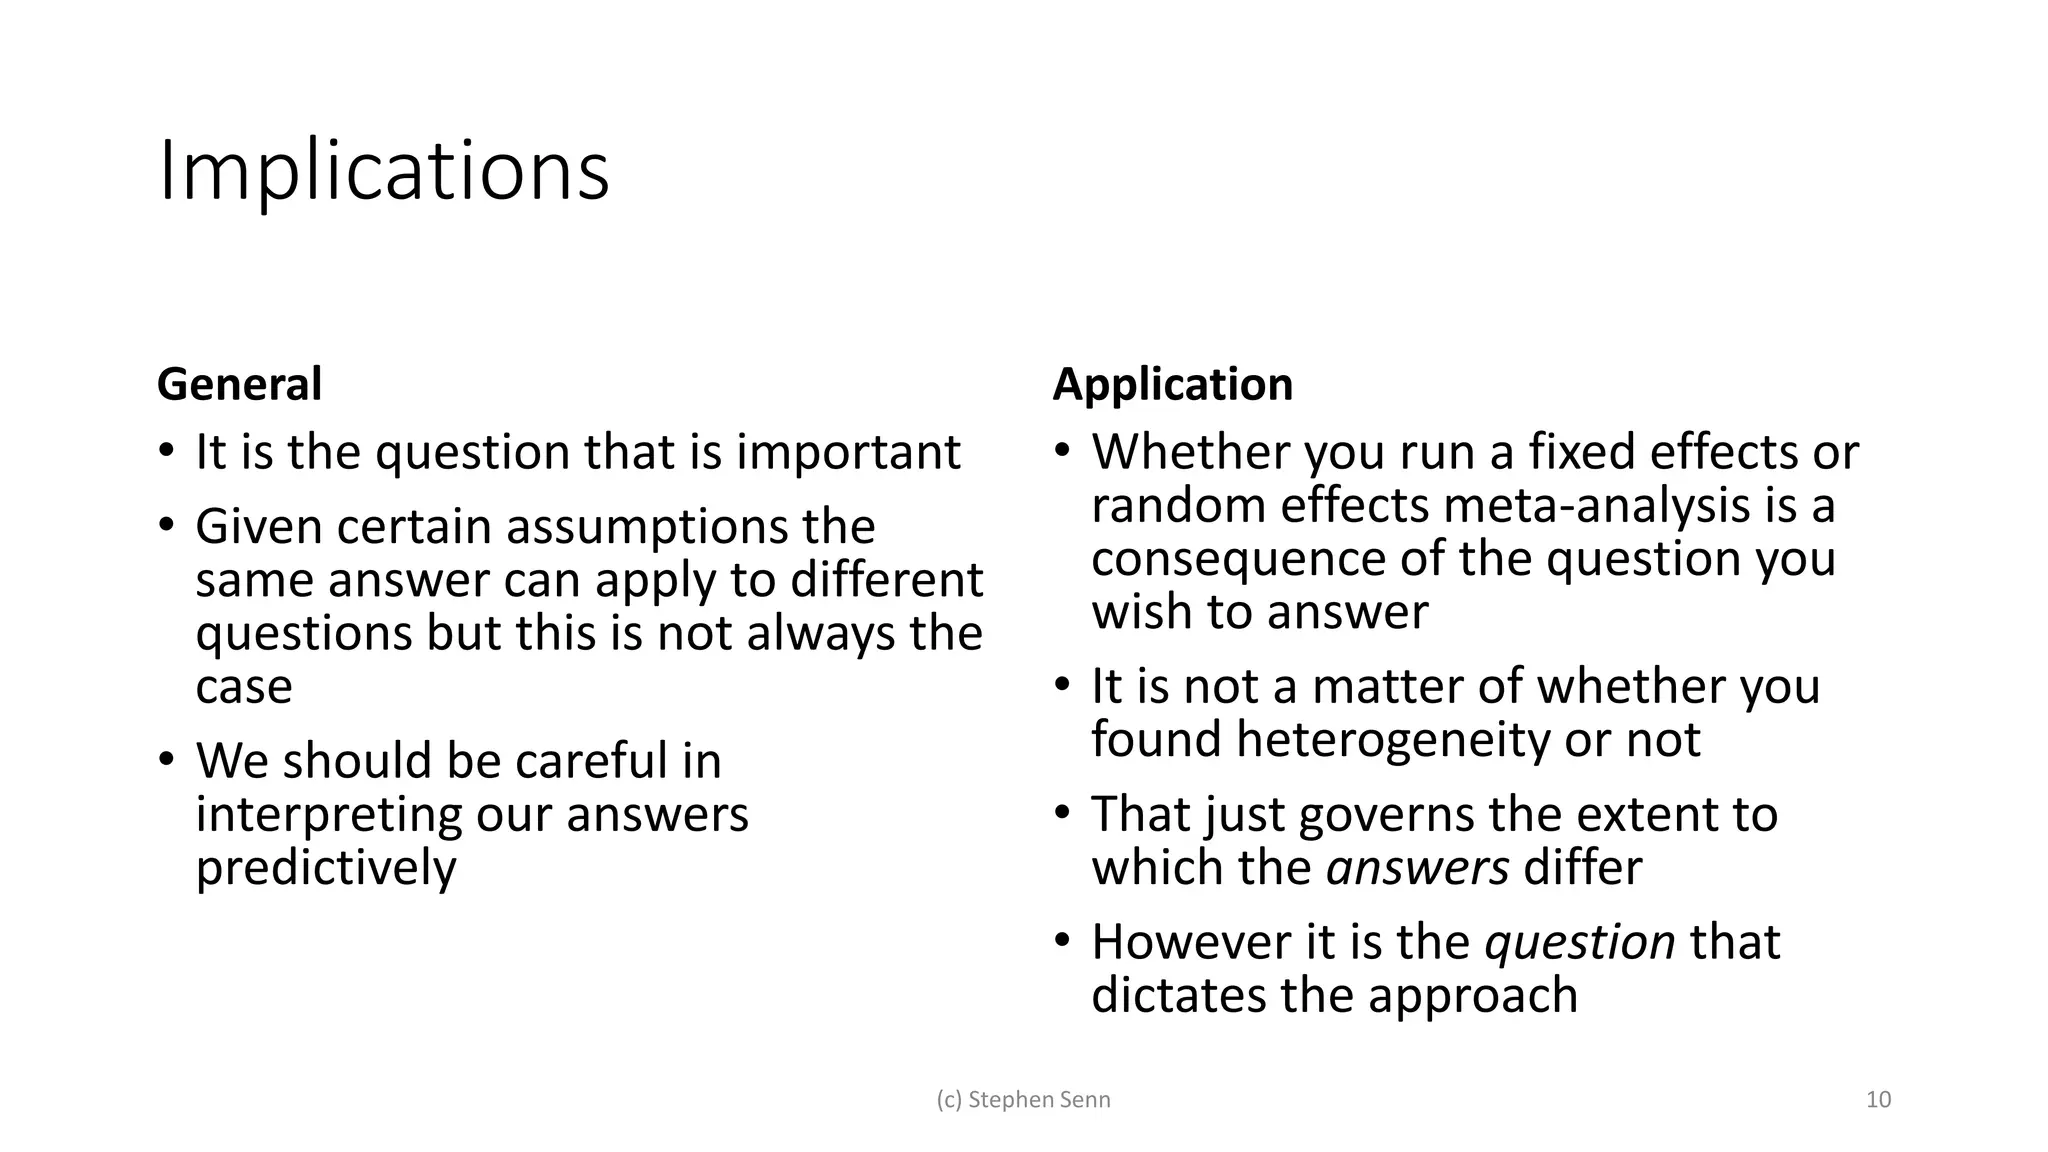
1) Clinical trials can aim to answer causal or predictive questions, but the questions and assumptions need to be clear.
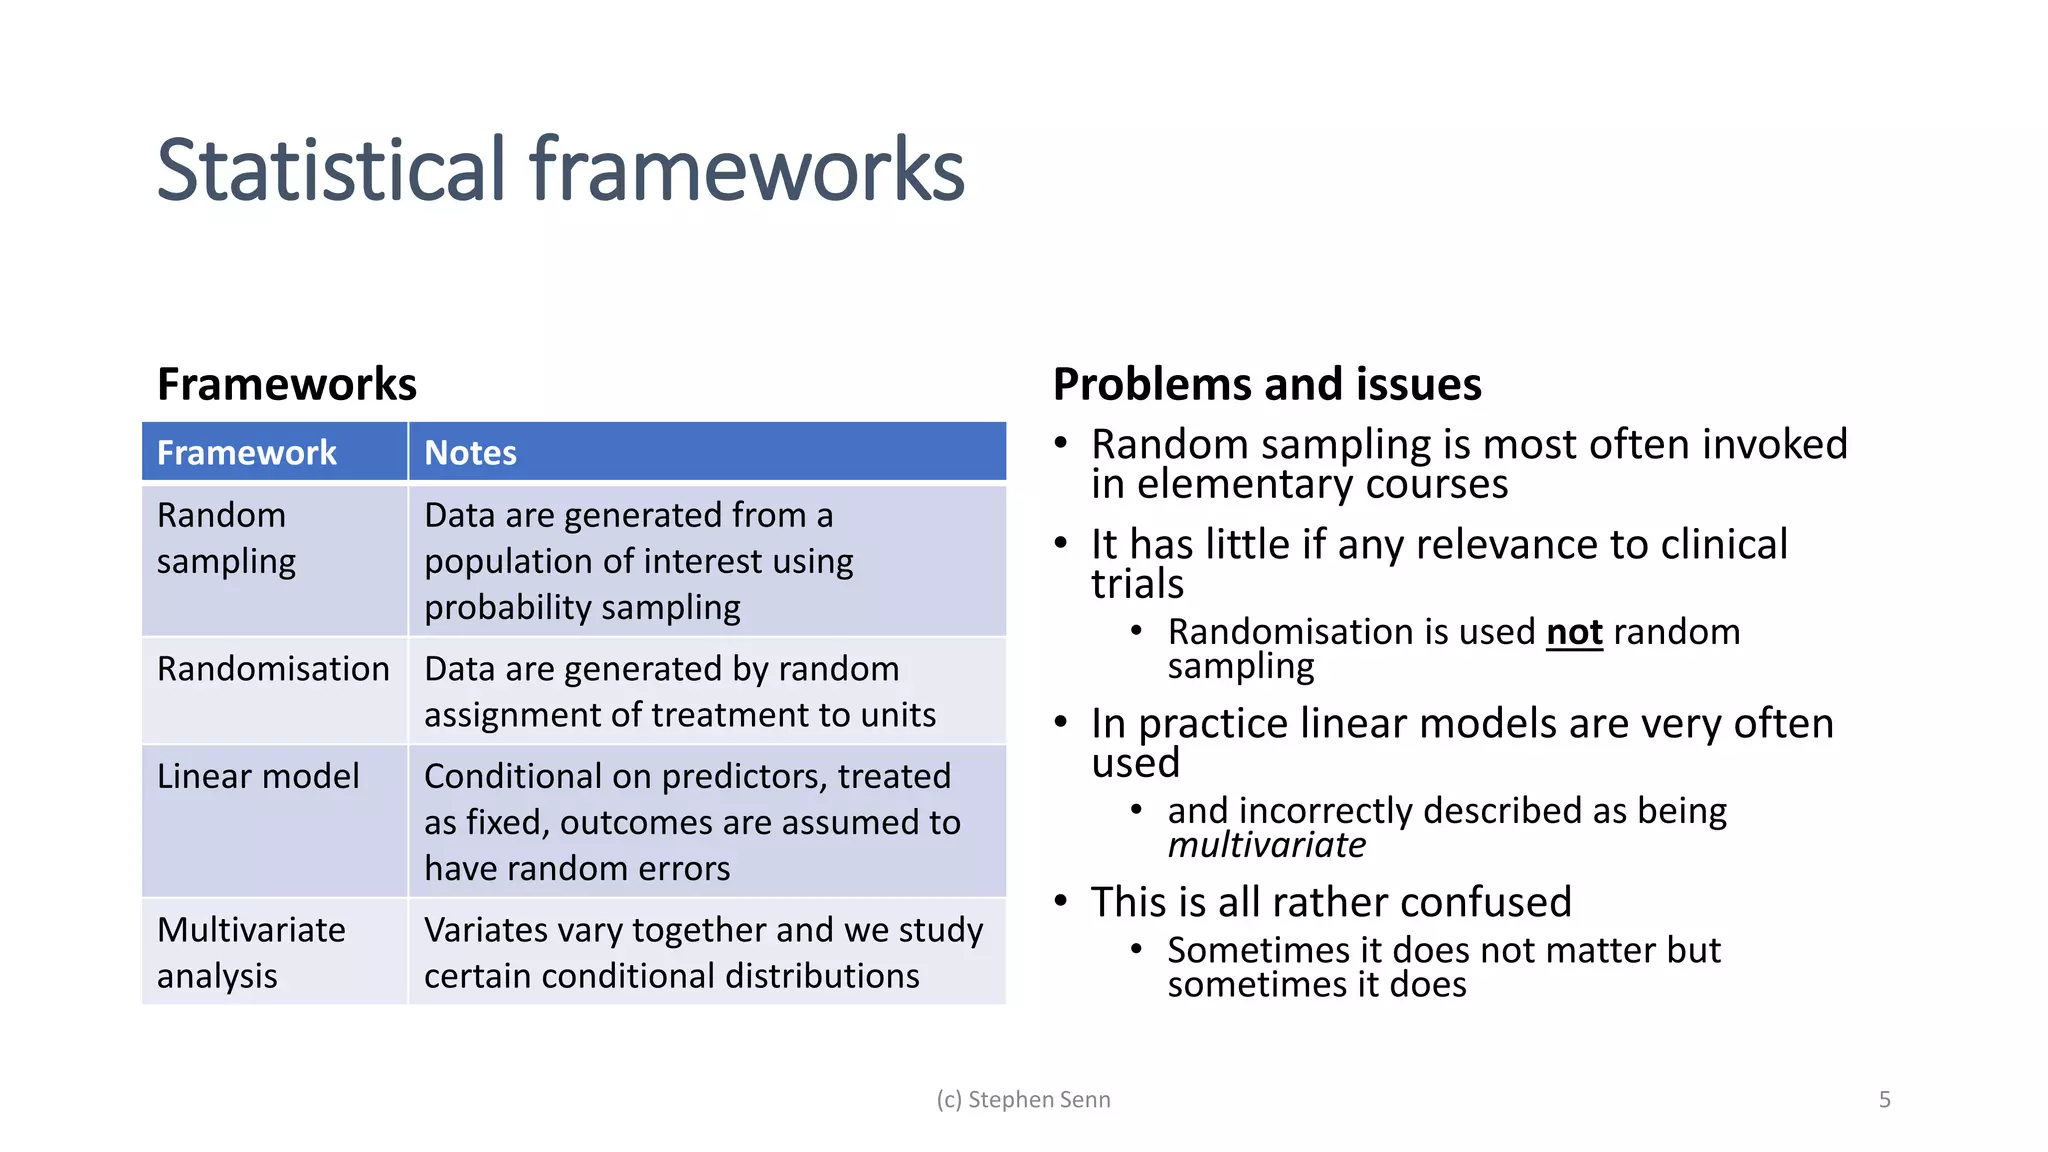
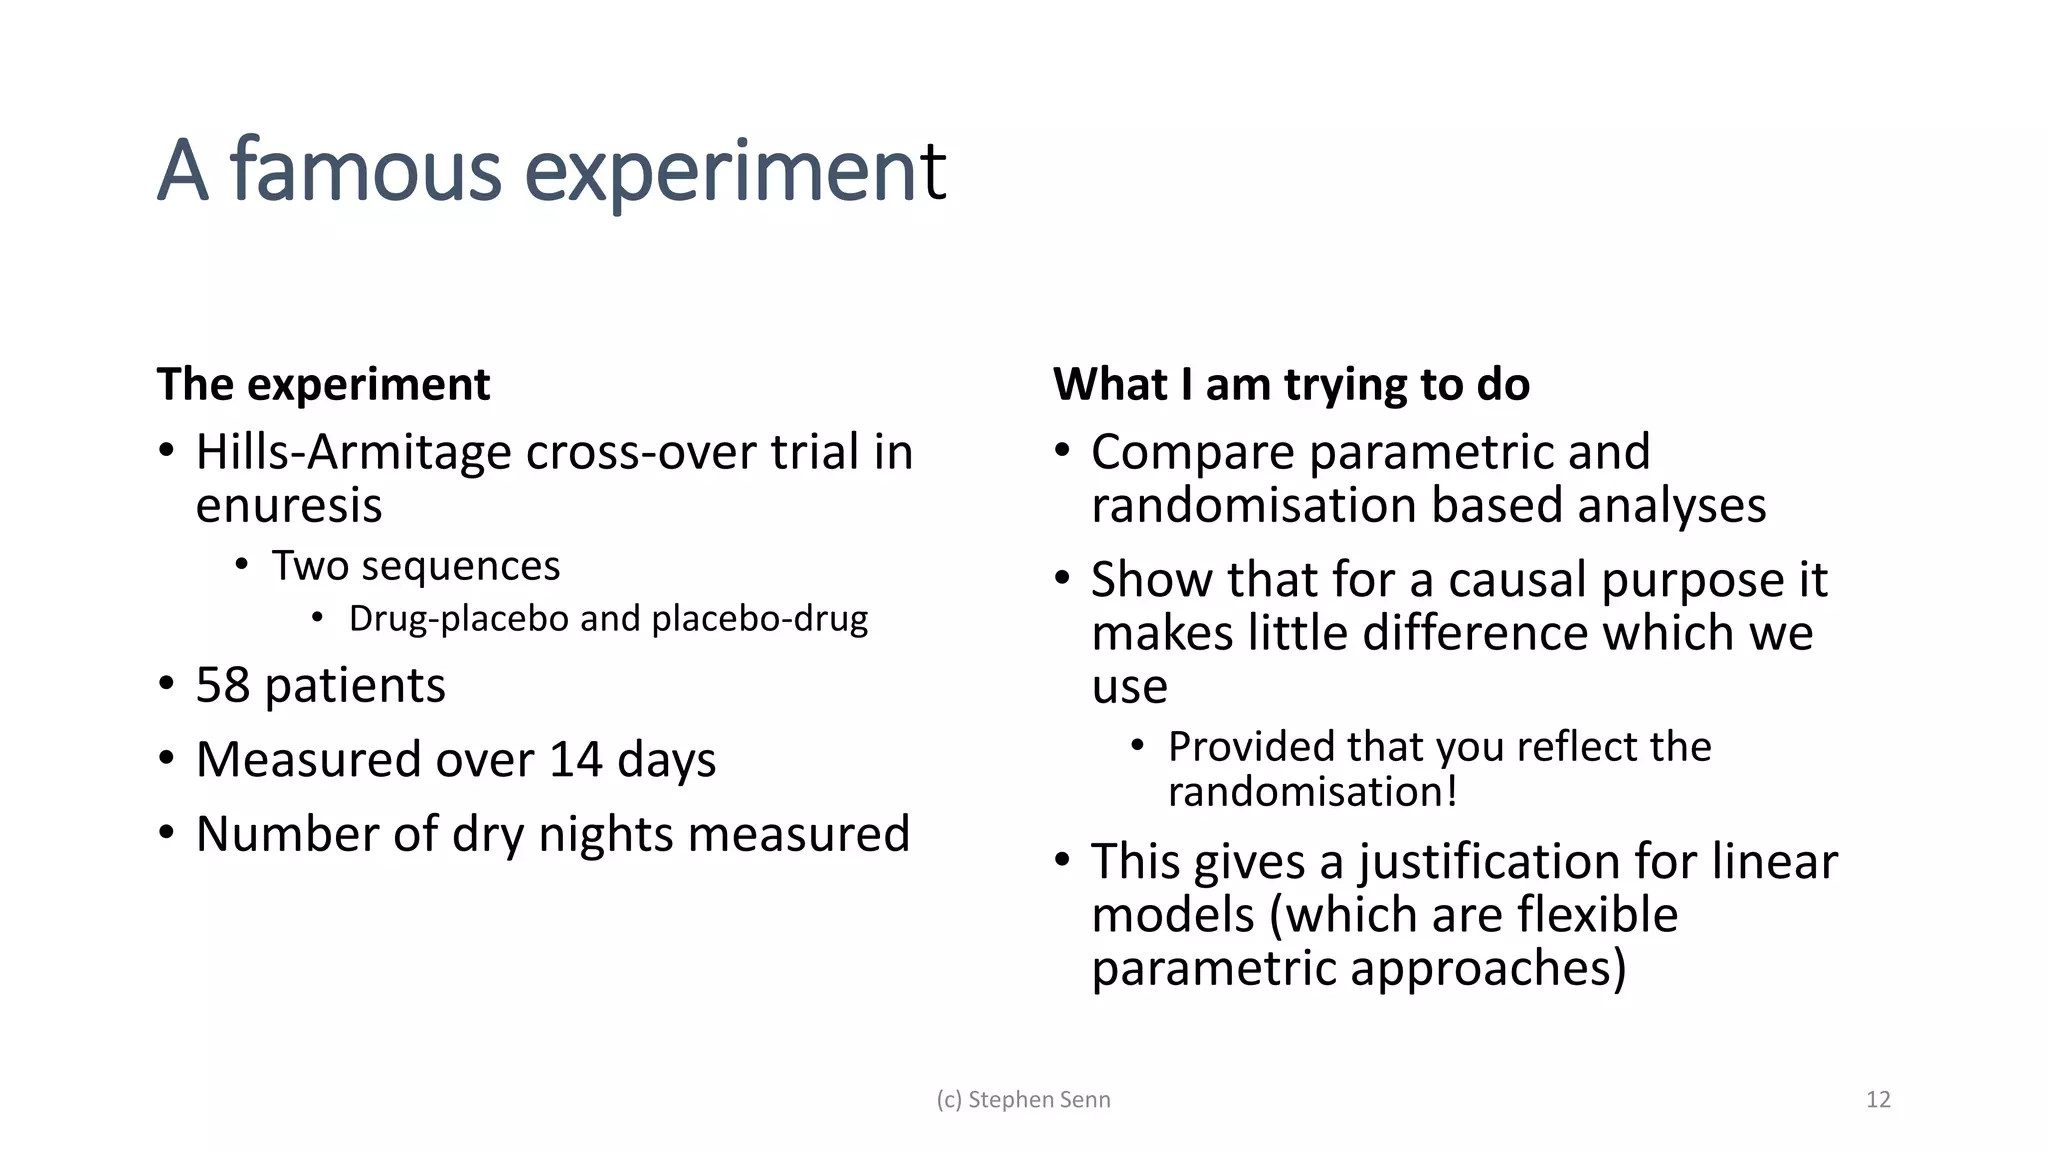
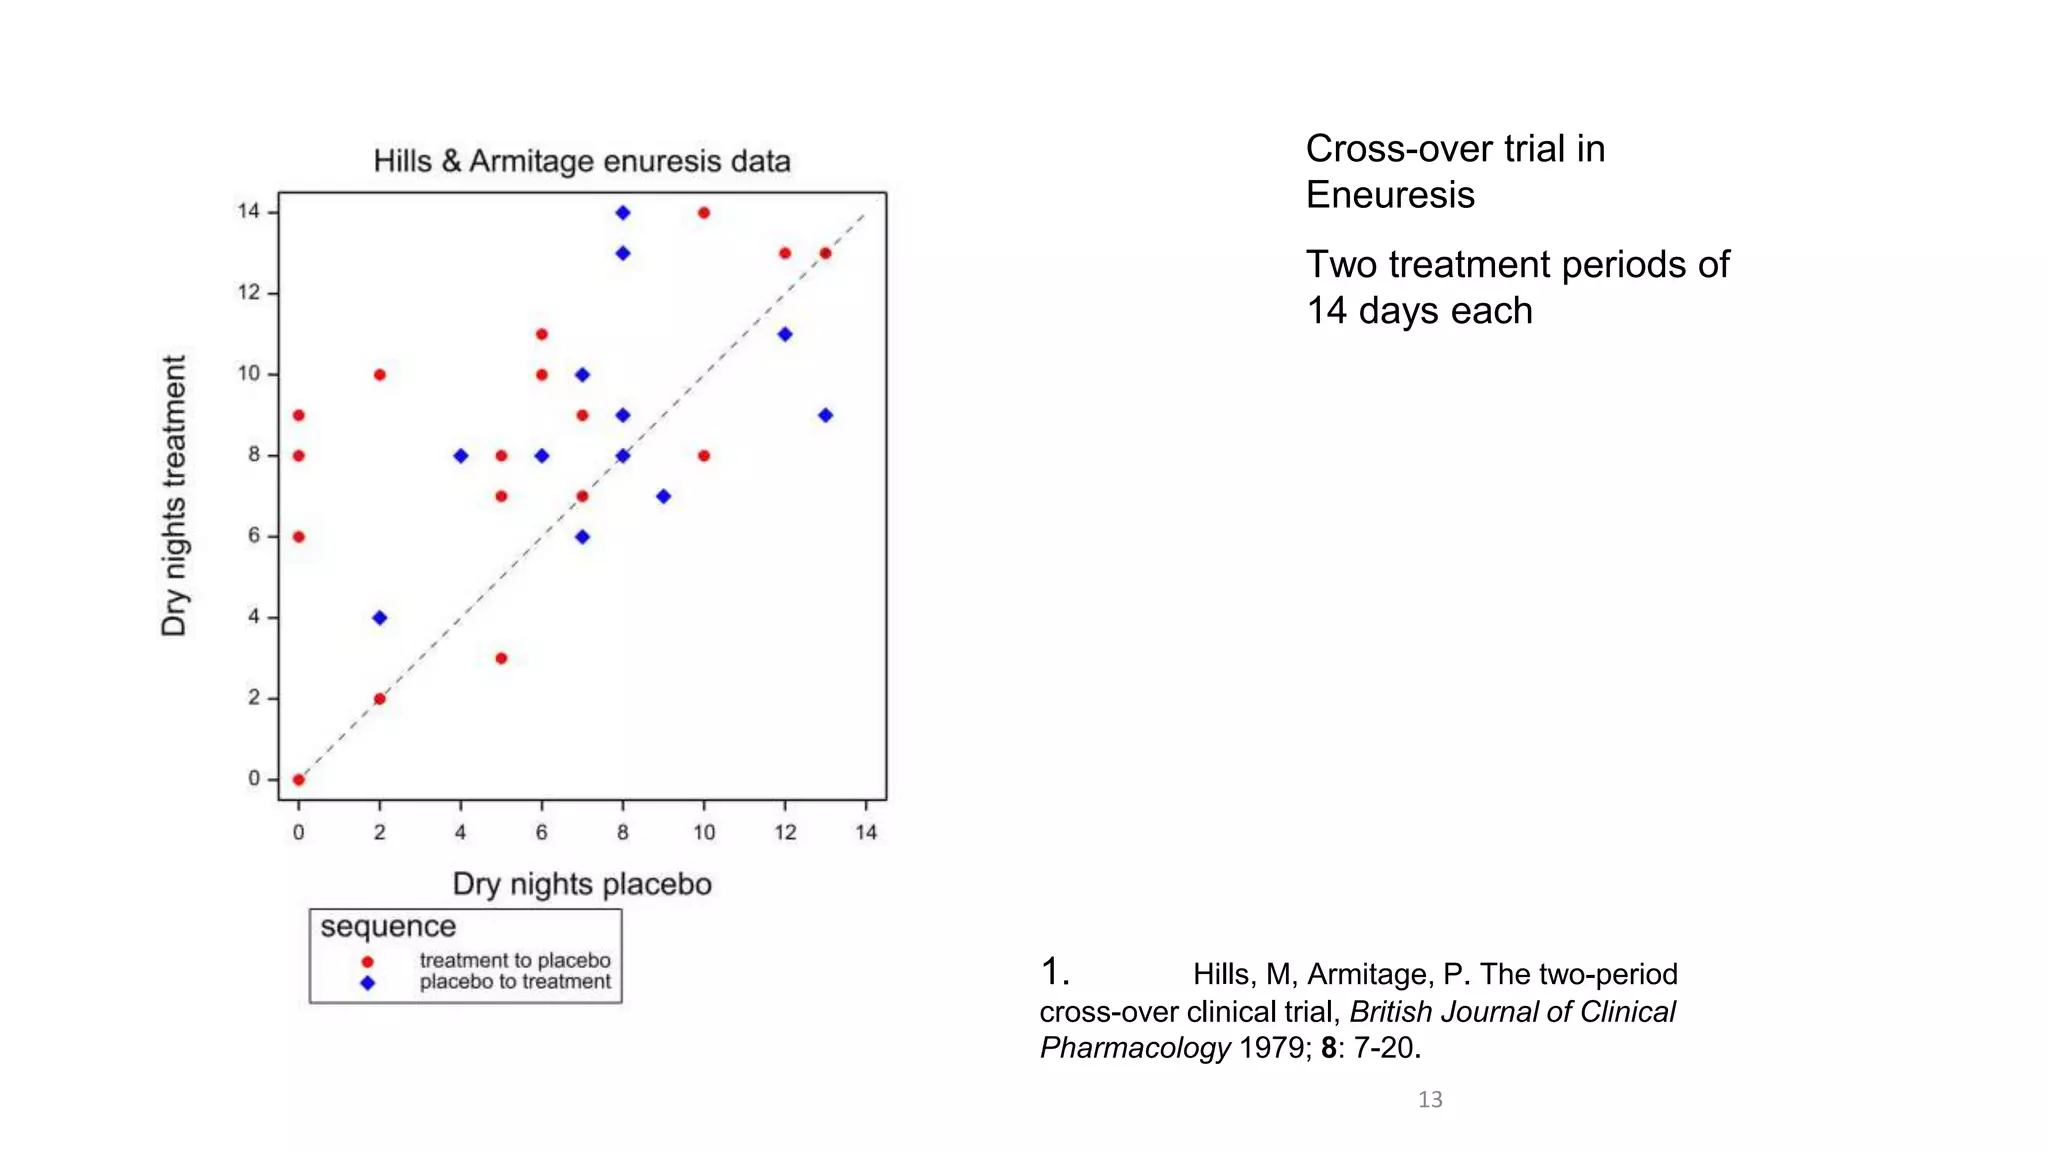
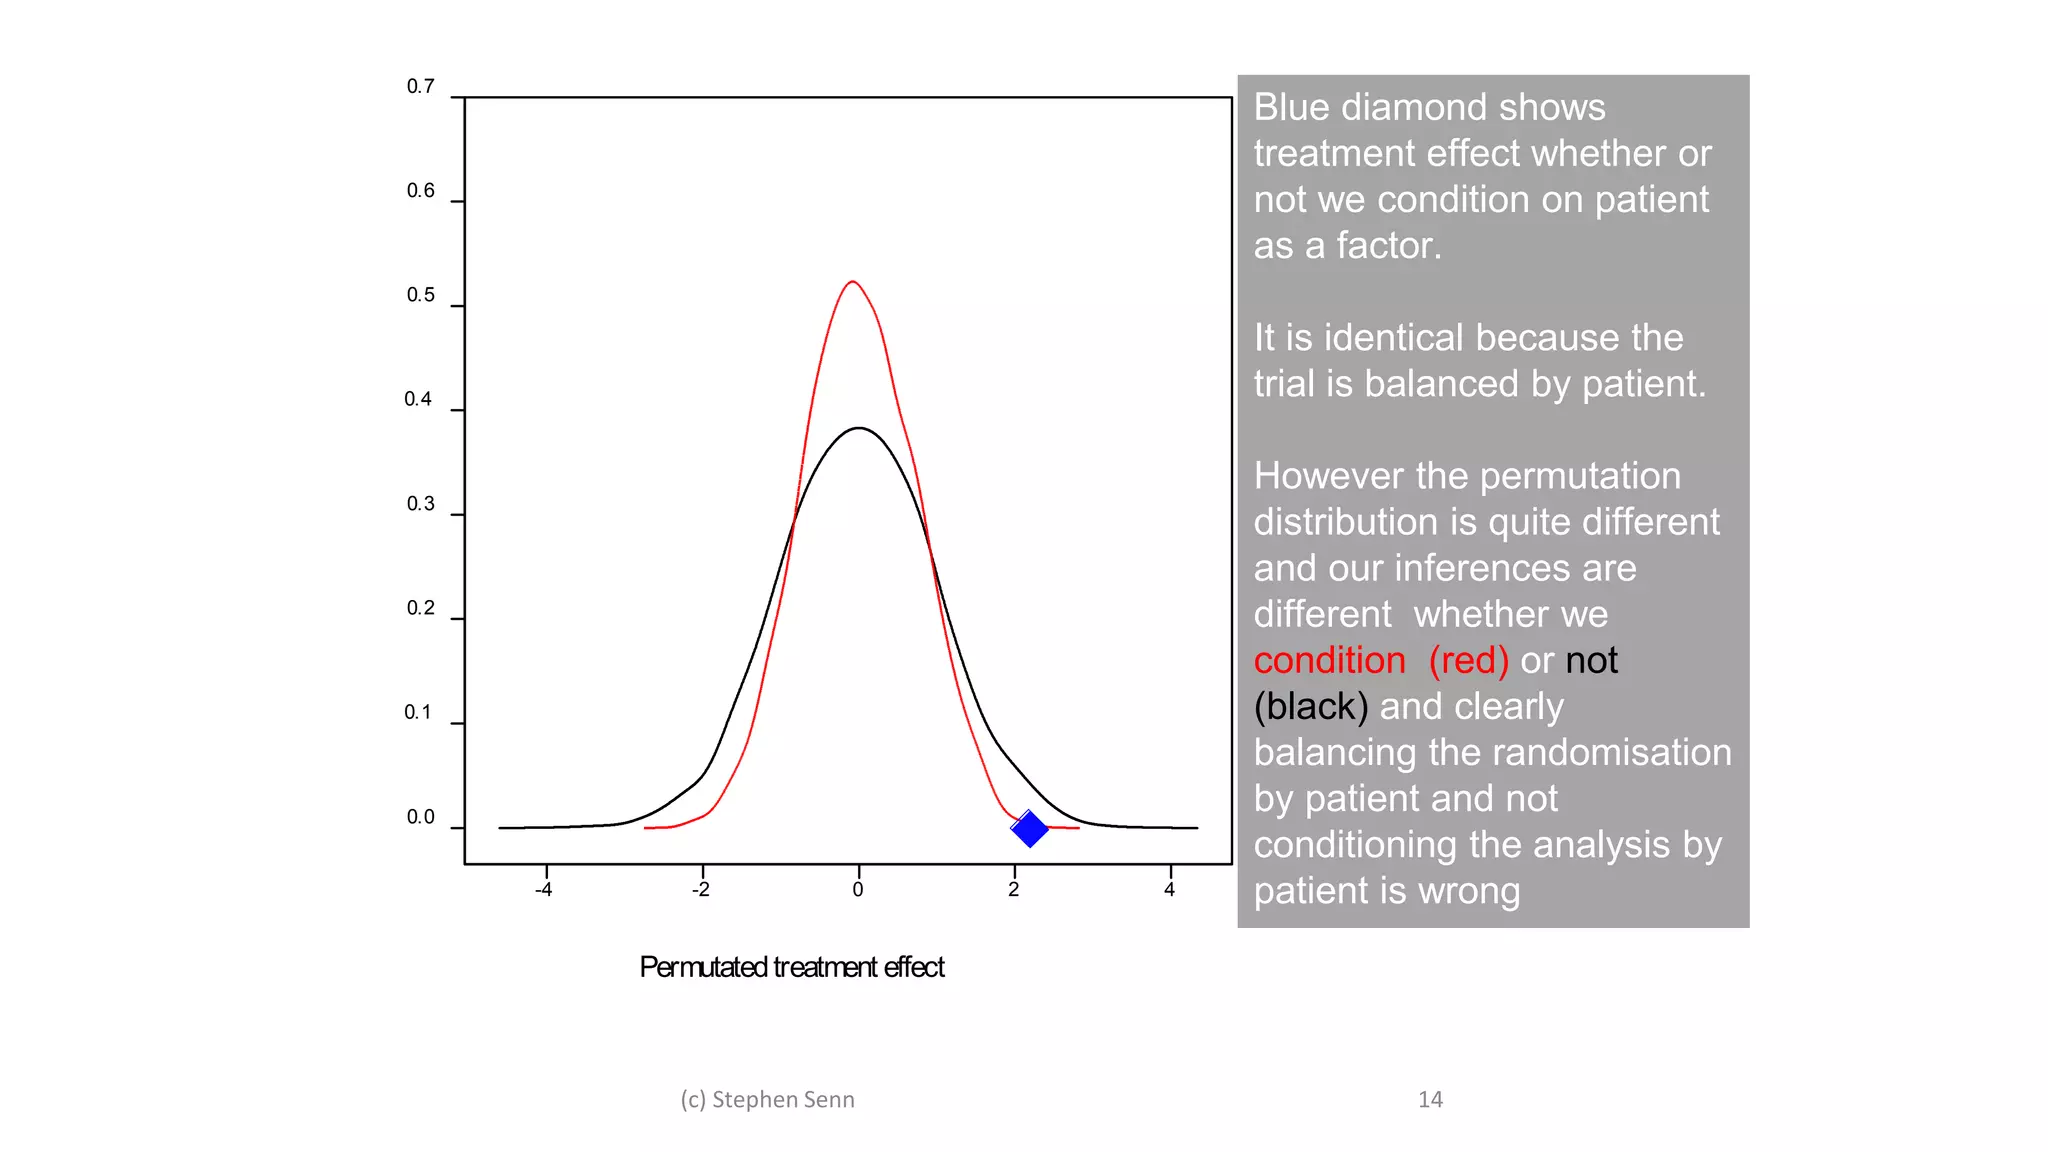
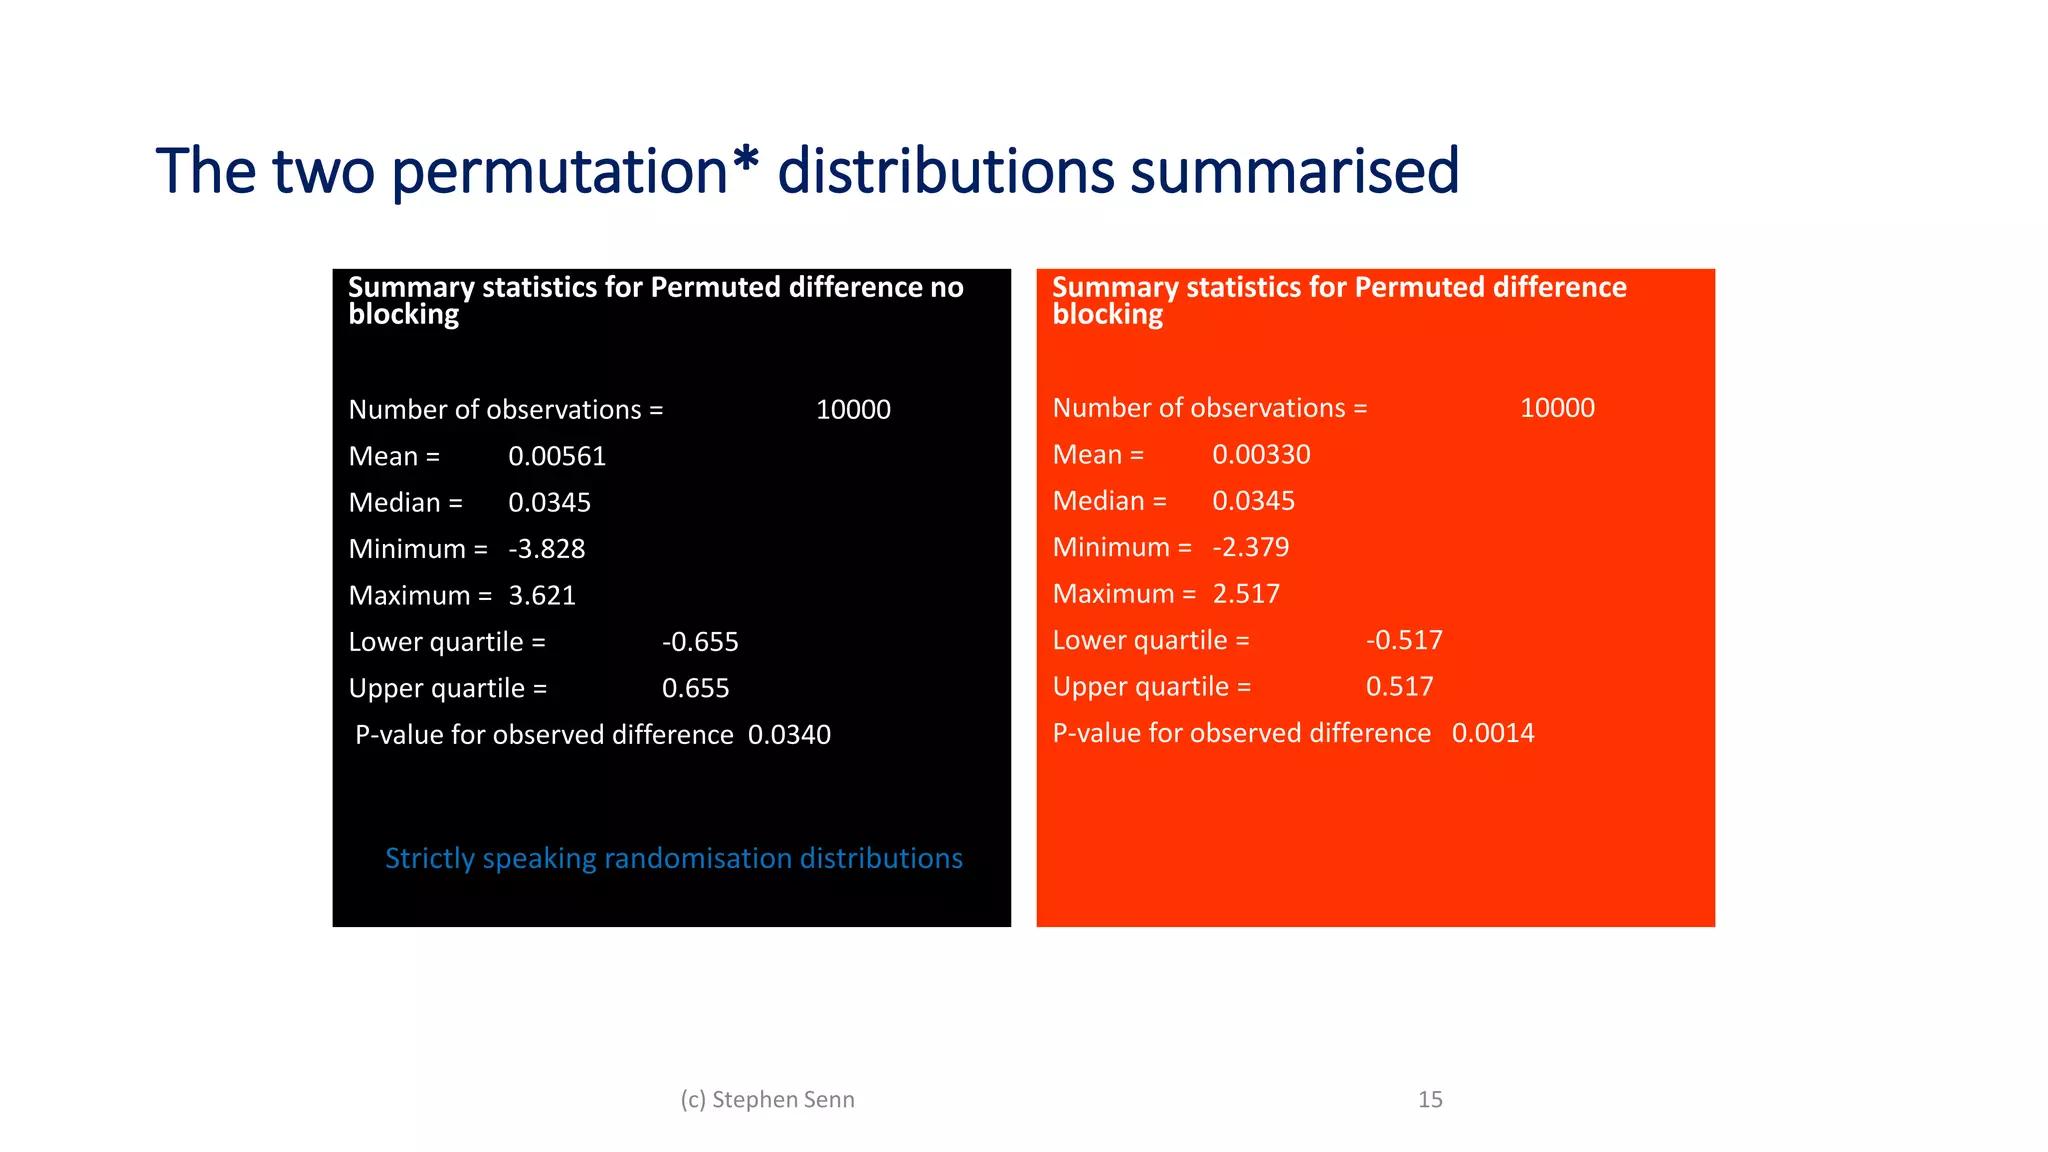
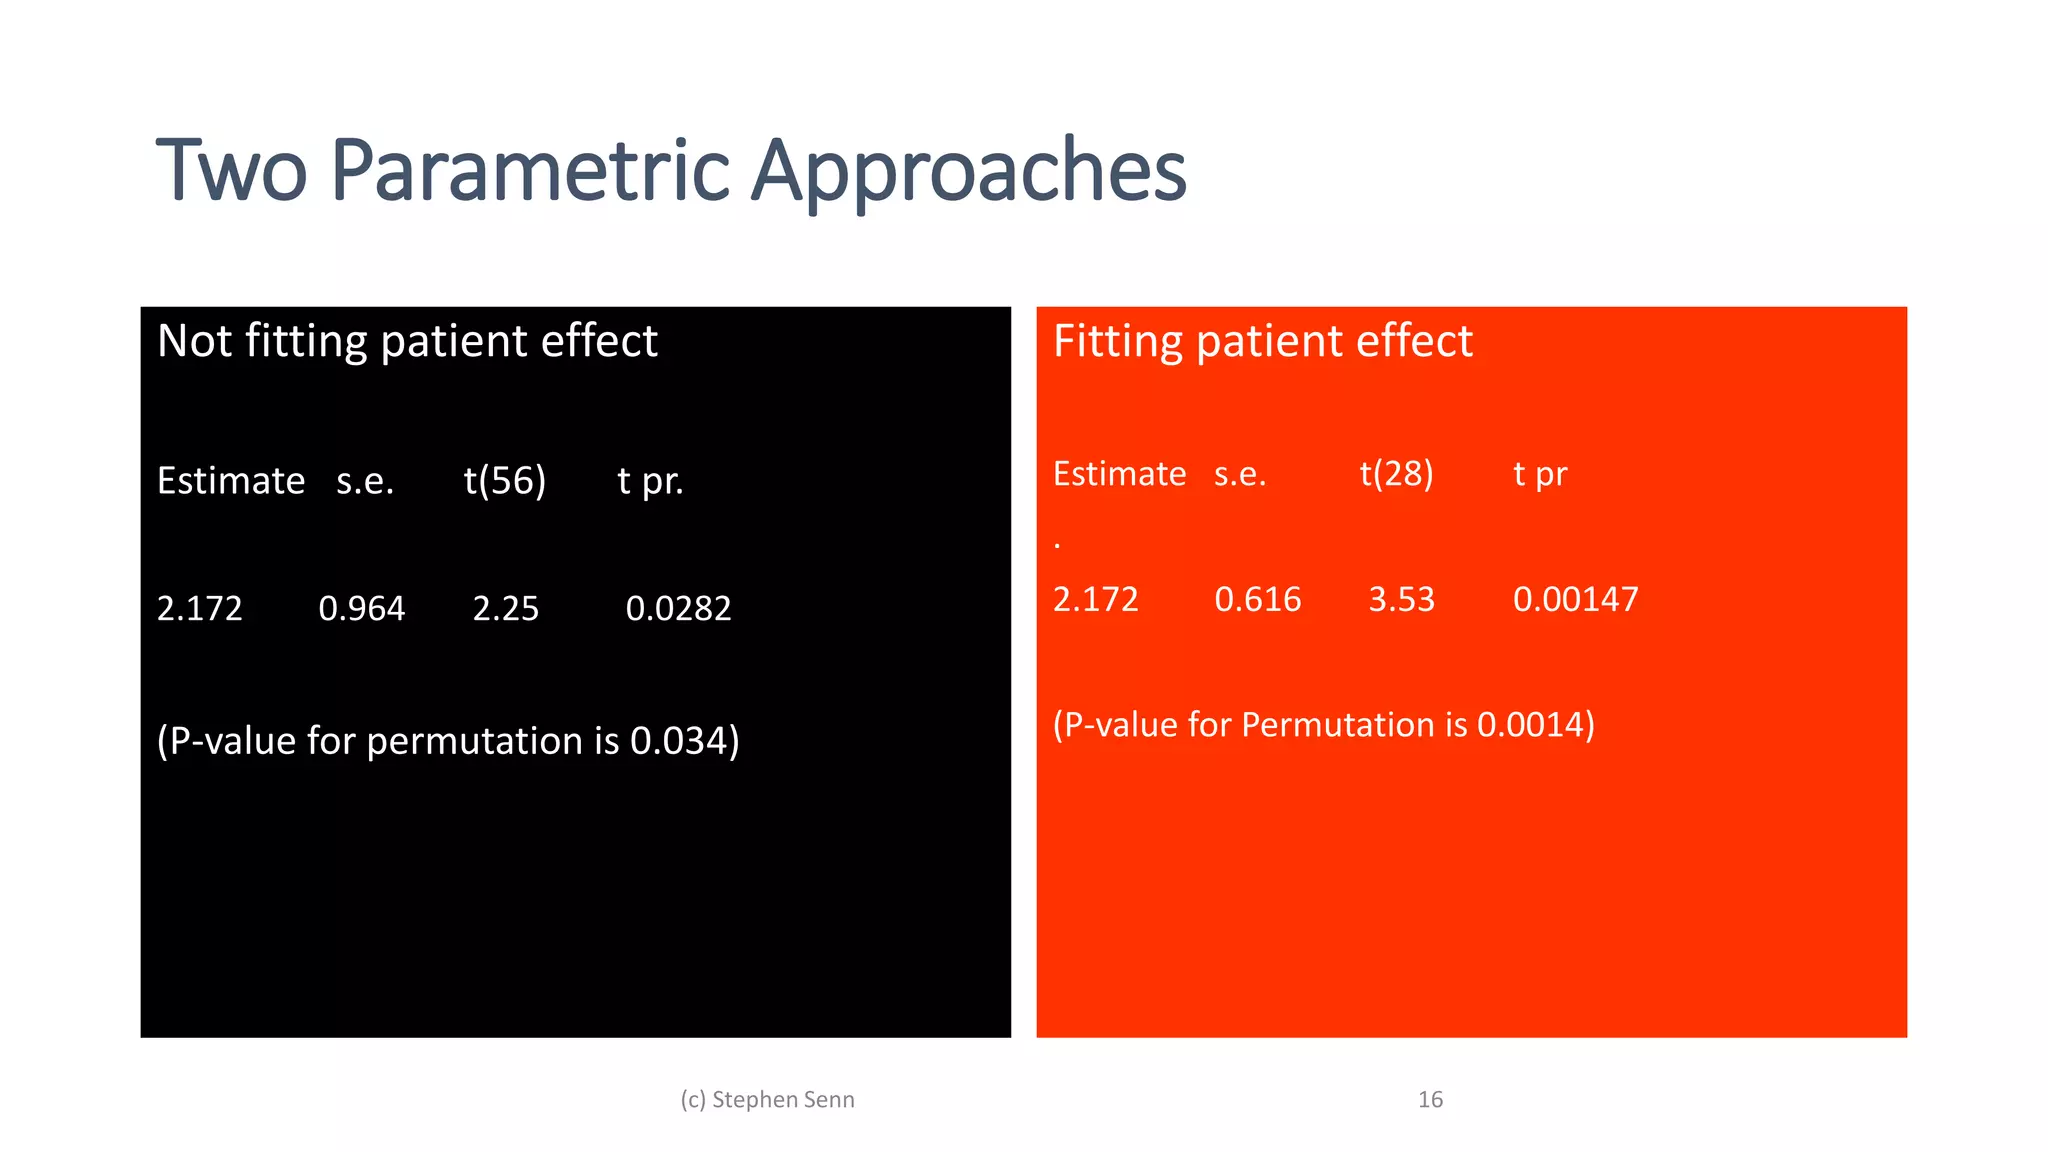
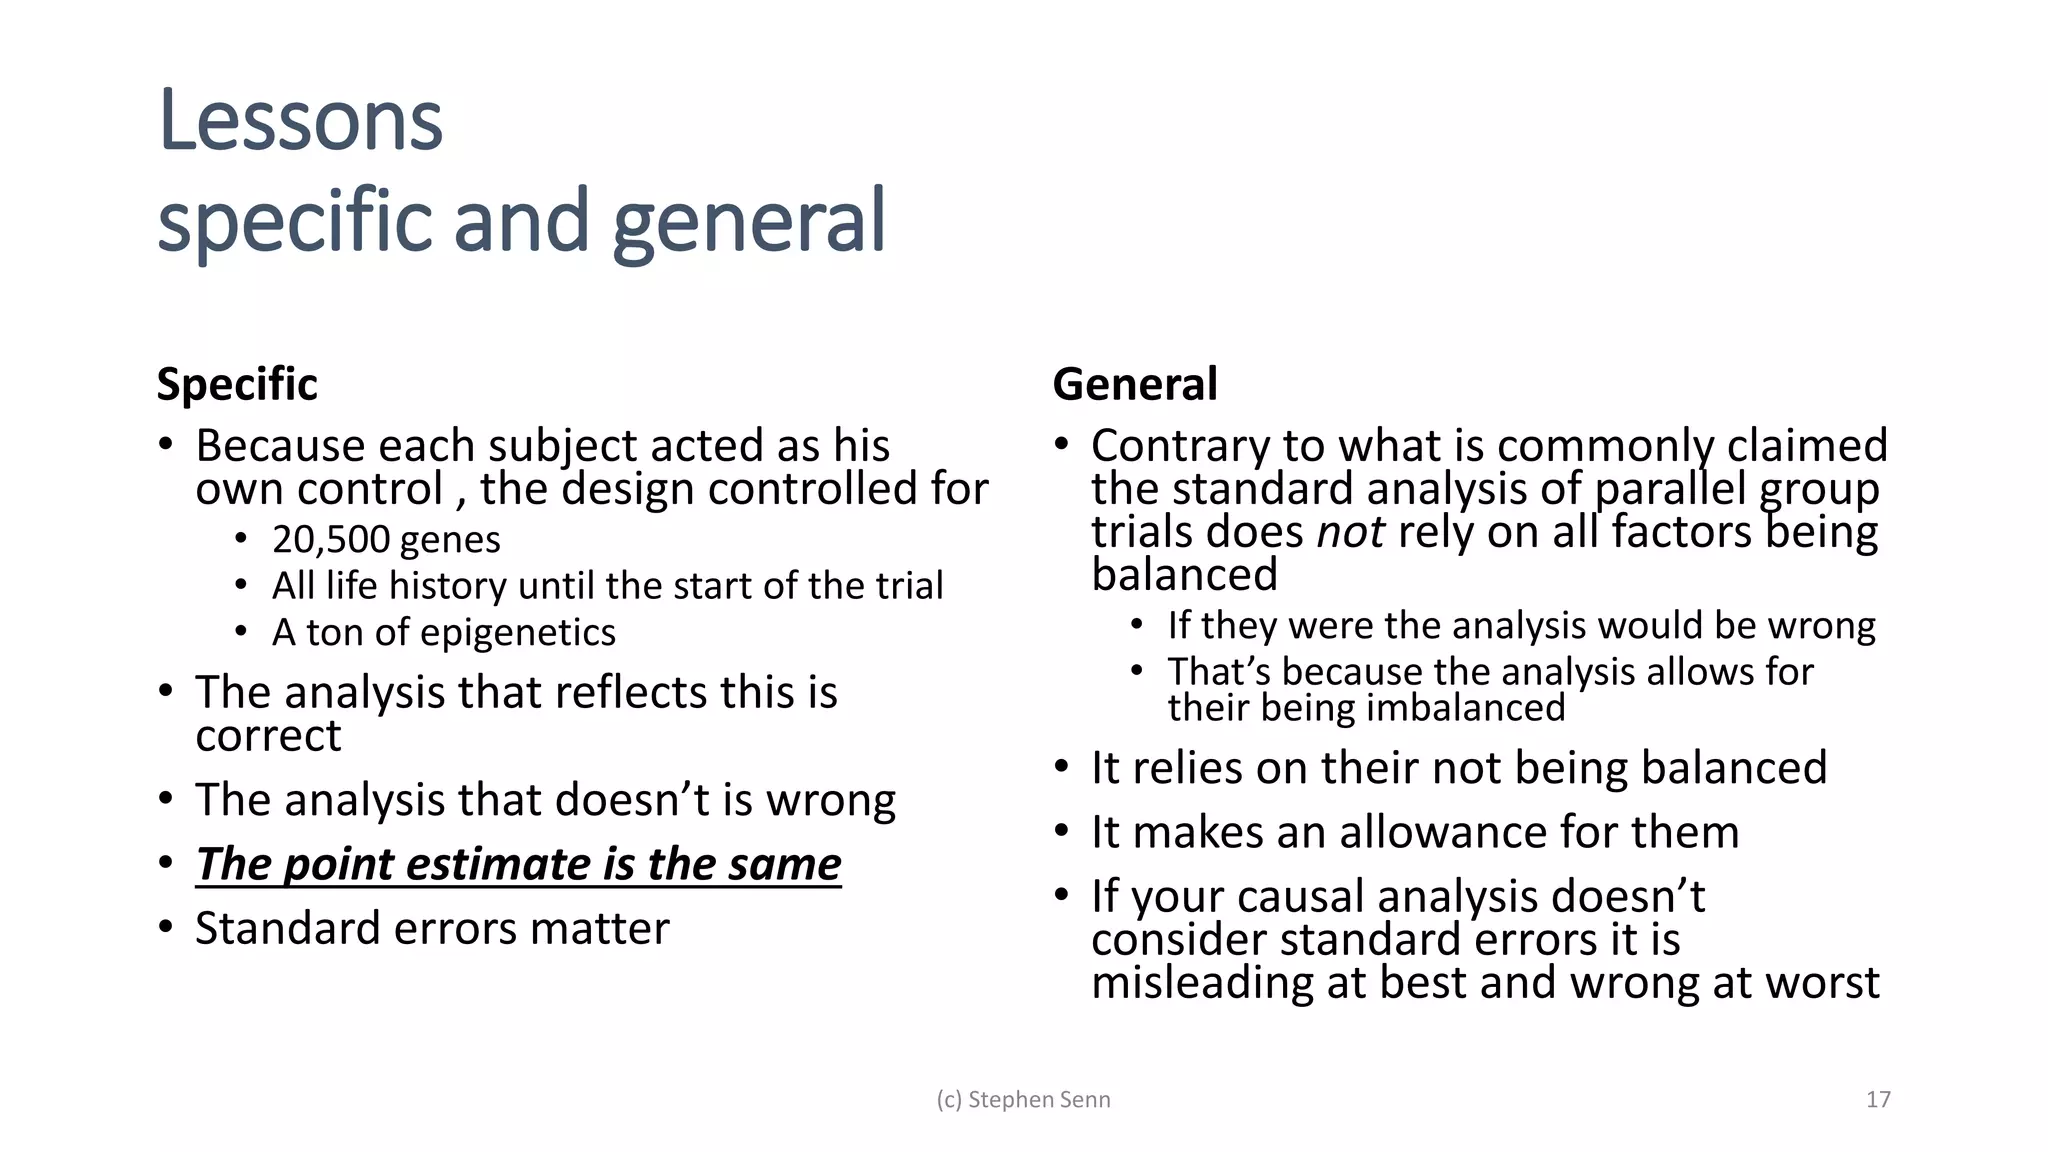
2) For causal questions, randomization-based analyses that account for study design are important. Linear models can be valid if they respect randomization.
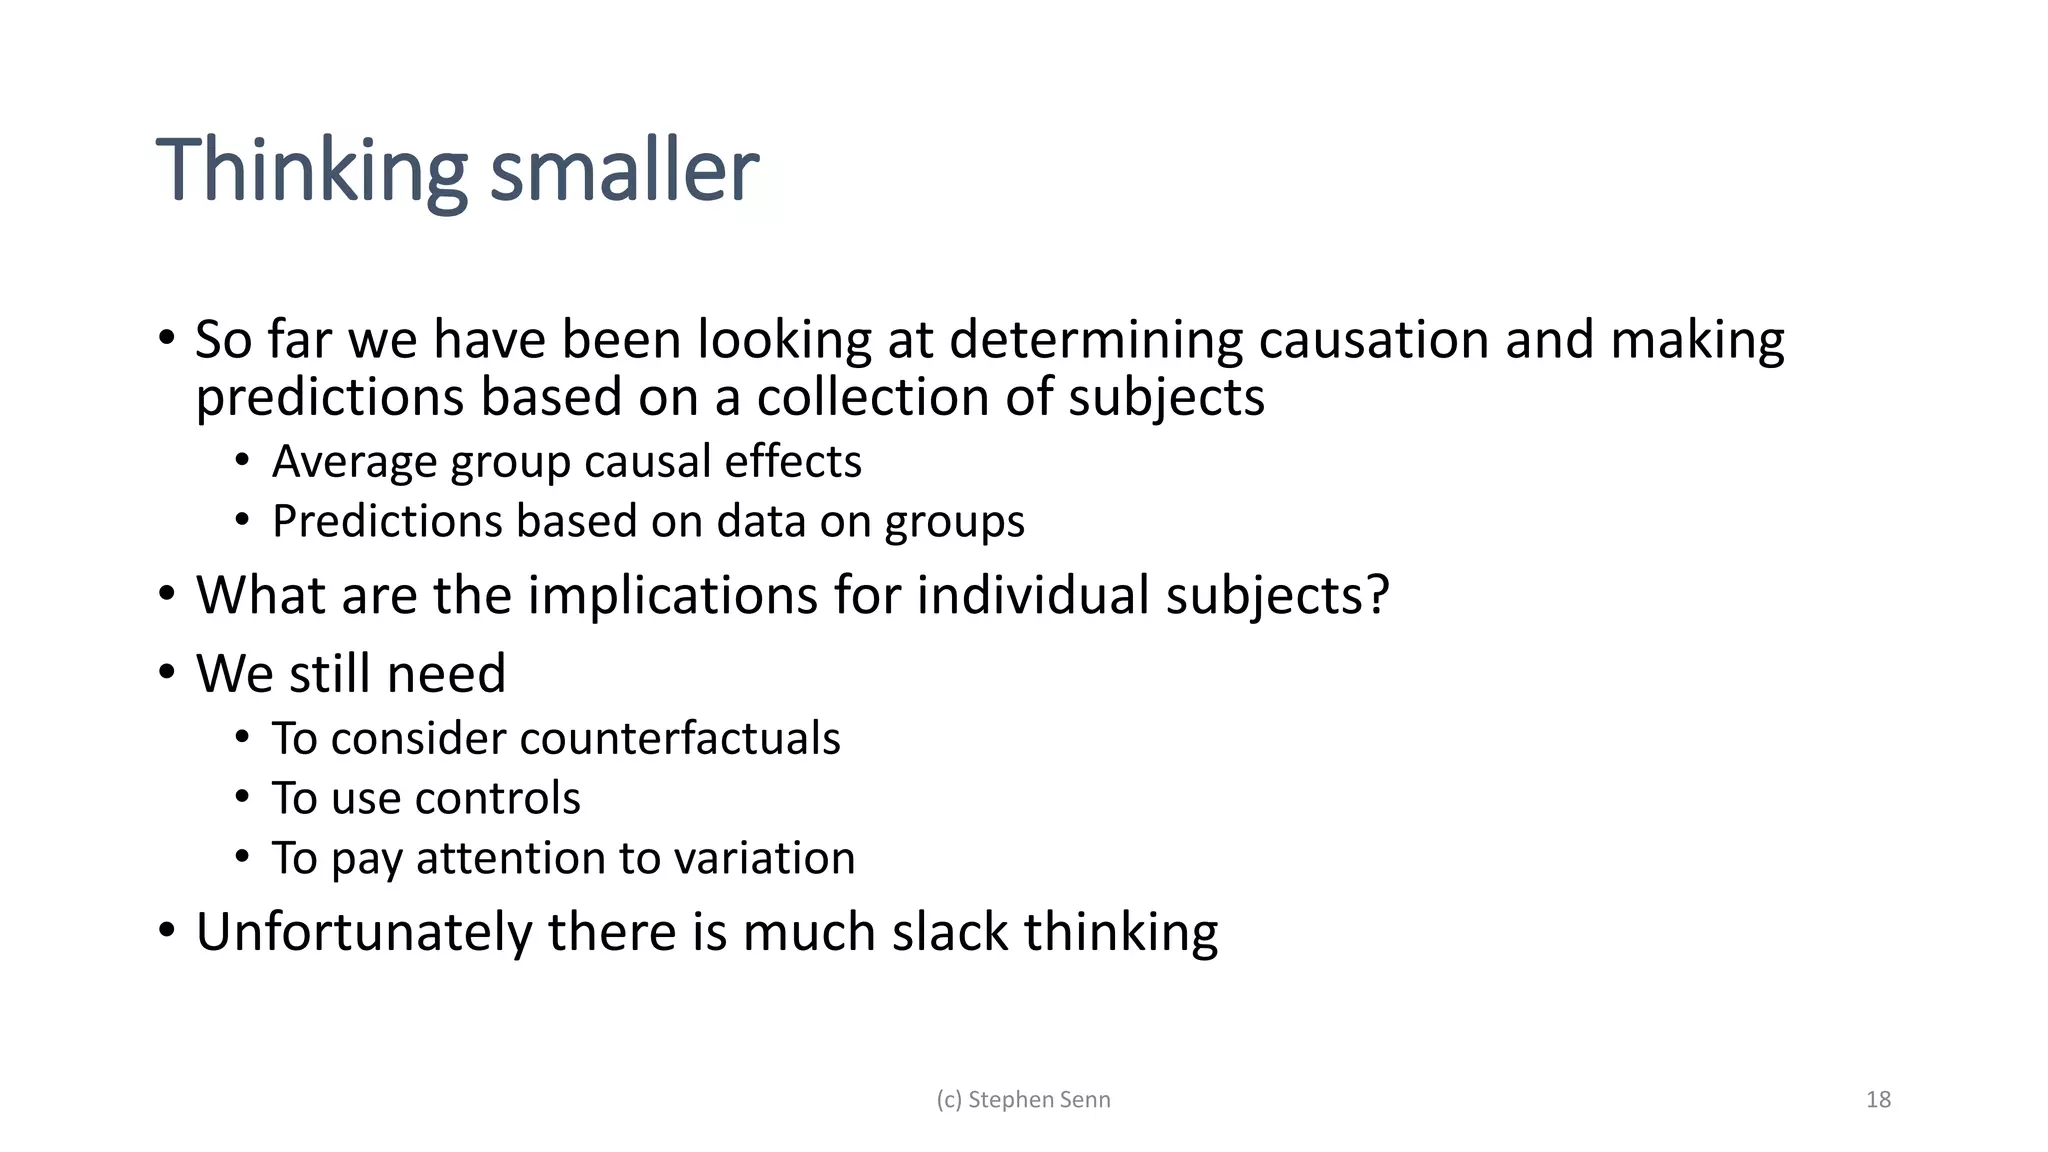
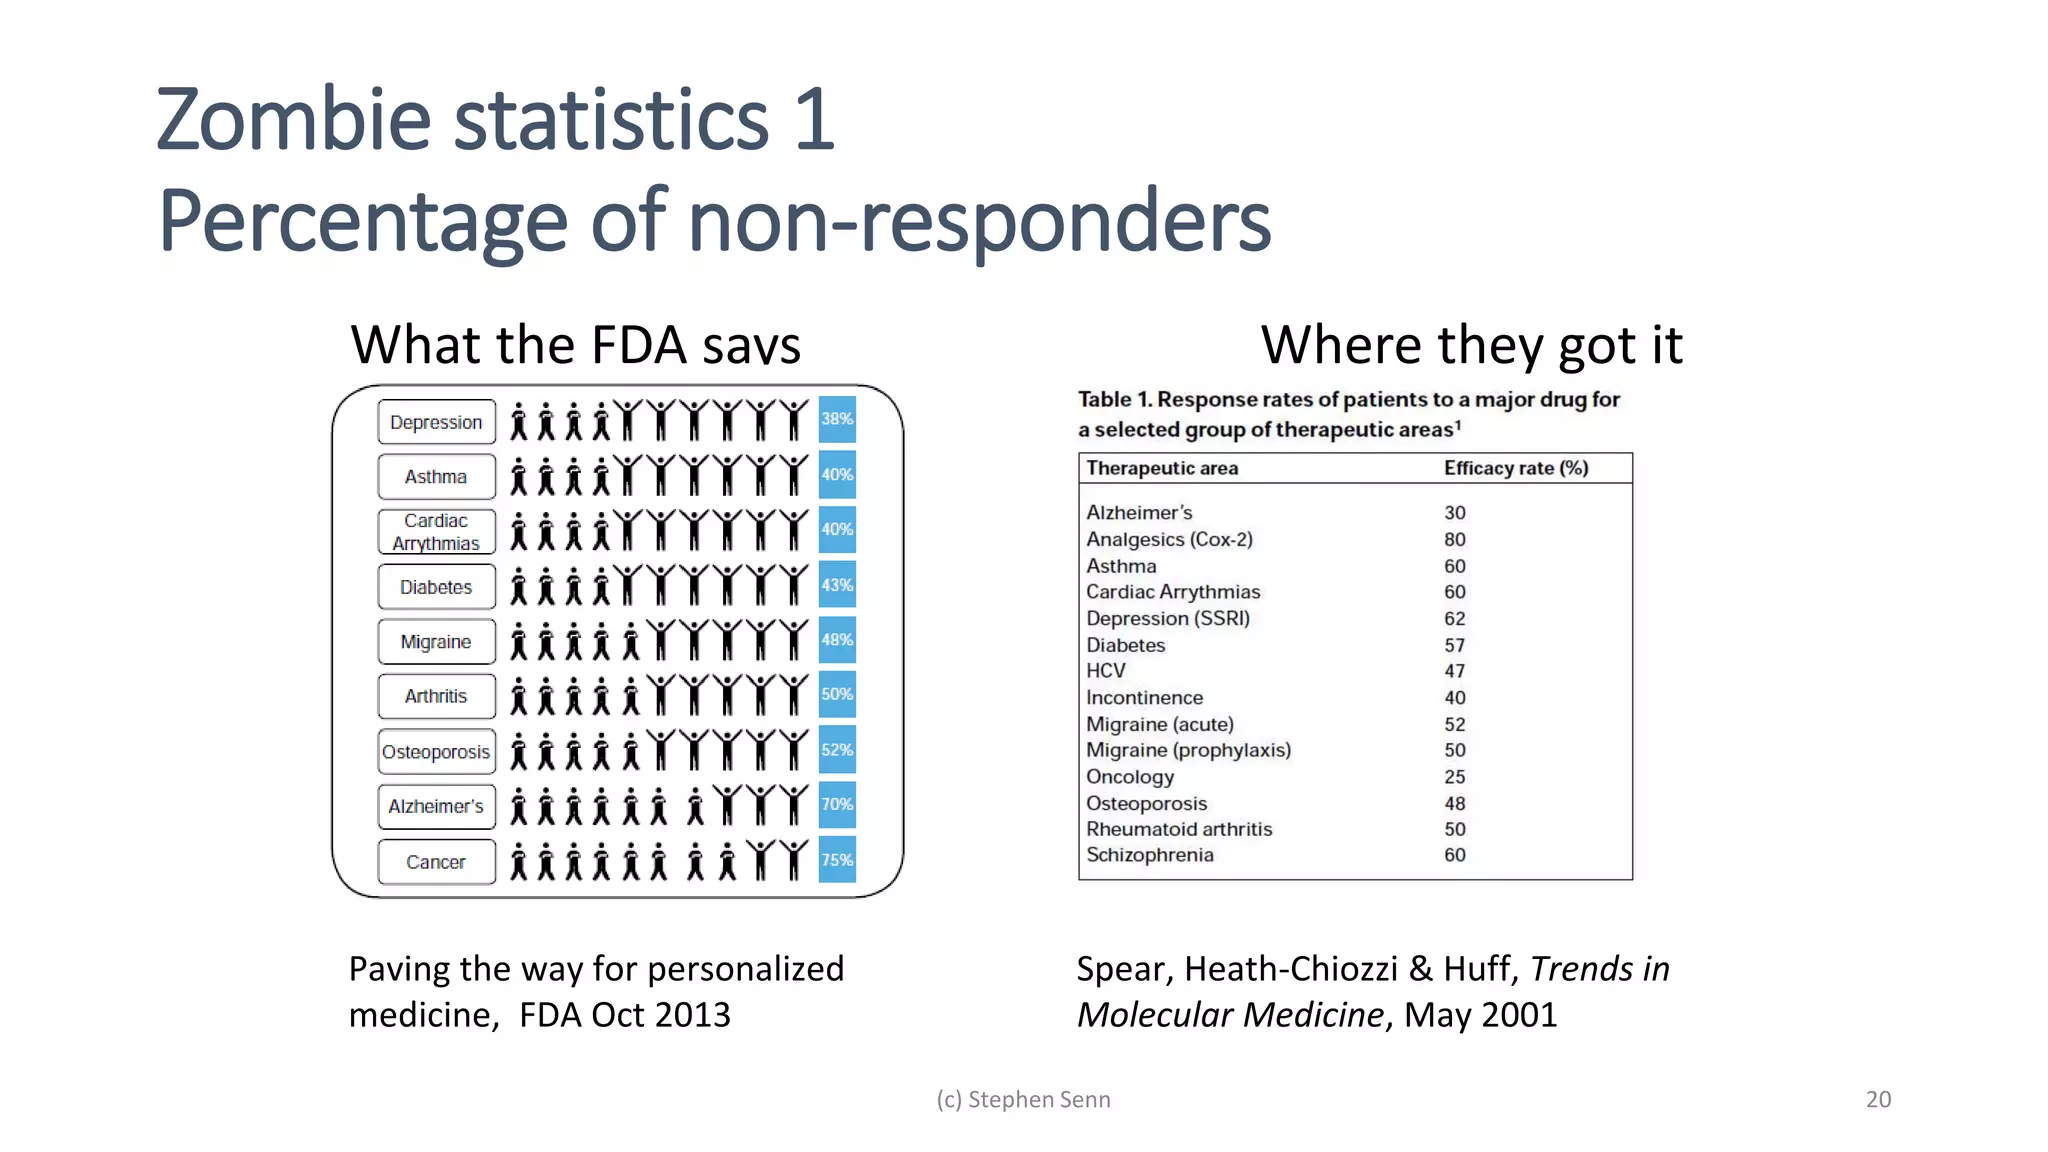
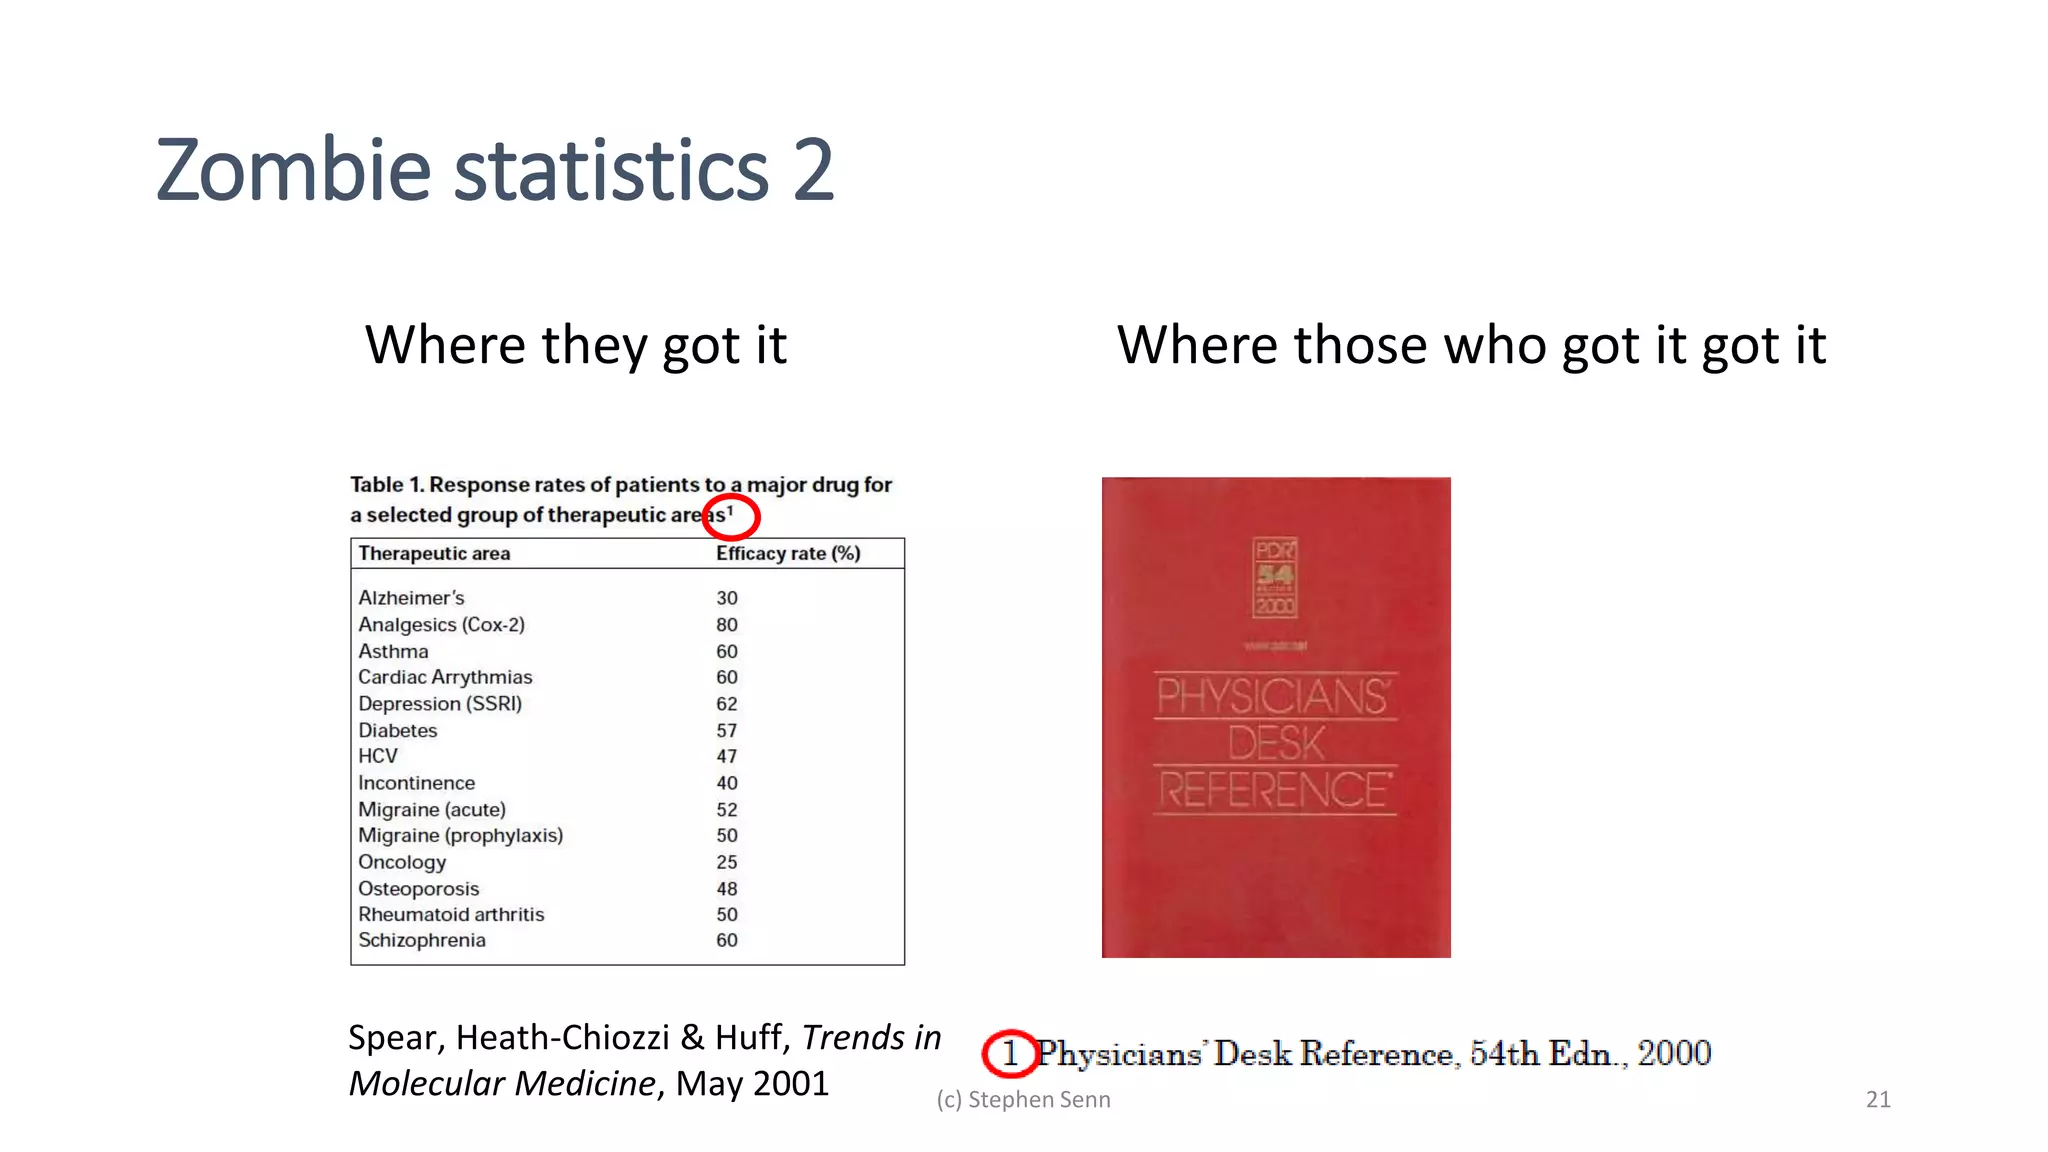
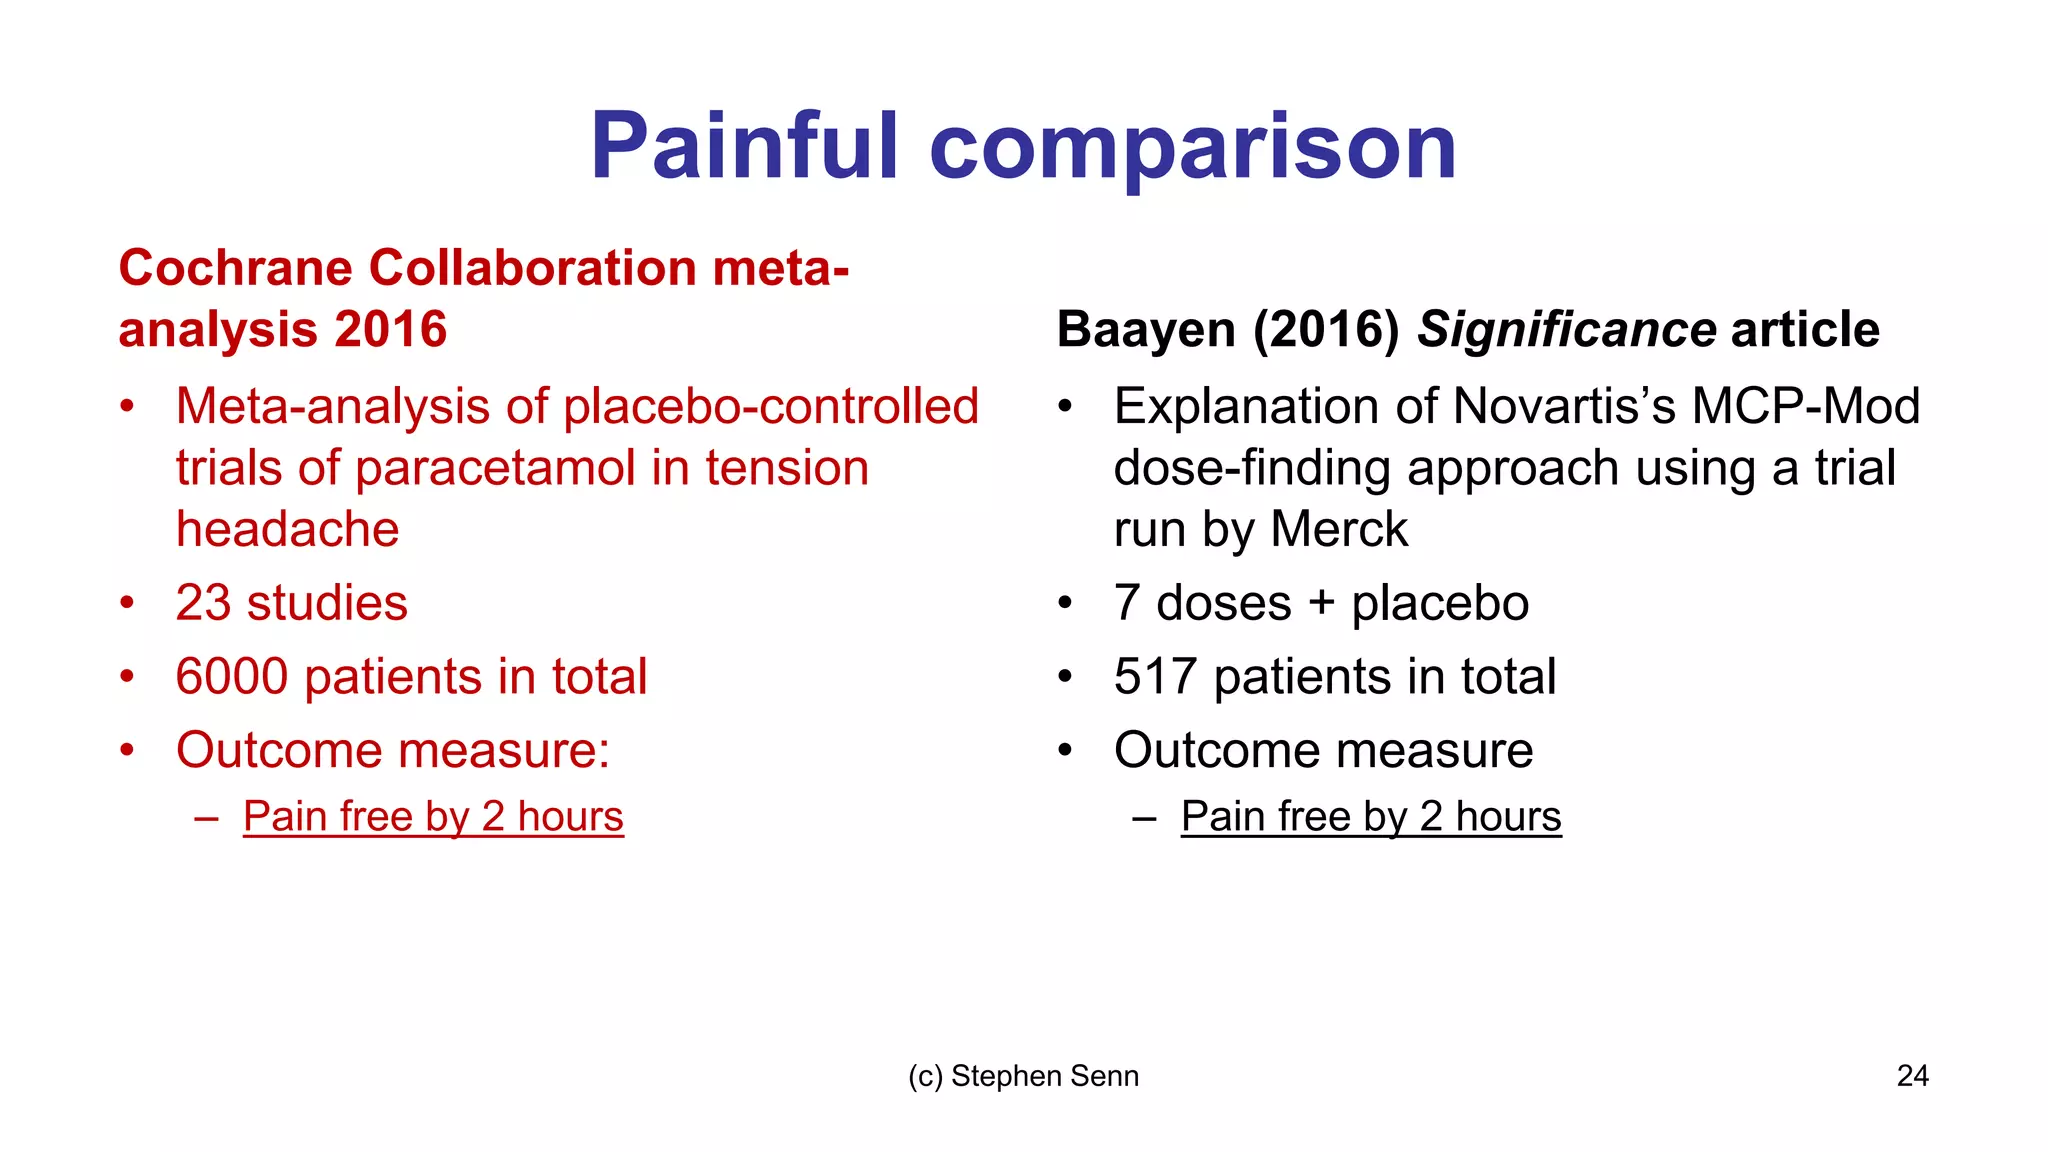
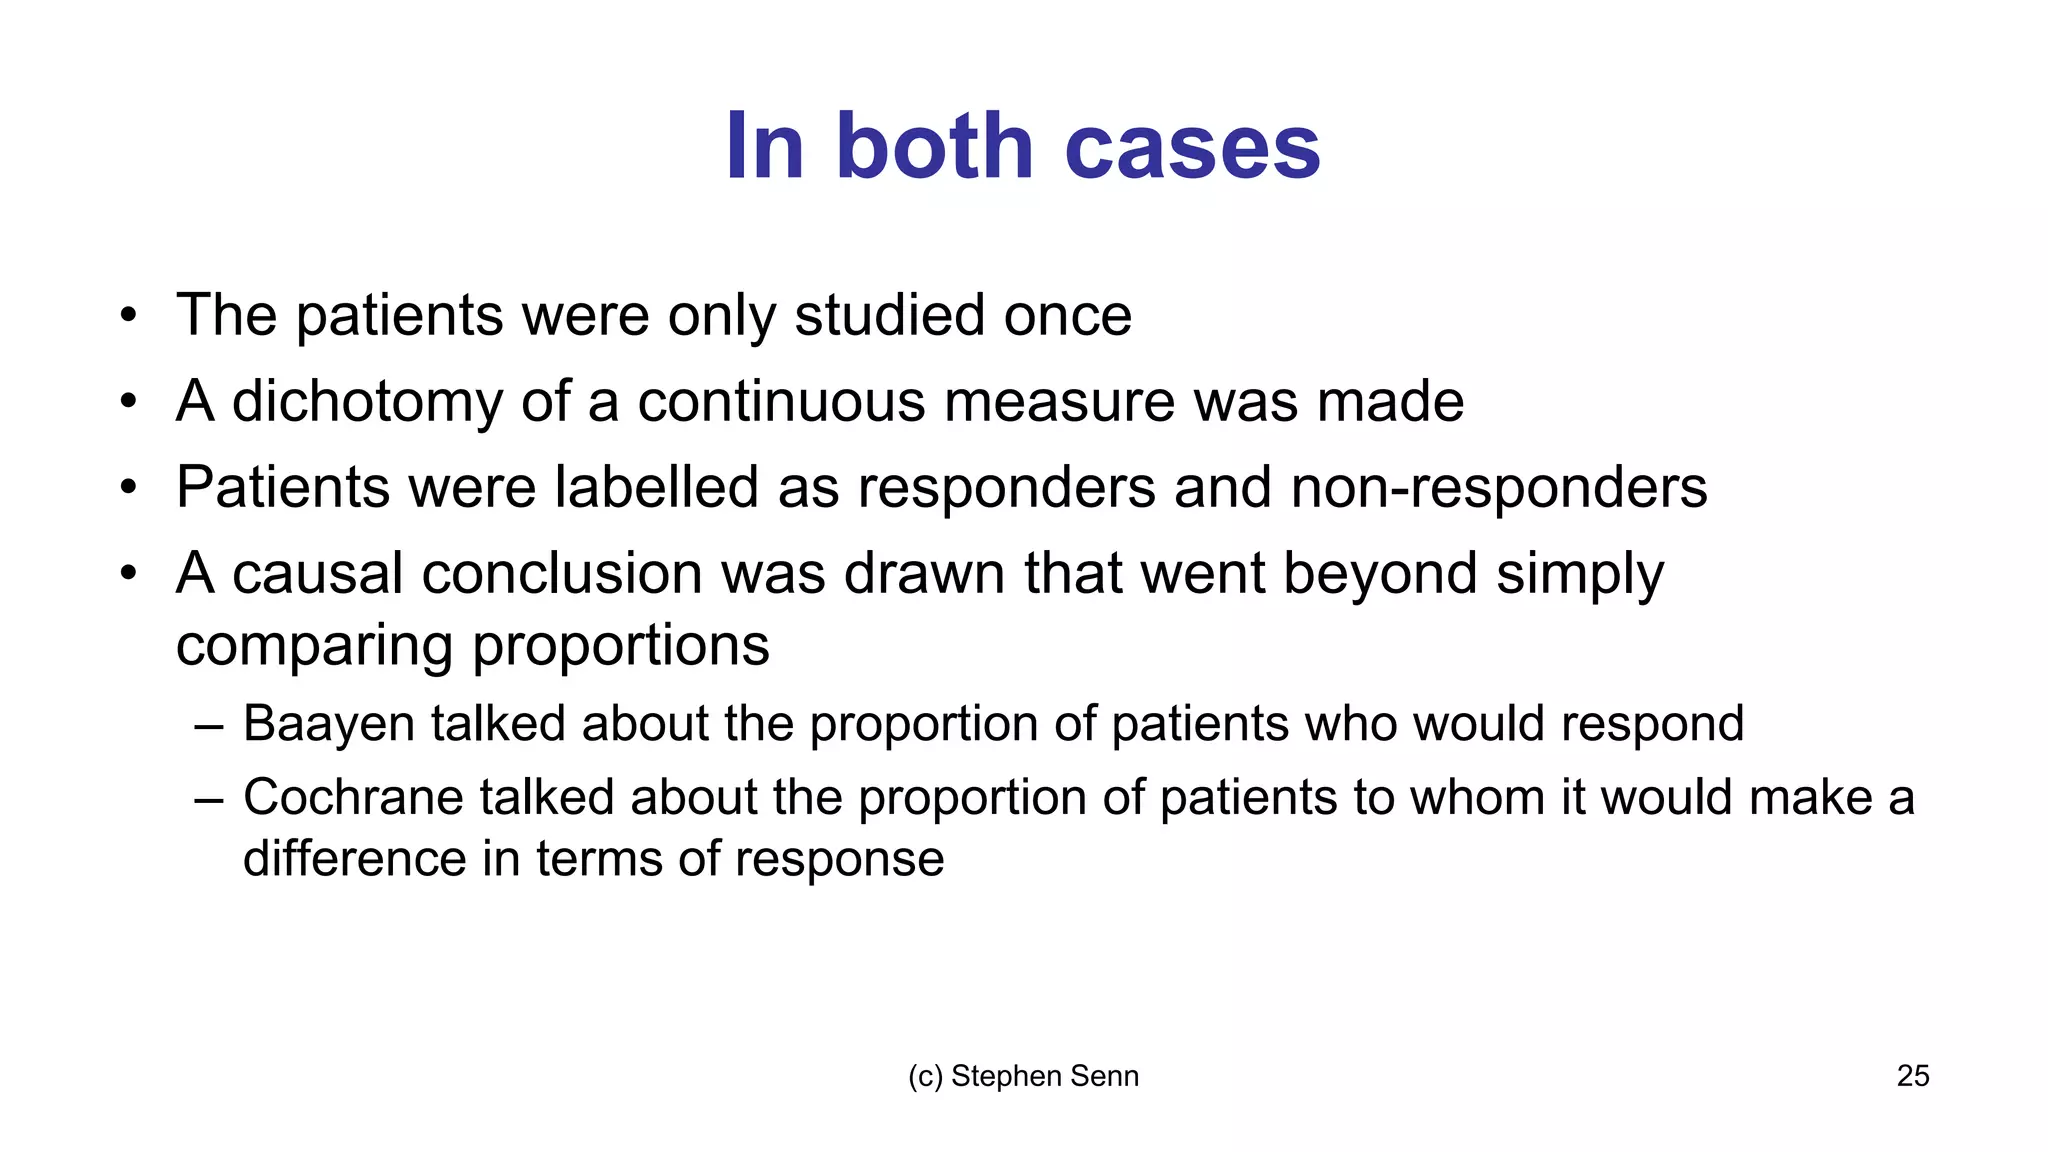
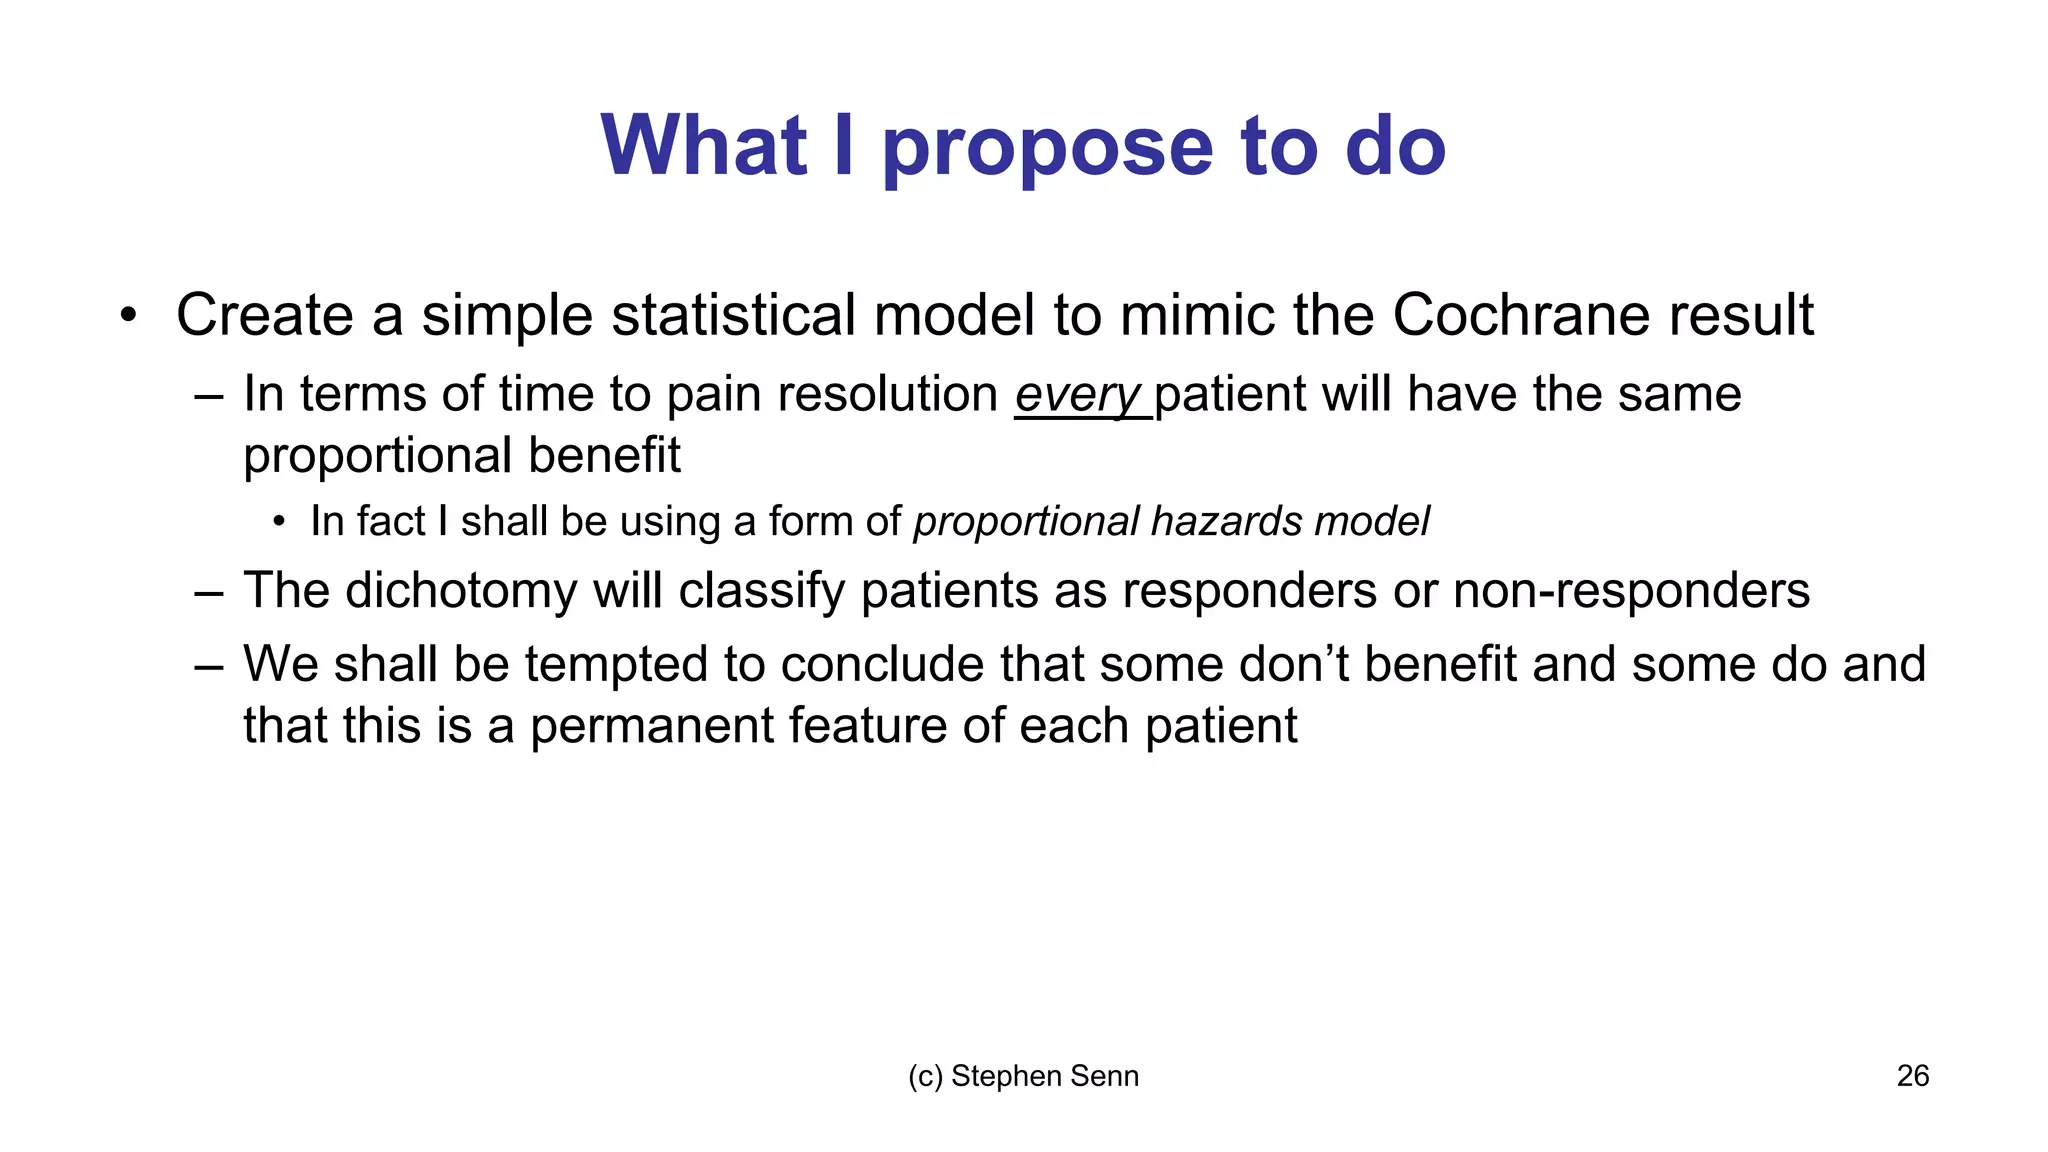
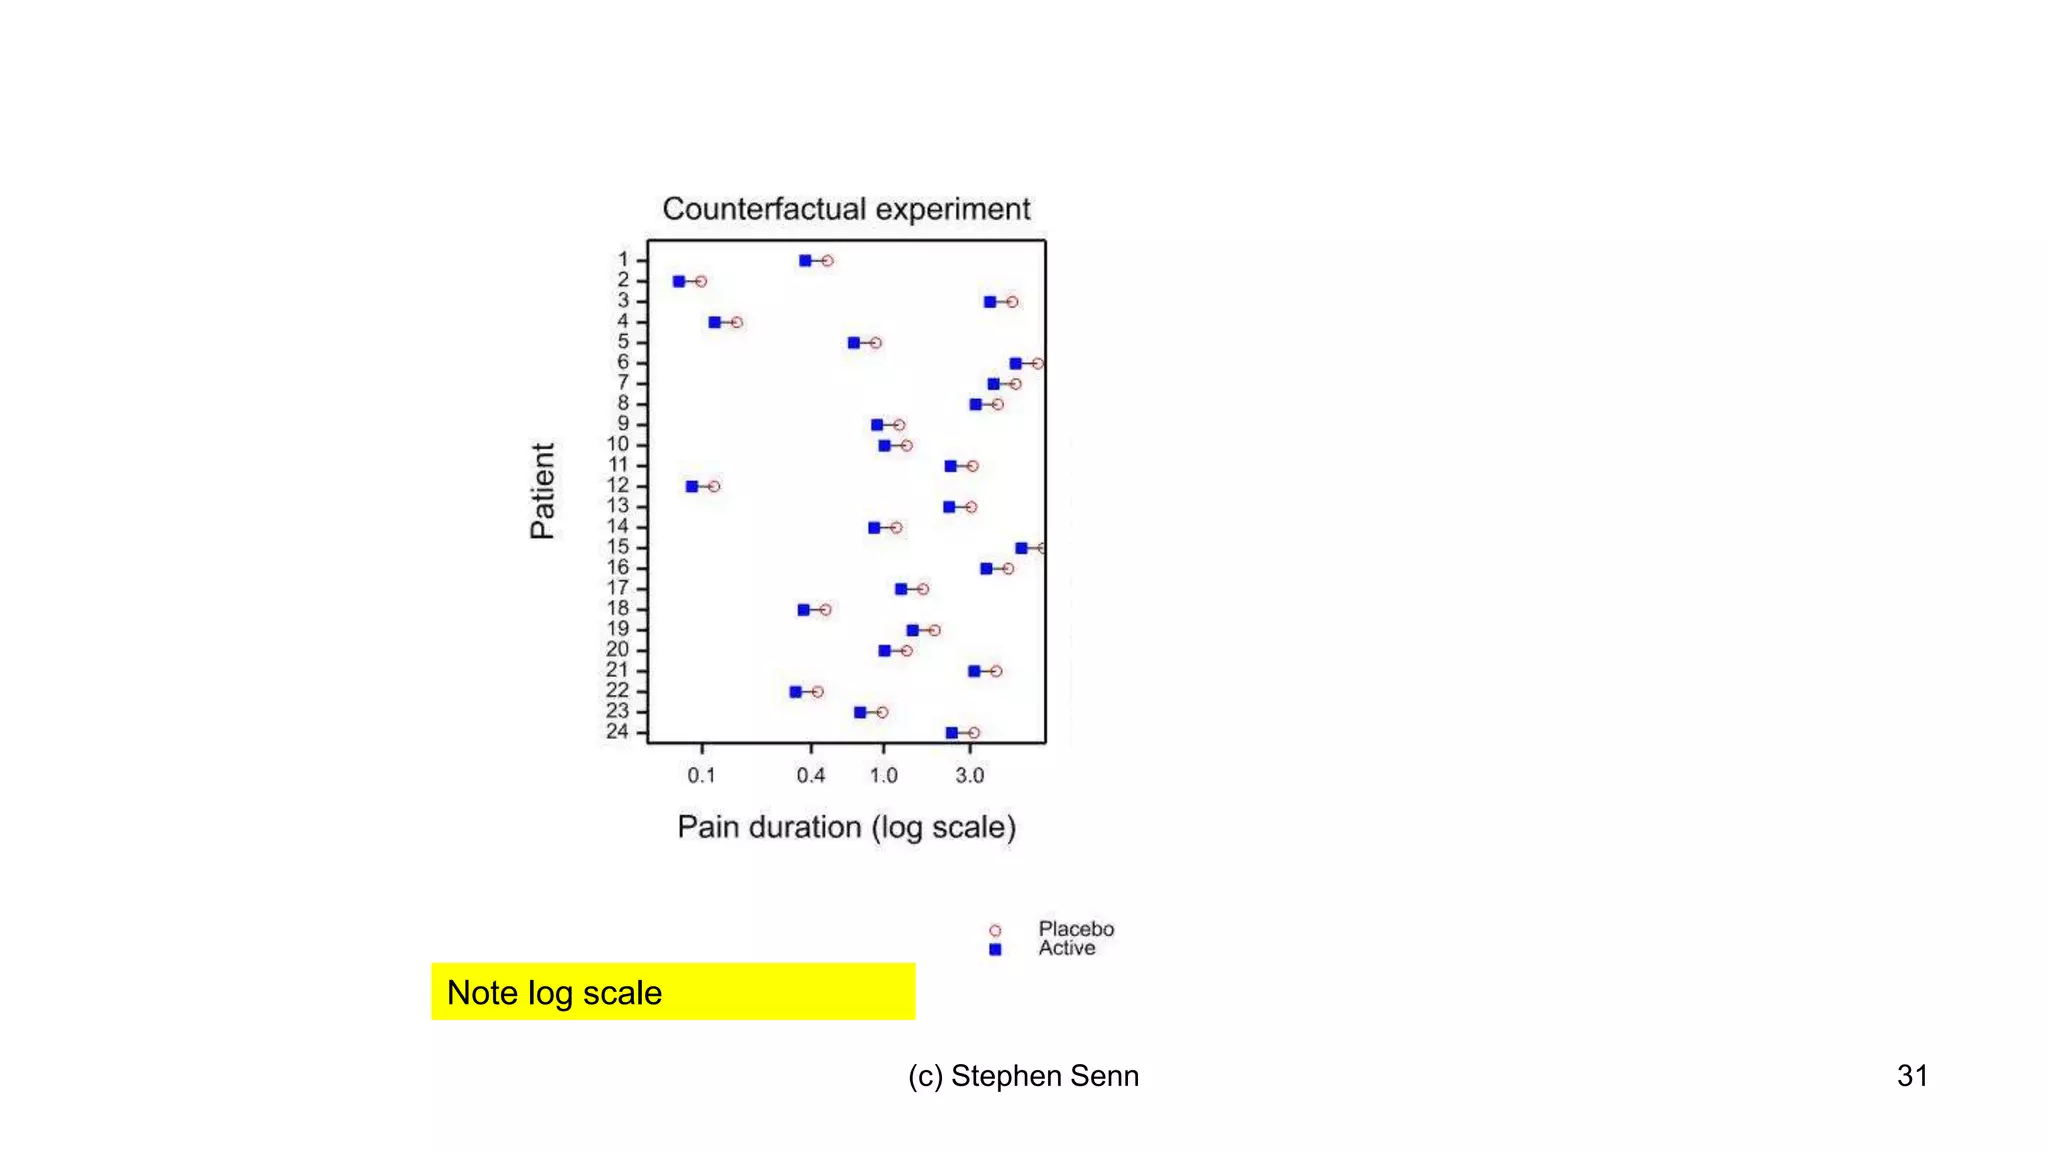
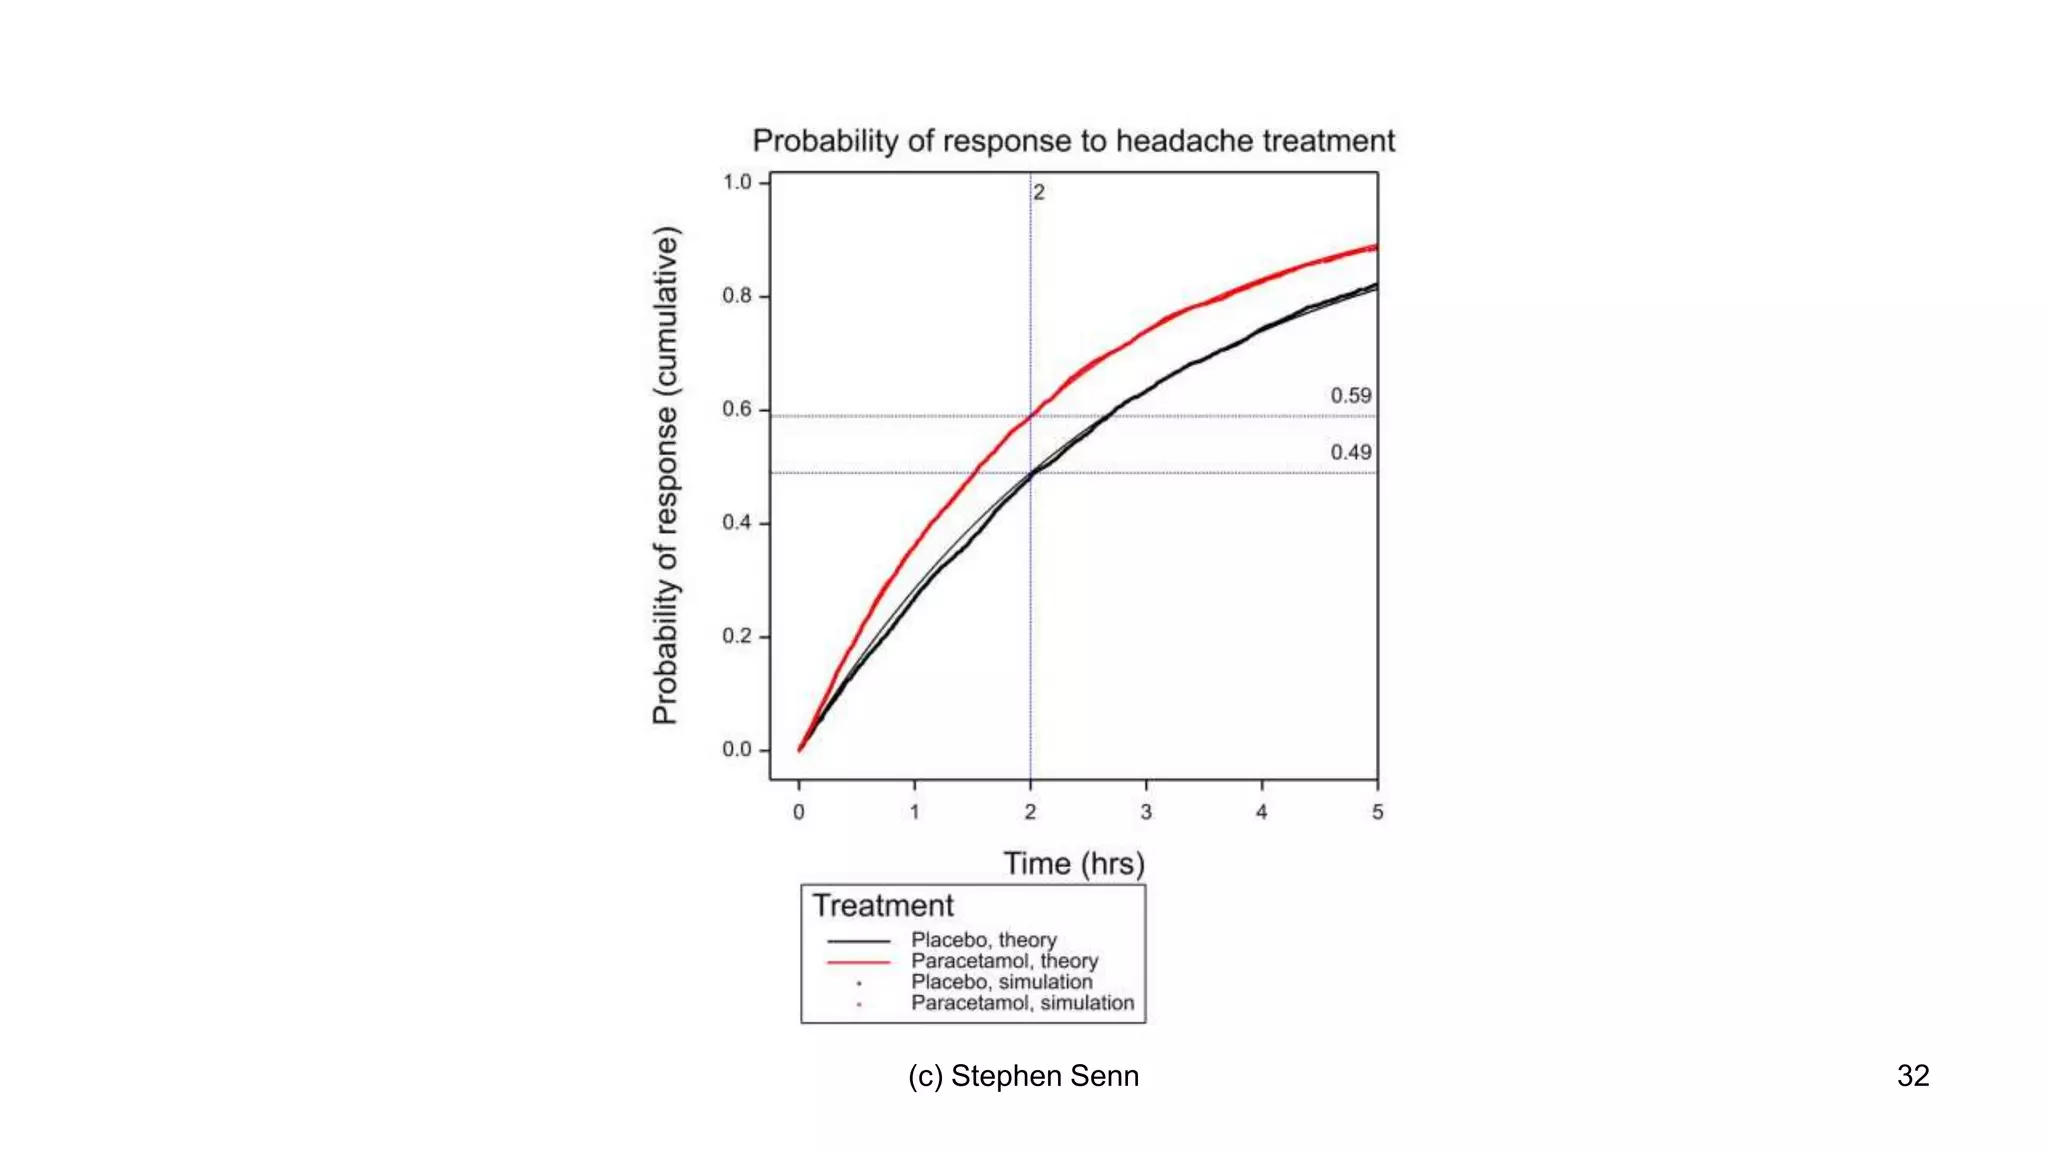
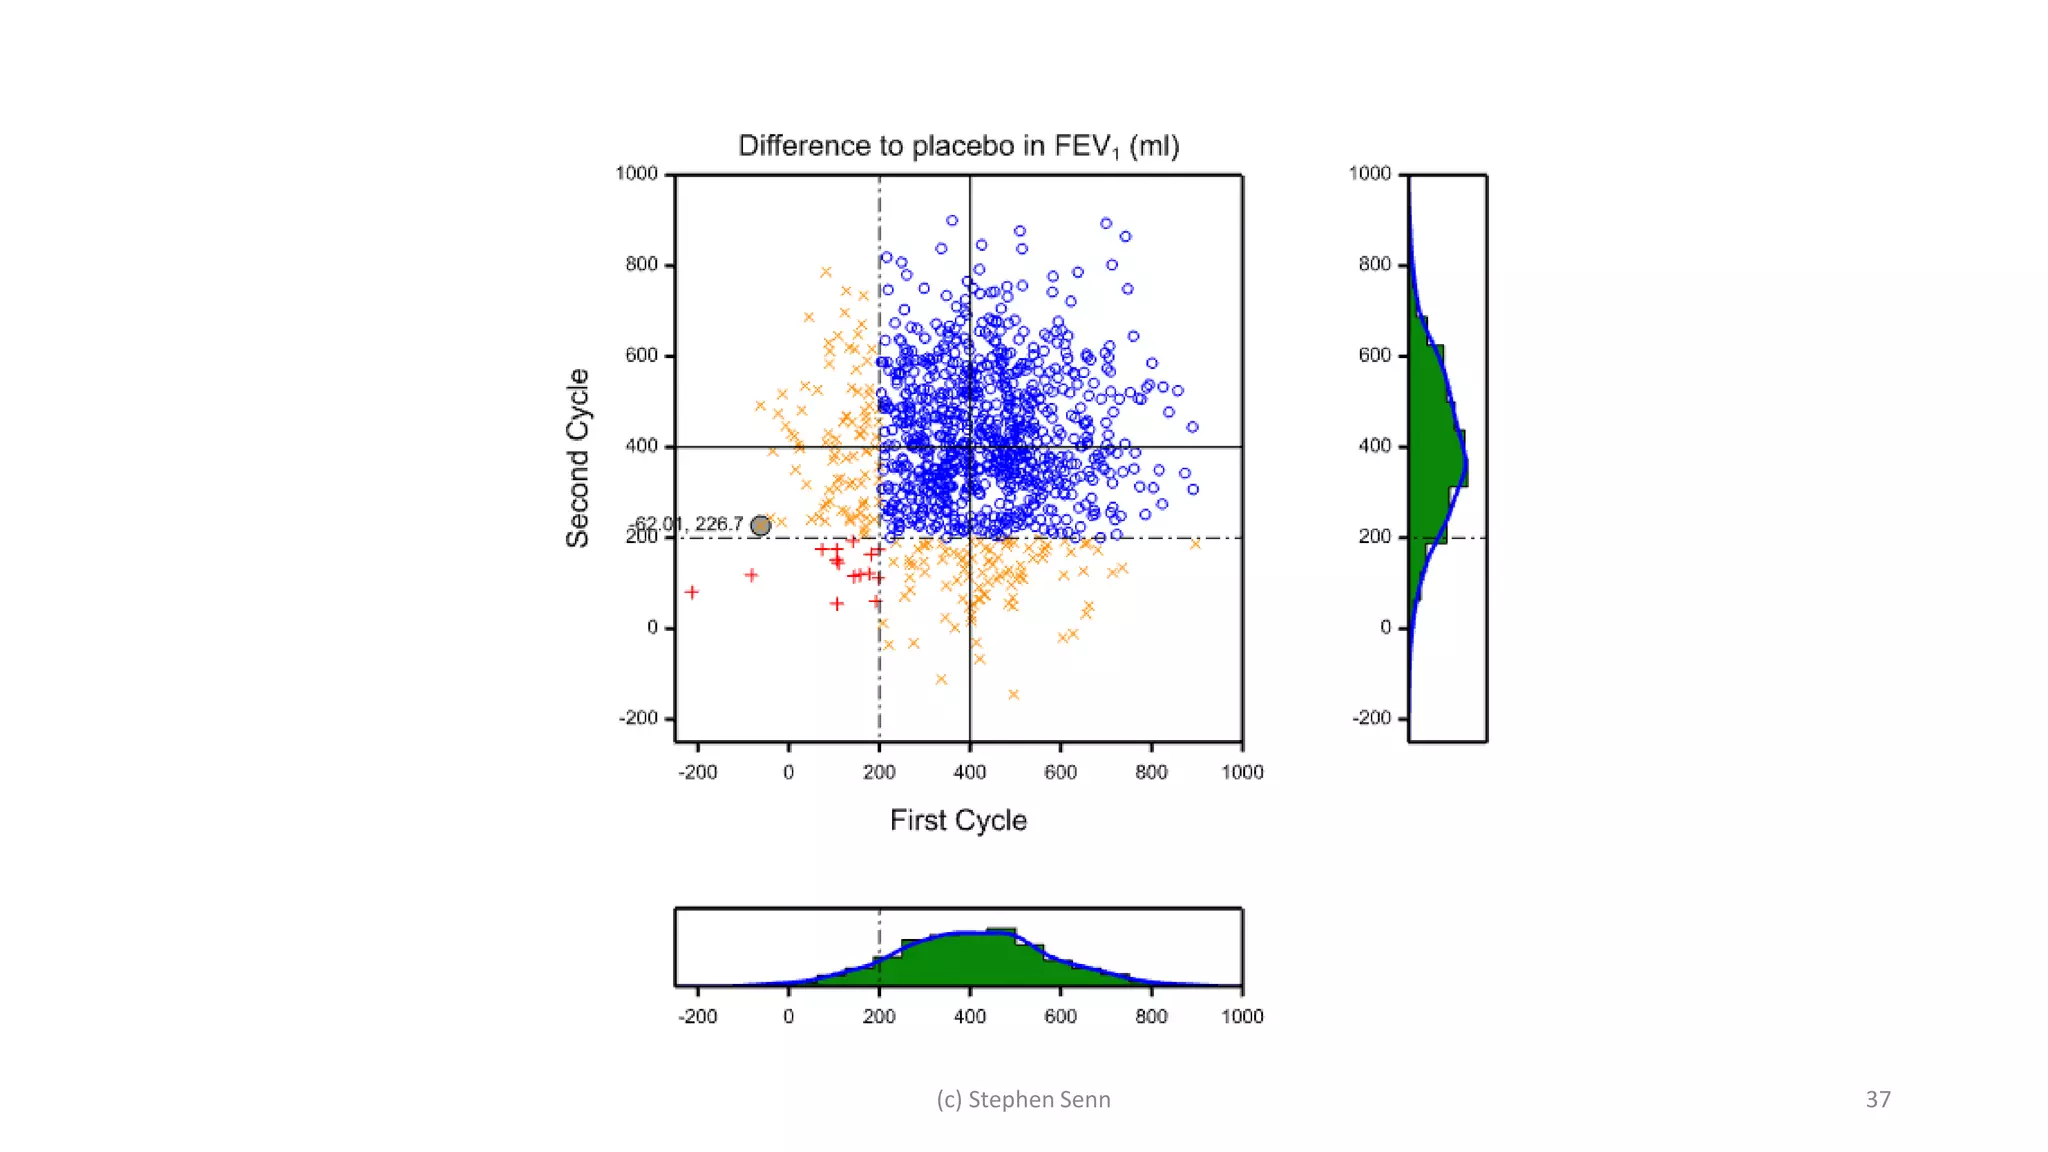
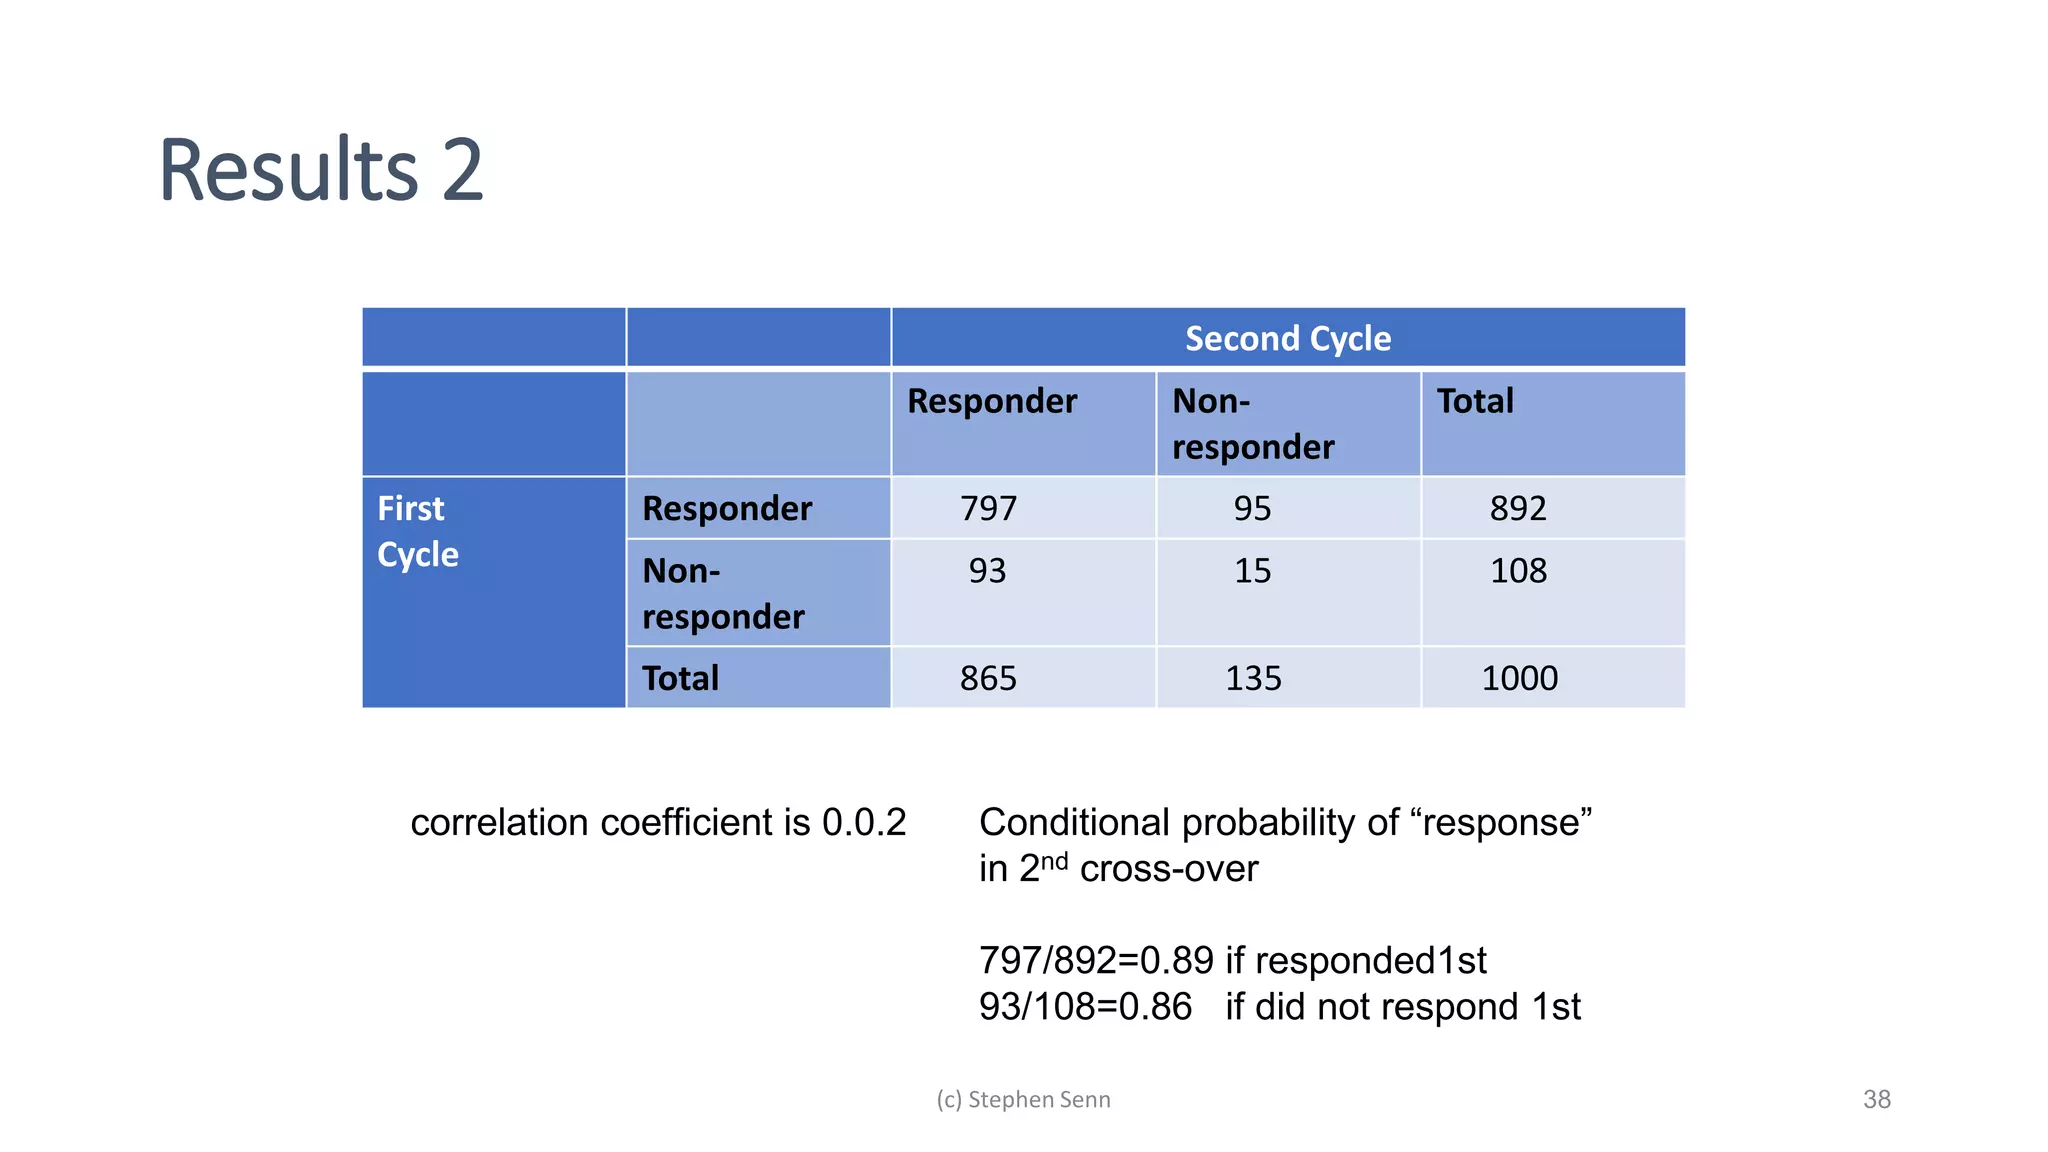
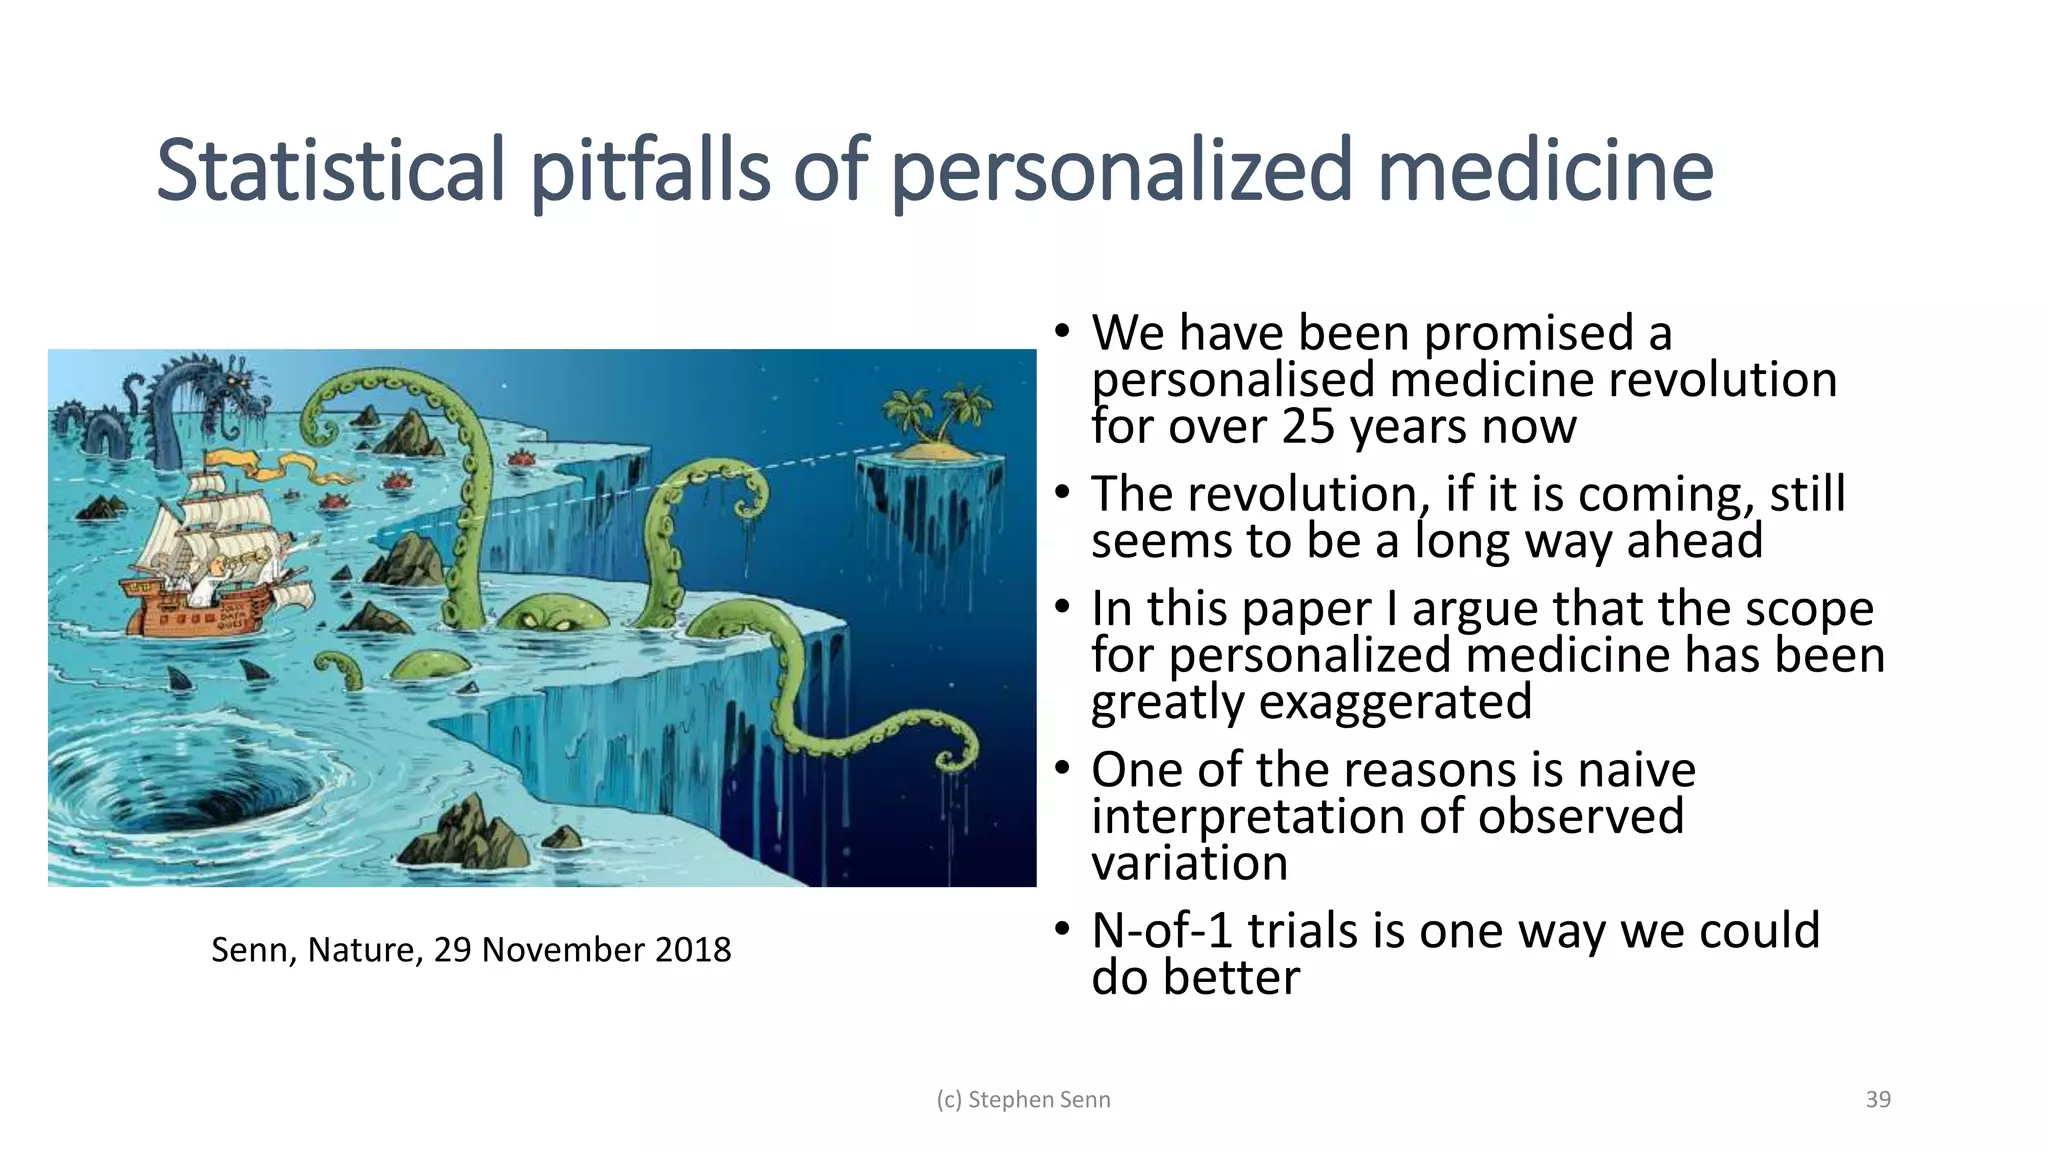
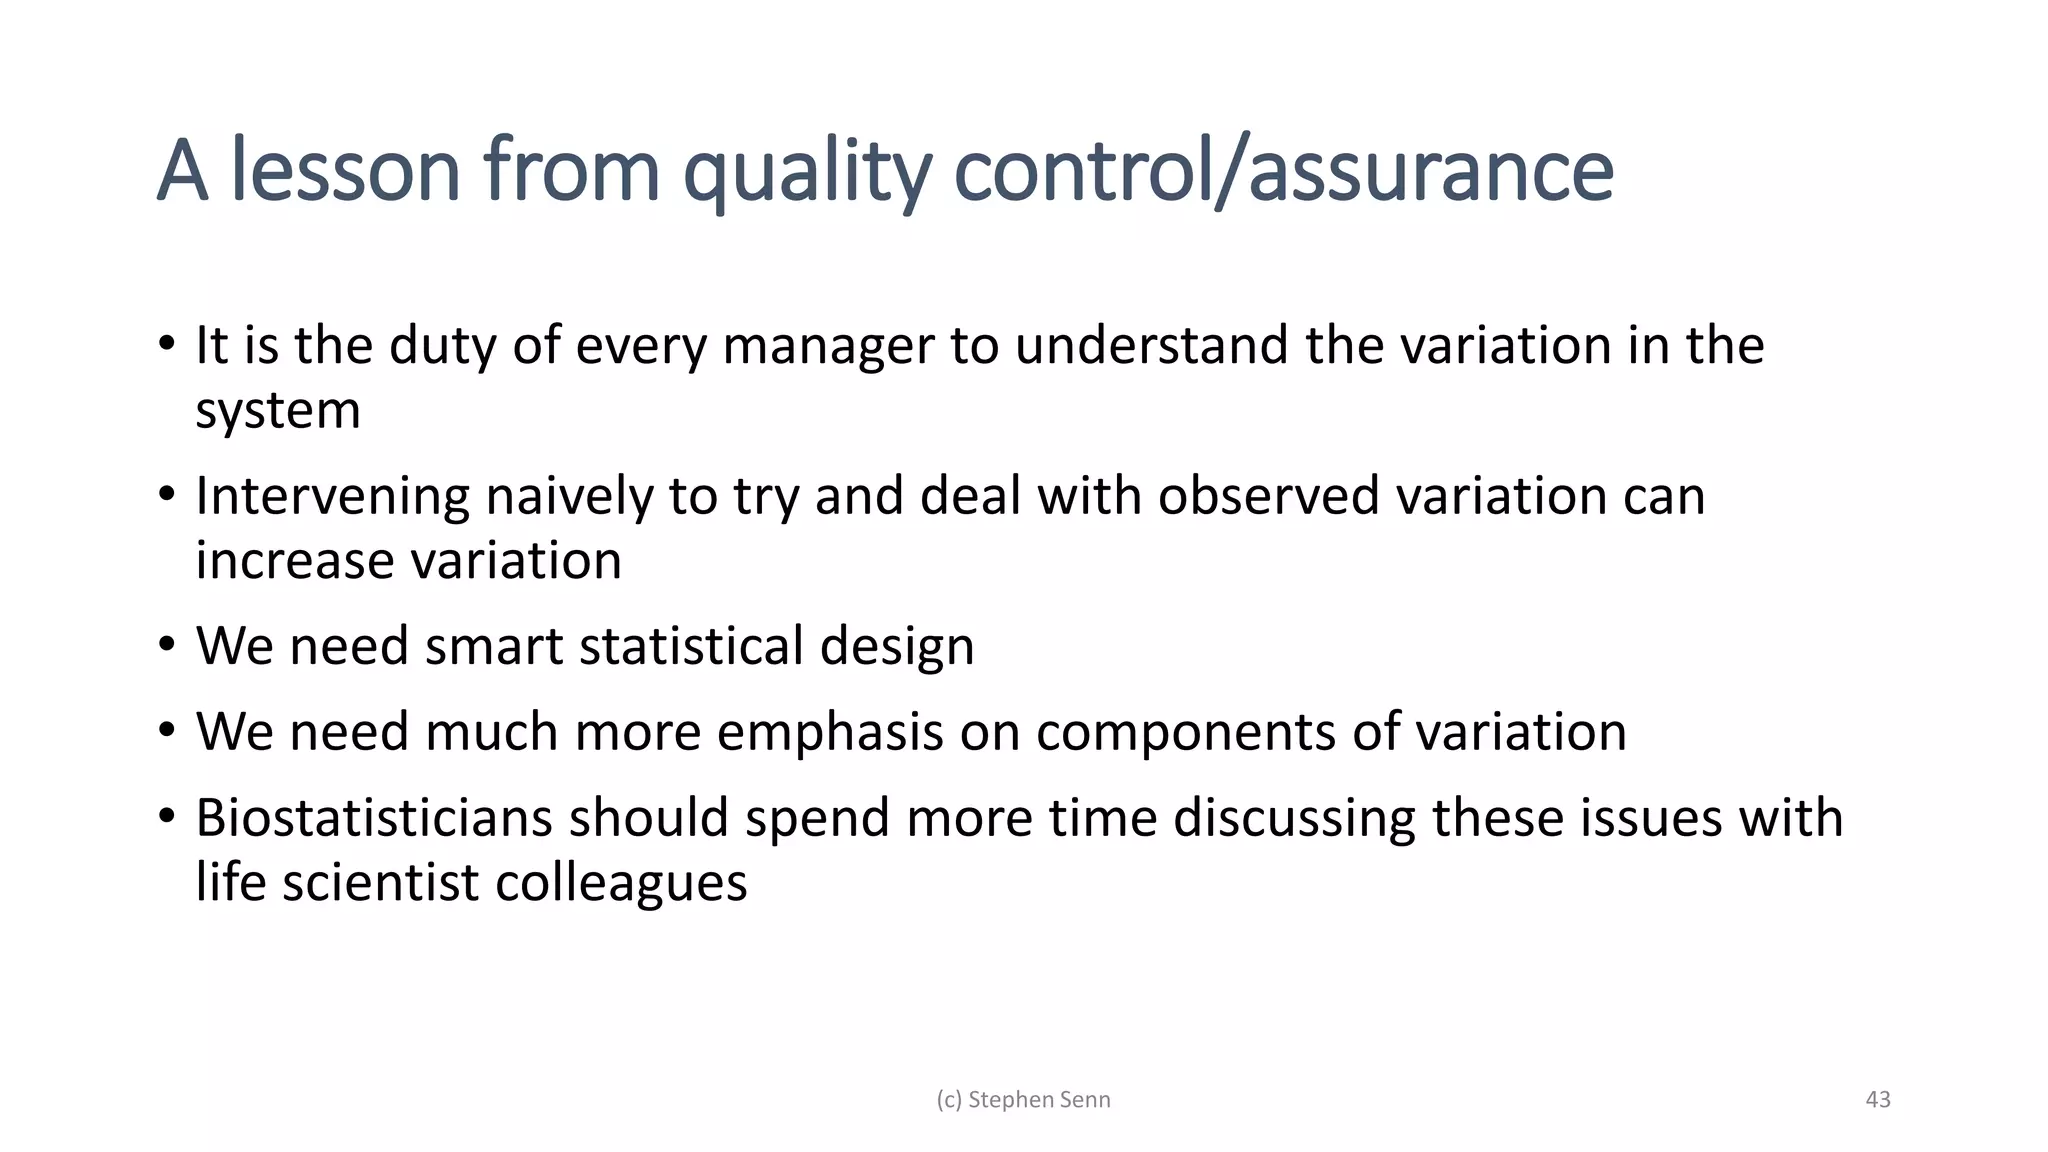
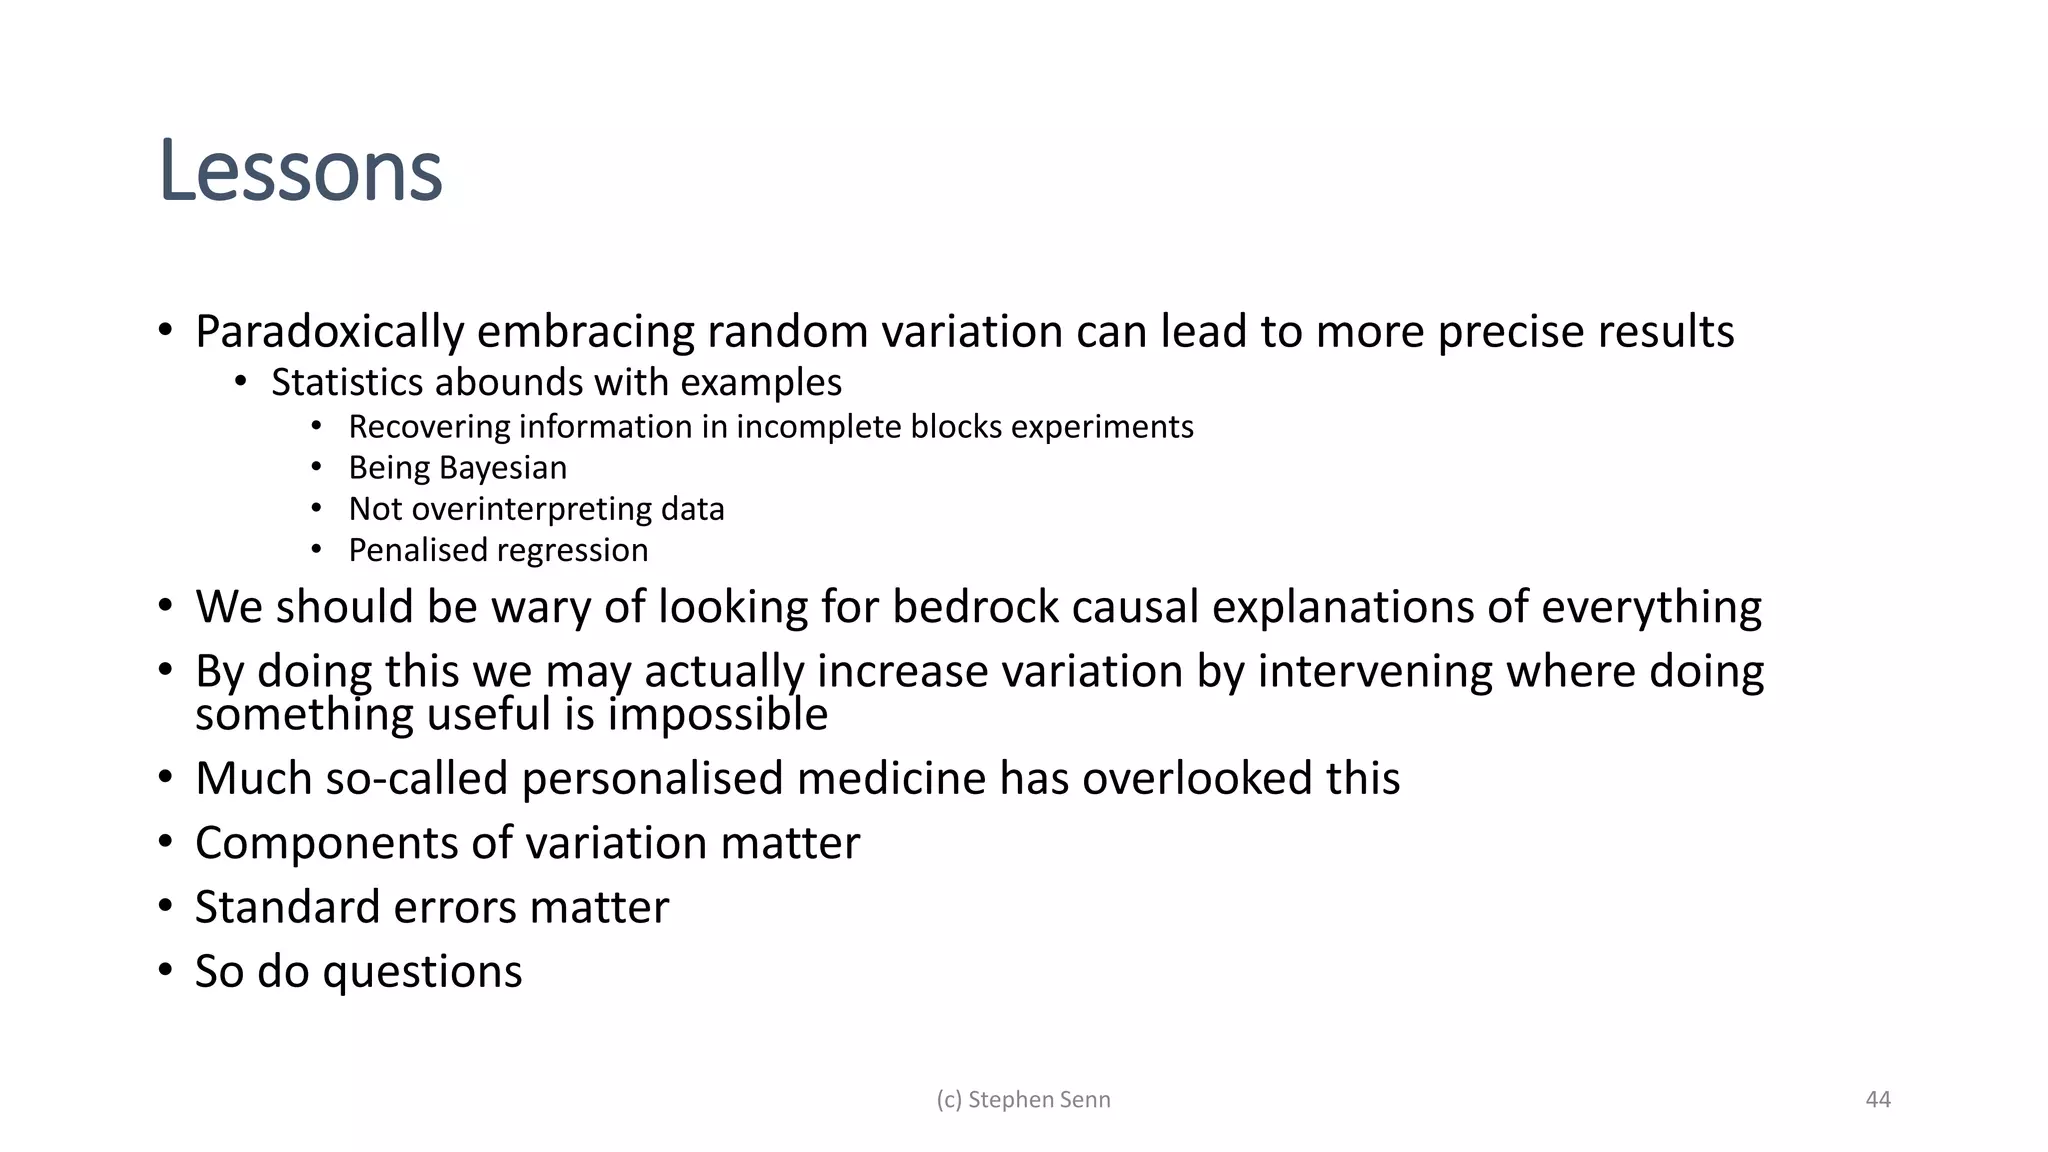
3) Claims of personalized medicine are often overstated due to misinterpretations of variation in trial data. Repeated trials on individuals using designs like n-of-1 trials could provide more insight into response heterogeneity.
There are many valid criticisms of P-values but the criticism that they are largely responsible for the reproducibility crisis has been accepted rather lightly in some quarters. Whatever the inferential statistic that is used, it is quite illogical to assume that as the sample size increases it will tend to show more evidence against the null hypothesis. This applies to Bayesian posterior probabilities as much as it does to P-values. In the context of P-values it can be referred to as the trend towards significance fallacy but more generally, for reasons I shall explain, it could be referred to as the anticipated evidence fallacy.
The anticipated evidence fallacy is itself an example of the overstated evidence fallacy. I shall also discuss this fallacy and other relevant matters affecting reproducible science including the problem of false negatives.
Talk given at ISCB 2016 Birmingham
For indications and treatments where their use is possible, n-of-1 trials represent a promising means of investigating potential treatments for rare diseases. Each patient permits repeated comparison of the treatments being investigated and this both increases the number of observations and reduces their variability compared to conventional parallel group trials.
However, depending on whether the framework for analysis used is randomisation-based or model- based produces puzzling difference in inferences. This can easily be shown by starting on the one hand with the randomisation philosophy associated with the Rothamsted school of inference and building up the analysis through the block + treatment structure approach associated with John Nelder’s theory of general balance (as implemented in GenStat®) or starting on the other hand with a plausible variance component approach through a mixed model. However, it can be shown that these differences are related not so much to modelling approach per se but to the questions one attempts to answer: ranging from testing whether there was a difference between treatments in the patients studied, to predicting the true difference for a future patient, via making inferences about the effect in the average patient.
This in turn yields interesting insight into the long-run debate over the use of fixed or random effect meta-analysis.
Some practical issues of analysis will also be covered in R and SAS®, in which languages some functions and macros to facilitate analysis have been written. It is concluded that n-of-1 hold great promise in investigating chronic rare diseases but that careful consideration of matters of purpose, design and analysis is necessary to make best use of them.
Acknowledgement
This work is partly supported by the European Union’s 7th Framework Programme for research, technological development and demonstration under grant agreement no. 602552. “IDEAL”
It is argued that when it comes to nuisance parameters an assumption of ignorance is harmful. On the other hand this raises problems as to how far one should go in searching for further data when combining evidence.
What should we expect from reproducibiliryStephen Senn
Is there really a reproducibility crisis and if so are P-values to blame? Choose any statistic you like and carry out two identical independent studies and report this statistic for each. In advance of collecting any data, you ought to expect that it is just as likely that statistic 1 will be smaller than statistic 2 as vice versa. Once you have seen statistic 1, things are not so simple but if they are not so simple, it is that you have other information in some form. However, it is at least instructive that you need to be careful in jumping to conclusions about what to expect from reproducibility. Furthermore, the forecasts of good Bayesians ought to obey a Martingale property. On average you should be in the future where you are now but, of course, your inferential random walk may lead to some peregrination before it homes in on “the truth”. But you certainly can’t generally expect that a probability will get smaller as you continue. P-values, like other statistics are a position not a movement. Although often claimed, there is no such things as a trend towards significance.
Using these and other philosophical considerations I shall try and establish what it is we want from reproducibility. I shall conclude that we statisticians should probably be paying more attention to checking that standard errors are being calculated appropriately and rather less to inferential framework.
When estimating sample sizes for clinical trials there are several different views that might be taken as to what definition and meaning should be given to the sought-for treatment effect. However, if the concept of a ‘minimally important difference’ (MID) does have relevance to interpreting clinical trials (which can be disputed) then its value cannot be the same as the ‘clinically relevant difference’ (CRD) that would be used for planning them.
A doubly pernicious use of the MID is as a means of classifying patients as responders and non-responders. Not only does such an analysis lead to an increase in the necessary sample size but it misleads trialists into making causal distinctions that the data cannot support and has been responsible for exaggerating the scope for personalised medicine.
In this talk these statistical points will be explained using a minimum of technical detail.
Clinical trials: quo vadis in the age of covid?Stephen Senn
A discussion of the role of clinical trials in the age of COVID. My contribution to the phastar 2020 life sciences summit https://phastar.com/phastar-life-science-summit
The Rothamsted school meets Lord's paradoxStephen Senn
Lords ‘paradox’ is a notoriously difficult puzzle that is guaranteed to provoke discussion, dissent and disagreement. Two statisticians analyse some observational data and come to radically different conclusions, each of which has acquired defenders over the years since Lord first proposed his puzzle in 1967. It features in the recent Book of Why by Pearl and McKenzie, who use it to demonstrate the power of Pearl’s causal calculus, obtaining a solution they claim is unambiguously right. They also claim that statisticians have failed to get to grips with causal questions for well over a century, in fact ever since Karl Pearson developed Galton’s idea of correlation and warned the scientific world that correlation is not causation.
However, only two years before Lord published his paradox John Nelder outlined a powerful causal calculus for analyzing designed experiments based on a careful distinction between block and treatment structure. This represents an important advance in formalizing the approach to analysing complex experiments that started with Fisher 100 years ago, when he proposed splitting variability using the square of the standard deviation, which he called the variance, continued with Yates and has been developed since the 1960s by Rosemary Bailey, amongst others. This tradition might be referred to as The Rothamsted School. It is fully implemented in Genstat® but, as far as I am aware, not in any other package.
With the help of Genstat®, I demonstrate how the Rothamsted School would approach Lord’s paradox and come to a solution that is not the same as the one reached by Pearl and McKenzie, although given certain strong but untestable assumptions it would reduce to it. I conclude that the statistical tradition may have more to offer in this respect than has been supposed.
The Seven Habits of Highly Effective StatisticiansStephen Senn
This document provides advice on habits that make statisticians effective. It discusses the importance of understanding causation, control, comparison and counterfactuals when thinking about effectiveness. It warns against proposing habits as causes without proper evaluation. Seven key habits are identified: read, listen, understand, think, do, calculate, and communicate. The document illustrates these habits through examples of invalid inversion, regression to the mean, and statistical mistakes. It emphasizes understanding concepts fundamentally rather than just mathematically and finding simple ways to communicate ideas.
This document provides an overview of four statistical "paradoxes": 1) Covariate measurement error in randomized clinical trials, 2) Meta-analysis of sequential trials, 3) Dawid's selection paradox, and 4) Publication bias in the medical literature. For each paradox, brief explanations are given of the statistical issues involved and how they can be understood. Key points include that meta-analysis of sequential trials can account for early stopping by weighting trials by information amount, Dawid's selection paradox shows that Bayesian analysis is unaffected by selection of optimal outcomes, and publication bias may appear as a difference in acceptance rates between positive and negative results but could also be explained by differences in paper quality and targeting of journals. Graphs and heuristics
1. The document discusses the recommendations from the Royal Statistical Society Working Party report on ethical, practical and statistical considerations in designing first-in-man studies. The report made recommendations around generic issues, preparatory work, protocol content, risk sharing and reporting standards.
2. The report recommended that regulators provide more statistical expertise, mandatory insurance for participants, and only conducting studies at tertiary care hospitals if there is any risk of a cytokine storm. Protocols should provide quantitative justification of doses and risks with uncertainty and study classification.
3. Subsequent work has further explored trial design considerations like variance of treatment contrasts and dynamic decision making based on interim results, but safety in first-in-man studies remains a challenge that requires
Unfortunately, some have interpreted Numbers Needed to Treat as indicating the proportion of patients on whom the treatment has had a causal effect. This interpretation is very rarely, if ever, necessarily correct. It is certainly inappropriate if based on a responder dichotomy. I shall illustrate the problem using simple causal models.
One also sometimes encounters the claim that the extent to which two distributions of outcomes overlap from a clinical trial indicates how many patients benefit. This is also false and can be traced to a similar causal confusion.
Presidents' invited lecture ISCB Vigo 2017
Discusses various issues to do with how randomised clinical trials should be analysed. See also https://errorstatistics.com/2017/07/01/s-senn-fishing-for-fakes-with-fisher-guest-post/
1) The document discusses the challenge of studying rare diseases due to the small amount of available data. It proposes that N-of-1 trials, where individual patients are repeatedly randomized to treatment or control, could help address this issue.
2) It provides examples of how careful experimental design and statistical analysis are important even with small data sets. Factors like randomization, blocking, and replication can increase efficiency and validity.
3) Analyzing an N-of-1 trial for a rare disease, the document explores objectives like determining if one treatment is better, estimating average effects, and predicting effects for future patients. It discusses randomization and sampling philosophies and mixed effects models.
This year marks the 70th anniversary of the Medical Research Council randomised clinical trial (RCT) of streptomycin in tuberculosis led by Bradford Hill. This is widely regarded as a landmark in clinical research. Despite its widespread use in drug regulation and in clinical research more widely and its high standing with the evidence based medicine movement, the RCT continues to attracts criticism. I show that many of these criticisms are traceable to failure to understand two key concepts in statistics: probabilistic inference and design efficiency. To these methodological misunderstandings can be added the practical one of failing to appreciate that entry into clinical trials is not simultaneous but sequential.
I conclude that although randomisation should not be used as an excuse for ignoring prognostic variables, it is valuable and that many standard criticisms of RCTs are invalid.
Sample size determination in clinical trials is considered from various ethical and practical perspectives. It is concluded that cost is a missing dimension and that the value of information is key.
Minimisation is an approach to allocating patients to treatment in clinical trials that forces a greater degree of balance than does randomisation. Here I explain why I dislike it.
The statistical revolution of the 20th century was largely concerned with developing methods for analysing small datasets. Student’s paper of 1908 was the first in the English literature to address the problem of second order uncertainty (uncertainty about the measures of uncertainty) seriously and was hailed by Fisher as heralding a new age of statistics. Much of what Fisher did was concerned with problems of what might be called ‘small data’, not only as regards efficient analysis but also as regards efficient design and in addition paying close attention to what was necessary to measure uncertainty validly.
I shall consider the history of some of these developments, in particular those that are associated with what might be called the Rothamsted School, starting with Fisher and having its apotheosis in John Nelder’s theory of General Balance and see what lessons they hold for the supposed ‘big data’ revolution of the 21st century.
Randomisation balances both known and unknown factors that influence outcomes between treatment groups on average. Conditioning the analysis on available baseline covariates further reduces uncertainty by accounting for imbalances. While there are many potential covariates, their combined influence is bounded; randomisation thus remains important for accounting for unknown factors. Correct analysis requires matching the randomisation design to the analysis to make valid statistical inferences.
1) The document discusses how clinical trial responses are often misinterpreted through the use of dichotomies and responder analysis.
2) An example simulation is provided showing how dichotomizing a continuous outcome measure and conducting responder analysis on a single clinical trial can misleadingly suggest some patients respond to treatment while others do not.
3) In reality, the simulation shows that all patients may experience the same proportional benefit from treatment, but dichotomizing the data obscures this and encourages unfounded conclusions about personalized medicine.
The document discusses lessons from small experiments and the Rothamsted School approach to experimental design and analysis. It provides three key lessons:
1) Variances matter - if you cannot estimate variances precisely, you do not know how to interpret your results or make inferences. The Rothamsted approach matches the analysis to the experimental design to properly account for variances.
2) Experimental designs should eliminate sources of variation that can be controlled, like blocking by centers. This allows the analysis to focus on remaining uncontrolled variations.
3) Lord's paradox arises because some analyses, like comparing change scores, do not adjust for important baseline covariates, while other analyses do adjust and find significant effects. Proper analysis depends on
How to combine results from randomised clinical trials on the additive scale with real world data to provide predictions on the clinically relevant scale for individual patients
Views of the role of hypothesis falsification in statistical testing do not divide as cleanly between frequentist and Bayesian views as is commonly supposed. This can be shown by considering the two major variants of the Bayesian approach to statistical inference and the two major variants of the frequentist one.
A good case can be made that the Bayesian, de Finetti, just like Popper, was a falsificationist. A thumbnail view, which is not just a caricature, of de Finetti’s theory of learning, is that your subjective probabilities are modified through experience by noticing which of your predictions are wrong, striking out the sequences that involved them and renormalising.
On the other hand, in the formal frequentist Neyman-Pearson approach to hypothesis testing, you can, if you wish, shift conventional null and alternative hypotheses, making the latter the strawman and by ‘disproving’ it, assert the former.
The frequentist, Fisher, however, at least in his approach to testing of hypotheses, seems to have taken a strong view that the null hypothesis was quite different from any other and there was a strong asymmetry on inferences that followed from the application of significance tests.
Finally, to complete a quartet, the Bayesian geophysicist Jeffreys, inspired by Broad, specifically developed his approach to significance testing in order to be able to ‘prove’ scientific laws.
By considering the controversial case of equivalence testing in clinical trials, where the object is to prove that ‘treatments’ do not differ from each other, I shall show that there are fundamental differences between ‘proving’ and falsifying a hypothesis and that this distinction does not disappear by adopting a Bayesian philosophy. I conclude that falsificationism is important for Bayesians also, although it is an open question as to whether it is enough for frequentists.
Personalised medicine a sceptical viewStephen Senn
Some grounds for believing that the current enthusiasm about personalised medicine is exaggerated, founded on poor statistics and represents a disappointing loss of ambition.
The Rothamsted School & The analysis of designed experimentsStephenSenn2
A historical account is given of the approach of "The Rothamsted School" to the analysis of designed experiments. The link between the way that experiments are designed and how they should be analysed is fundamental to this approach. The key figures are RA Fisher, Frank Yates and John Nelder
Clinical trials are about comparability not generalisability V2.pptxStephenSenn3
It is a fundamental but common mistake to regard clinical trials as being a form of representative inference. The key issue is comparability. Experiments do not involve typical material. In clinical trials; it is concurrent control that is key and randomisation is a device for calculating standard errors appropriately that should reflect the design.
Generalisation beyond the clinical trial always involves theory.
Clinical trials are about comparability not generalisability V2.pptxStephenSenn2
Lecture delivered at the September 2022 EFSPI meeting in Basle in which I argued that the patients in a clinical trial should not be viewed as being a representative sample of some target population.
This powerpoint presentation gives a brief explanation about the biostatic data .this is quite helpful to individuals to understand the basic research methodology terminologys
The importance of measurements of uncertainty is explained and illustrated with the help of a famous experiment in nutrition from 1930 and a complex cross-over trial from the 1990s,
This document provides 10 recommendations for transparent and consistent scientific research and publication. It recommends (1) stating the research question and purpose, (2) describing the data source and sample size, (3) presenting individual observations when possible, (4) reporting numbers, averages, and variation when data is aggregated, (5) describing statistical methods used, (6) addressing assumptions of those methods, (7) distinguishing statistical and practical significance and clarifying hypotheses, (8) presenting confidence intervals rather than just p-values, (9) explaining departures from conventional significance levels, and (10) ensuring conclusions are consistent with the statistical rigor. The document emphasizes using clear and precise language to describe methodology, results, and conclusions.
1) The document discusses the overhyping of pharmacogenetics and personalized medicine, arguing that much of the claimed benefits are based on weak evidence.
2) It notes that clinical trials often fail to properly distinguish between genetic and non-genetic sources of variability in treatment response.
3) The author argues that without better understanding of variability through improved trial design and analysis, it is impossible to know if and how much variation is truly genetic in nature and able to be addressed through personalized treatment strategies.
This document provides an overview of evidence-based psychiatry. It defines evidence-based medicine and outlines the key steps, including formulating an answerable clinical question using PICO, finding the best evidence, appraising the evidence, and applying it to individual patients. The document discusses different types of studies and how to evaluate their results, focusing on sensitivity, specificity, odds ratios, and other statistical concepts. It emphasizes integrating individual clinical expertise with the best available external evidence.
Adjusting for treatment switching in randomised controlled trialscheweb1
This document discusses methods for adjusting for treatment switching in randomized controlled trials. It addresses the problem that intention-to-treat analysis may not accurately estimate treatment effectiveness when patients in the control group can switch to the experimental treatment. The document outlines several adjustment methods, including rank preserving structural failure time models and two-stage estimation, and discusses the issue of informative censoring due to treatment switching. It also presents a simulation study comparing the performance of adjustment methods with and without re-censoring to artificially censor patients who switched.
Critical appraisal of randomized clinical trialsSamir Haffar
The document discusses key concepts in randomized clinical trials (RCTs), including:
1) RCTs are considered the gold standard for evaluating the effectiveness of interventions due to their ability to minimize bias through randomization and blinding.
2) Proper randomization aims to create comparable treatment and control groups, conceal allocation to prevent bias, and may involve simple, stratified or blocked methods.
3) Blinding (masking) of participants, investigators and assessors can decrease observation bias and is important for RCT validity, though full blinding is not always possible.
4) Intention-to-treat analysis includes all randomized patients to preserve comparable groups and prevent bias from non-compliance.
This document discusses investigating heterogeneity in meta-analyses through subgroup analysis and meta-regression. It outlines when and how to use these techniques to explore reasons for variability in study results. Key challenges include having enough studies, selecting explanatory variables carefully to avoid false positives, and accounting for confounding and aggregation bias in study-level data. Meta-regression allows for random effects but interpretation requires caution given observational relationships between study characteristics and effects.
The document discusses techniques used in clinical trial design such as randomization, blinding, and study design. Randomization techniques include simple, restricted, stratified, and adaptive randomization to control for bias and variability. Blinding (single, double, triple) aims to eliminate subjective bias by withholding treatment information from patients and investigators. Study design determines objectives and compares new treatments parallel to current treatments through randomized parallel group designs. Proper selection and randomization of patients represents the target population.
Research Design for health care studentsCharu Parthe
This document discusses research design and methodology. It begins by defining research and outlining the key components of research design, including defining the problem, developing hypotheses, collecting and analyzing data, and formulating conclusions. It then describes different types of research designs, including experimental, non-experimental, analytical, and descriptive studies. Specific methodologies like randomized controlled trials, cohort studies, case-control studies, and cross-sectional studies are explained in detail. Key aspects of research methodology like biases, confounding variables, and validity and reliability are also covered.
This document provides an overview of key concepts in experimental design and statistics. It discusses variables, statistical tests, types of statistics, basic experimental design principles, and sample size determination. The key points are:
1. Experimental design should be unbiased through randomization, blinding, and inclusion of controls. It aims for high precision through uniform samples, replication, and stratification.
2. Statistics can be descriptive or inferential. Descriptive statistics summarize data, while inferential statistics make generalizations from samples to populations through hypothesis testing, confidence intervals, and significance testing.
3. Sample size is determined based on desired power to detect a minimum clinically meaningful effect size given available resources. Larger samples increase power but come
This document provides an overview of important considerations for designing a successful clinical research study. It discusses how to begin by defining research questions and assessing feasibility. It then covers common study design types including experimental, observational, descriptive, and analytical designs. Examples are given of randomized clinical trials, cohort studies, cross-sectional studies, and case-control studies that could be used to study the relationship between hormone therapy and coronary heart disease. Statistical issues like sample size calculations and analytic approaches are also highlighted.
Clinical trial SSKM EXEC FOR EDUCATIONSAmsyarDaud1
Clinical trials are planned experiments in humans designed to assess the efficacy of treatments or interventions. There are various types of clinical trial designs. Parallel designs involve randomizing patients to either a new treatment or control treatment and following them over the same period. Crossover designs involve randomizing patients to different sequences of treatments so that all patients eventually receive all treatments. Key considerations in clinical trial design include minimizing carryover effects, ensuring adequate randomization and blinding, accounting for missing data, and analyzing according to intention-to-treat principles. Sample size calculations must also be carefully planned to ensure adequate power.
Testing of Hypothesis and Goodness of Fit
This document discusses hypothesis testing and goodness of fit. It defines hypothesis testing as a procedure to determine if sample data agrees with a hypothesized population characteristic. The key steps are stating the null and alternative hypotheses, selecting a significance level, determining the test distribution, defining rejection regions, performing the statistical test, and drawing a conclusion. Common hypothesis tests discussed include the Student's t-test and chi-square test of goodness of fit.
4th Modern Marketing Reckoner by MMA Global India & Group M: 60+ experts on W...Social Samosa
The Modern Marketing Reckoner (MMR) is a comprehensive resource packed with POVs from 60+ industry leaders on how AI is transforming the 4 key pillars of marketing – product, place, price and promotions.
ViewShift: Hassle-free Dynamic Policy Enforcement for Every Data LakeWalaa Eldin Moustafa
Dynamic policy enforcement is becoming an increasingly important topic in today’s world where data privacy and compliance is a top priority for companies, individuals, and regulators alike. In these slides, we discuss how LinkedIn implements a powerful dynamic policy enforcement engine, called ViewShift, and integrates it within its data lake. We show the query engine architecture and how catalog implementations can automatically route table resolutions to compliance-enforcing SQL views. Such views have a set of very interesting properties: (1) They are auto-generated from declarative data annotations. (2) They respect user-level consent and preferences (3) They are context-aware, encoding a different set of transformations for different use cases (4) They are portable; while the SQL logic is only implemented in one SQL dialect, it is accessible in all engines.
#SQL #Views #Privacy #Compliance #DataLake
Beyond the Basics of A/B Tests: Highly Innovative Experimentation Tactics You...Aggregage
This webinar will explore cutting-edge, less familiar but powerful experimentation methodologies which address well-known limitations of standard A/B Testing. Designed for data and product leaders, this session aims to inspire the embrace of innovative approaches and provide insights into the frontiers of experimentation!
Learn SQL from basic queries to Advance queriesmanishkhaire30
Dive into the world of data analysis with our comprehensive guide on mastering SQL! This presentation offers a practical approach to learning SQL, focusing on real-world applications and hands-on practice. Whether you're a beginner or looking to sharpen your skills, this guide provides the tools you need to extract, analyze, and interpret data effectively.
Key Highlights:
Foundations of SQL: Understand the basics of SQL, including data retrieval, filtering, and aggregation.
Advanced Queries: Learn to craft complex queries to uncover deep insights from your data.
Data Trends and Patterns: Discover how to identify and interpret trends and patterns in your datasets.
Practical Examples: Follow step-by-step examples to apply SQL techniques in real-world scenarios.
Actionable Insights: Gain the skills to derive actionable insights that drive informed decision-making.
Join us on this journey to enhance your data analysis capabilities and unlock the full potential of SQL. Perfect for data enthusiasts, analysts, and anyone eager to harness the power of data!
#DataAnalysis #SQL #LearningSQL #DataInsights #DataScience #Analytics
The Ipsos - AI - Monitor 2024 Report.pdfSocial Samosa
According to Ipsos AI Monitor's 2024 report, 65% Indians said that products and services using AI have profoundly changed their daily life in the past 3-5 years.
Predictably Improve Your B2B Tech Company's Performance by Leveraging DataKiwi Creative
Harness the power of AI-backed reports, benchmarking and data analysis to predict trends and detect anomalies in your marketing efforts.
Peter Caputa, CEO at Databox, reveals how you can discover the strategies and tools to increase your growth rate (and margins!).
From metrics to track to data habits to pick up, enhance your reporting for powerful insights to improve your B2B tech company's marketing.
- - -
This is the webinar recording from the June 2024 HubSpot User Group (HUG) for B2B Technology USA.
Watch the video recording at https://youtu.be/5vjwGfPN9lw
Sign up for future HUG events at https://events.hubspot.com/b2b-technology-usa/
Predictably Improve Your B2B Tech Company's Performance by Leveraging Data
What is your question
1. What is your question?
Causal and predictive purposes of clinical
trials and the implications for analysis
Stephen Senn
Edinburgh
(c) Stephen Senn 1
stephen@senns.uk
http://www.senns.uk/Blogs.html
2. Acknowledgements
Many thanks for the invitation
This work was partly supported by the European Union’s 7th
Framework Programme for research, technological development and
demonstration under grant agreement no. 602552. “IDEAL”
(c) Stephen Senn 2
(c) Stephen Senn 2
5. Statistical frameworks
Frameworks
Framework Notes
Random
sampling
Data are generated from a
population of interest using
probability sampling
Randomisation Data are generated by random
assignment of treatment to units
Linear model Conditional on predictors, treated
as fixed, outcomes are assumed to
have random errors
Multivariate
analysis
Variates vary together and we study
certain conditional distributions
Problems and issues
• Random sampling is most often invoked
in elementary courses
• It has little if any relevance to clinical
trials
• Randomisation is used not random
sampling
• In practice linear models are very often
used
• and incorrectly described as being
multivariate
• This is all rather confused
• Sometimes it does not matter but
sometimes it does
(c) Stephen Senn 5
6. Causal versus predictive inference
An important further issue
• Clinical trials can be used to try and answer a number of very
different questions
• Two examples are
• Did the treatment have an effect in these patients?
• A causal purpose
• What will the effect be in future patients?
• A predictive purpose
• Unfortunately, in practice, an answer is produced without stating
what the question was
• Given certain assumptions these questions can be answered using the
same analysis but the assumptions are strong and rarely stated
(c) Stephen Senn 6
7. Two purposes
Predictive
• The population is taken to be ‘patients in
general’
• Of course this really means future patients
• They are the ones to whom the treatment
will be applied
• We treat the patients in the trial as an
appropriate selection from this population
• This does not require them to be typical
but it does require additivity of the
treatment effect
• Additivity implies low heterogeneity of
effect on the scale used
Causal
• We take the patients as fixed
• We want to know what the effect was for
them
• Unfortunately there are missing
counterfactuals
• What would have happened to control
patients given intervention and vice-versa
• The population is the population of all
possible allocations to the patients studied
(c) Stephen Senn 7
10. Implications
General
• It is the question that is important
• Given certain assumptions the
same answer can apply to different
questions but this is not always the
case
• We should be careful in
interpreting our answers
predictively
Application
• Whether you run a fixed effects or
random effects meta-analysis is a
consequence of the question you
wish to answer
• It is not a matter of whether you
found heterogeneity or not
• That just governs the extent to
which the answers differ
• However it is the question that
dictates the approach
(c) Stephen Senn 10
11. Randomisation, design and analysis
Designing to analyse and analysing according to design
(c) Stephen Senn 11
12. A famous experiment
The experiment
• Hills-Armitage cross-over trial in
enuresis
• Two sequences
• Drug-placebo and placebo-drug
• 58 patients
• Measured over 14 days
• Number of dry nights measured
What I am trying to do
• Compare parametric and
randomisation based analyses
• Show that for a causal purpose it
makes little difference which we
use
• Provided that you reflect the
randomisation!
• This gives a justification for linear
models (which are flexible
parametric approaches)
(c) Stephen Senn 12
13. Cross-over trial in
Eneuresis
Two treatment periods of
14 days each
1. Hills, M, Armitage, P. The two-period
cross-over clinical trial, British Journal of Clinical
Pharmacology 1979; 8: 7-20.
13
(c) Stephen Senn
14. 0.7
4
0.5
2
0.3
0
0.1
-2
-4
0.6
0.2
0.4
0.0
Density
Permutatedtreatment effect
Blue diamond shows
treatment effect whether or
not we condition on patient
as a factor.
It is identical because the
trial is balanced by patient.
However the permutation
distribution is quite different
and our inferences are
different whether we
condition (red) or not
(black) and clearly
balancing the randomisation
by patient and not
conditioning the analysis by
patient is wrong
14
(c) Stephen Senn
15. The two permutation* distributions summarised
Summary statistics for Permuted difference no
blocking
Number of observations = 10000
Mean = 0.00561
Median = 0.0345
Minimum = -3.828
Maximum = 3.621
Lower quartile = -0.655
Upper quartile = 0.655
P-value for observed difference 0.0340
*Strictly speaking randomisation distributions
Summary statistics for Permuted difference
blocking
Number of observations = 10000
Mean = 0.00330
Median = 0.0345
Minimum = -2.379
Maximum = 2.517
Lower quartile = -0.517
Upper quartile = 0.517
P-value for observed difference 0.0014
15
(c) Stephen Senn
16. Two Parametric Approaches
Not fitting patient effect
Estimate s.e. t(56) t pr.
2.172 0.964 2.25 0.0282
(P-value for permutation is 0.034)
Fitting patient effect
Estimate s.e. t(28) t pr
.
2.172 0.616 3.53 0.00147
(P-value for Permutation is 0.0014)
16
(c) Stephen Senn
17. Lessons
specific and general
Specific
• Because each subject acted as his
own control , the design controlled for
• 20,500 genes
• All life history until the start of the trial
• A ton of epigenetics
• The analysis that reflects this is
correct
• The analysis that doesn’t is wrong
• The point estimate is the same
• Standard errors matter
General
• Contrary to what is commonly claimed
the standard analysis of parallel group
trials does not rely on all factors being
balanced
• If they were the analysis would be wrong
• That’s because the analysis allows for
their being imbalanced
• It relies on their not being balanced
• It makes an allowance for them
• If your causal analysis doesn’t
consider standard errors it is
misleading at best and wrong at worst
(c) Stephen Senn 17
18. Thinking smaller
• So far we have been looking at determining causation and making
predictions based on a collection of subjects
• Average group causal effects
• Predictions based on data on groups
• What are the implications for individual subjects?
• We still need
• To consider counterfactuals
• To use controls
• To pay attention to variation
• Unfortunately there is much slack thinking
(c) Stephen Senn 18
20. Zombie statistics 1
Percentage of non-responders
What the FDA says Where they got it
Paving the way for personalized
medicine, FDA Oct 2013
Spear, Heath-Chiozzi & Huff, Trends in
Molecular Medicine, May 2001
20
(c) Stephen Senn
21. Zombie statistics 2
Where they got it Where those who got it got it
Spear, Heath-Chiozzi & Huff, Trends in
Molecular Medicine, May 2001 21
(c) Stephen Senn
22. The Real Truth
• These are zombie statistics
• They refuse to die
• Not only is the FDA’s claim not right, it’s not even wrong
• It’s impossible to establish what it might mean even if it were true
22
(c) Stephen Senn
23. 88.2% of all statistics are made up
on the spot
Vic Reeves
23
(c) Stephen Senn
24. Painful comparison
Cochrane Collaboration meta-
analysis 2016
• Meta-analysis of placebo-controlled
trials of paracetamol in tension
headache
• 23 studies
• 6000 patients in total
• Outcome measure:
– Pain free by 2 hours
Baayen (2016) Significance article
• Explanation of Novartis’s MCP-Mod
dose-finding approach using a trial
run by Merck
• 7 doses + placebo
• 517 patients in total
• Outcome measure
– Pain free by 2 hours
24
(c) Stephen Senn
25. In both cases
• The patients were only studied once
• A dichotomy of a continuous measure was made
• Patients were labelled as responders and non-responders
• A causal conclusion was drawn that went beyond simply
comparing proportions
– Baayen talked about the proportion of patients who would respond
– Cochrane talked about the proportion of patients to whom it would make a
difference in terms of response
25
(c) Stephen Senn
26. What I propose to do
• Create a simple statistical model to mimic the Cochrane result
– In terms of time to pain resolution every patient will have the same
proportional benefit
• In fact I shall be using a form of proportional hazards model
– The dichotomy will classify patients as responders or non-responders
– We shall be tempted to conclude that some don’t benefit and some do and
that this is a permanent feature of each patient
26
(c) Stephen Senn
27. The Numerical Recipe
• I shall generate pain duration times for 6000 headaches treated with placebo
– This will be done using an exponential distribution with a mean of just under 3 hours
(2.97 hrs to be exact)
– Each such duration will then be multiplied by just over ¾ (0.755 to be exact) to create
6000 durations under paracetamol
• I shall then take the 6000 pairs and randomly erase one member of the pair
to leave 3000 unpaired placebo values and 3000 unpaired paracetamol
values
• I shall then analyse the data
27
(c) Stephen Senn
28. Why this recipe?
• The exponential distribution with mean
2.970 is chosen so that the probability of
response in less than two hours is 0.49
– This is the placebo distribution
• Rescaling these figures by 0.755 produces
another exponential distribution with a
probability of response in under two hours
of 0.59
– This is the paracetamol distribution
28
(c) Stephen Senn
30. However
• So far I have only gone half way in my simulation recipe
• I have simulated a placebo headache and a corresponding
paracetamol headache
• However I can’t treat the same headache twice
• One of the two is counterfactual
• I now need to get rid of one member of each
factual/counterfactual pair
30
(c) Stephen Senn
33. To sum up
• The results reported are perfectly consistent with paracetamol having the
same effect not just for every patient but on every single headache
• This does not have to be the case but we don’t know that it isn’t
• The combination of dichotomies and responder analysis has great potential
to mislead
• Researchers are assuming that because some patients ‘responded’ in terms
of an arbitrary dichotomy there is scope for personalised medicine
33
(c) Stephen Senn
34. Implications
• This suggests that we could use designs in which patients are
repeatedly studied as a means of teasing out personal response
• Such designs are sometimes referred to as n-of-1 trials
• An example is a double cross-over
• Patients randomised to two sequences AB or BA in cycle 1 and then again in
cycle 2
• A simulated example follows
(c) Stephen Senn 34
36. Results 1
Second Cross-over
Responder Non-
responder
Total
First
Cross-Over
Responder 827 49 876
Non-
responder
38 86 124
Total 865 135 1000
36
correlation coefficient is 0.8 Conditional probability of “response”
in 2nd cross-over
827/876=0.94 if responded1st
38/124=0.31 if did not respond 1st
(c) Stephen Senn
38. Results 2
Second Cycle
Responder Non-
responder
Total
First
Cycle
Responder 797 95 892
Non-
responder
93 15 108
Total 865 135 1000
38
correlation coefficient is 0.0.2 Conditional probability of “response”
in 2nd cross-over
797/892=0.89 if responded1st
93/108=0.86 if did not respond 1st
(c) Stephen Senn
39. Statistical pitfalls of personalized medicine
• We have been promised a
personalised medicine revolution
for over 25 years now
• The revolution, if it is coming, still
seems to be a long way ahead
• In this paper I argue that the scope
for personalized medicine has been
greatly exaggerated
• One of the reasons is naive
interpretation of observed
variation
• N-of-1 trials is one way we could
do better
(c) Stephen Senn 39
Senn, Nature, 29 November 2018
40. Limitations
• Of course, this is only possible for chronic diseases
• For many diseases replicating treatments is not possible
• Some progress may be made by
• Using repeated measures
• Requires strong assumptions
• Studying Variances
• Comparing variances in treatment and control groups
• Looking at subgroups
(c) Stephen Senn 40
41. Wrapping it all up
It’s not just Christo and Jeanne-Claude who do this
(c) Stephen Senn 41
42. Modelling
• The statistician should look for scales for analysis that are additive
• These are not necessarily clinically relevant
• However they can be translated into clinically relevant predictions for
individual patients
• Lubsen & Thyssen 1989
• May require real world data
(c) Stephen Senn 42
43. A lesson from quality control/assurance
• It is the duty of every manager to understand the variation in the
system
• Intervening naively to try and deal with observed variation can
increase variation
• We need smart statistical design
• We need much more emphasis on components of variation
• Biostatisticians should spend more time discussing these issues with
life scientist colleagues
(c) Stephen Senn 43
44. Lessons
• Paradoxically embracing random variation can lead to more precise results
• Statistics abounds with examples
• Recovering information in incomplete blocks experiments
• Being Bayesian
• Not overinterpreting data
• Penalised regression
• We should be wary of looking for bedrock causal explanations of everything
• By doing this we may actually increase variation by intervening where doing
something useful is impossible
• Much so-called personalised medicine has overlooked this
• Components of variation matter
• Standard errors matter
• So do questions
(c) Stephen Senn 44
45. Thank you for your attention
(c) Stephen Senn 45
stephen@senns.uk
http://www.senns.uk/Blogs.html