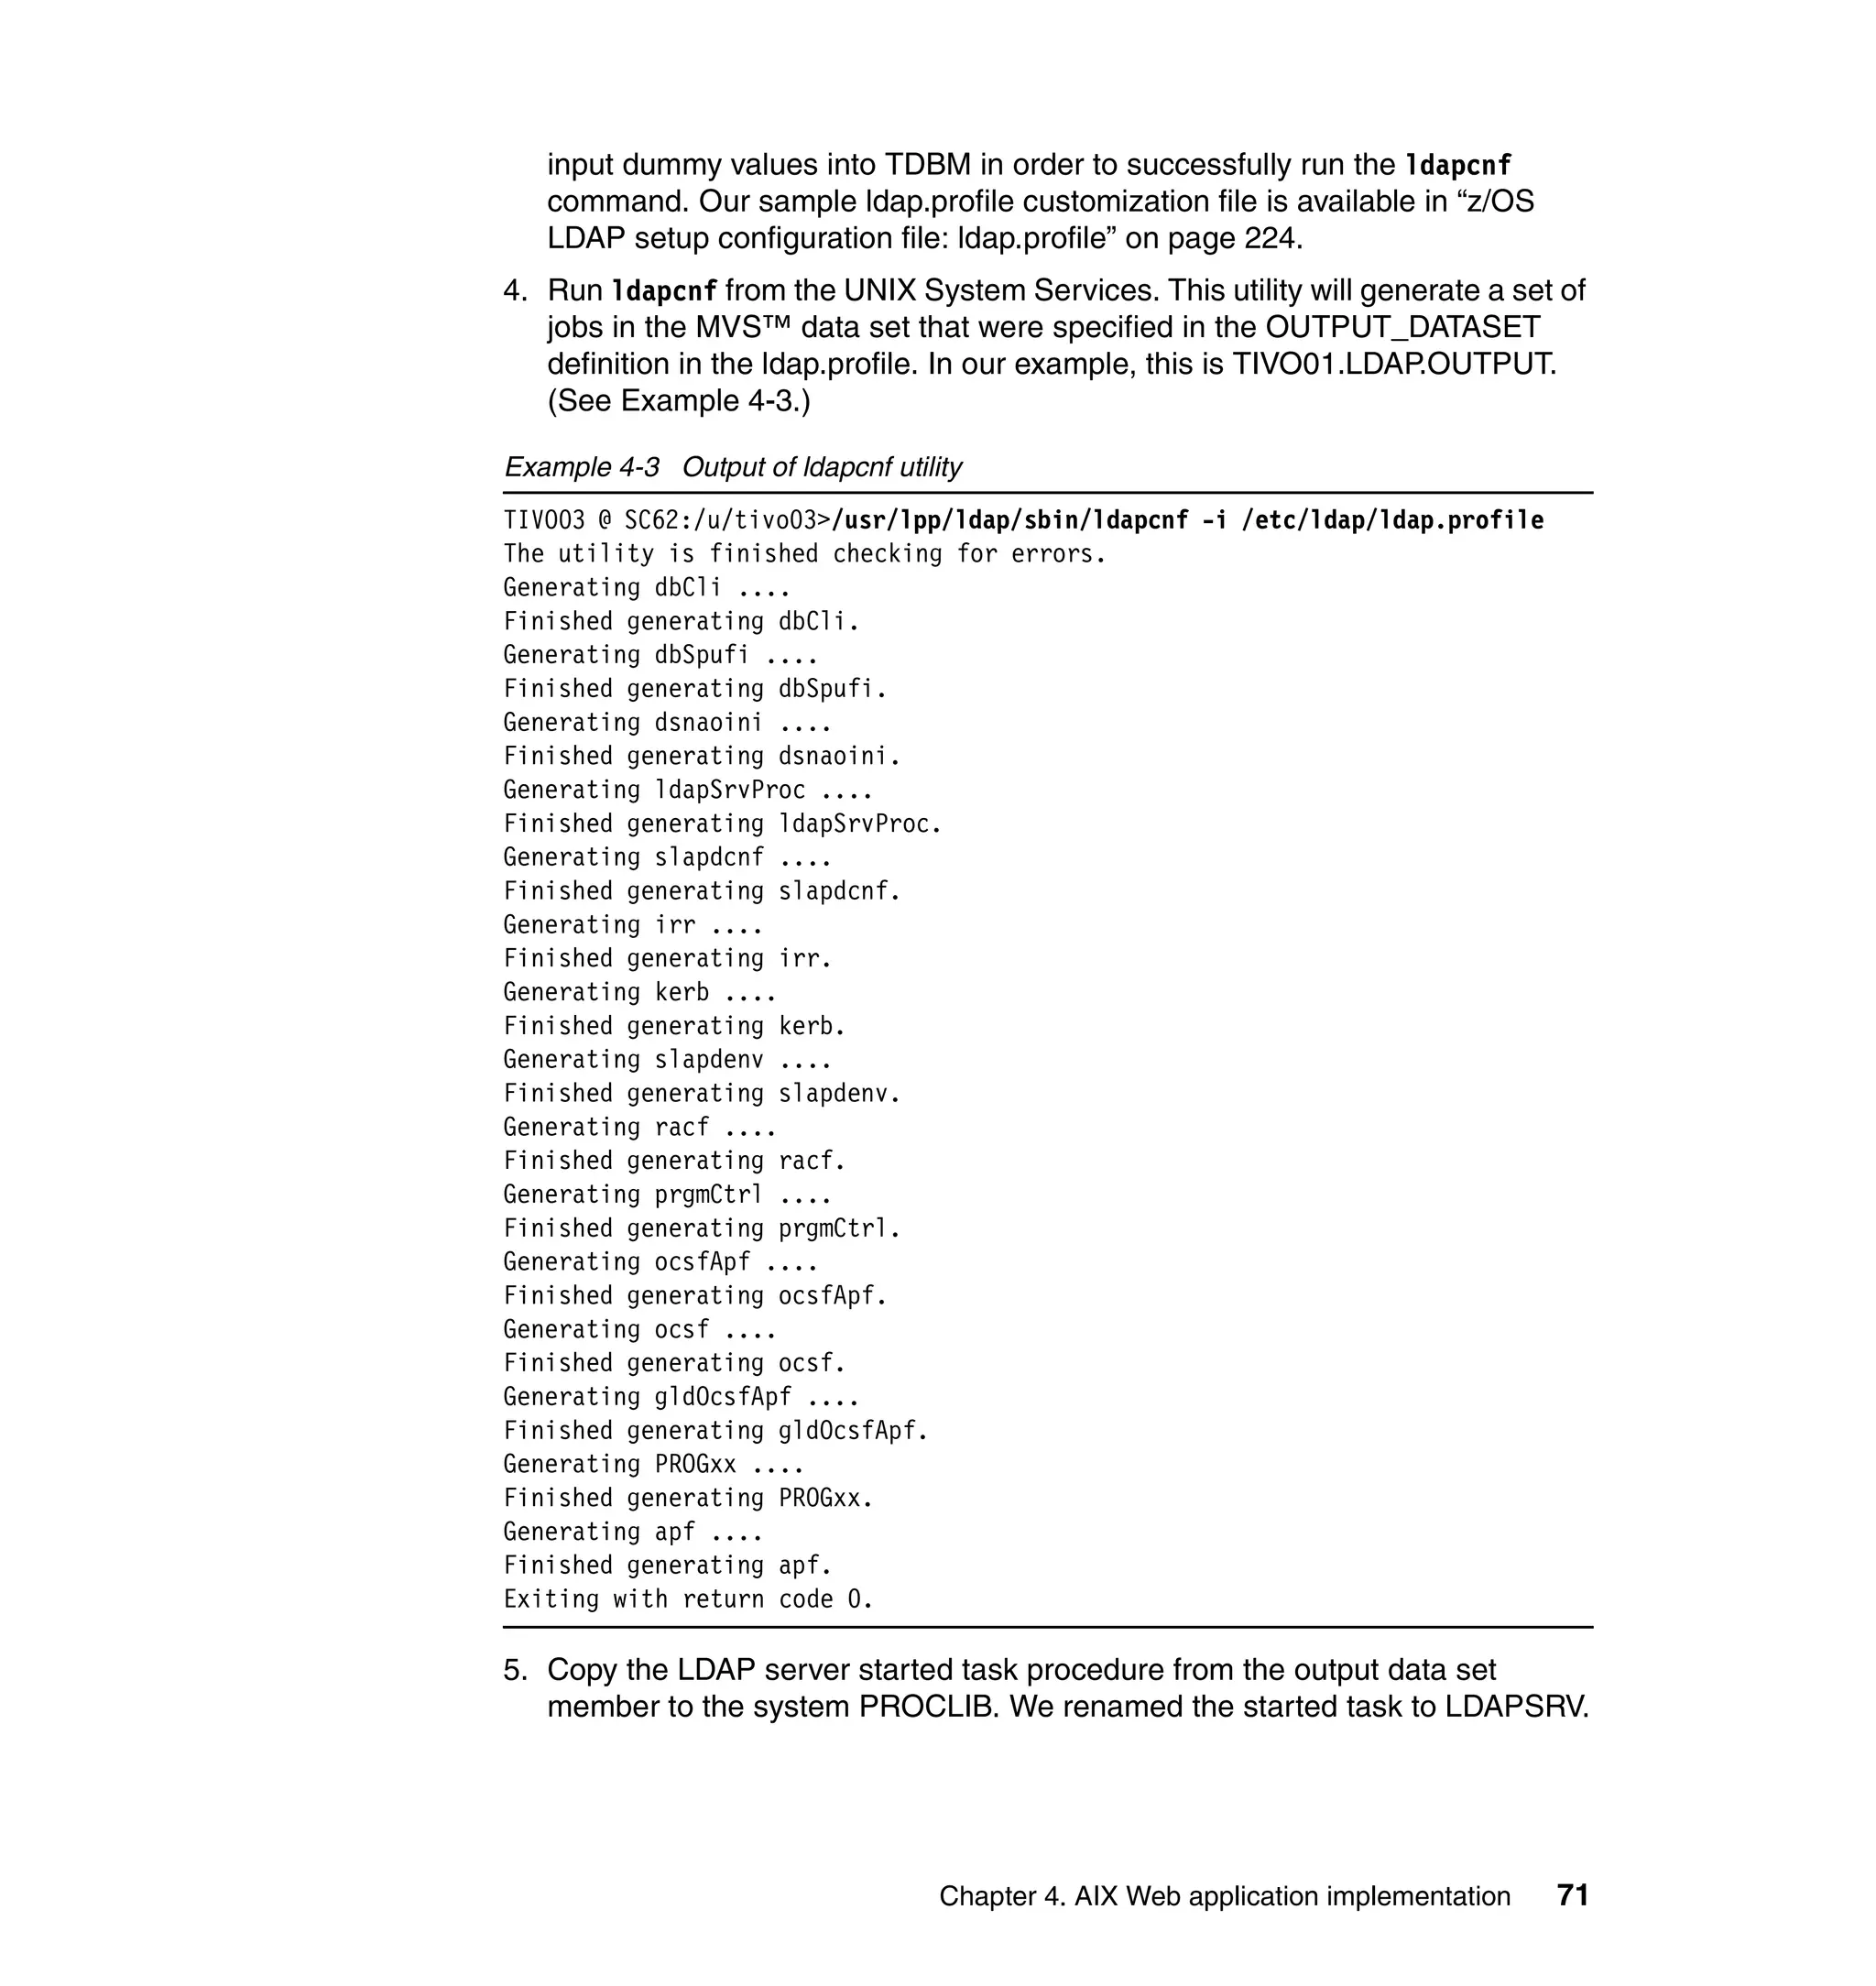
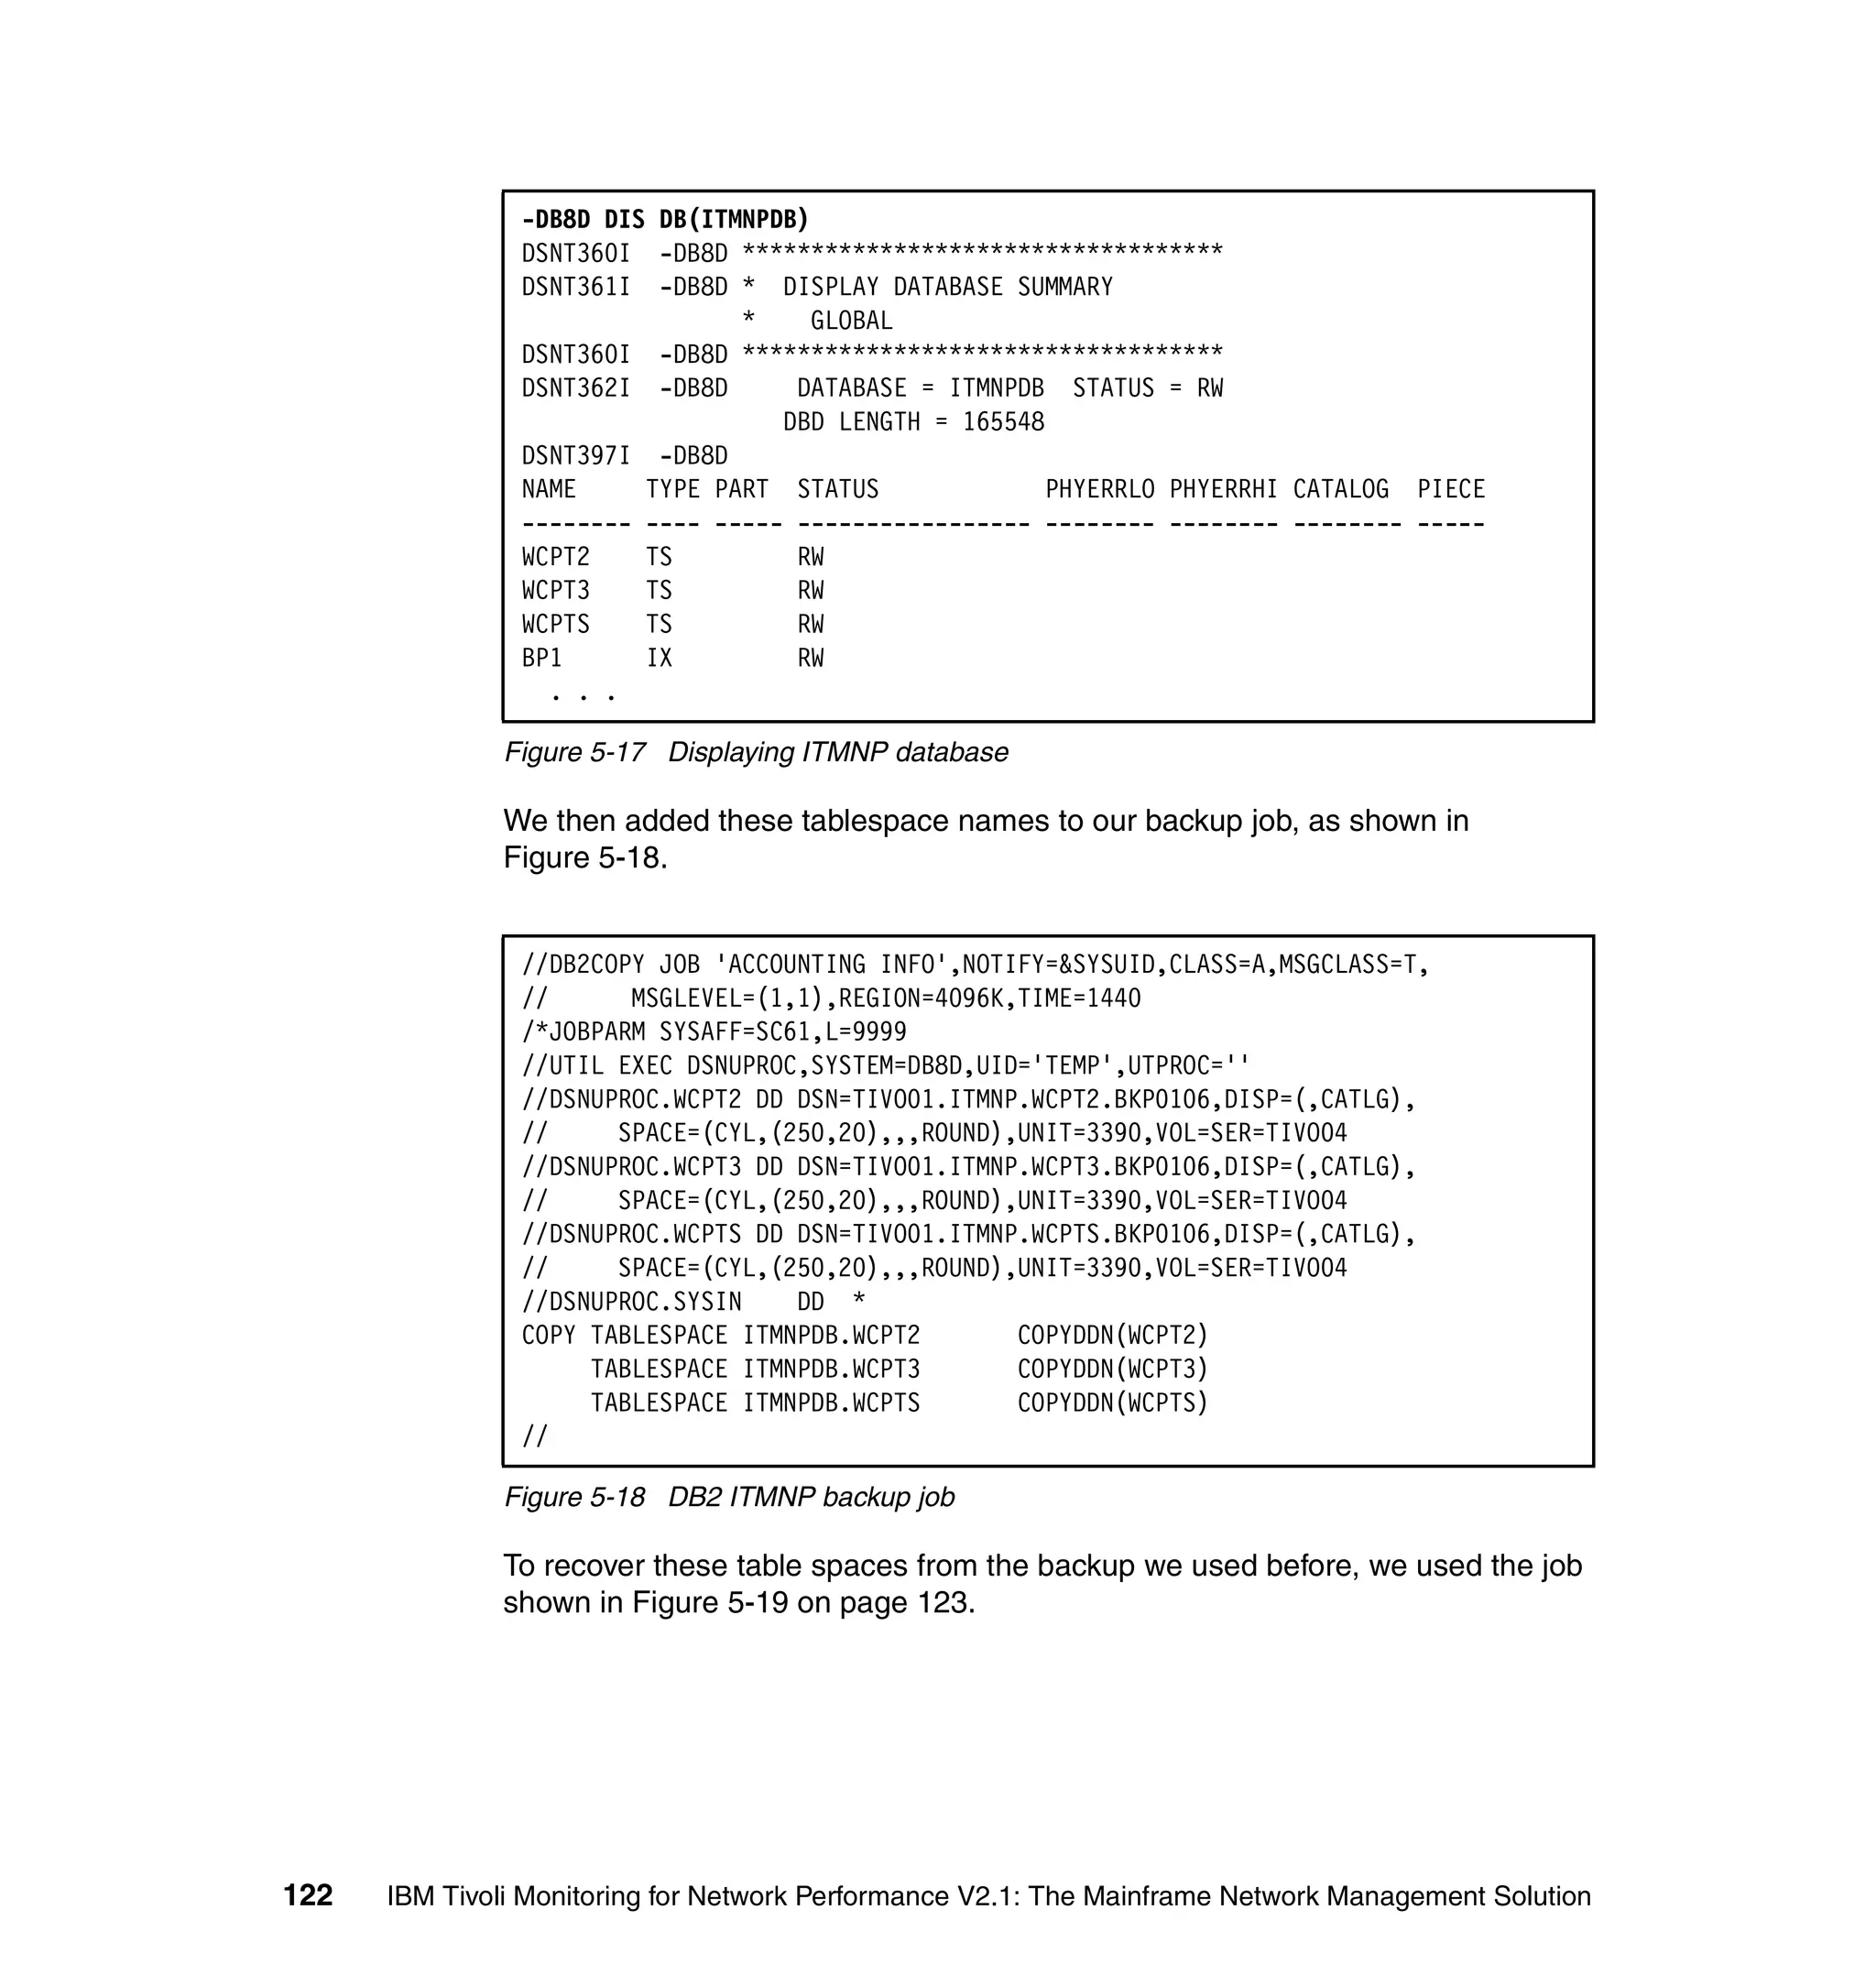
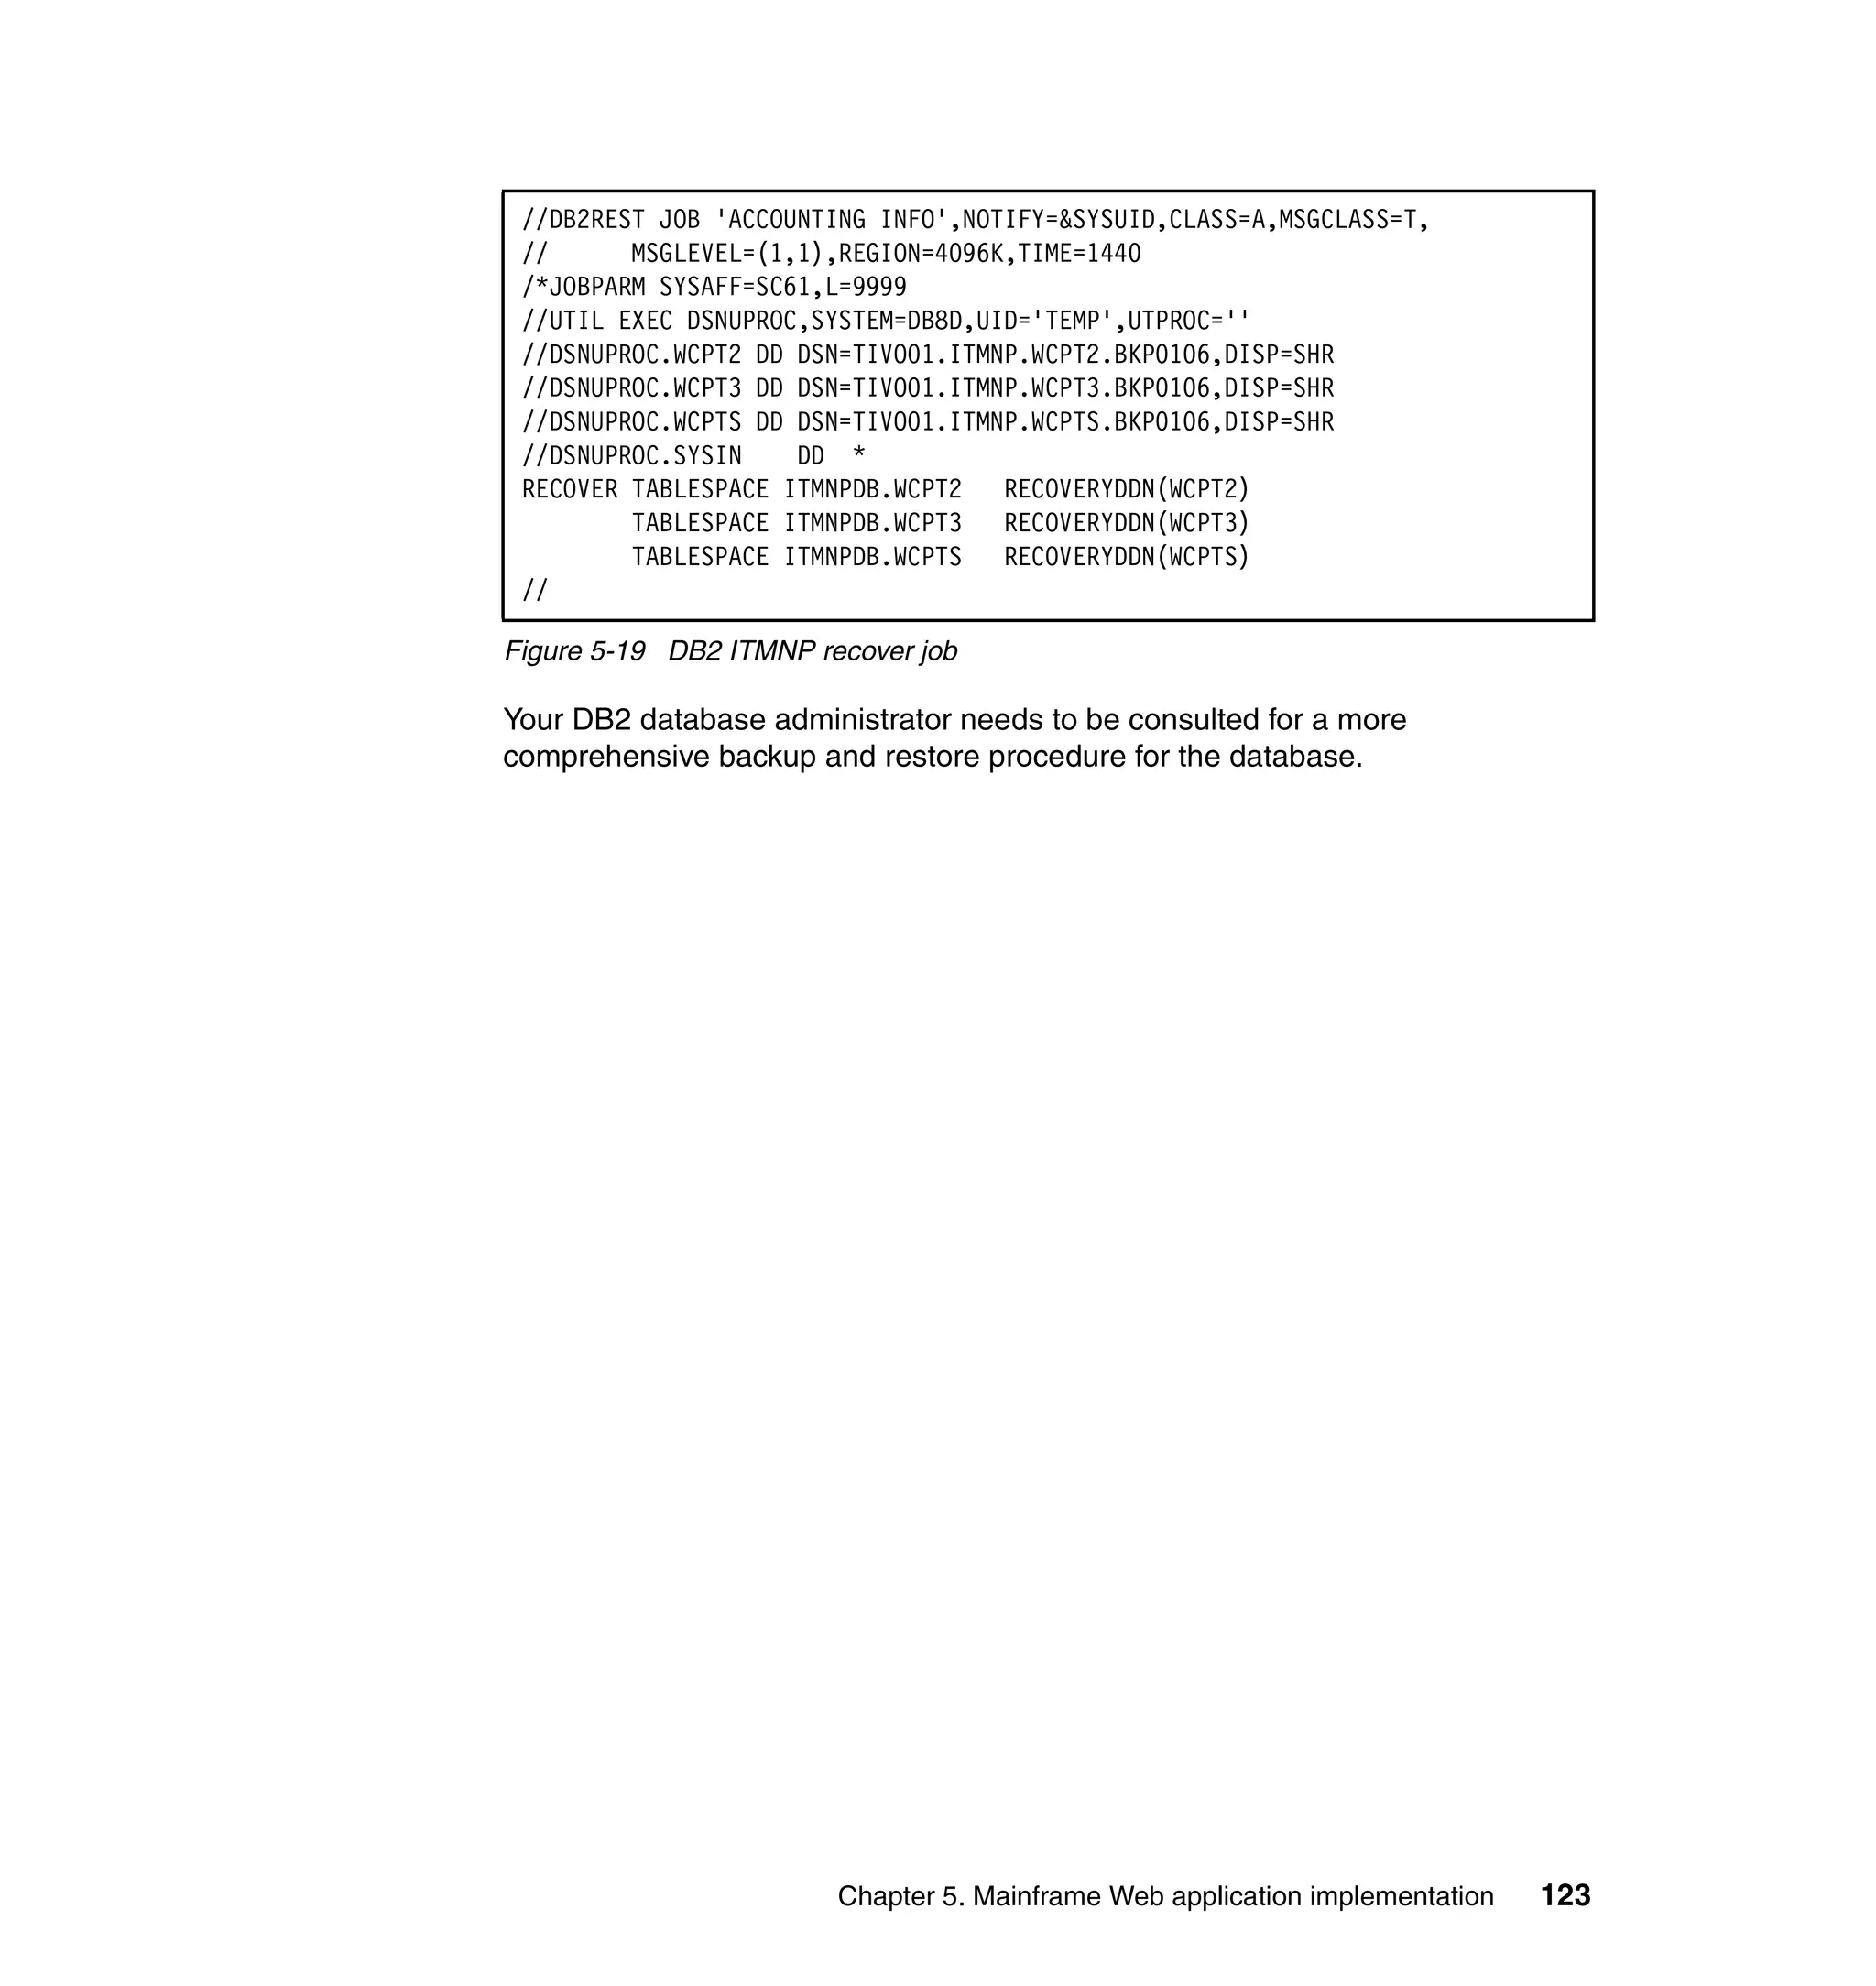
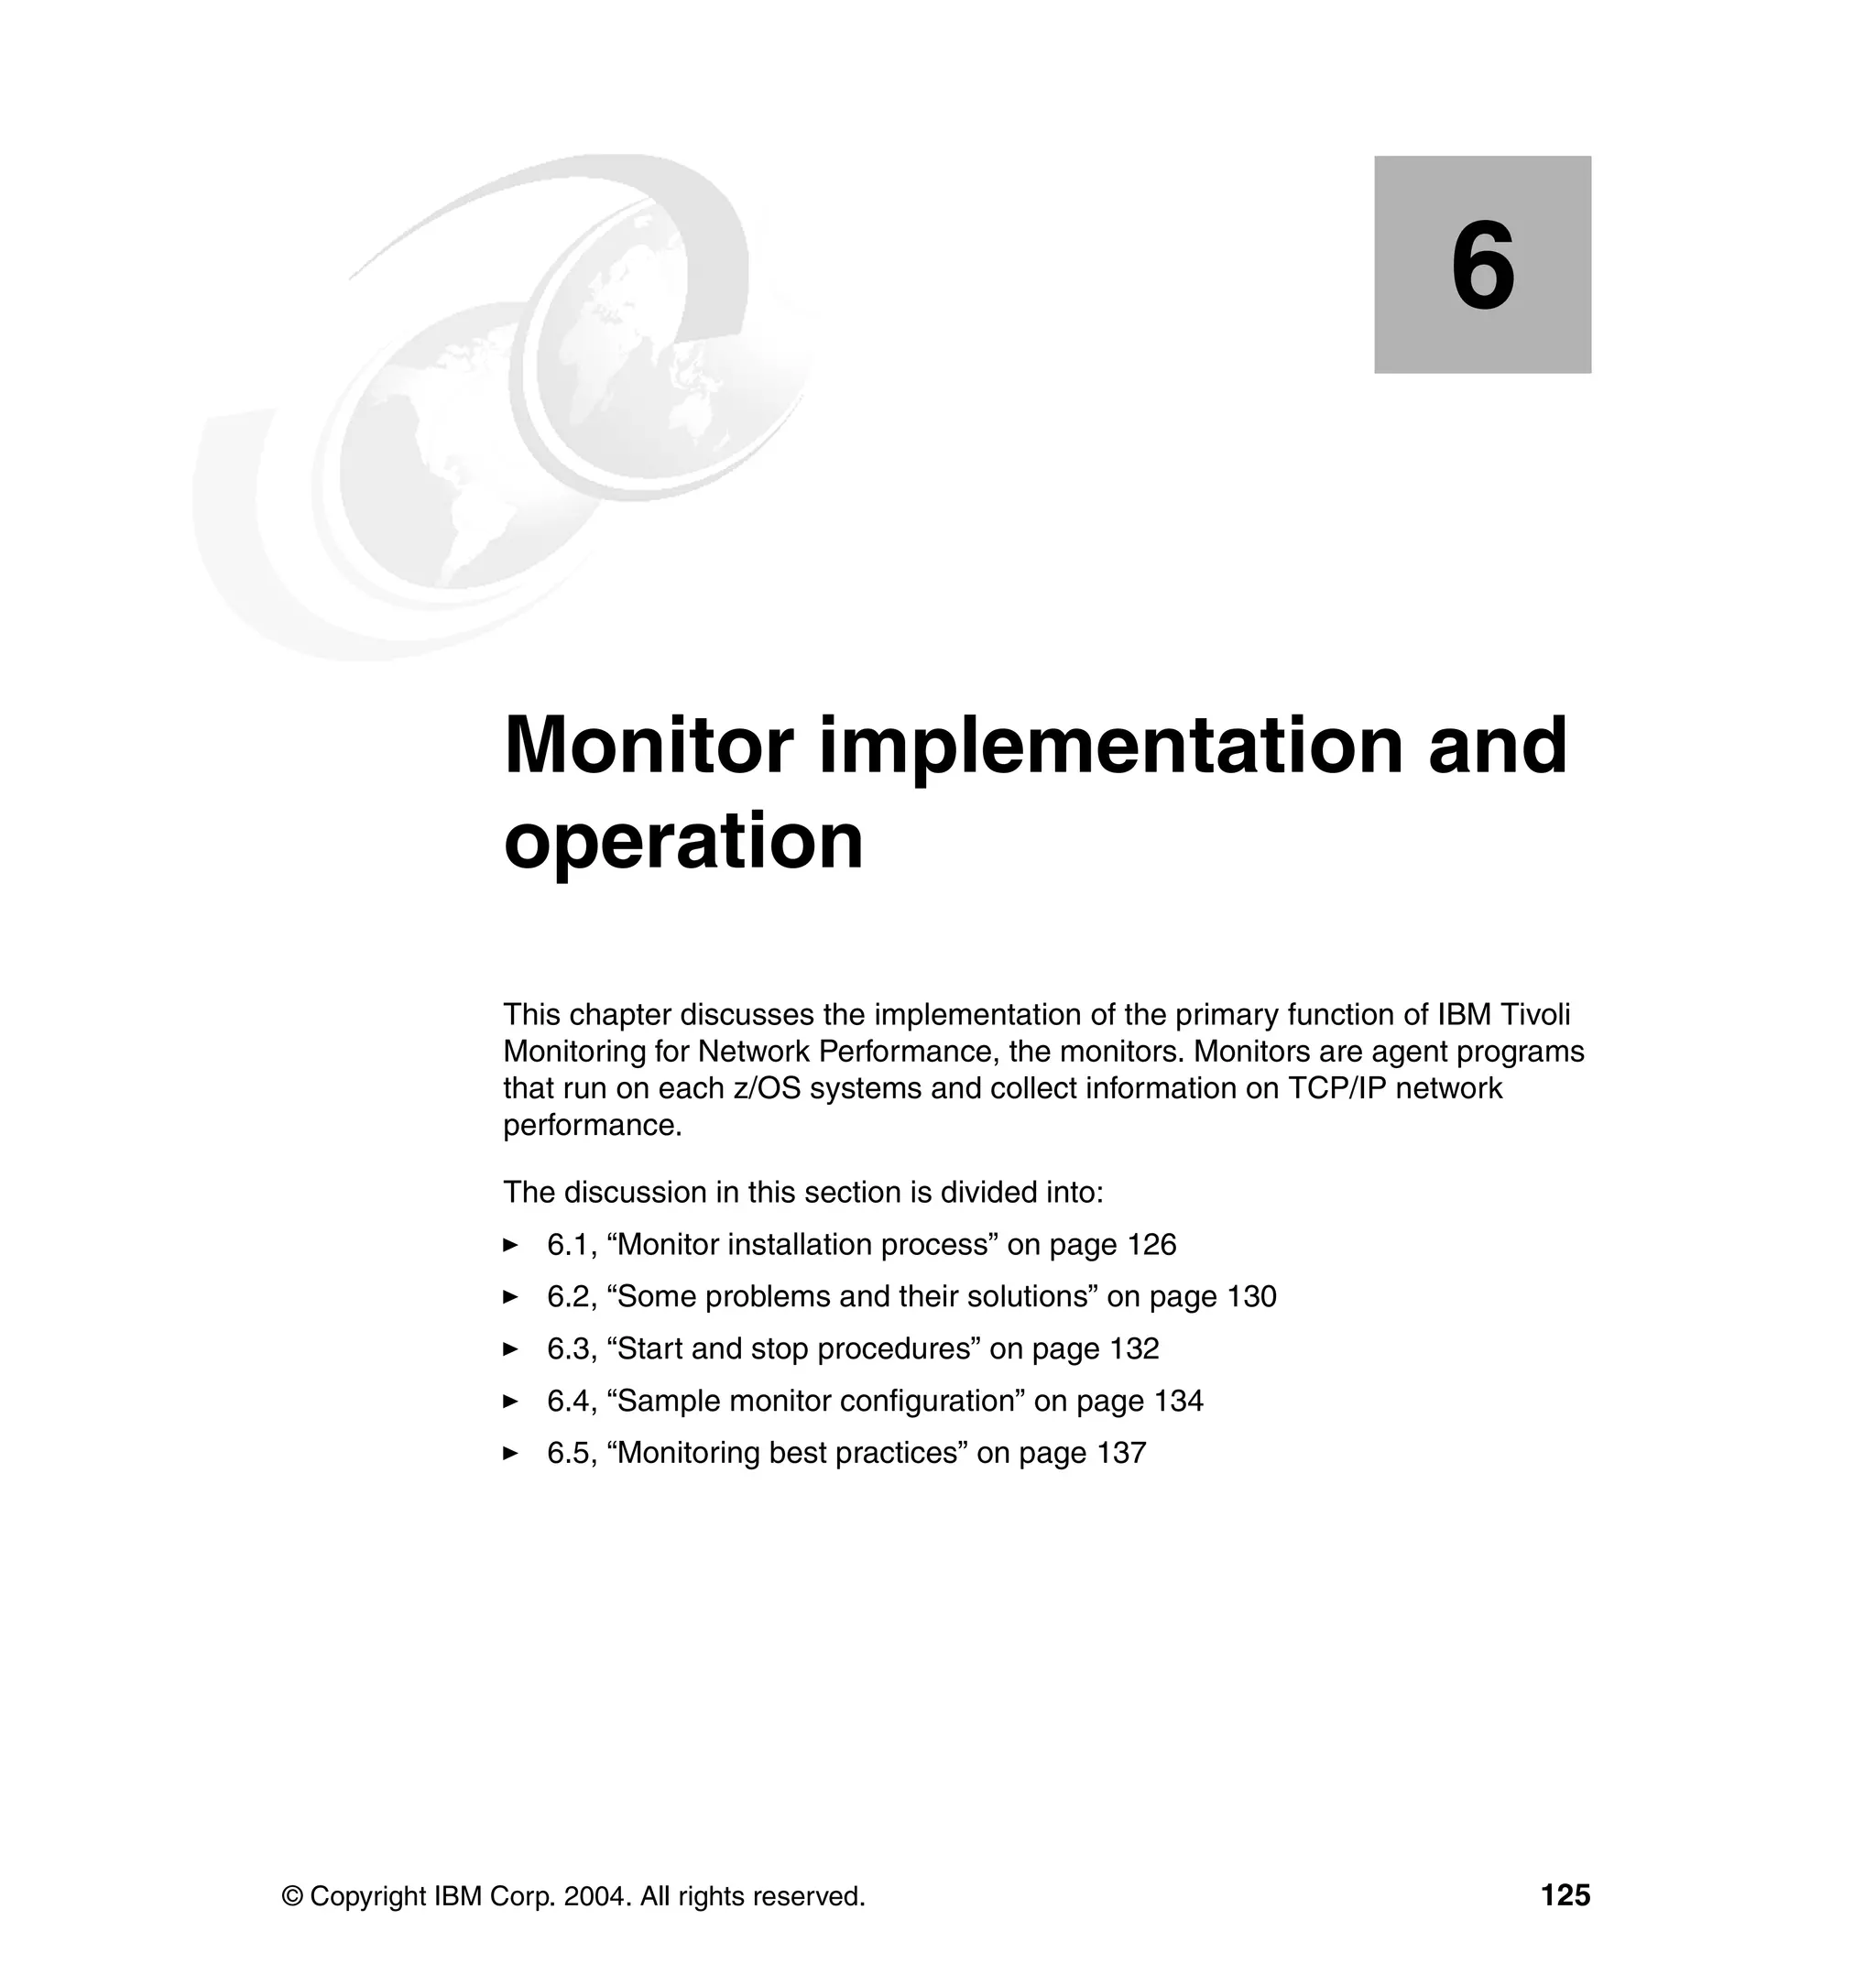
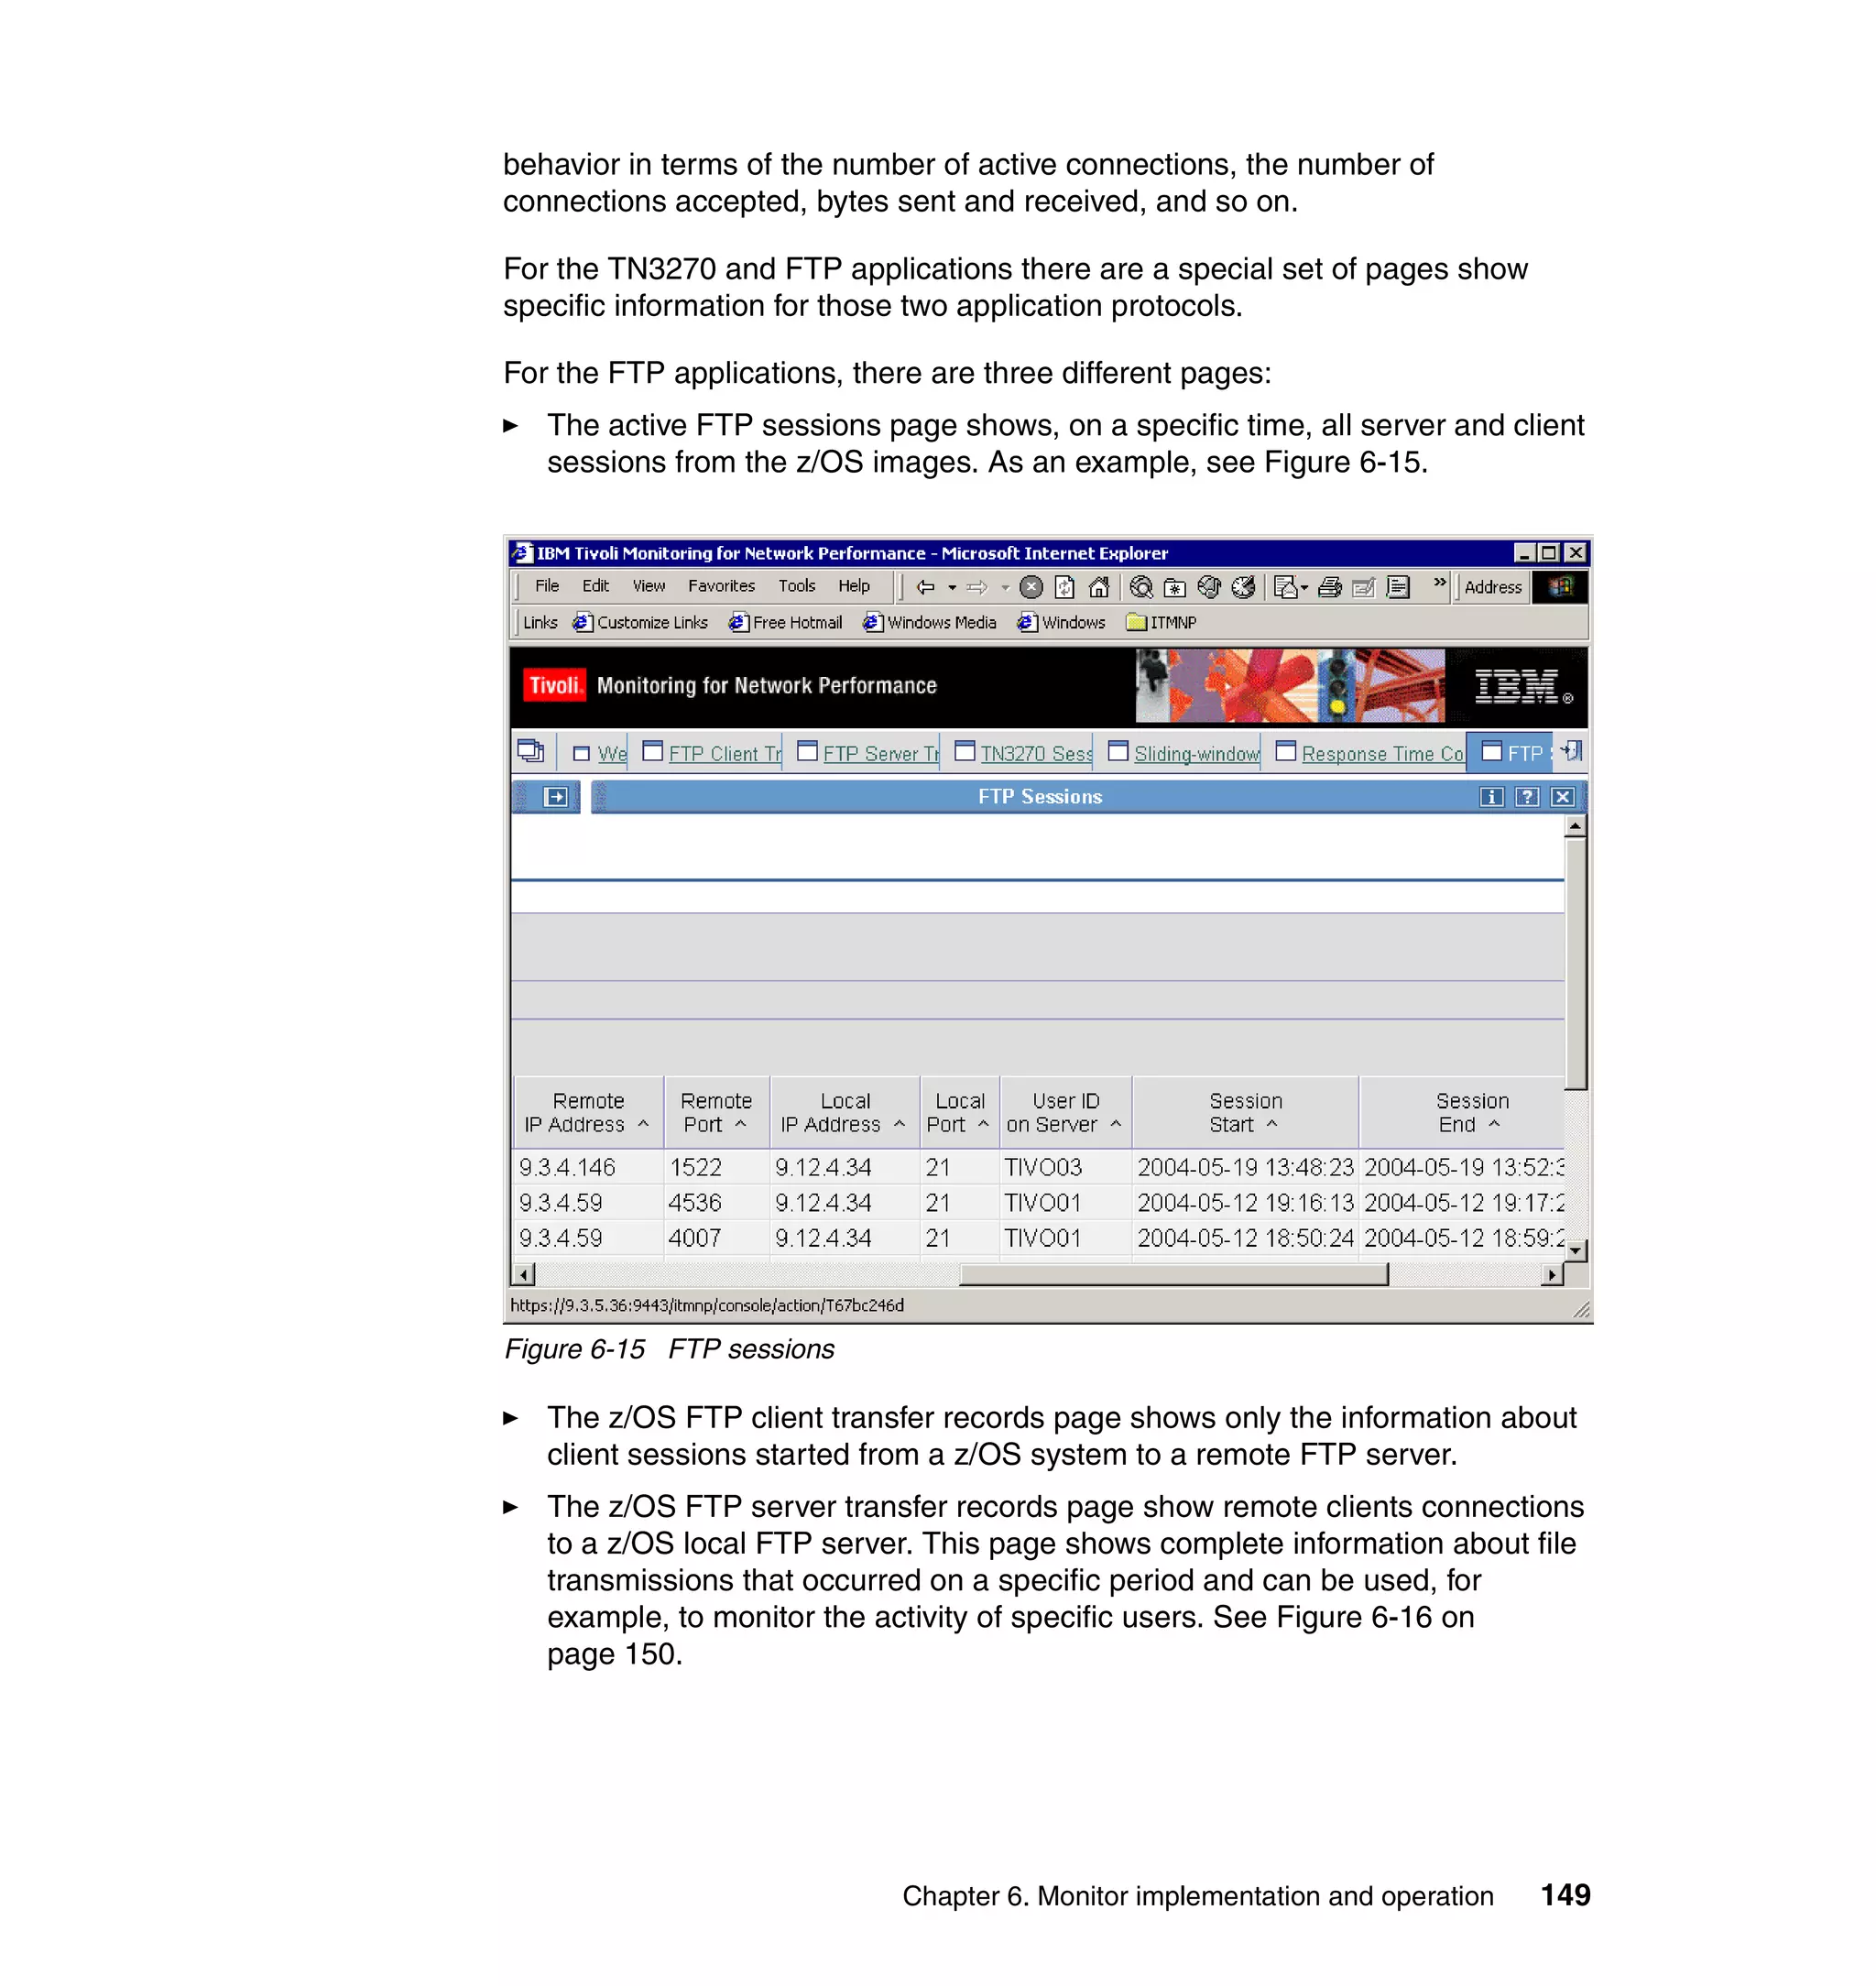
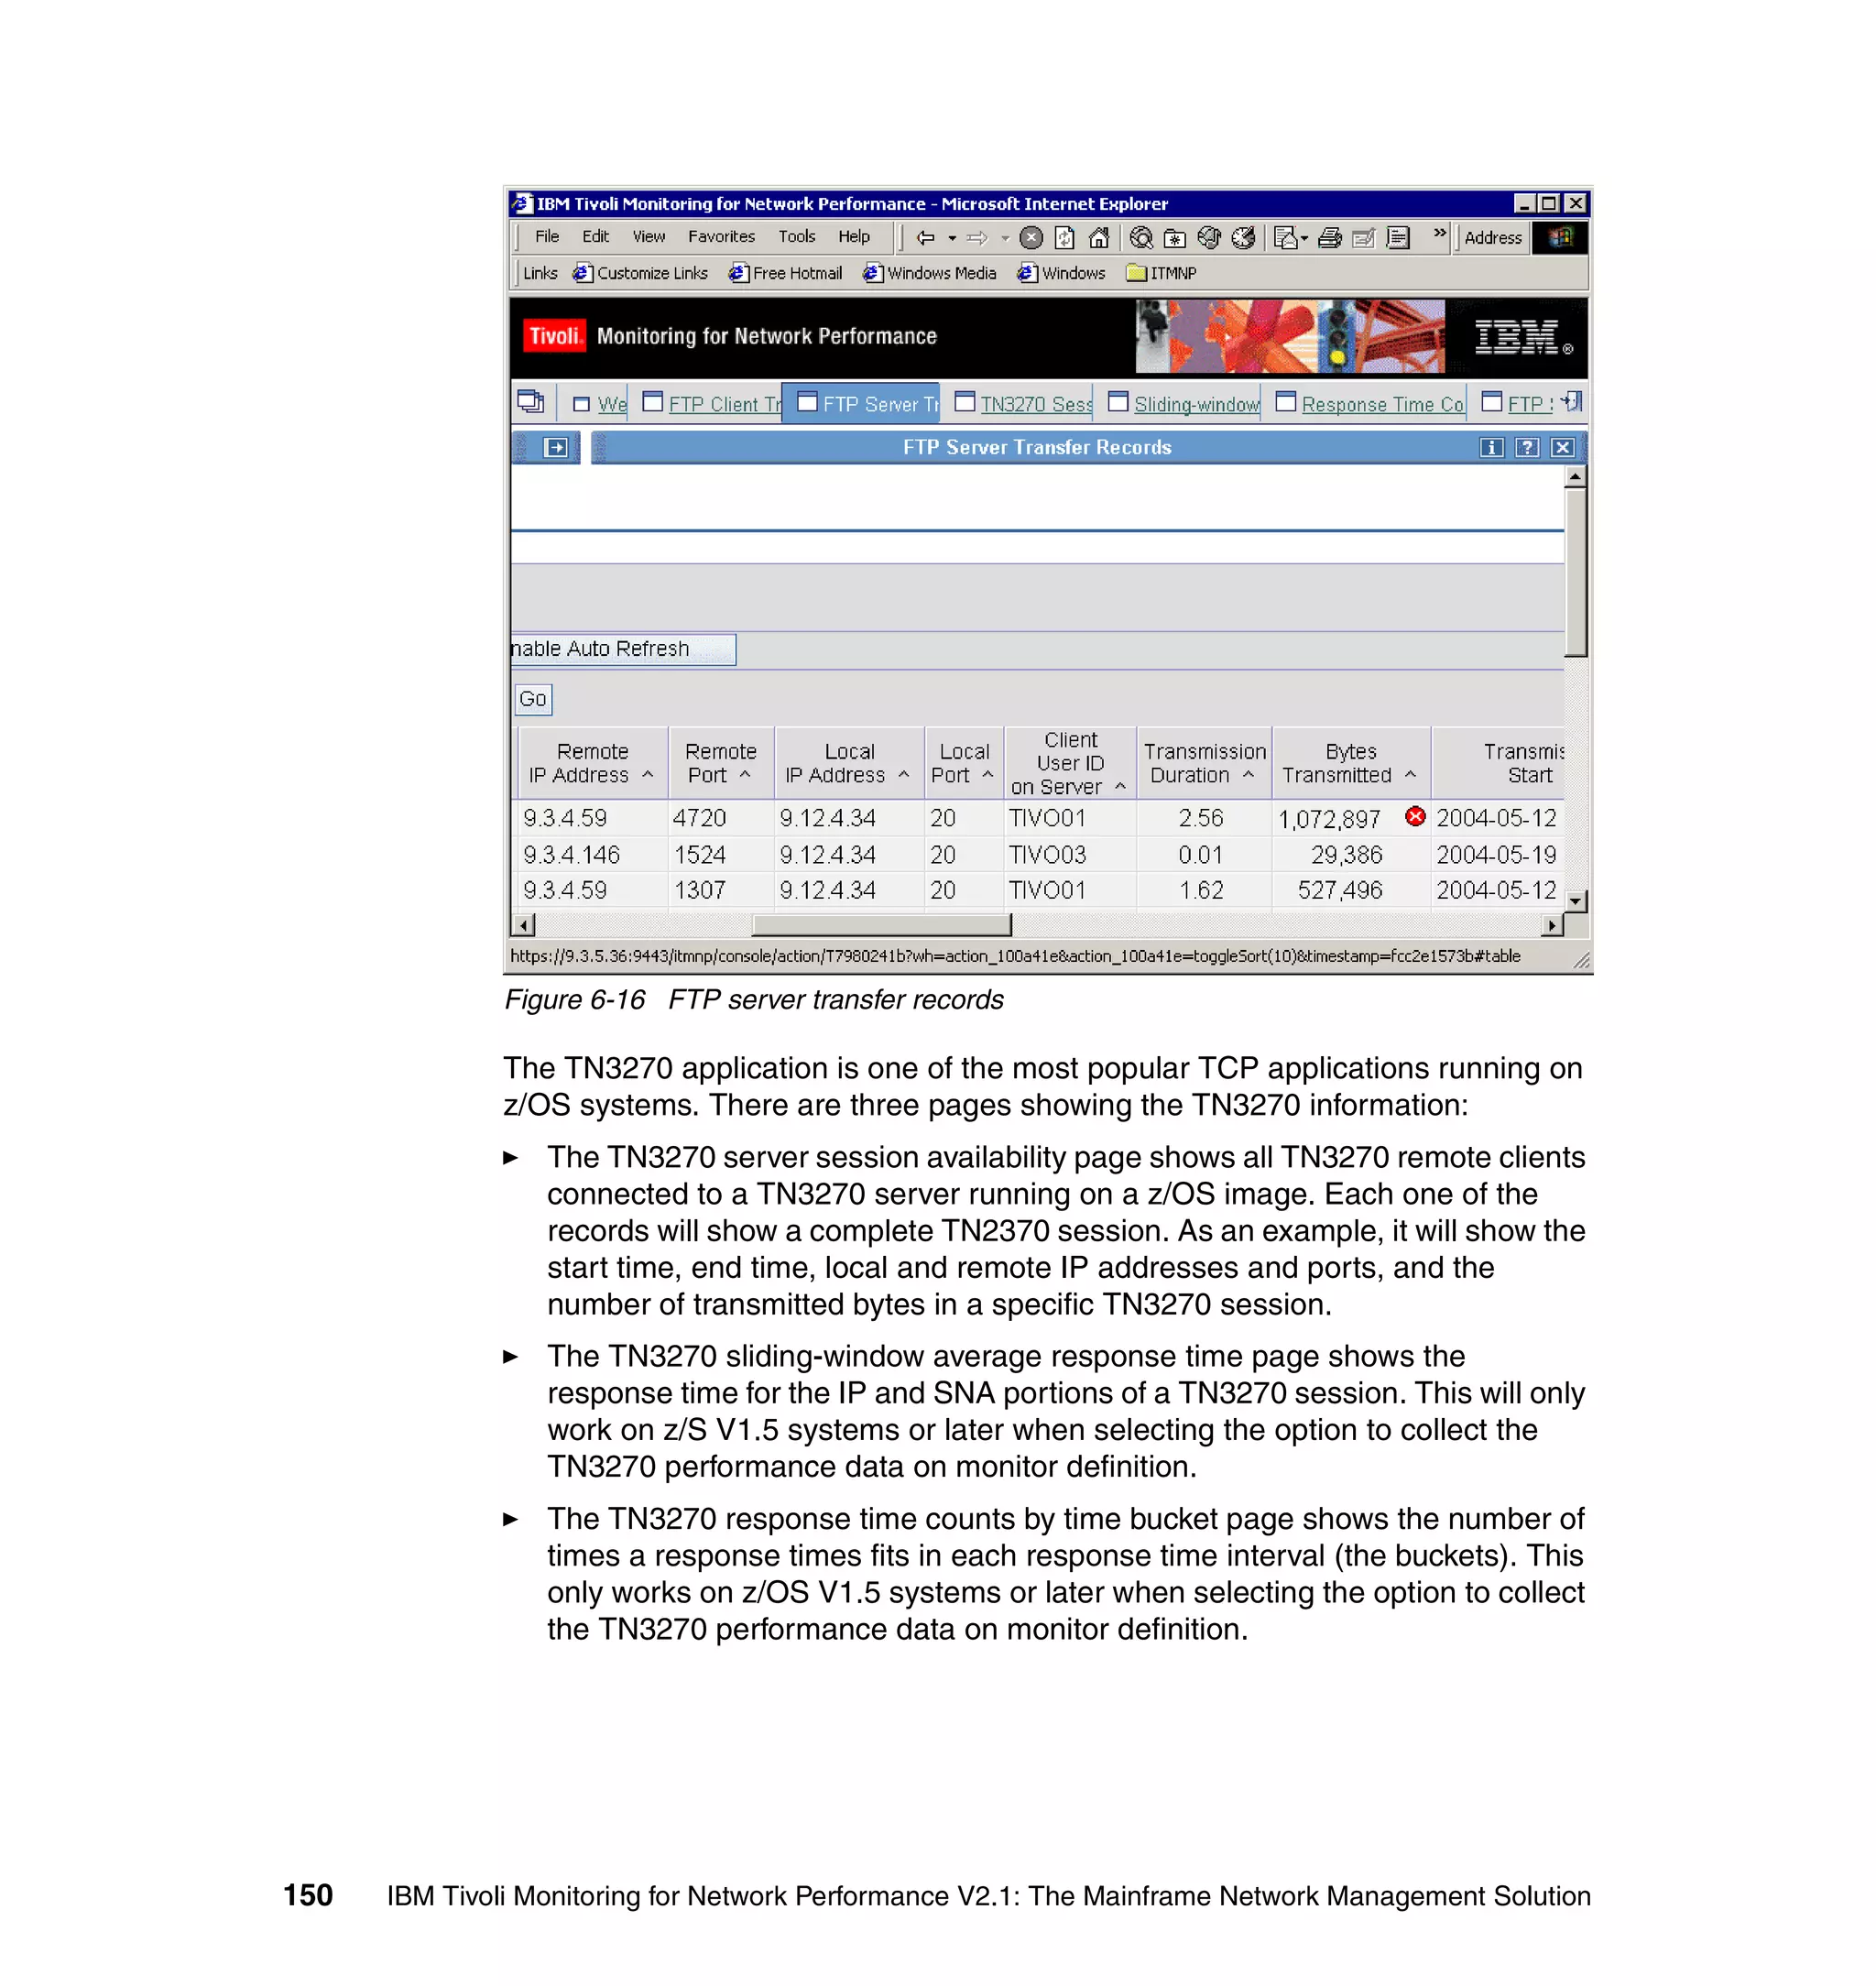
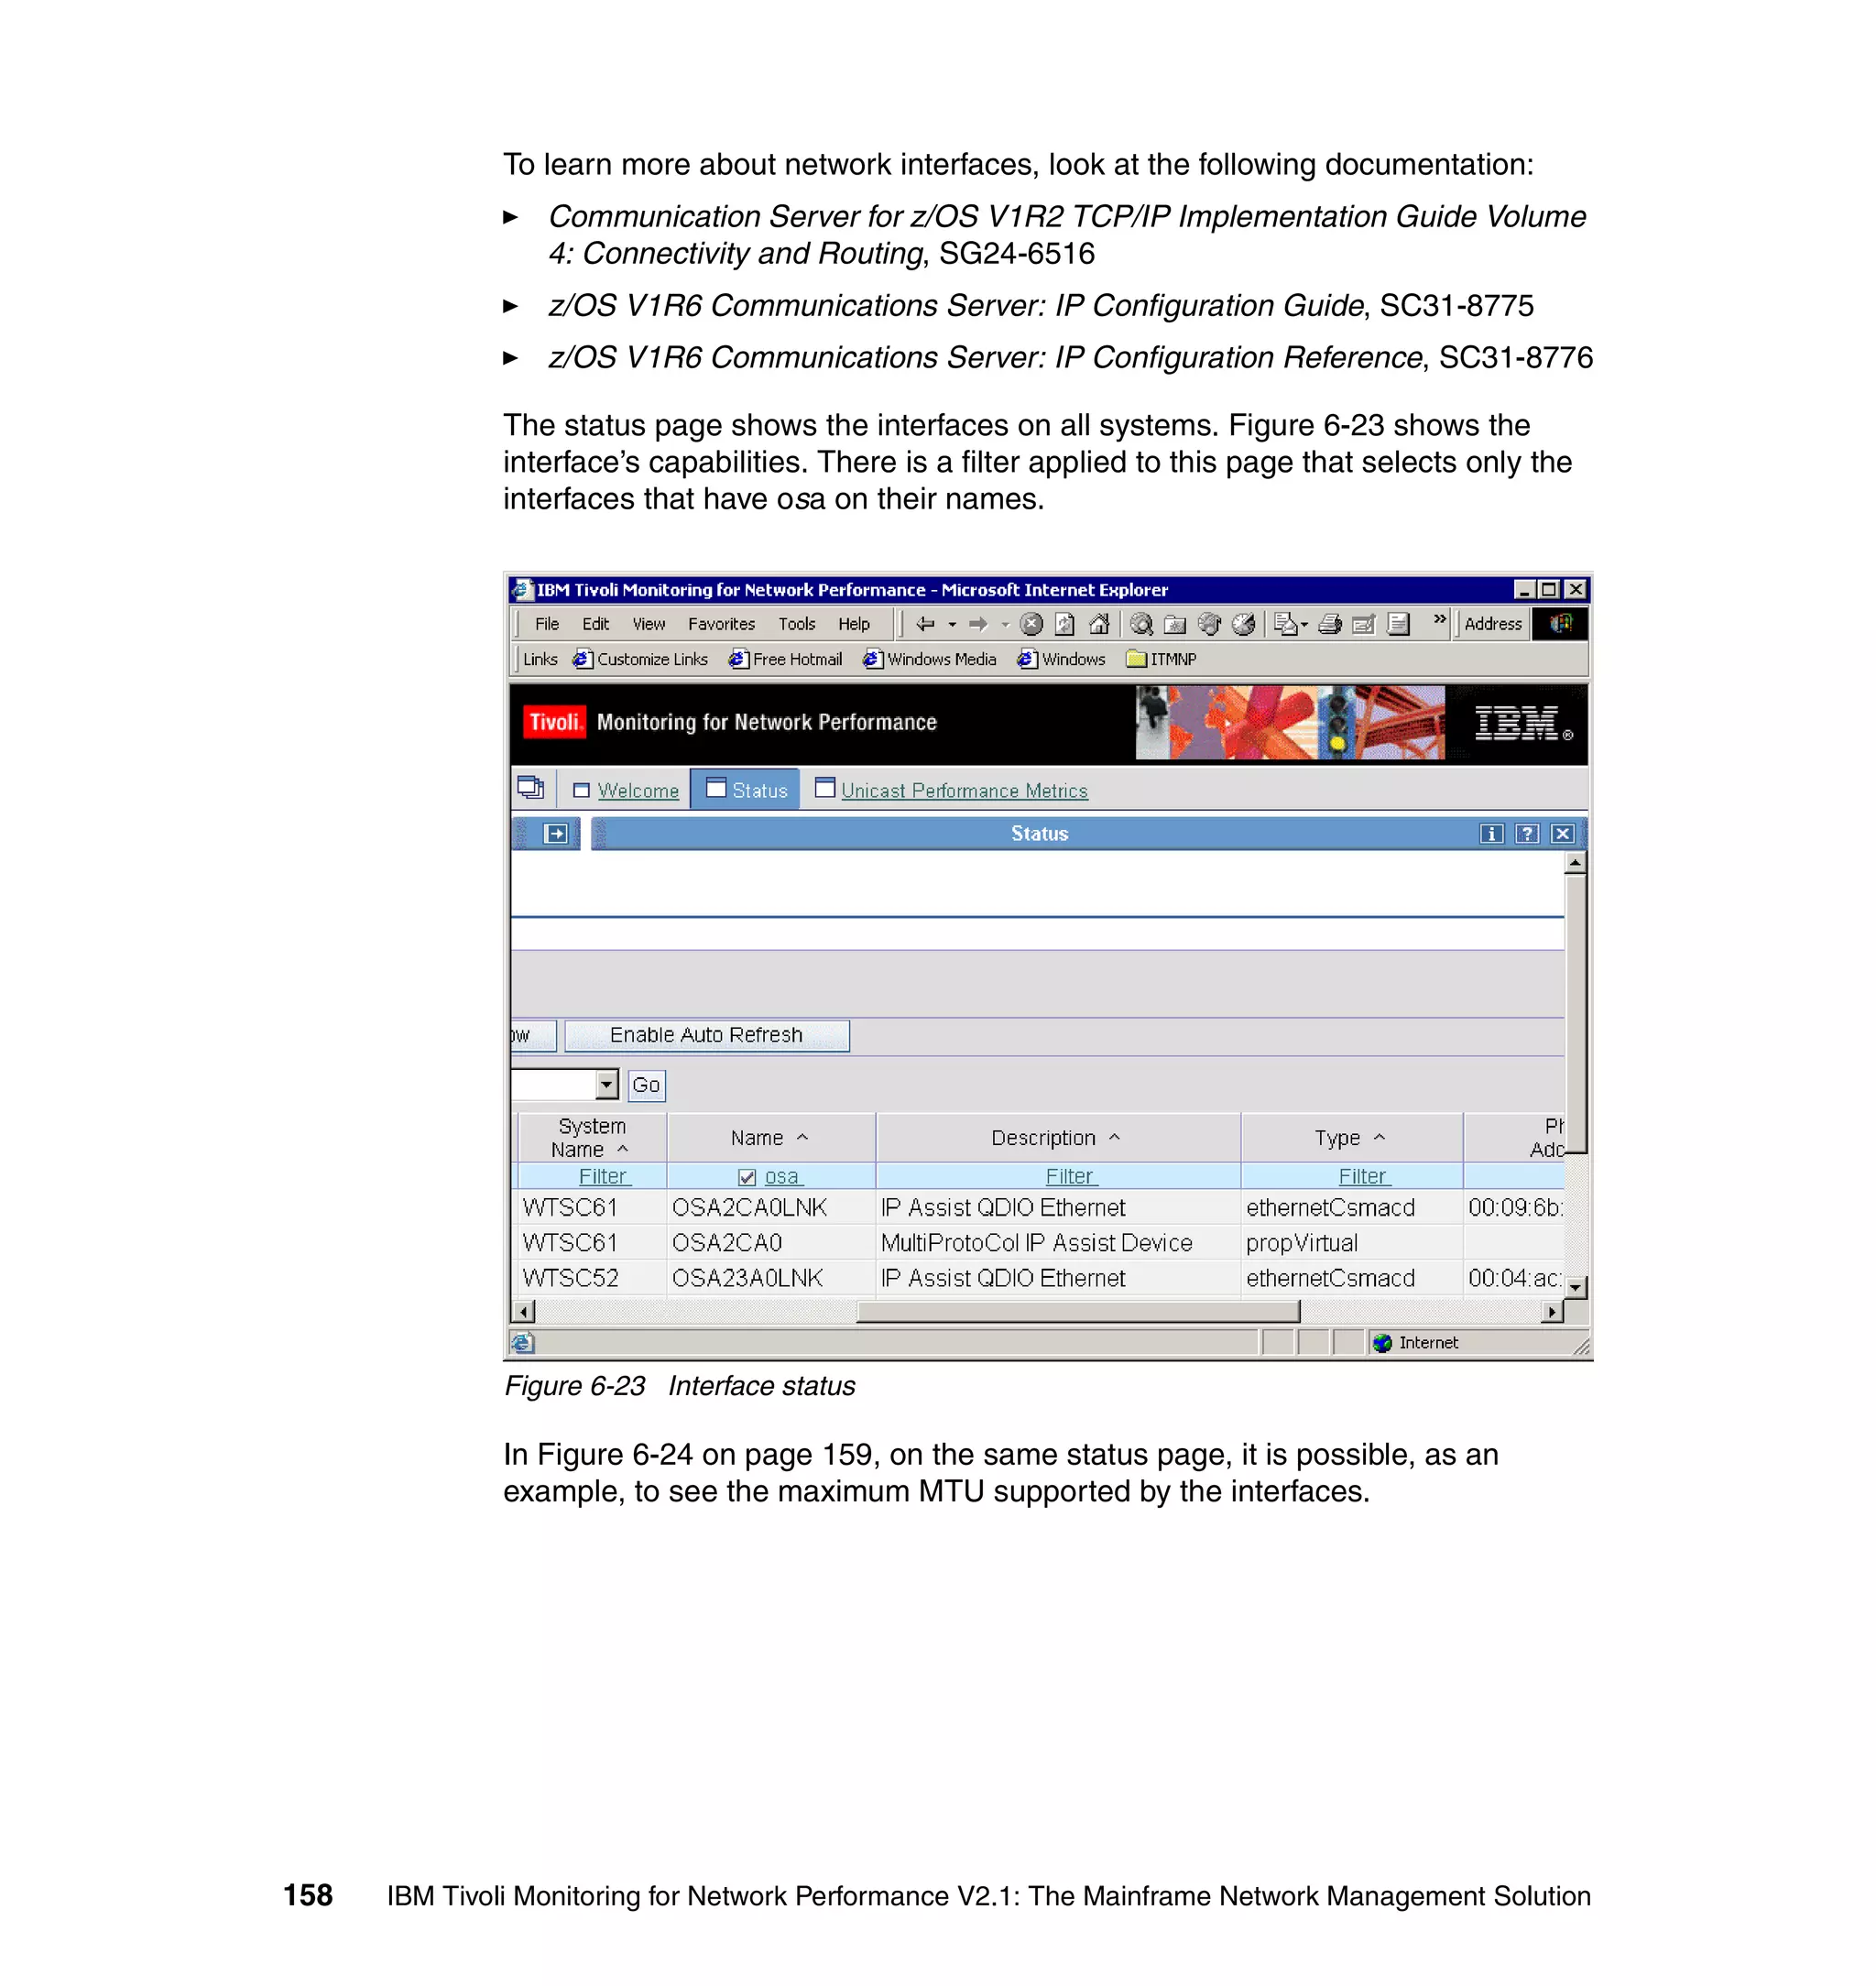
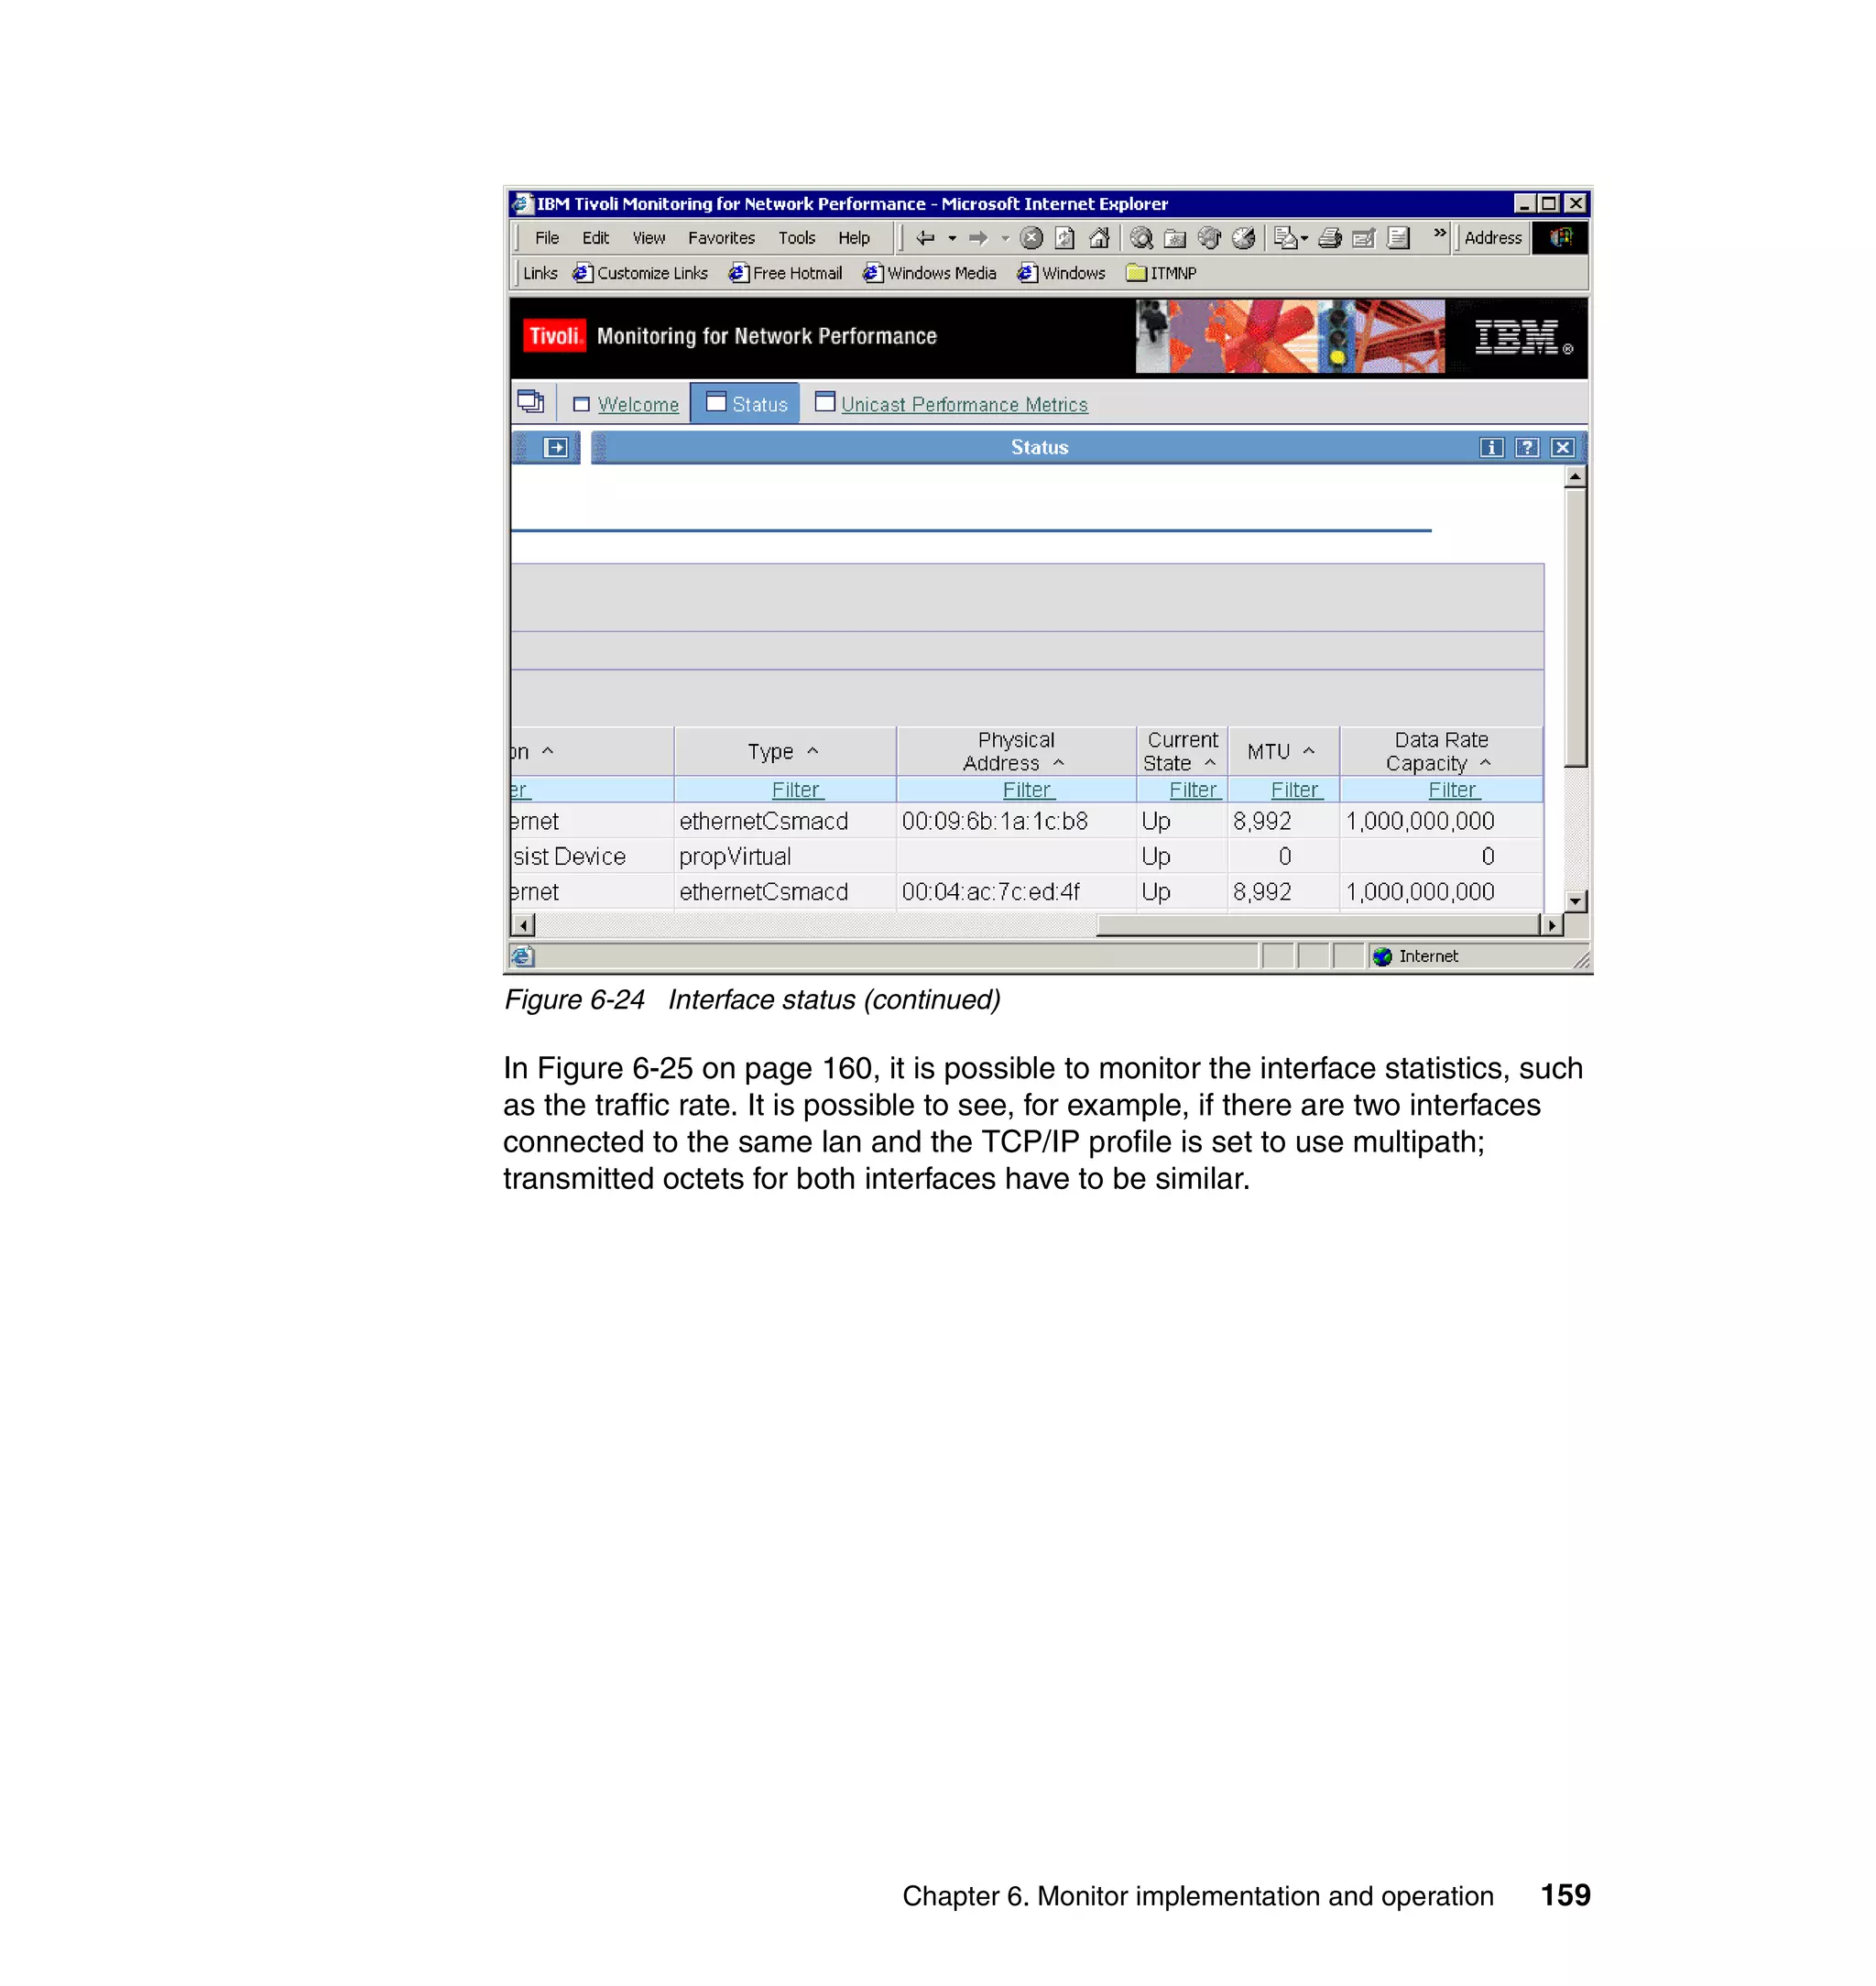
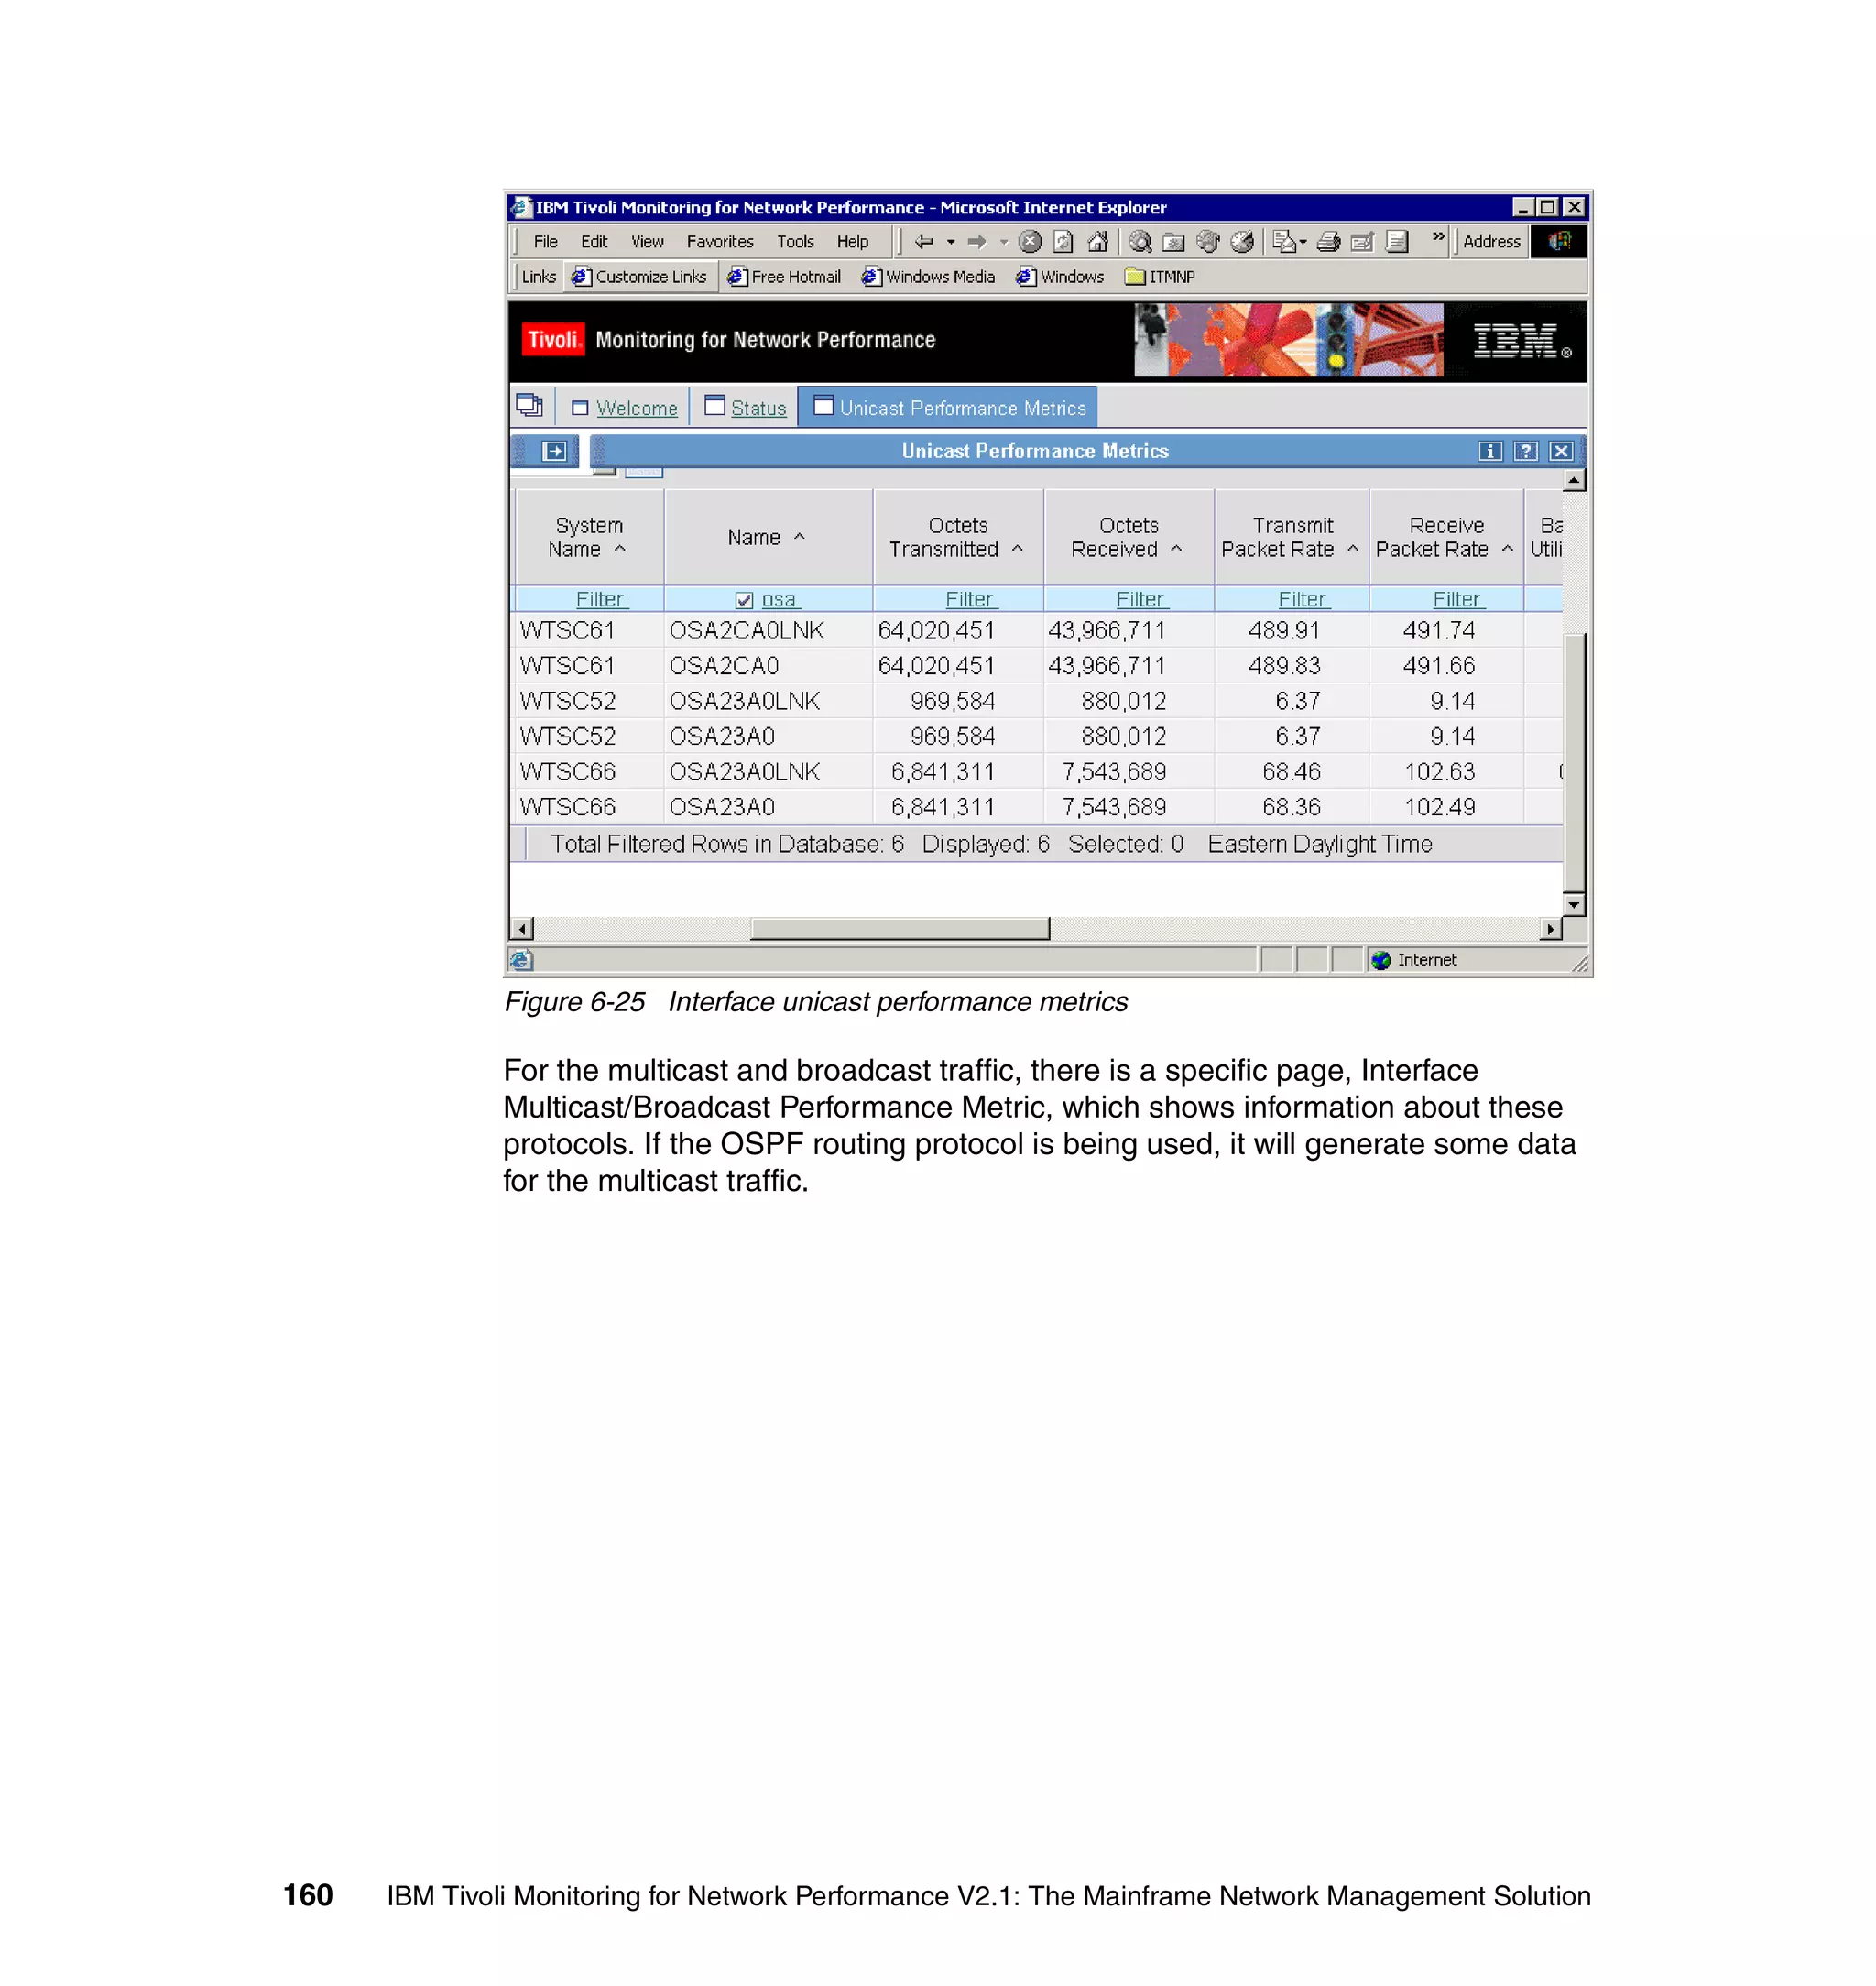
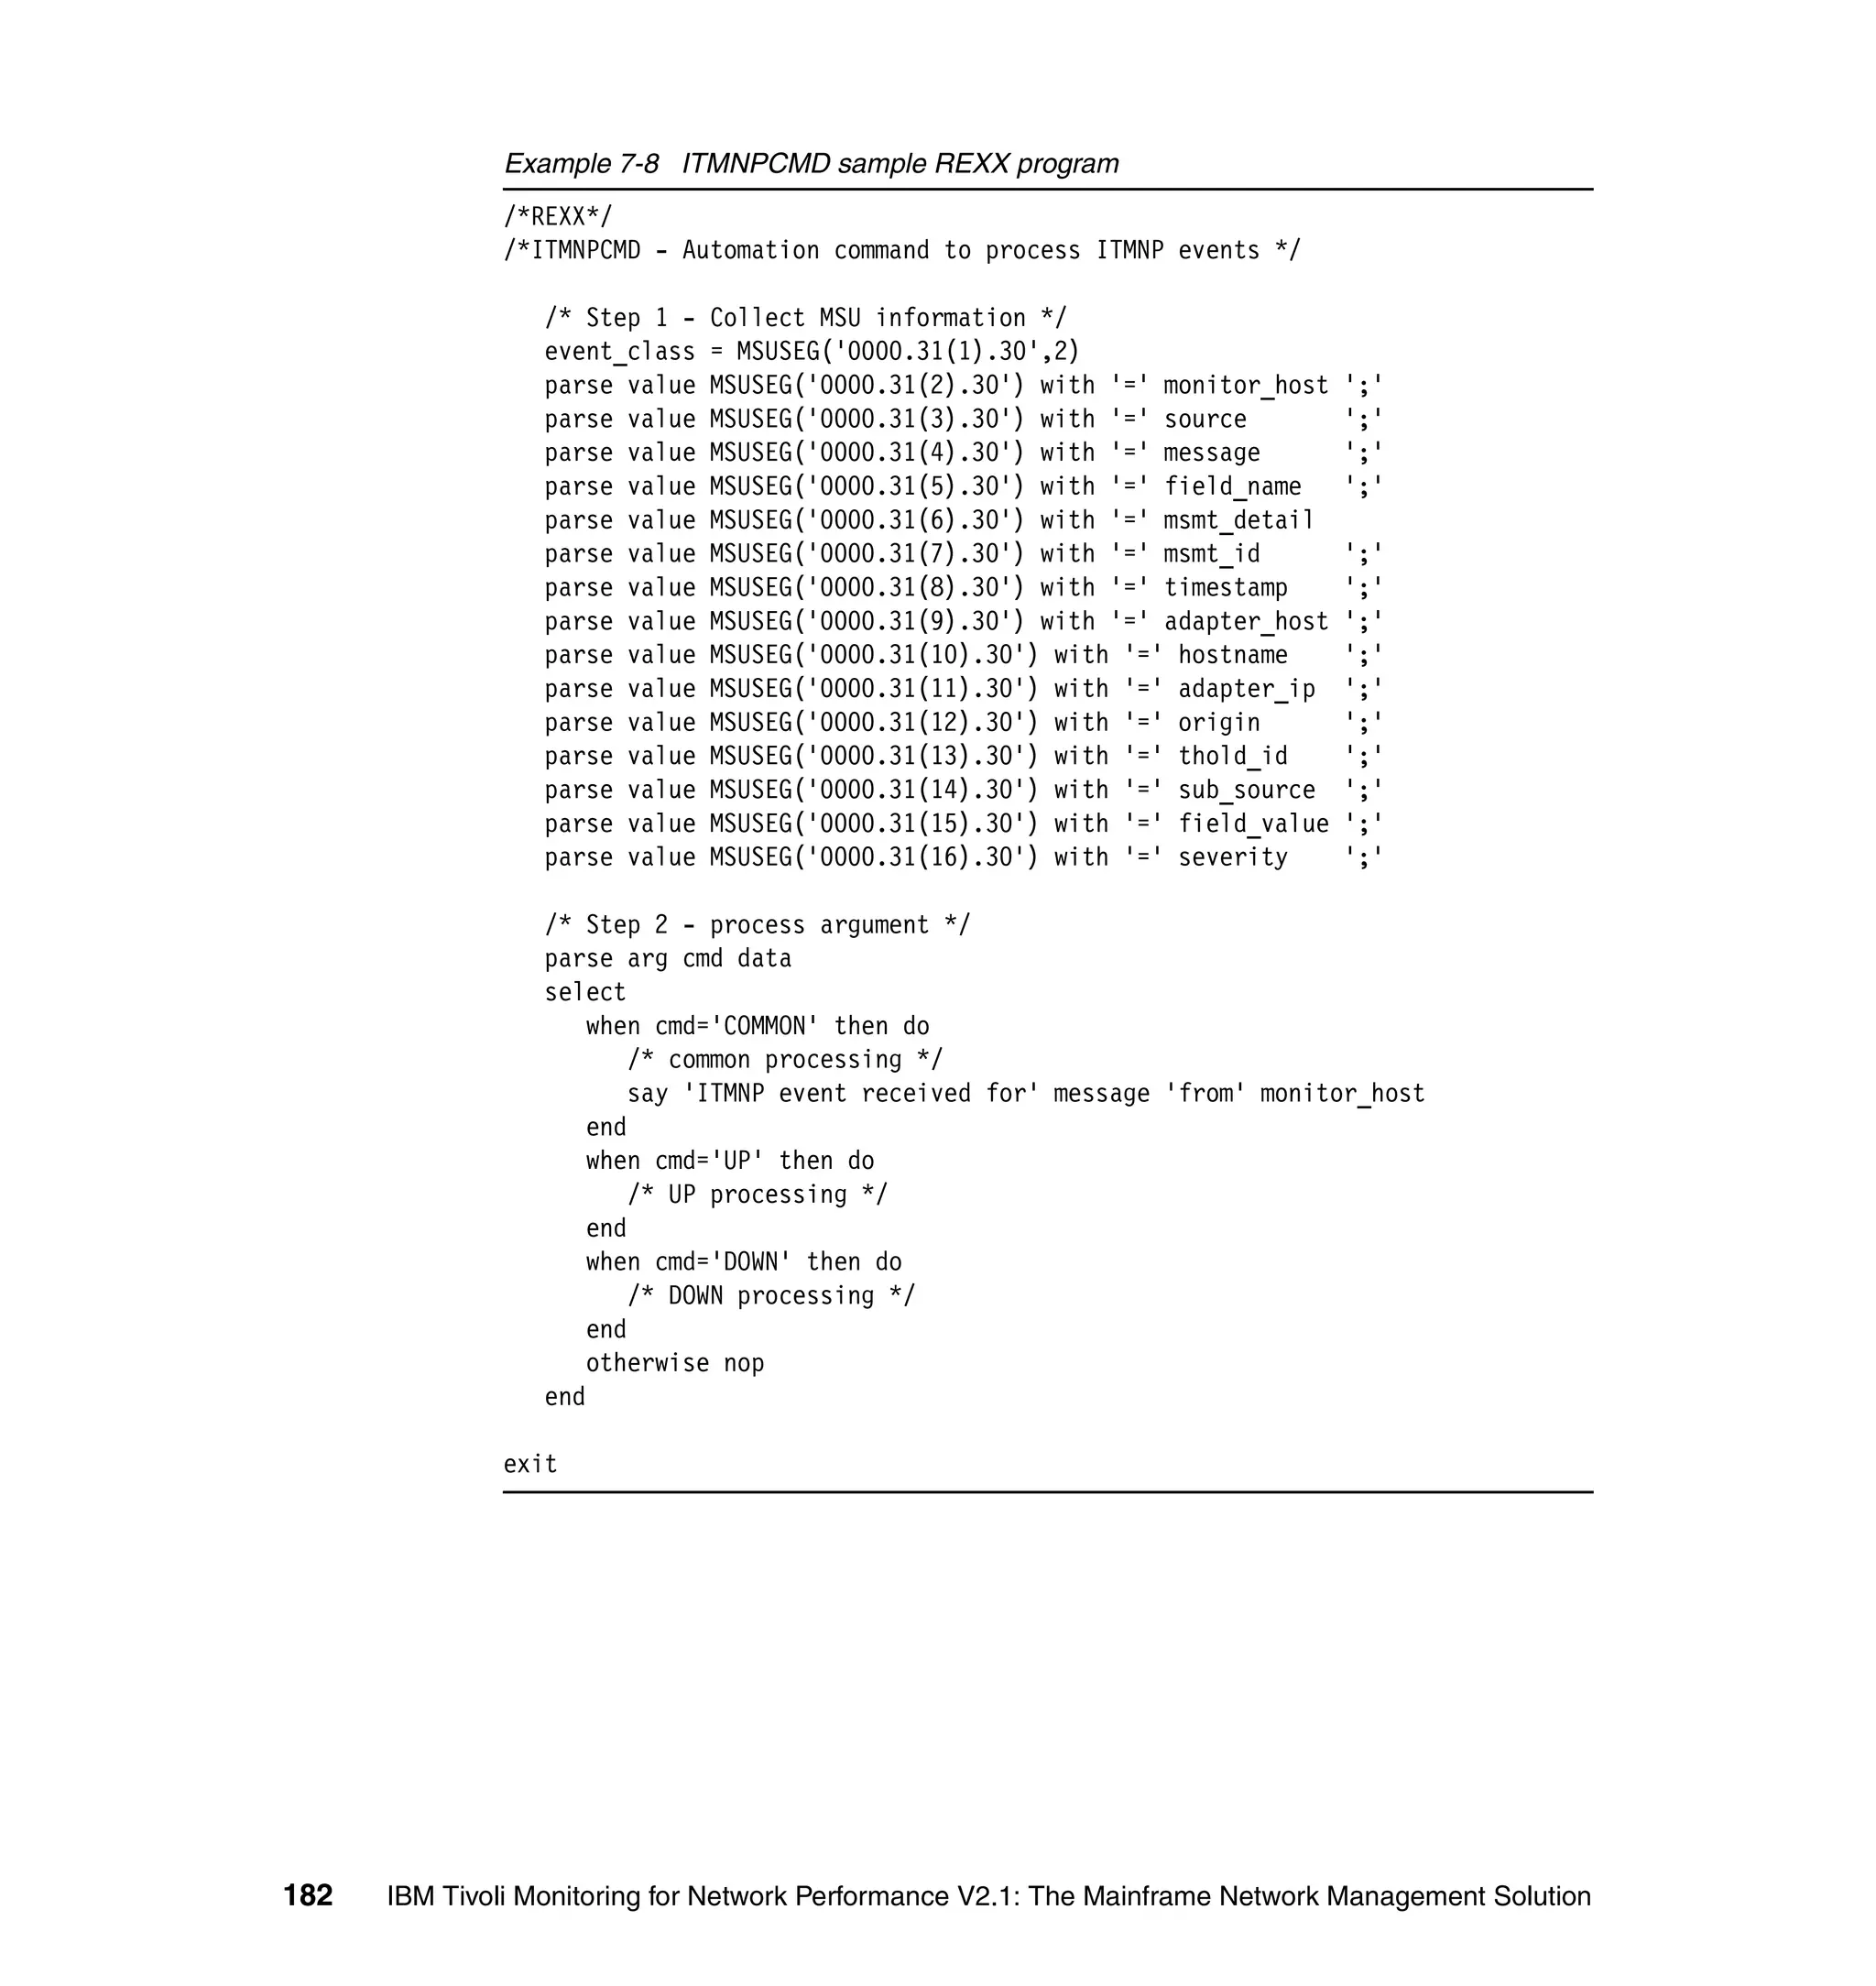
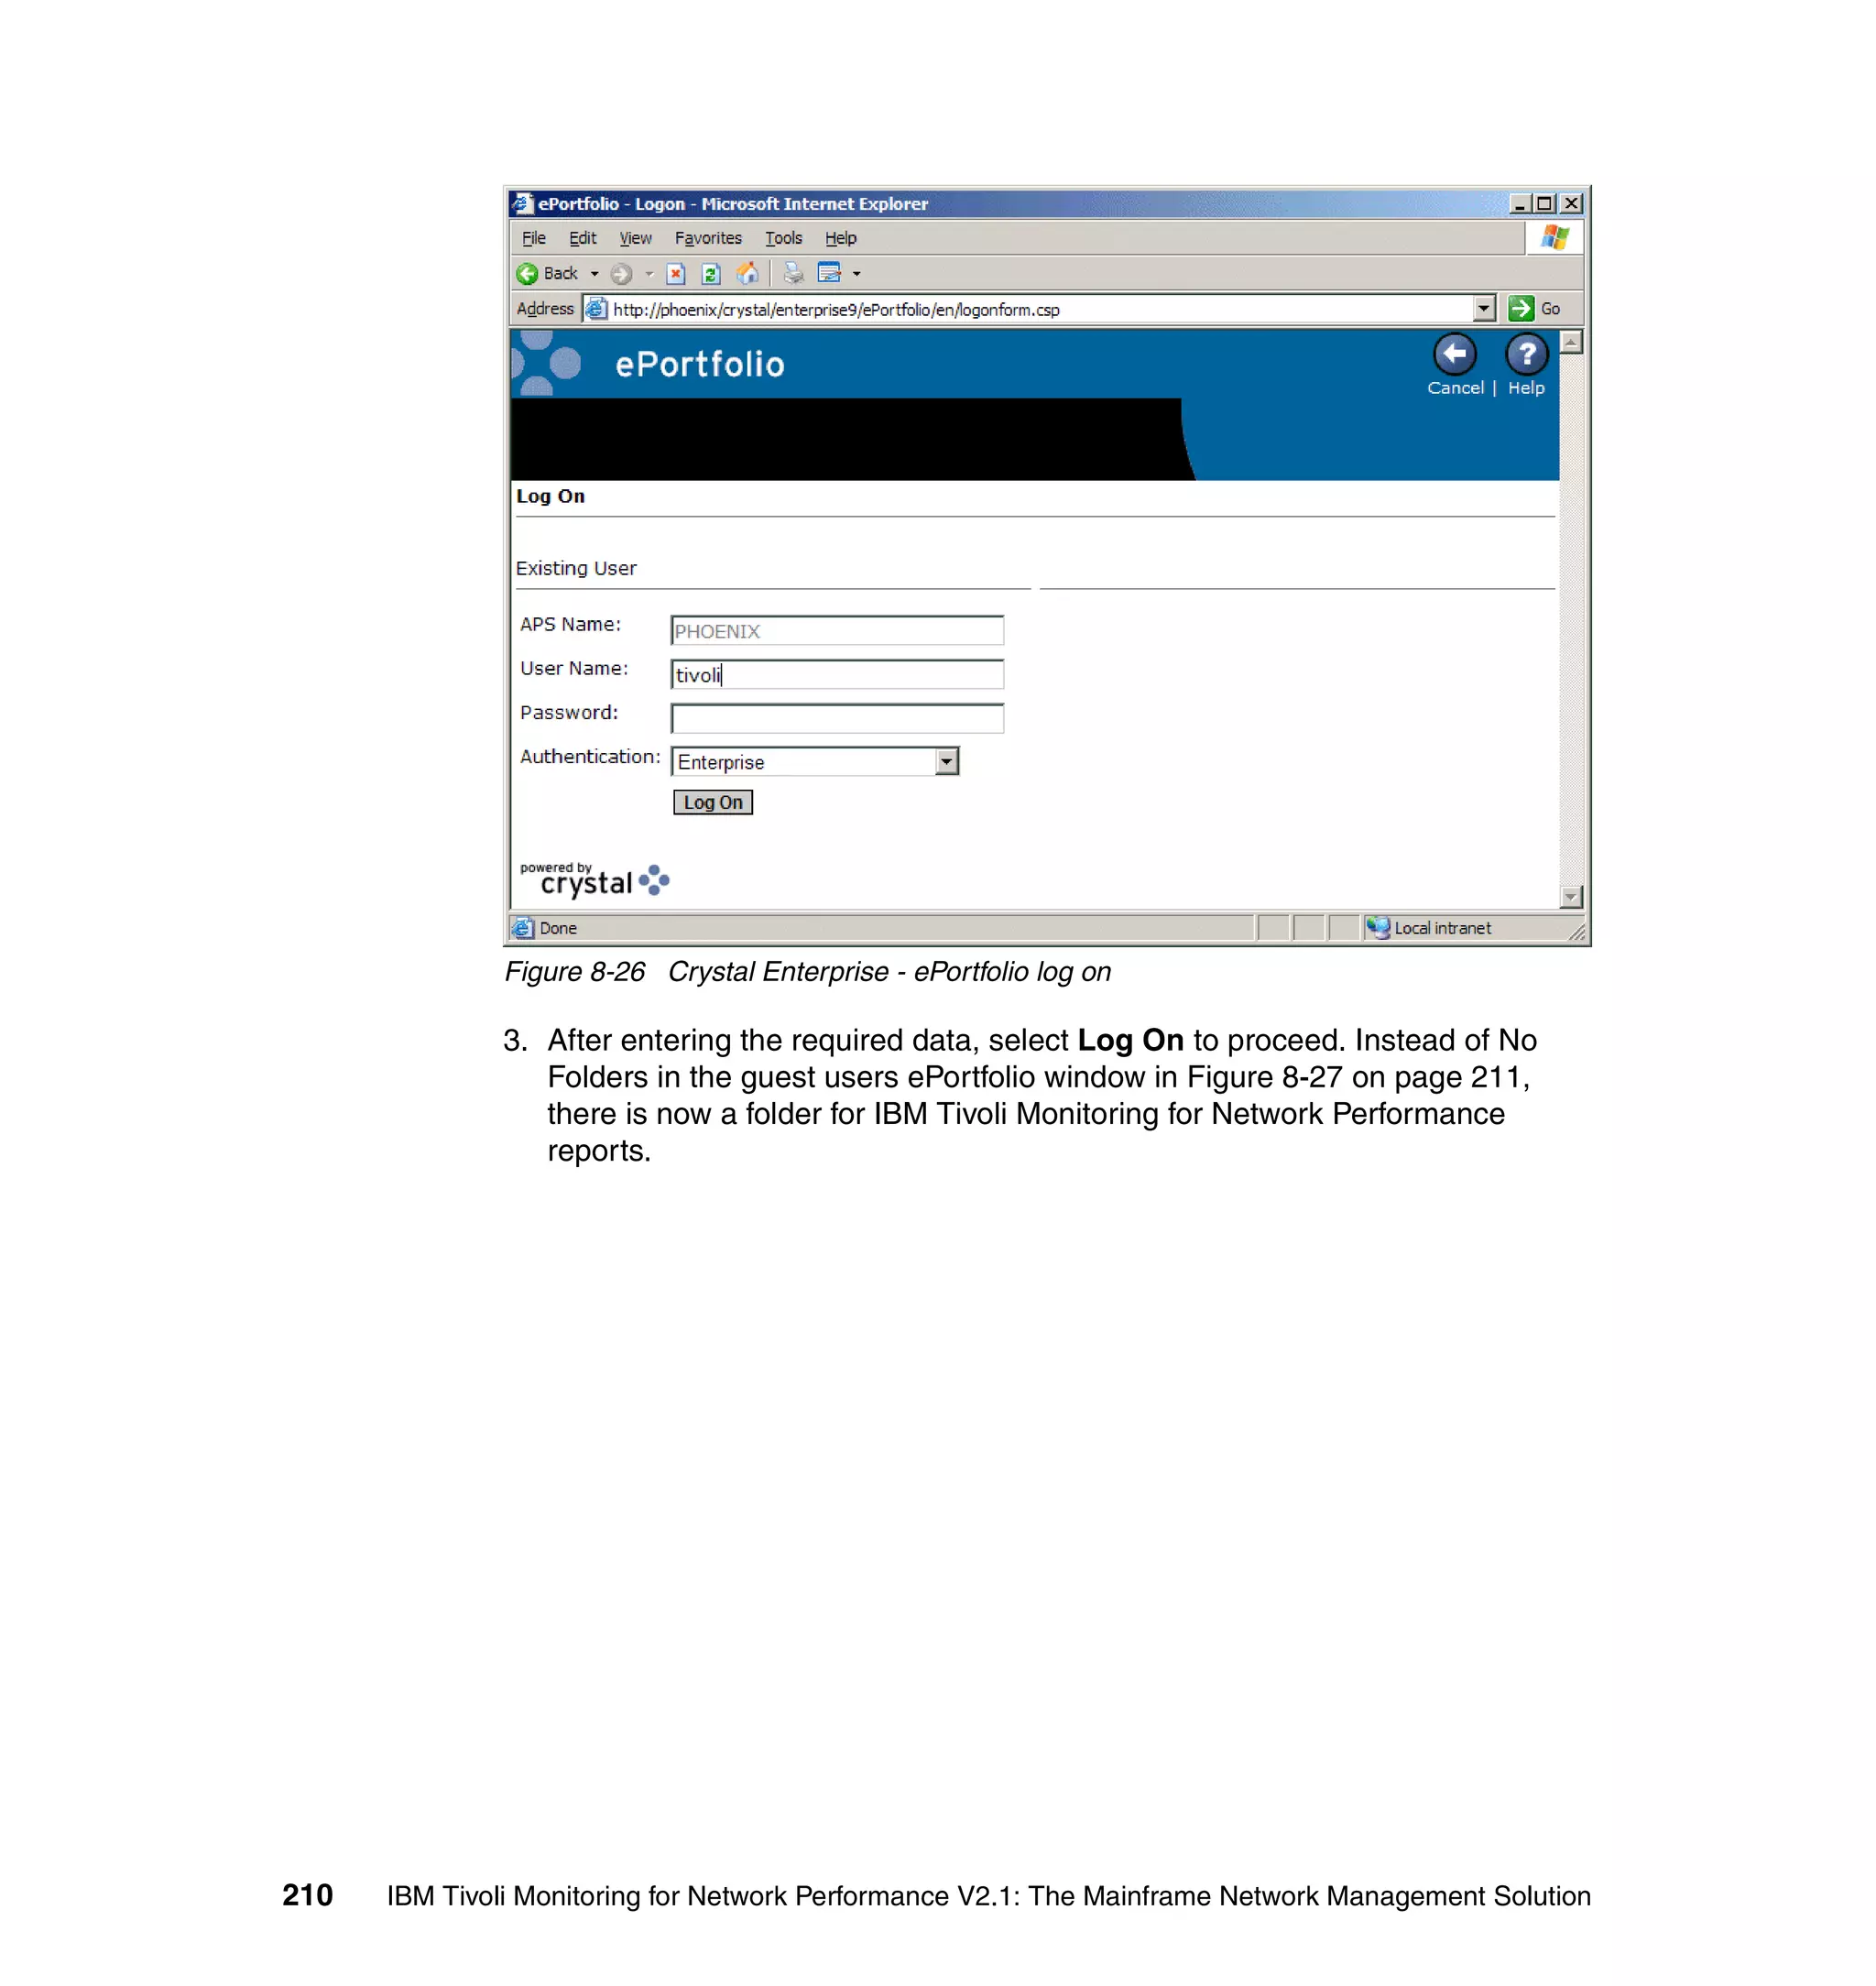
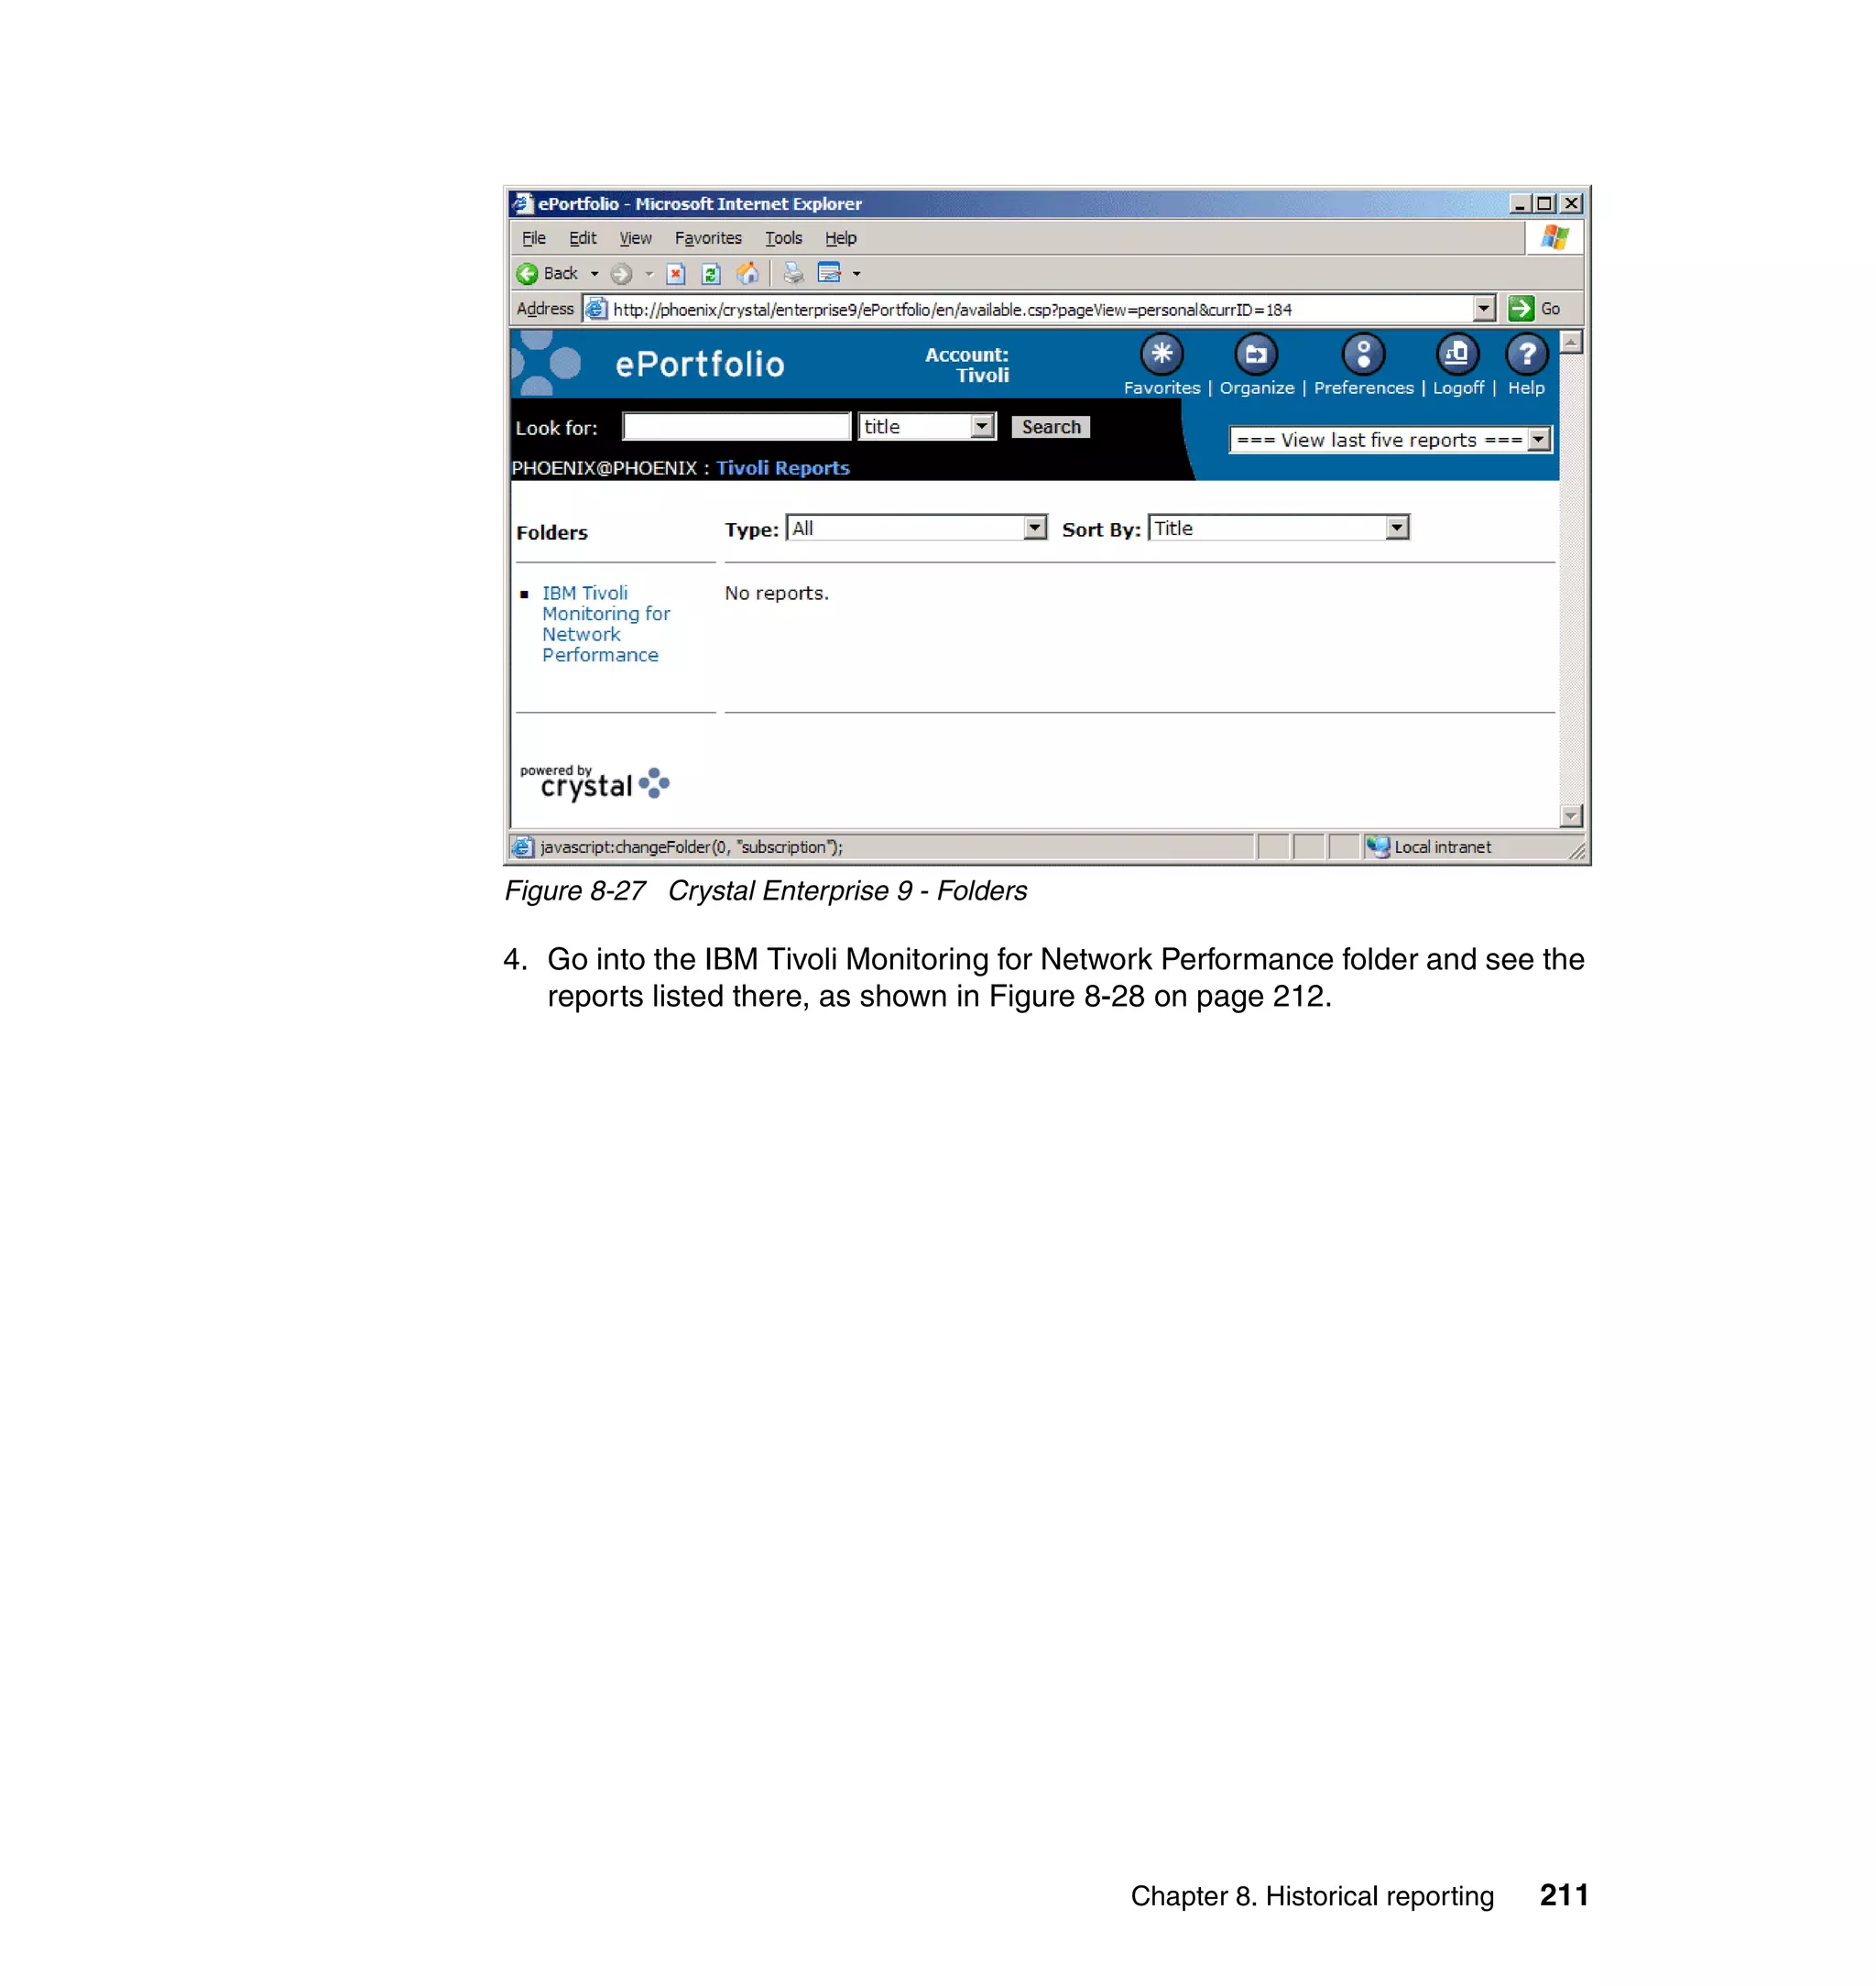
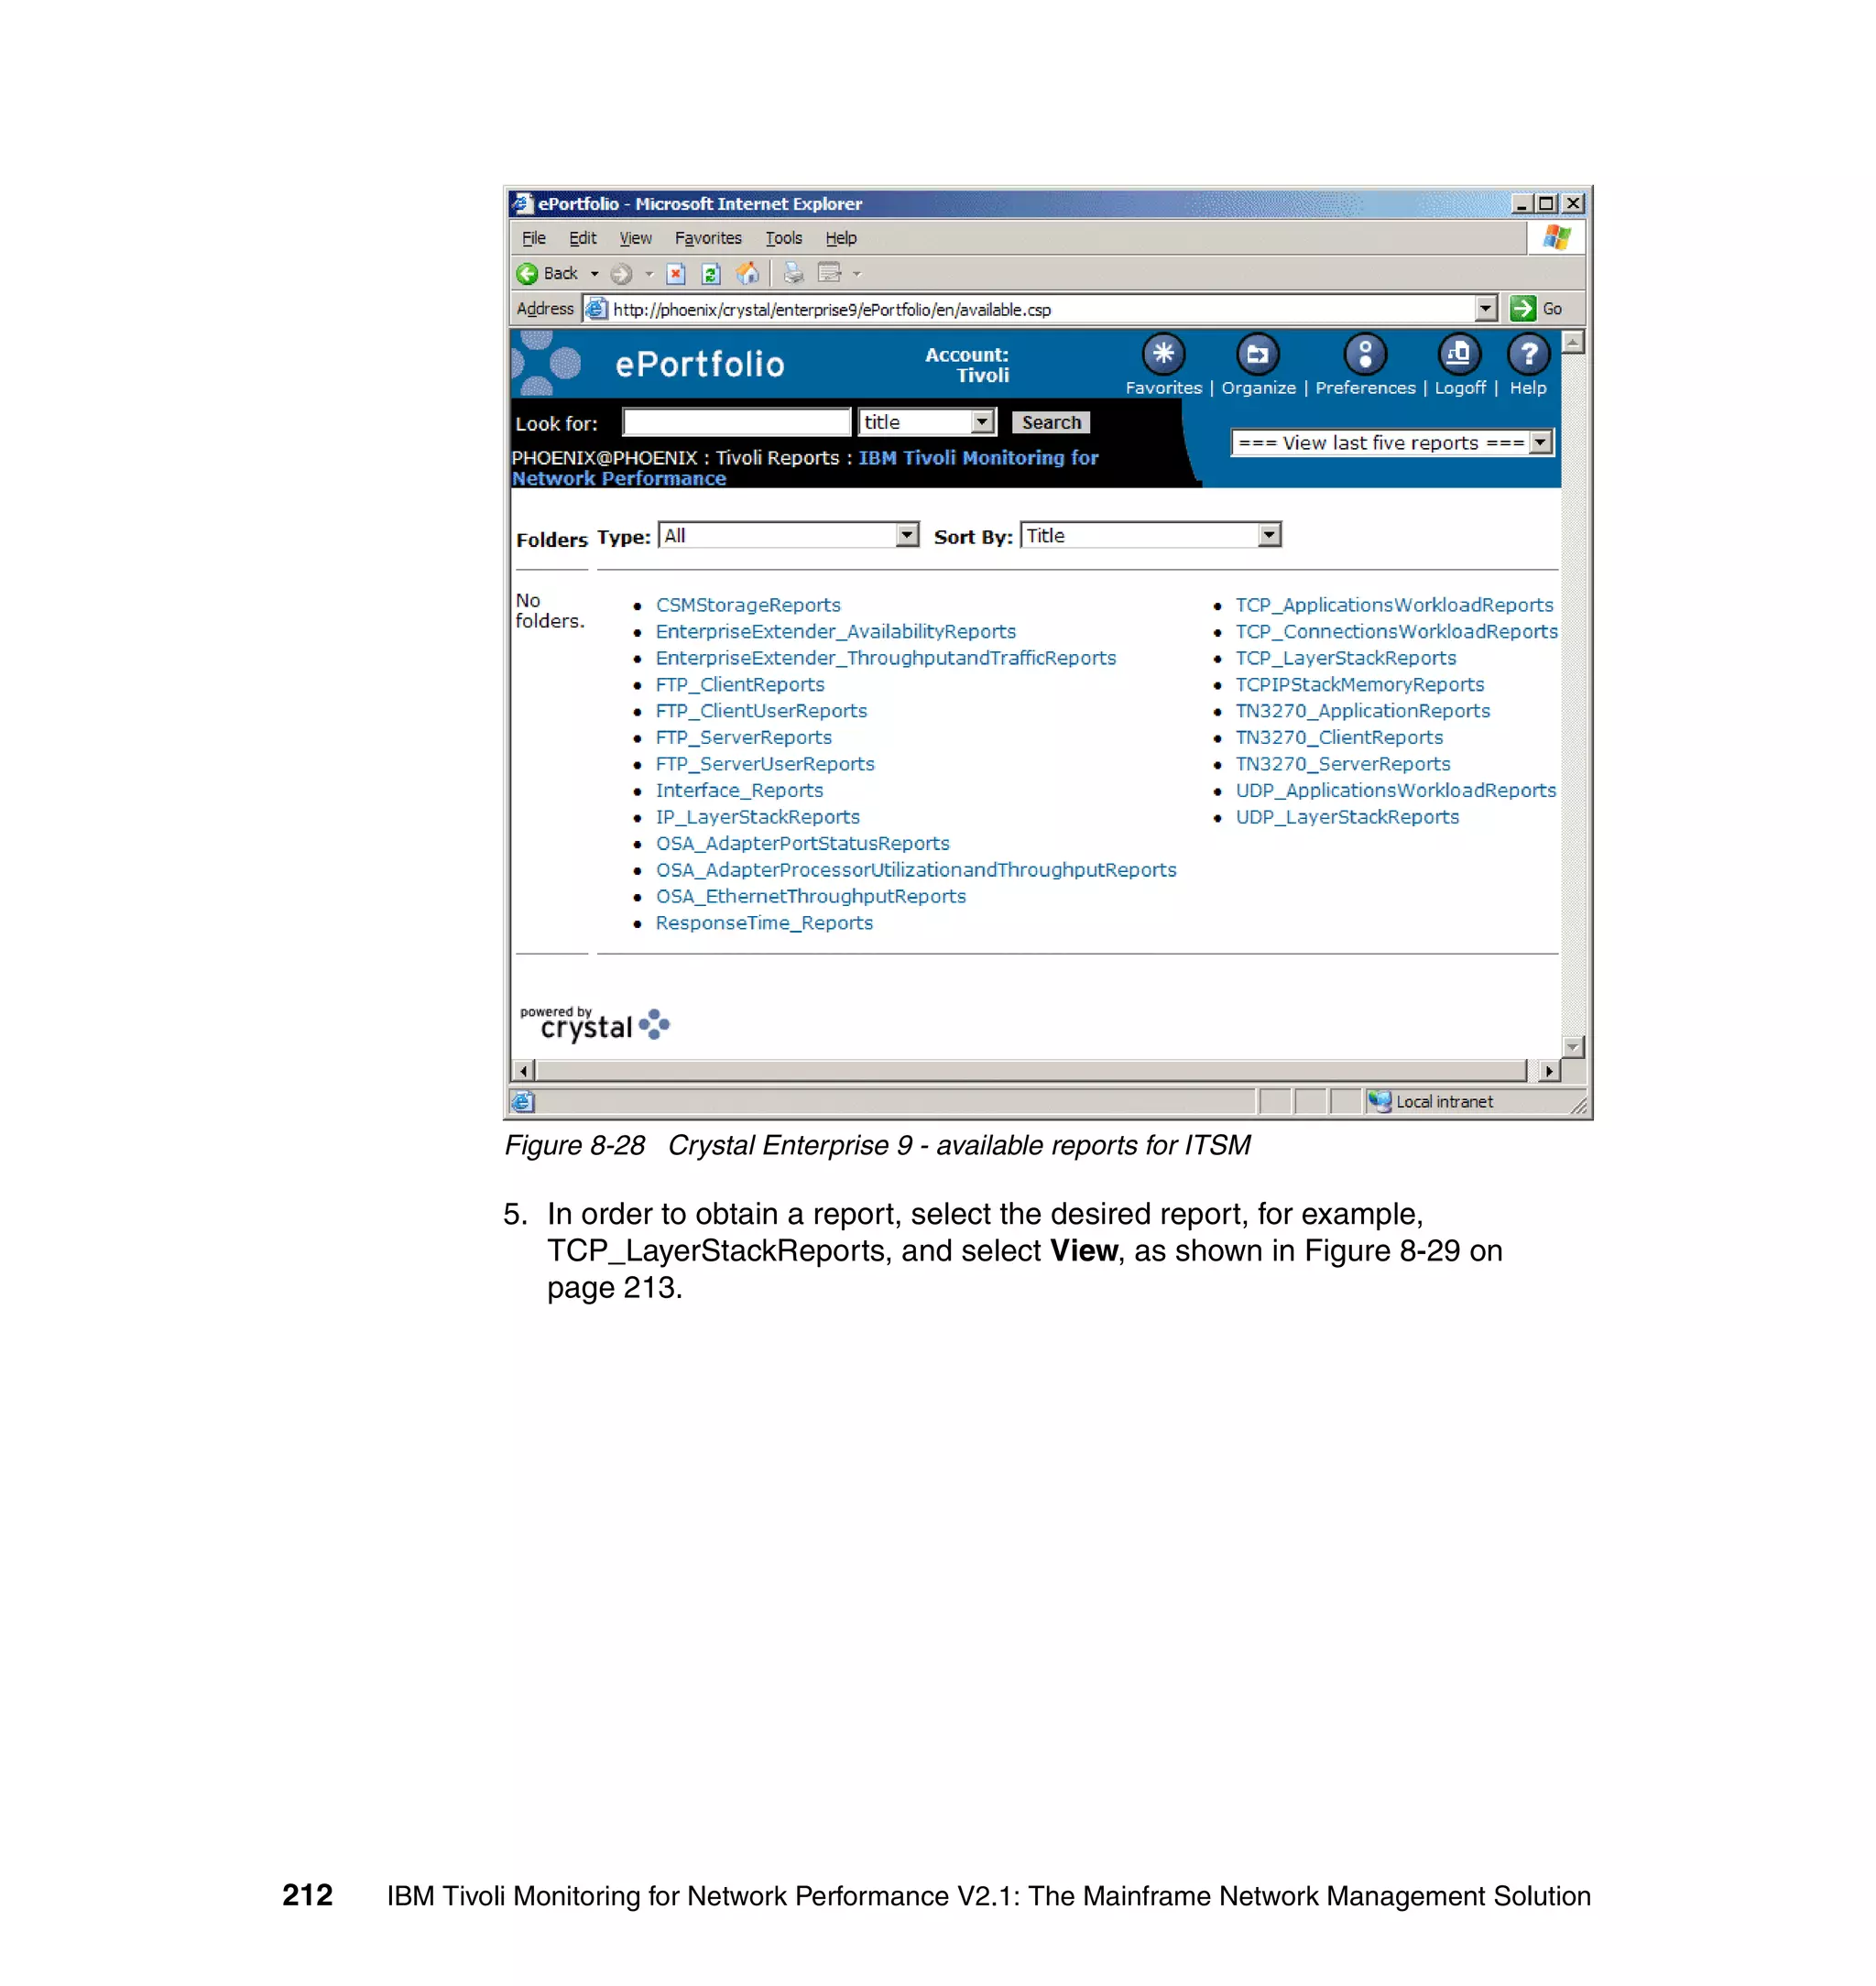
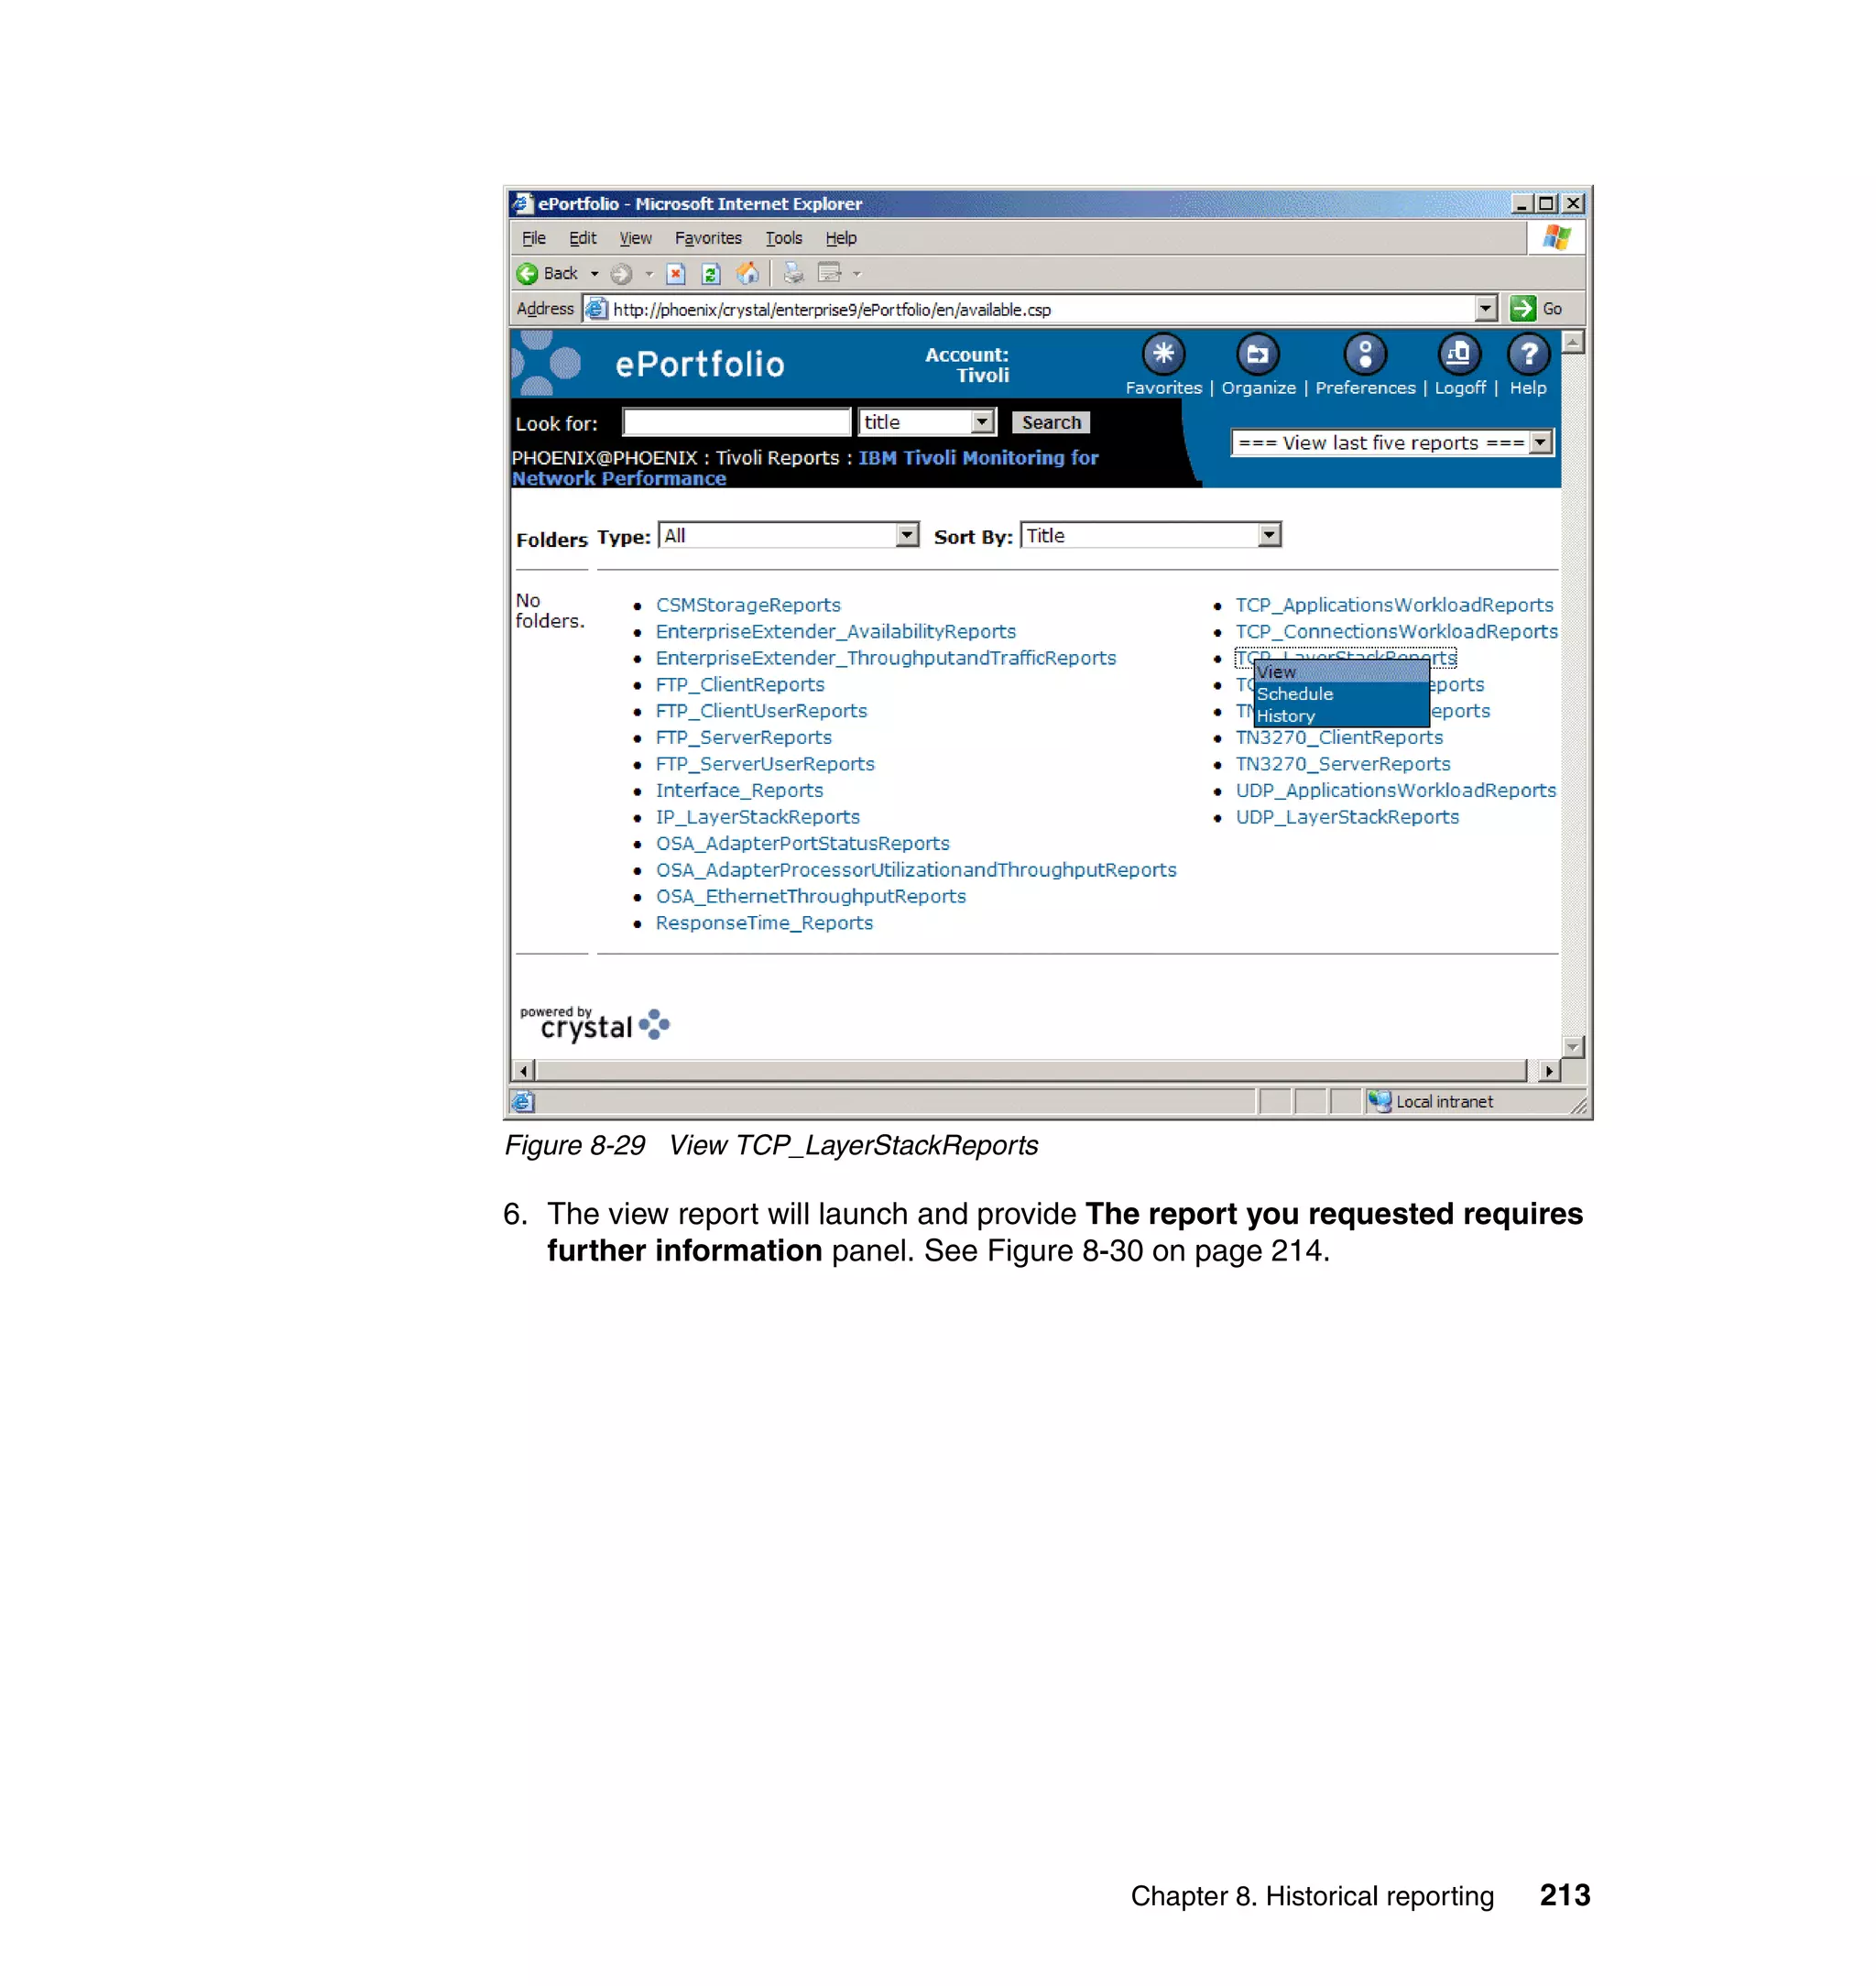
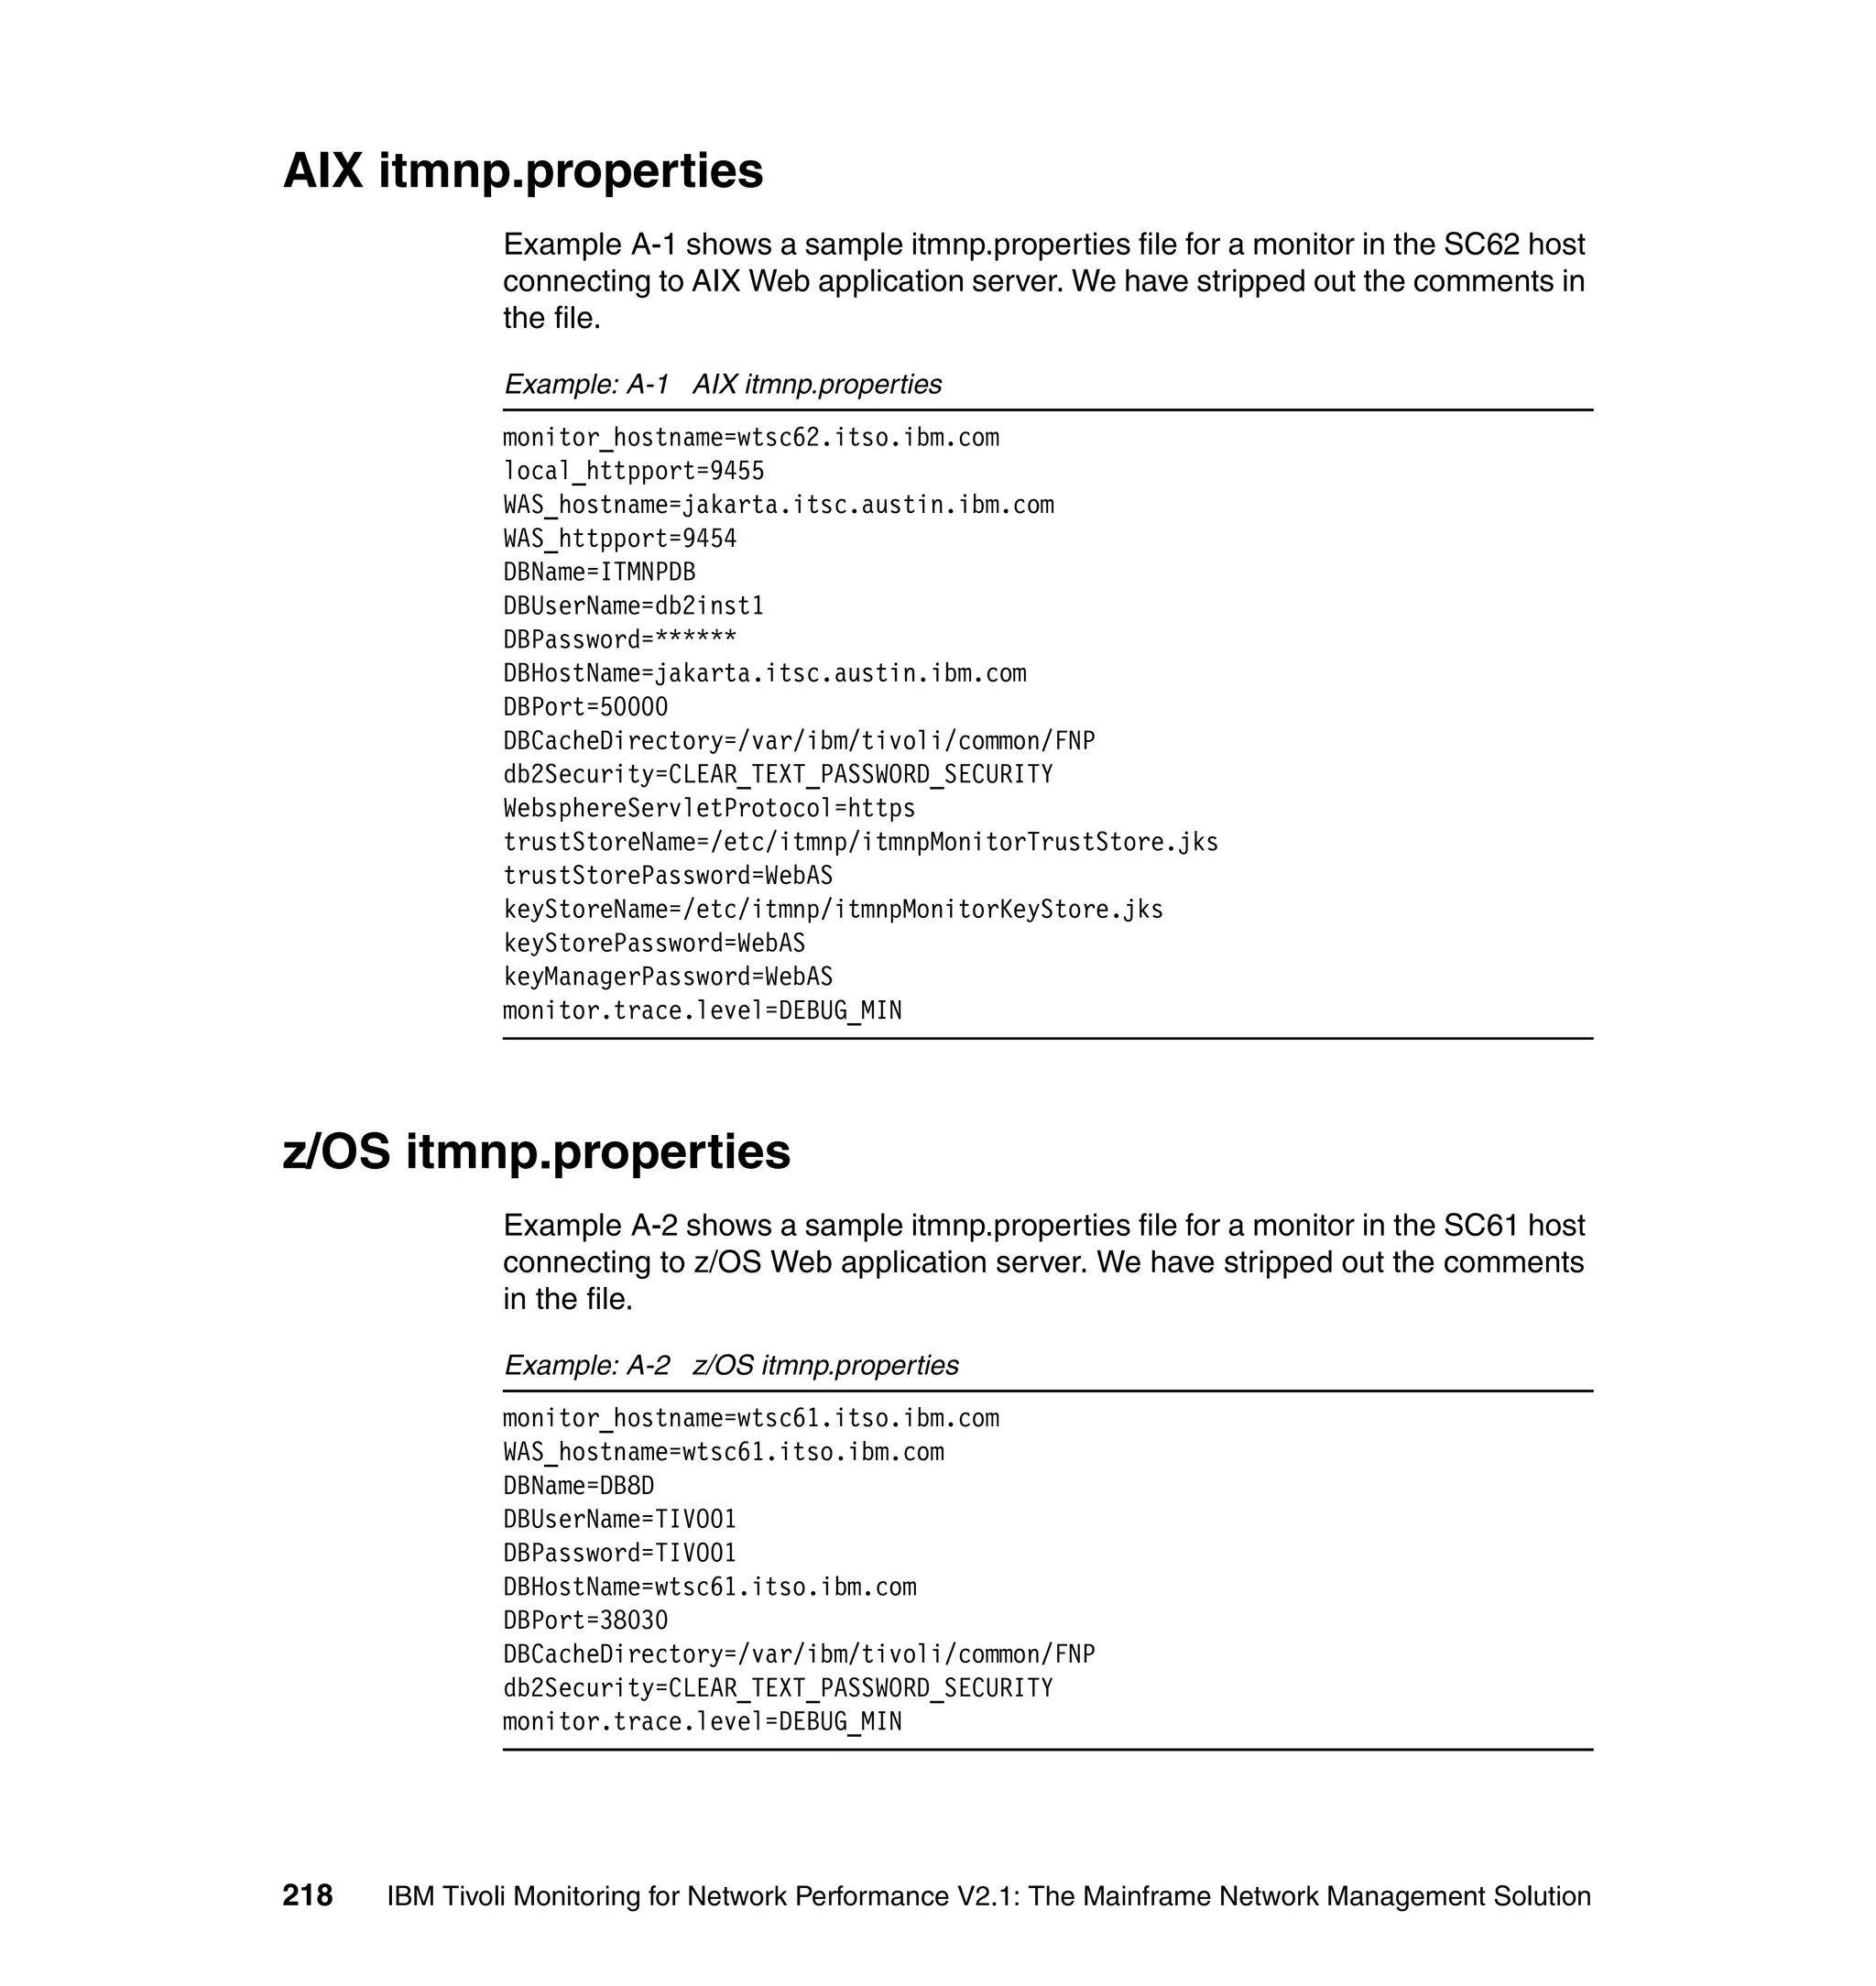
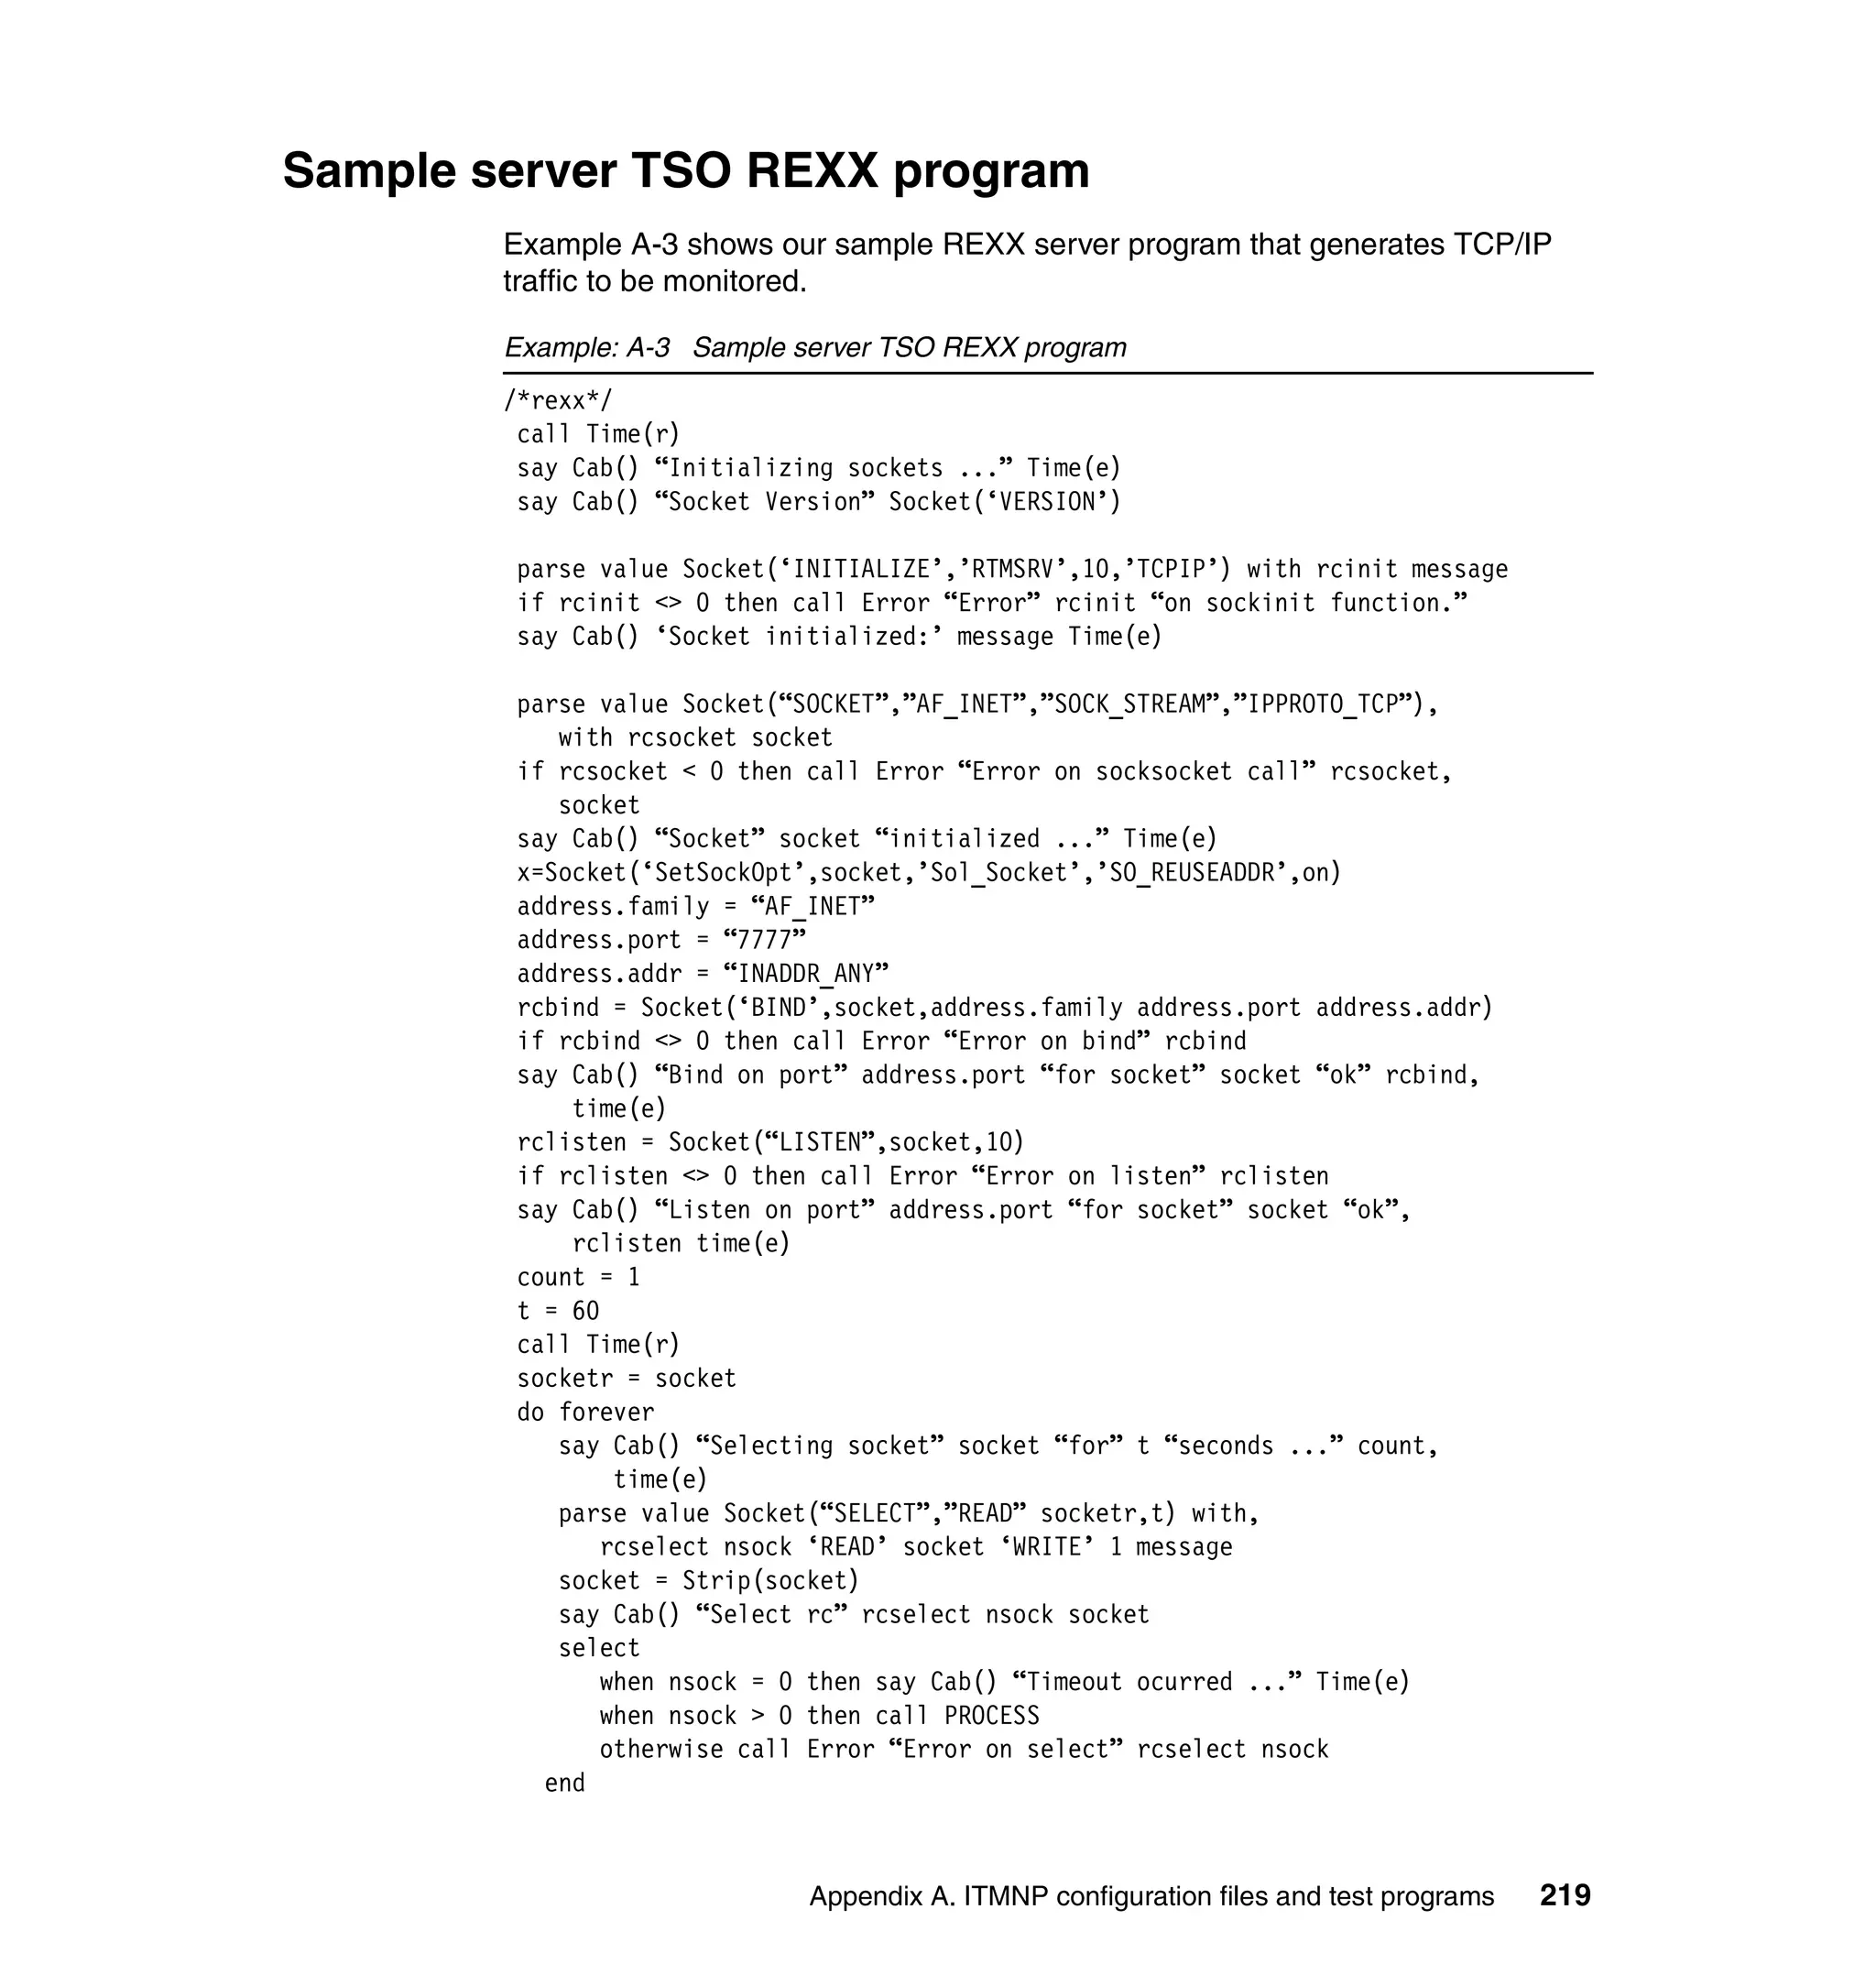
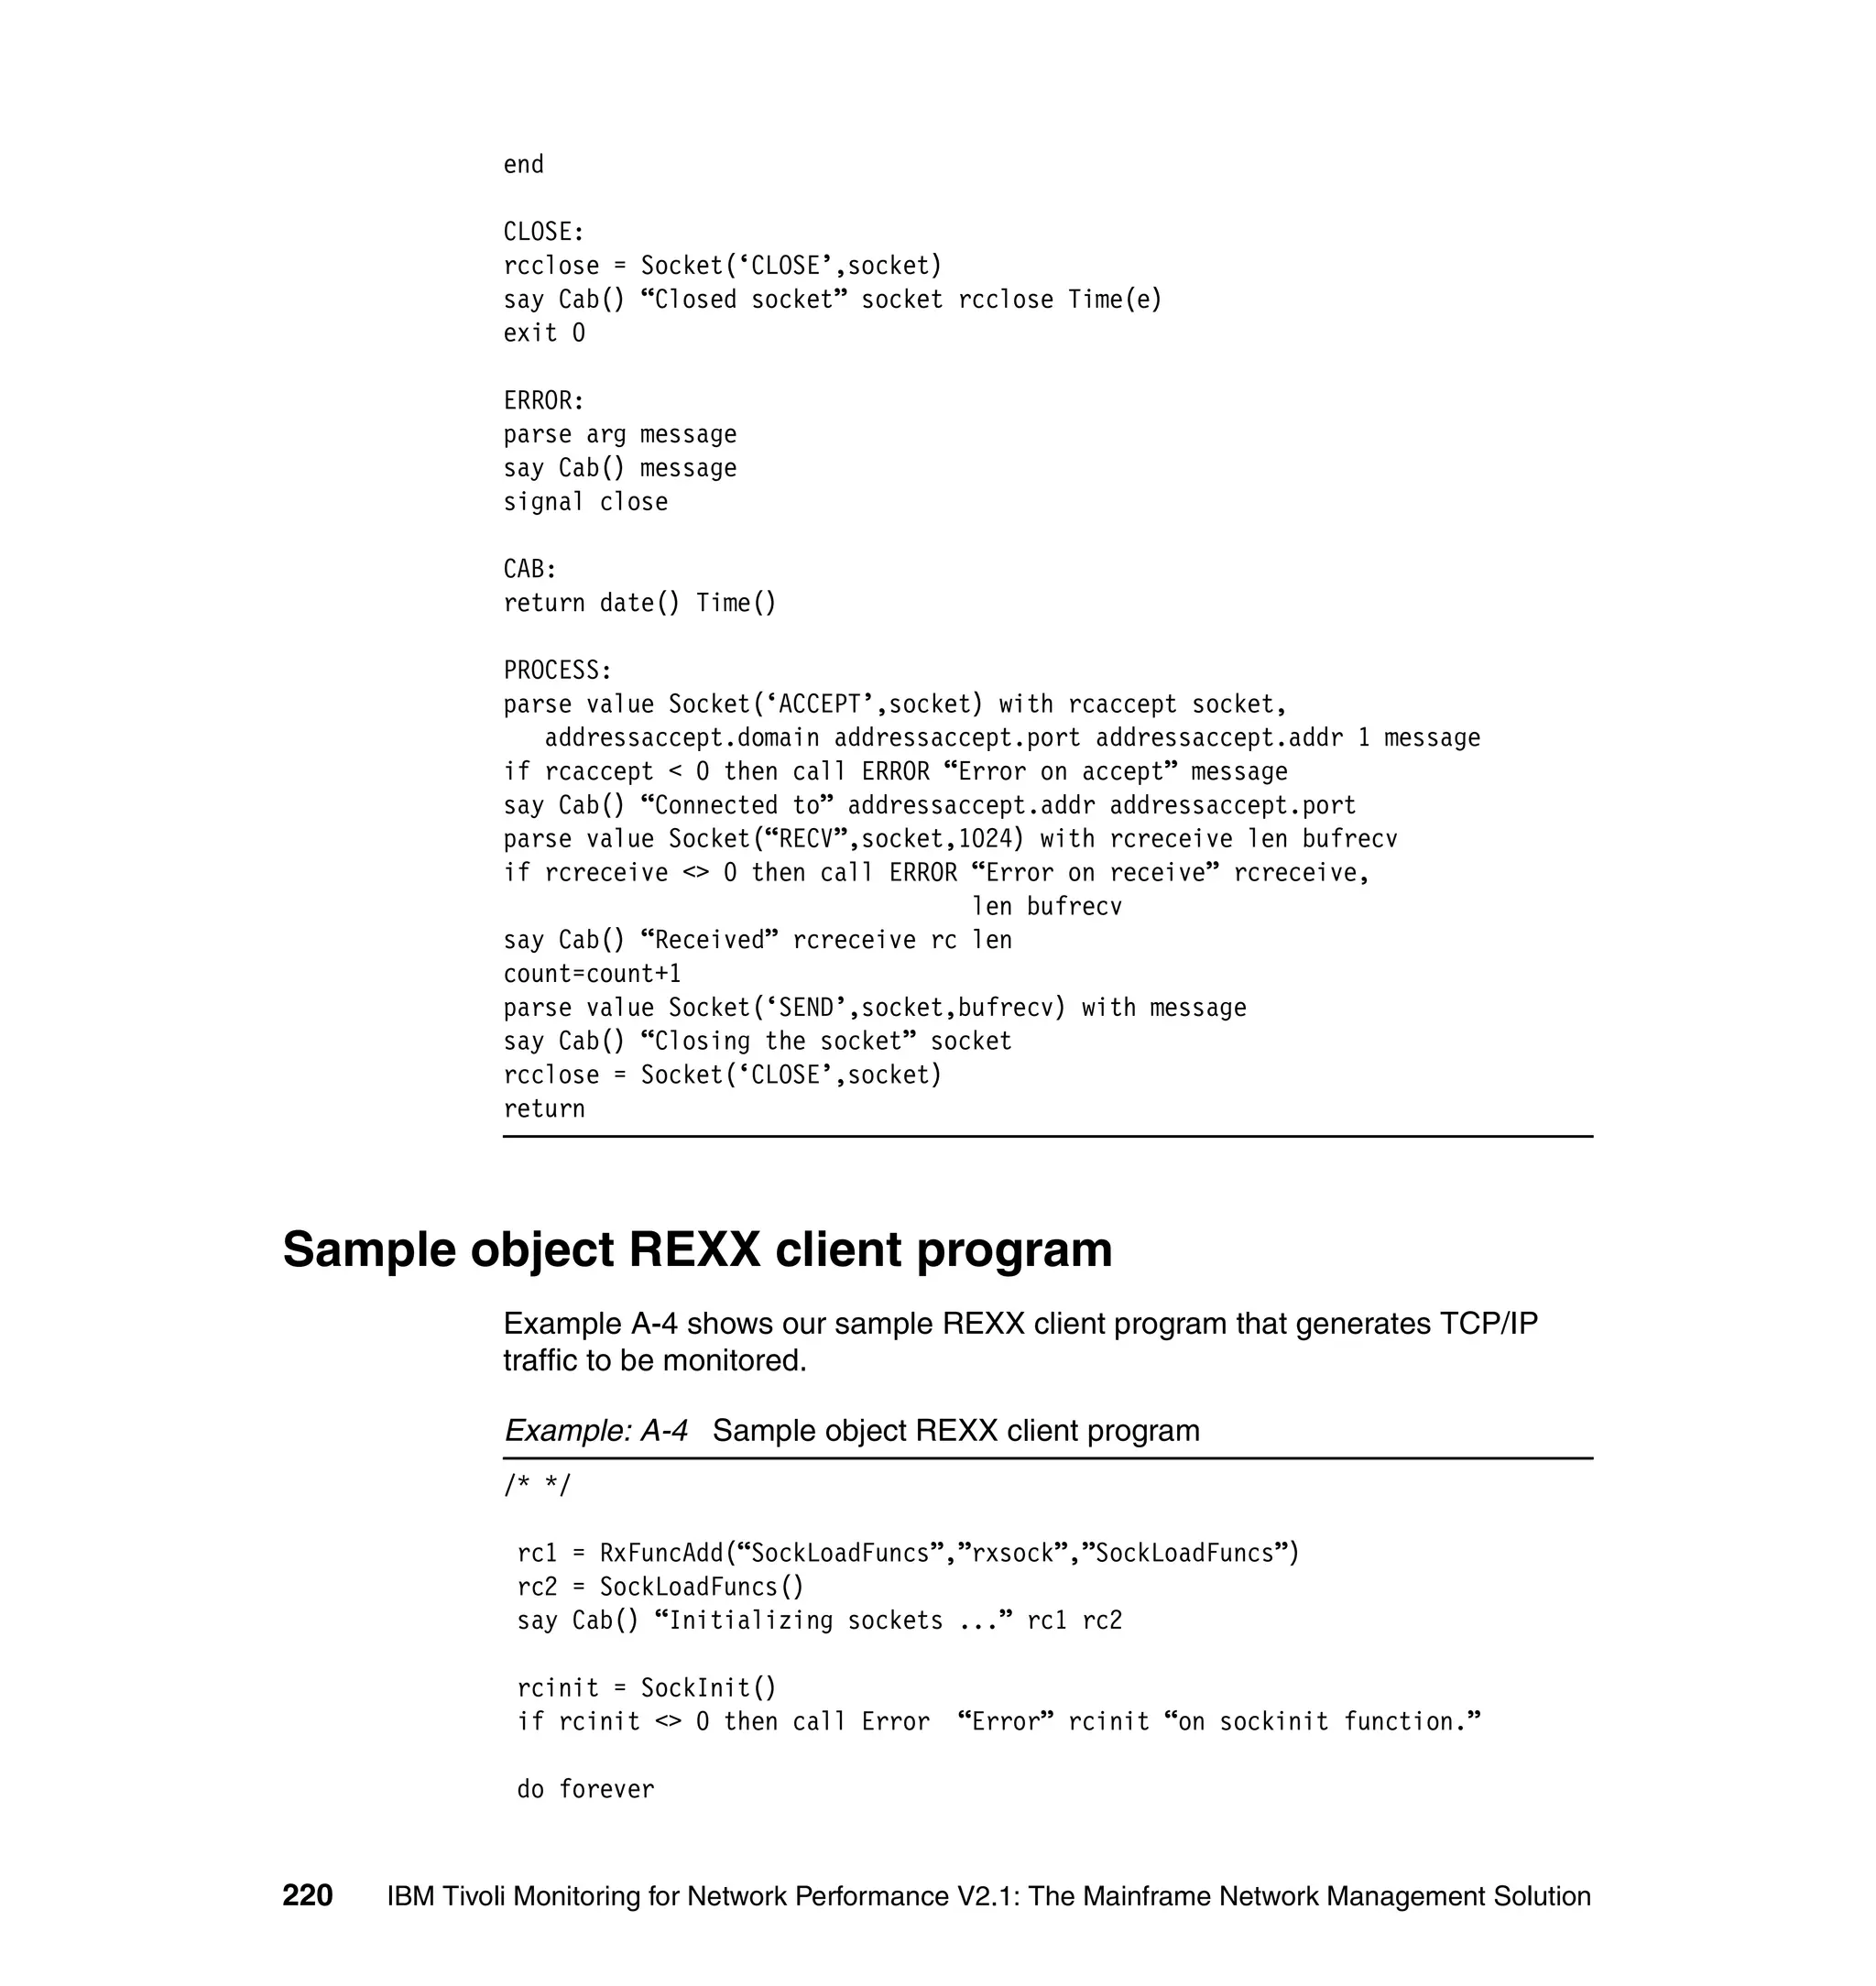
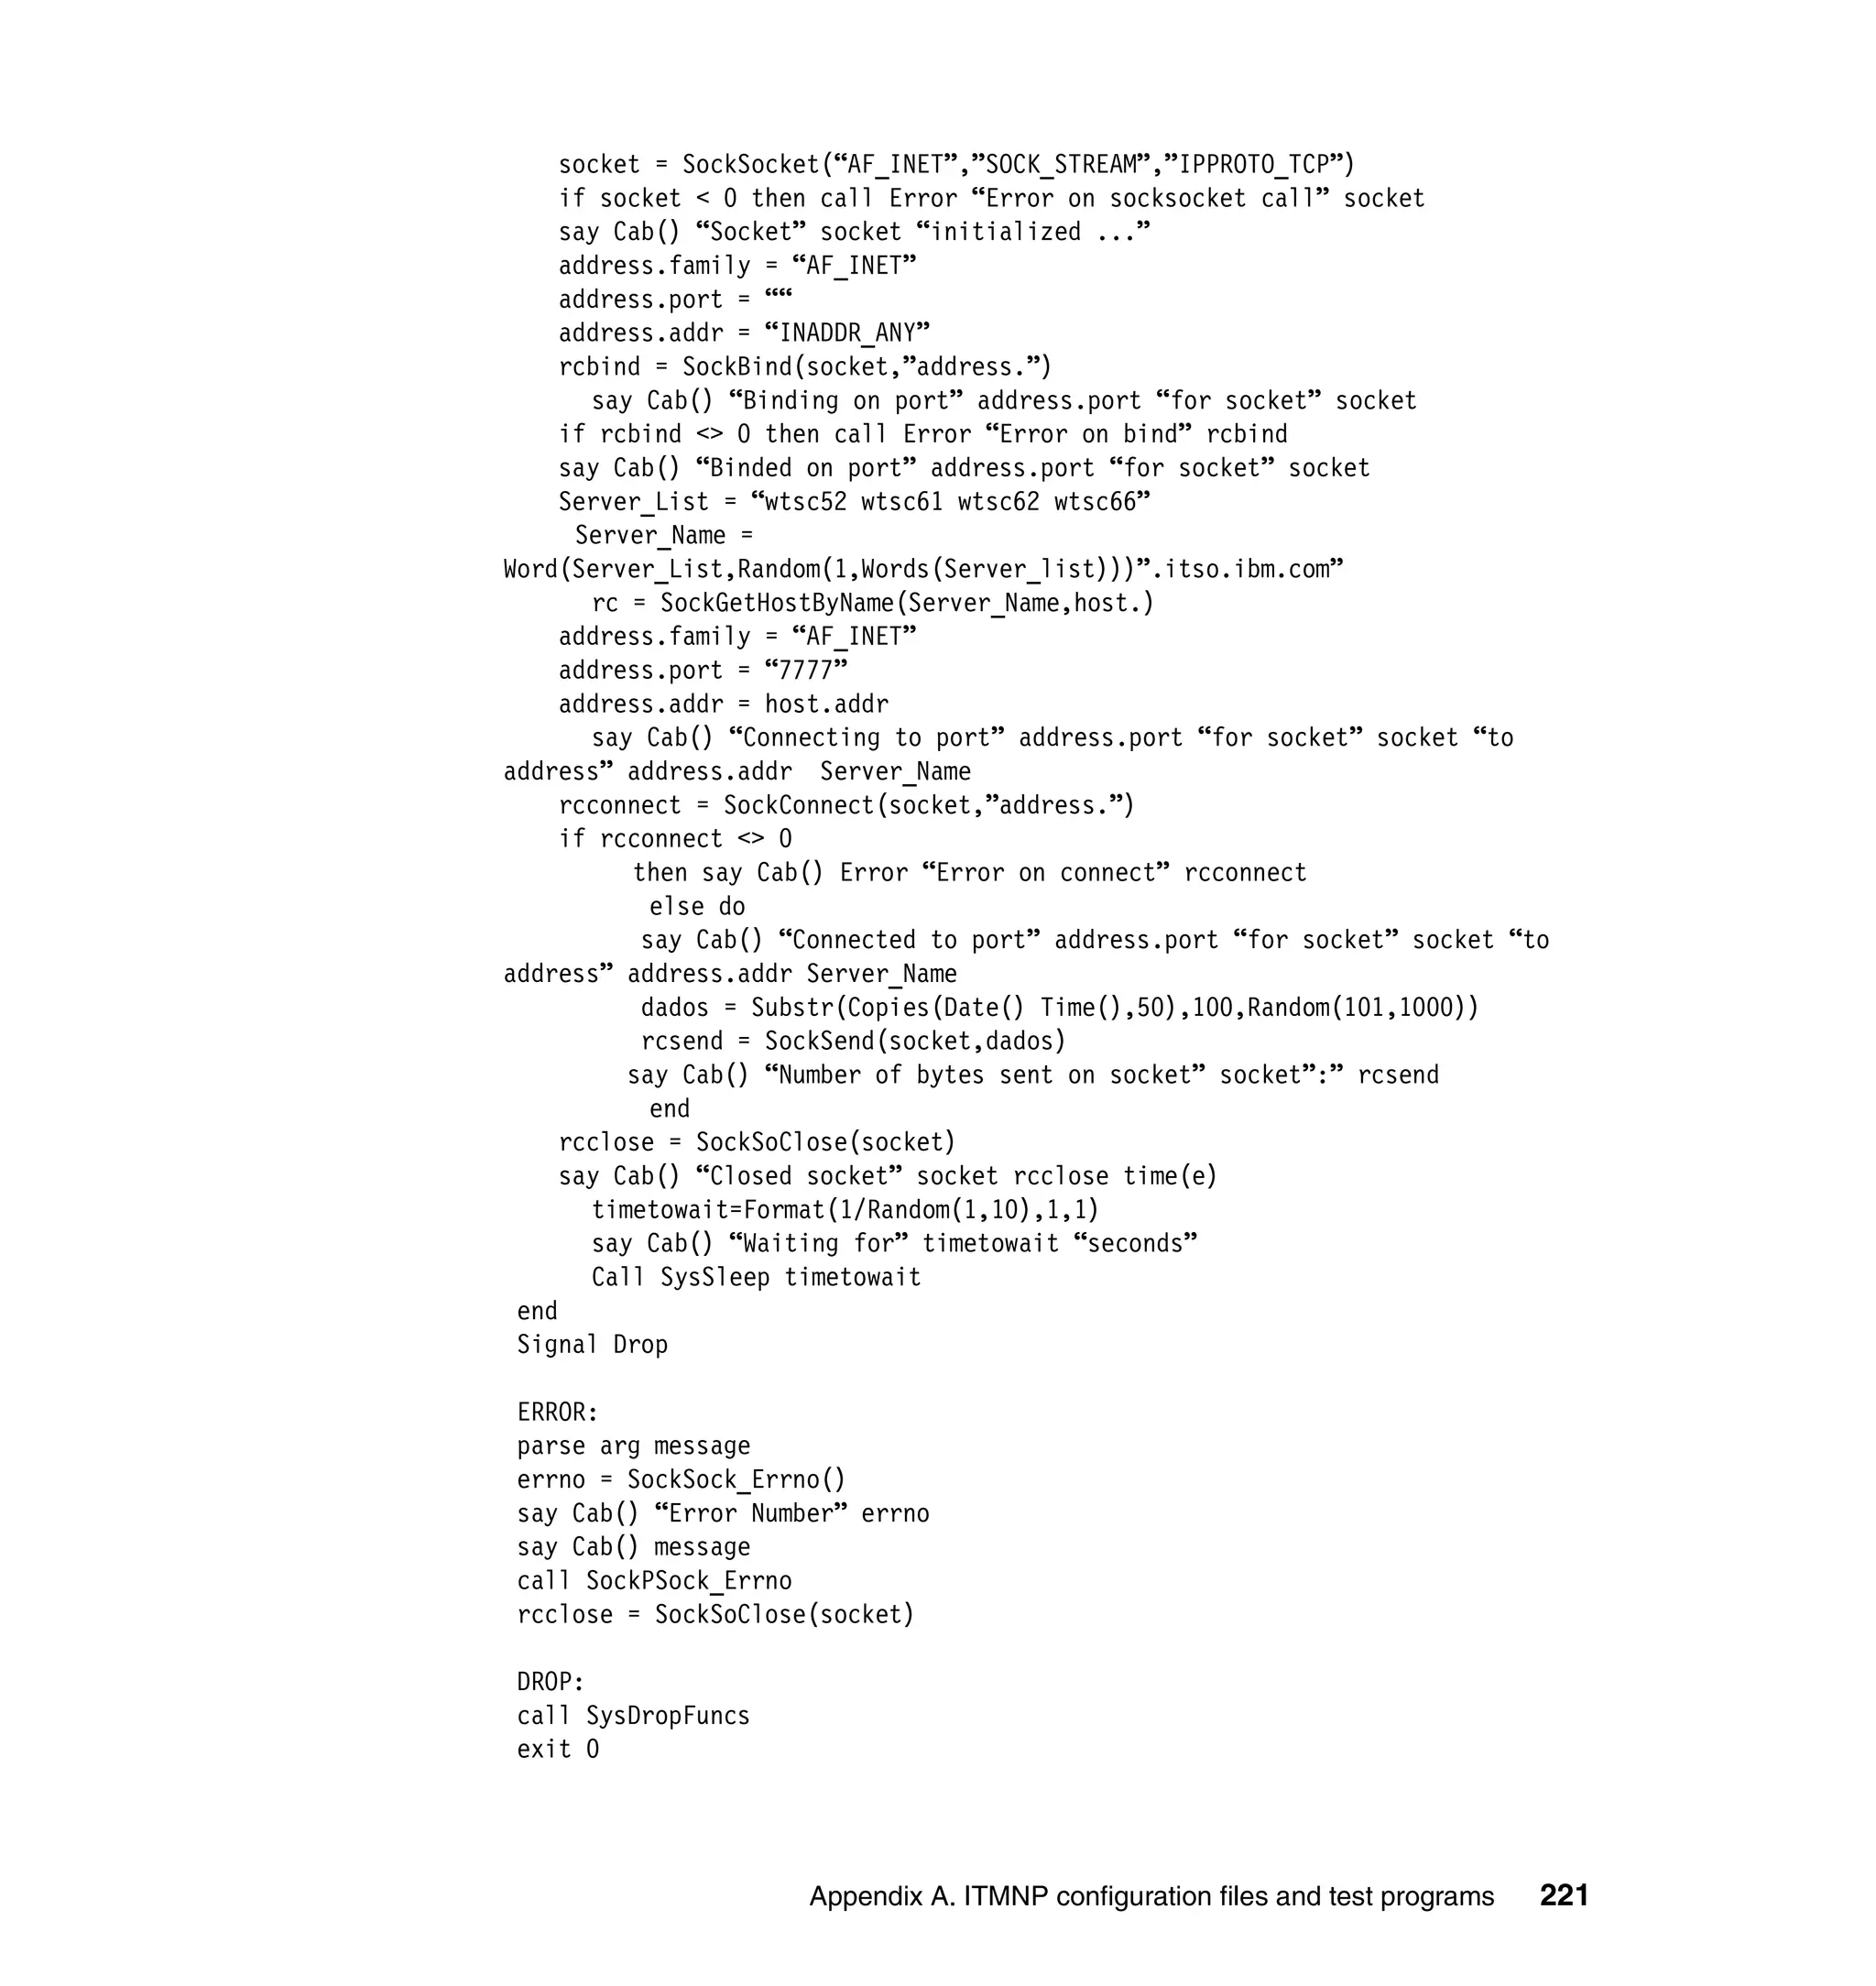
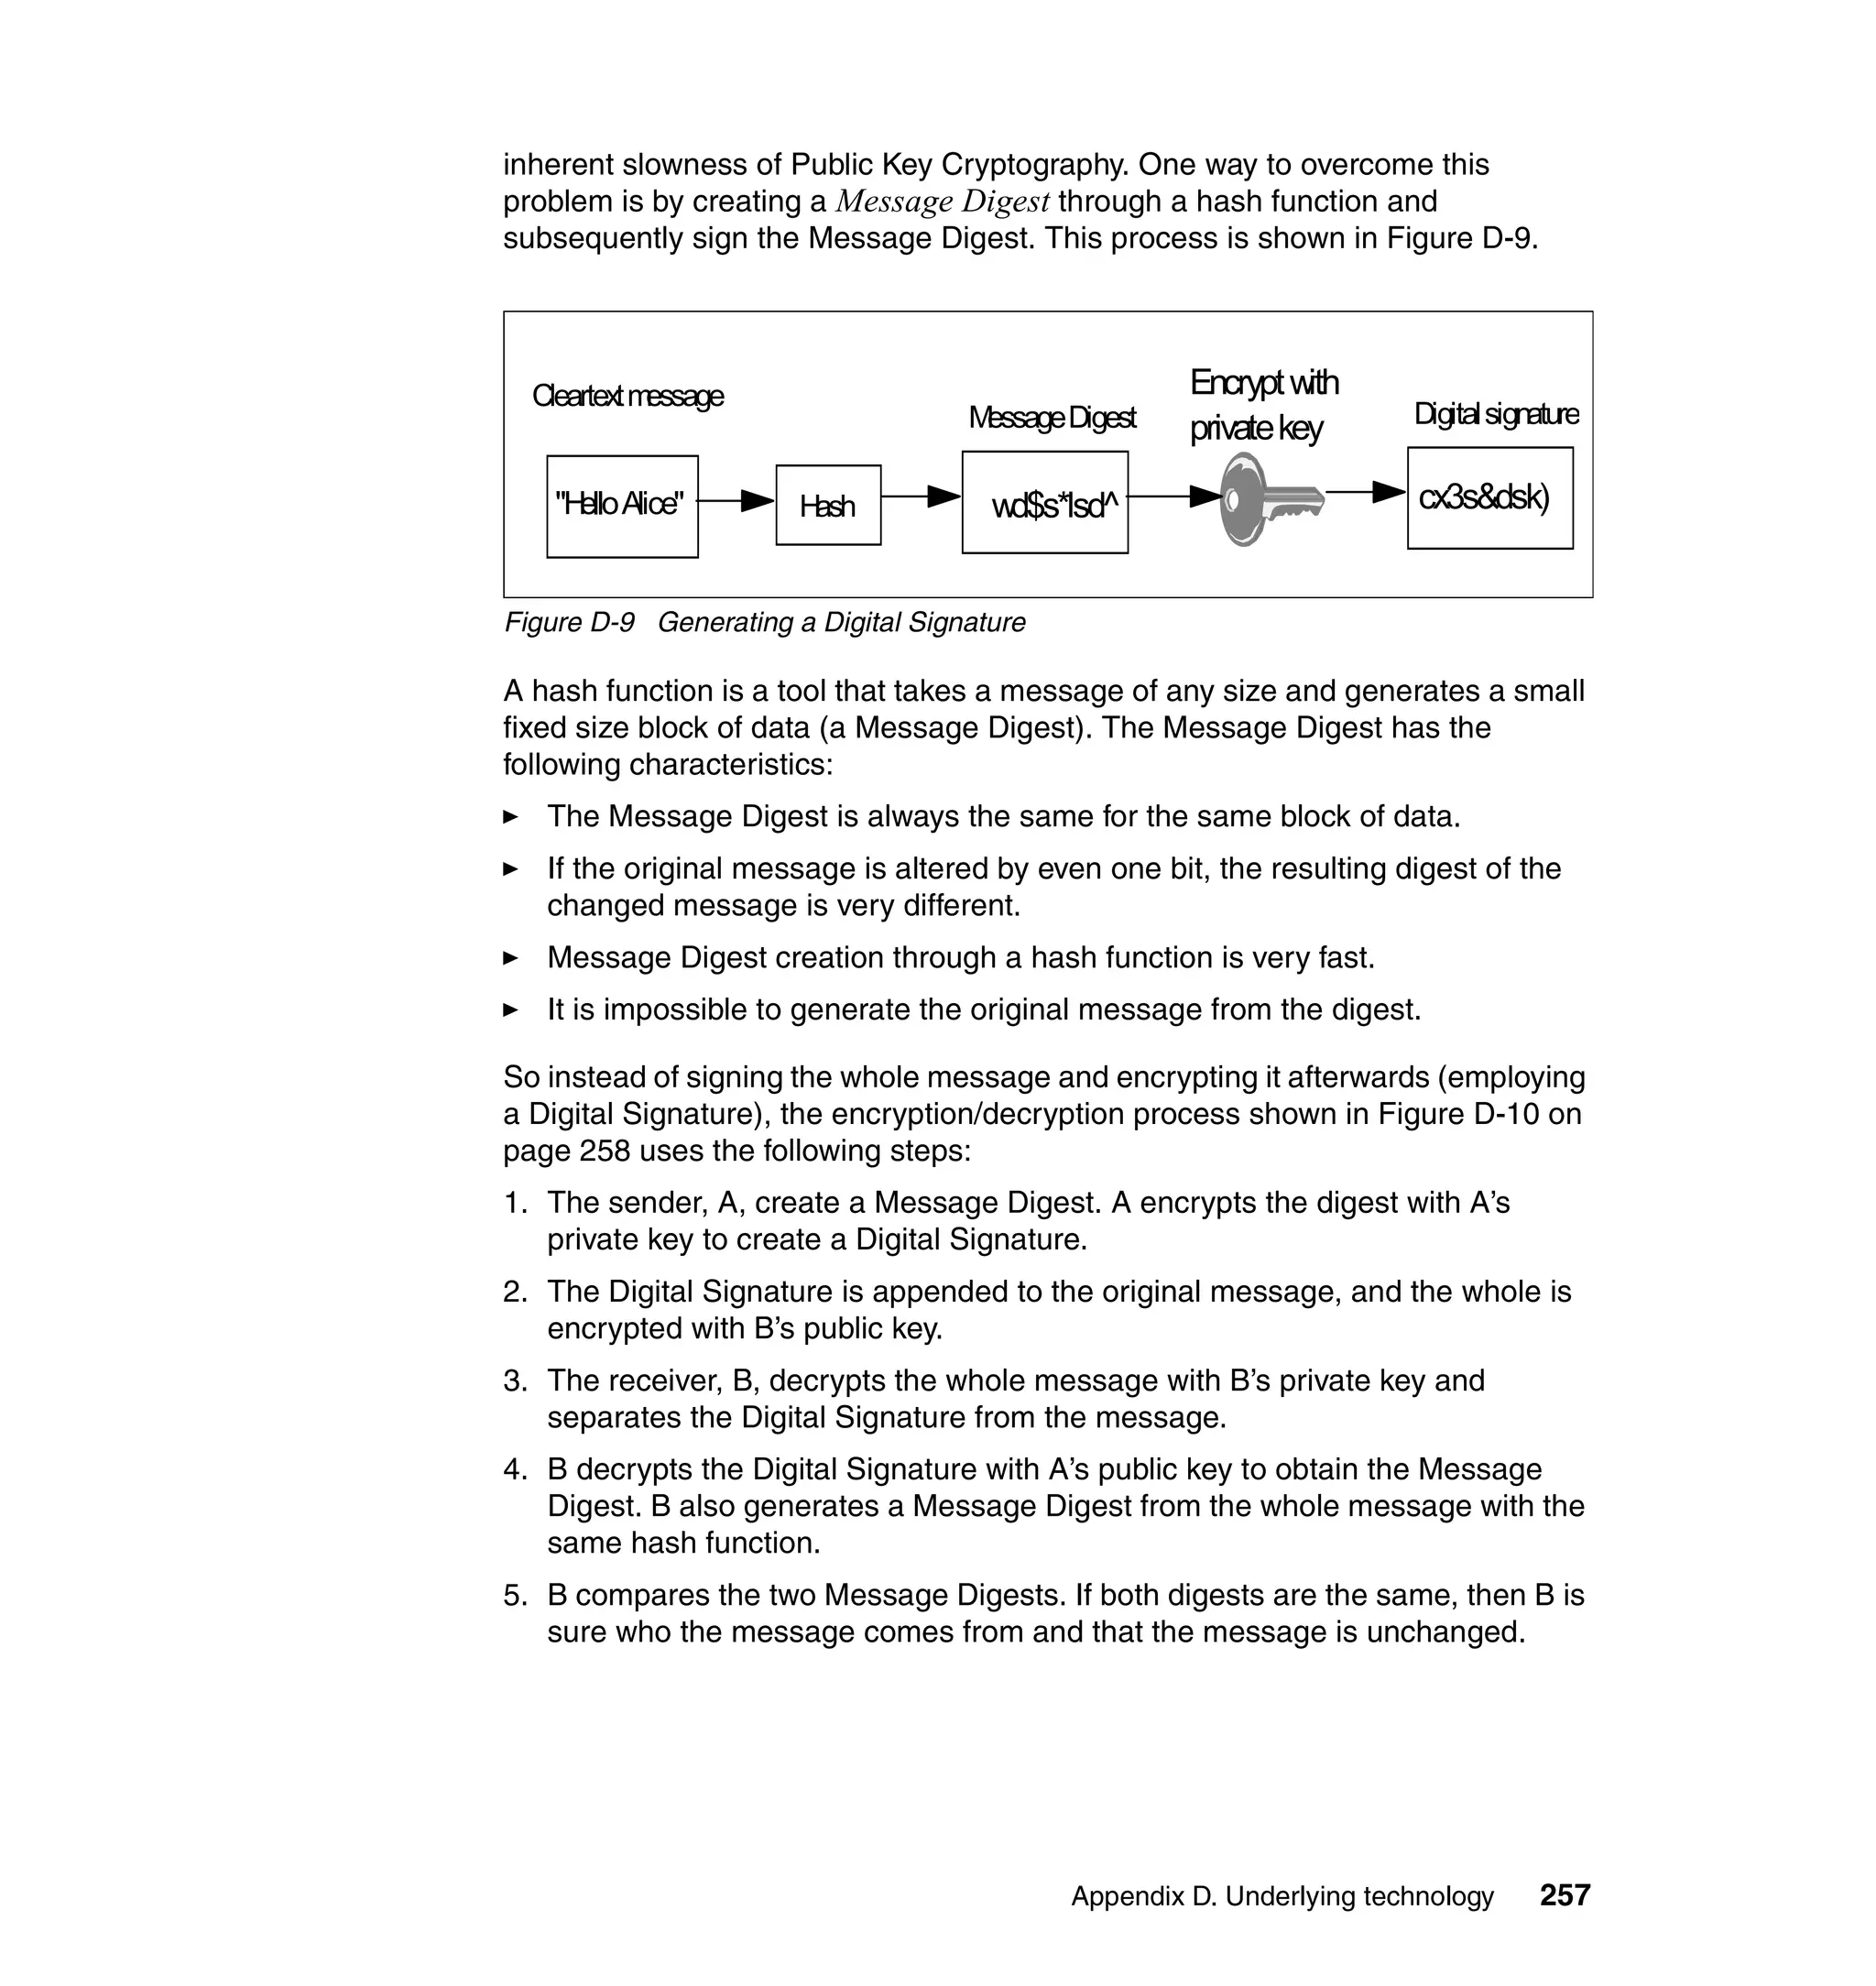
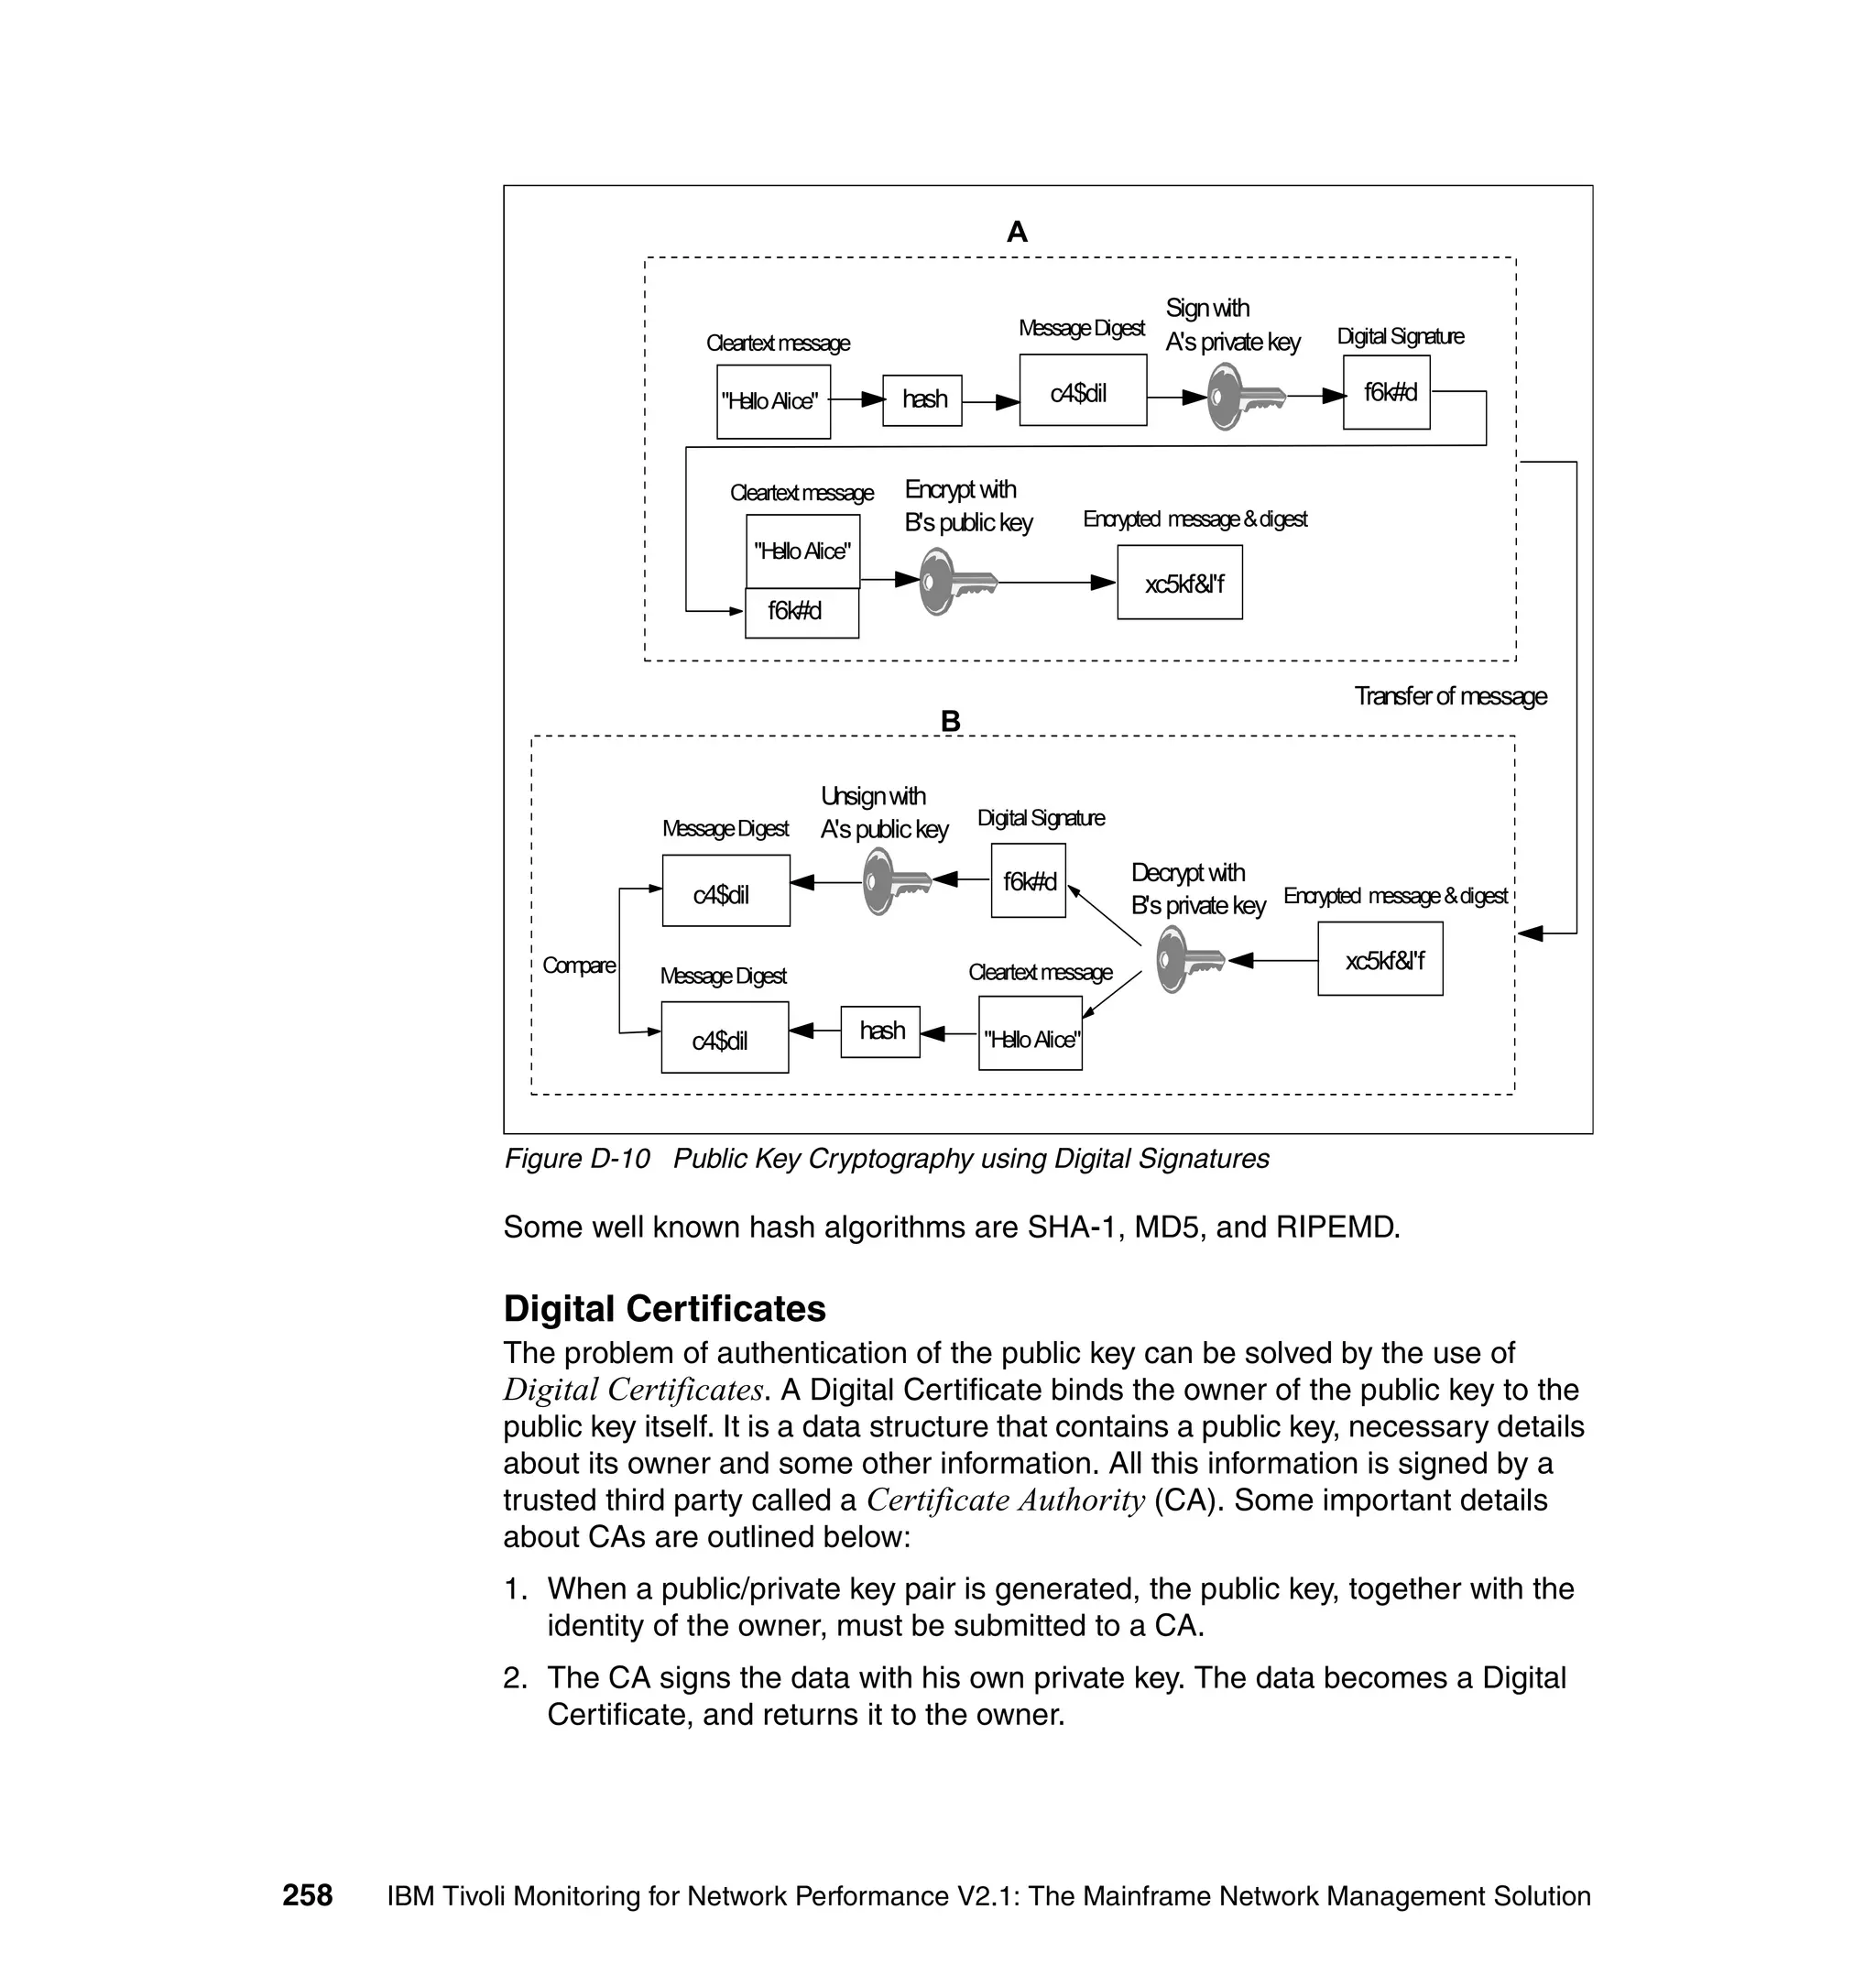
Downloaded 19 times


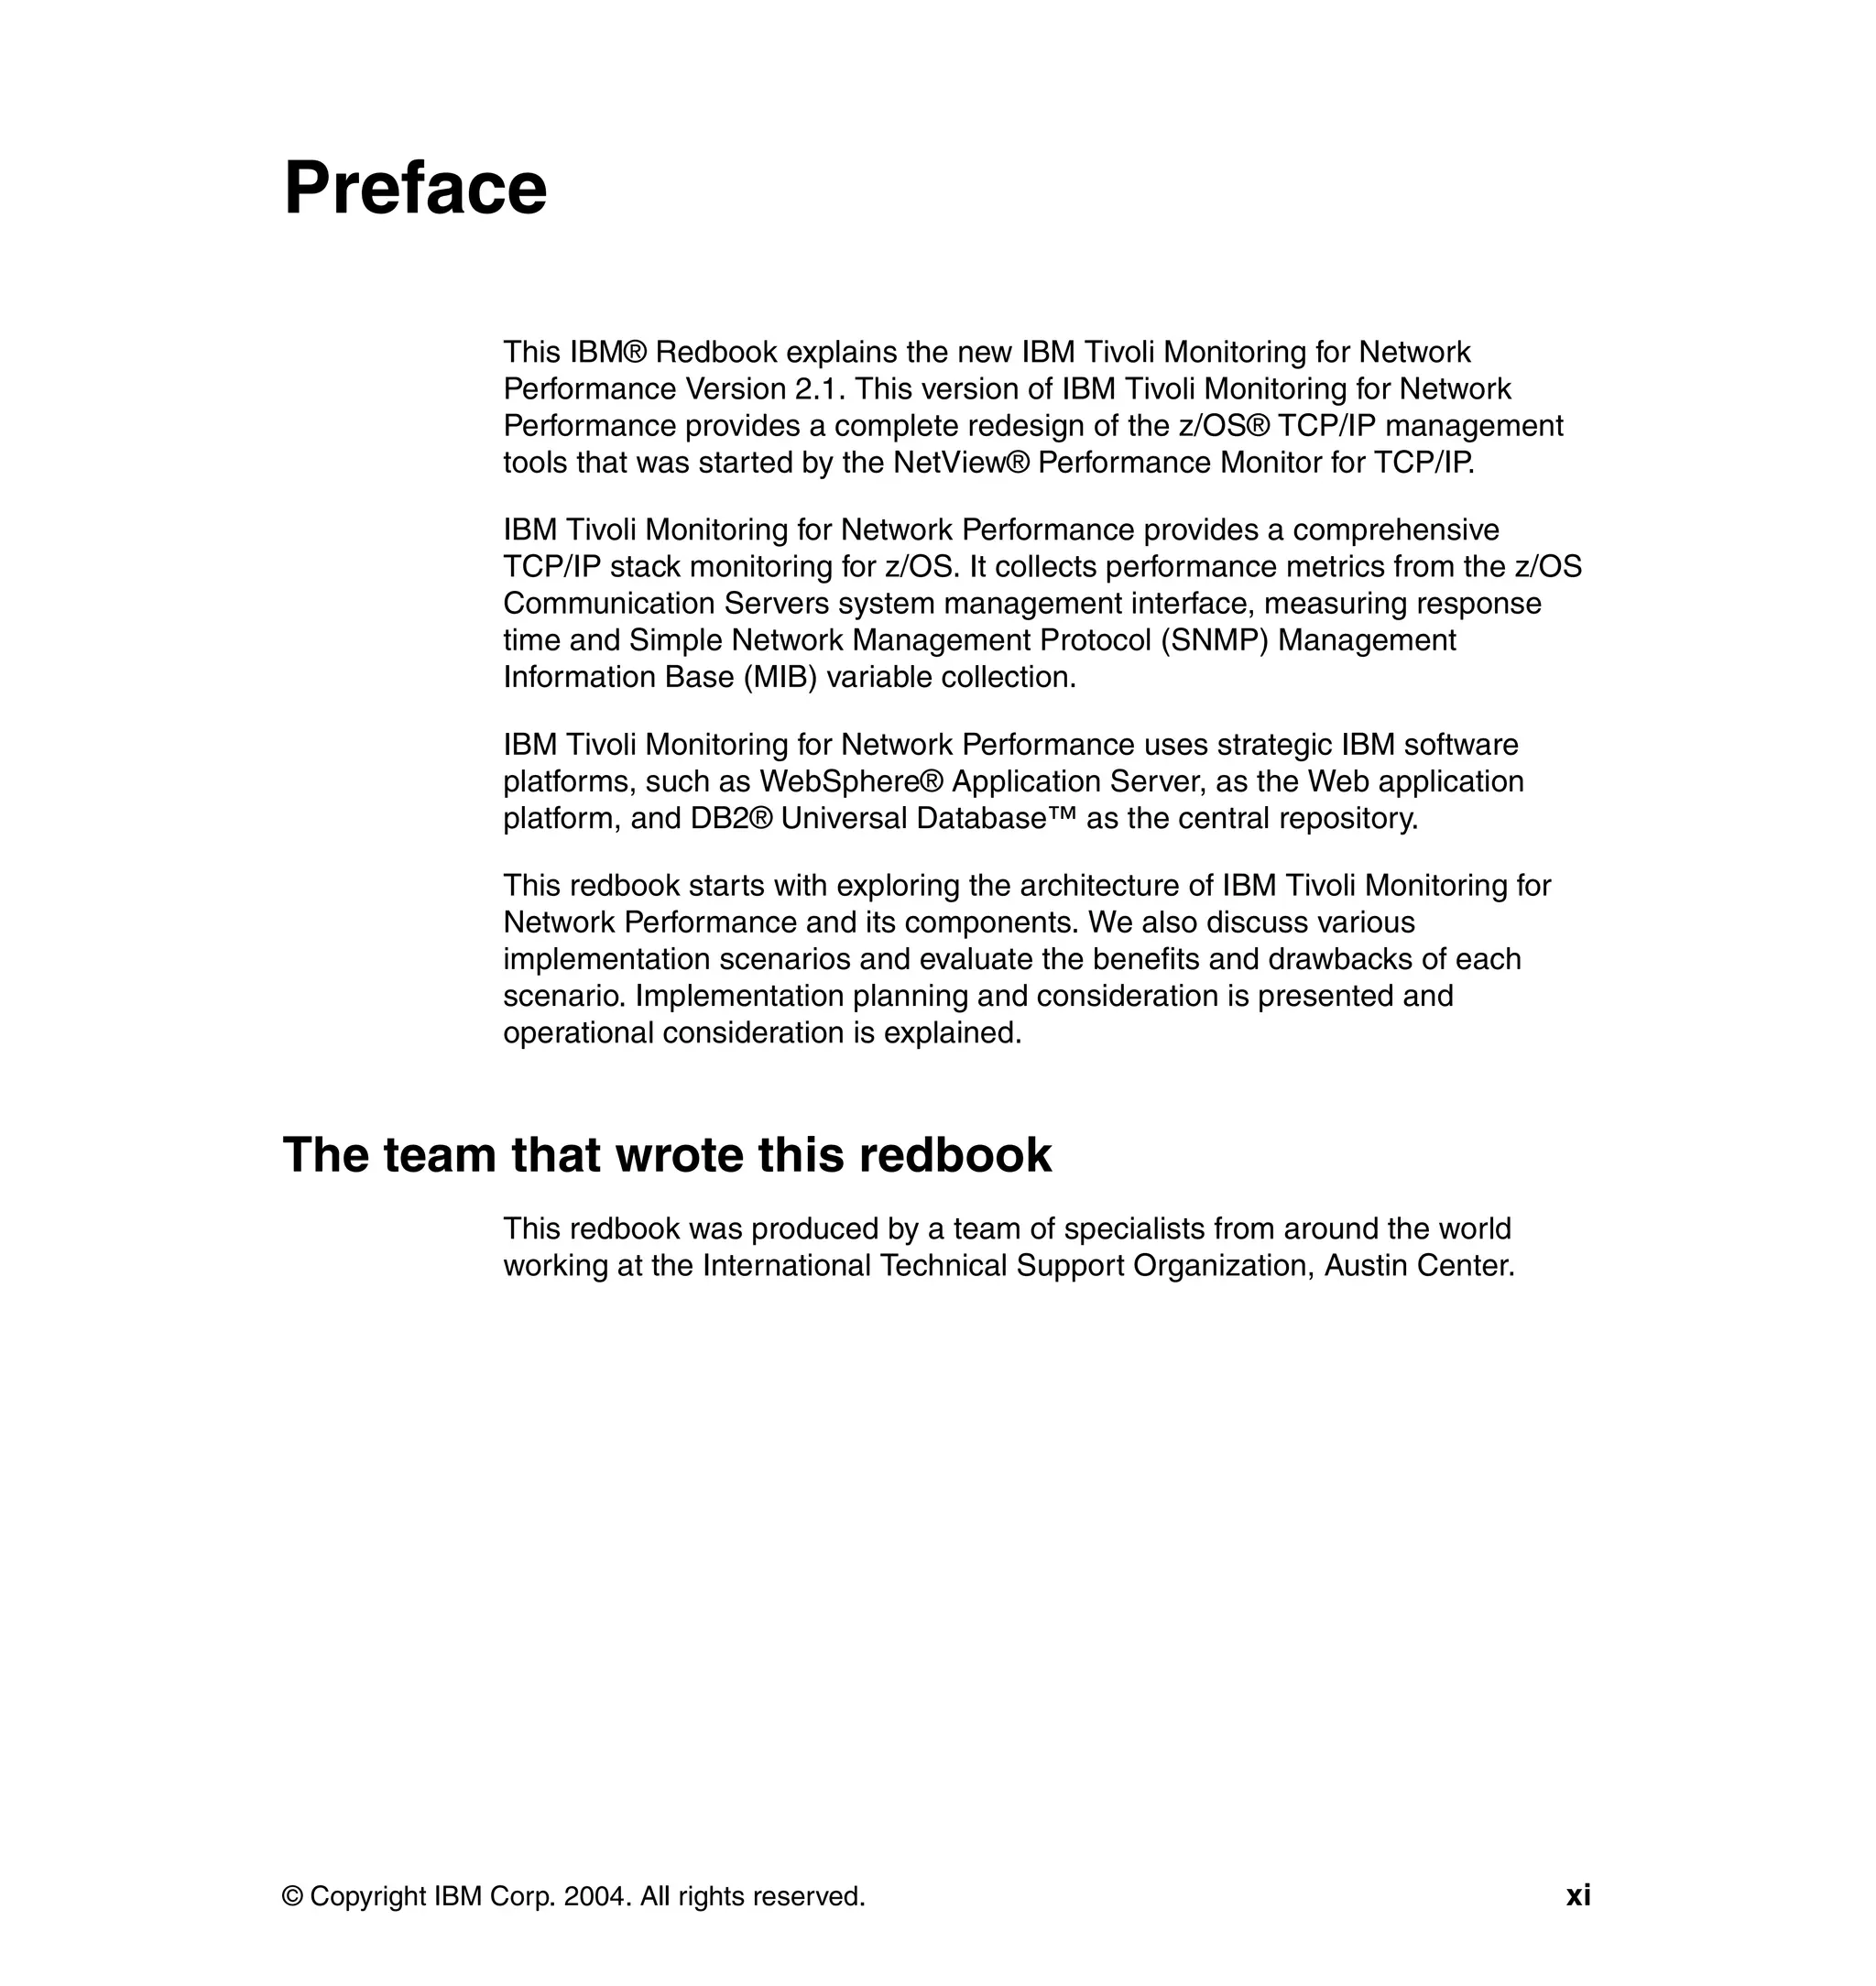
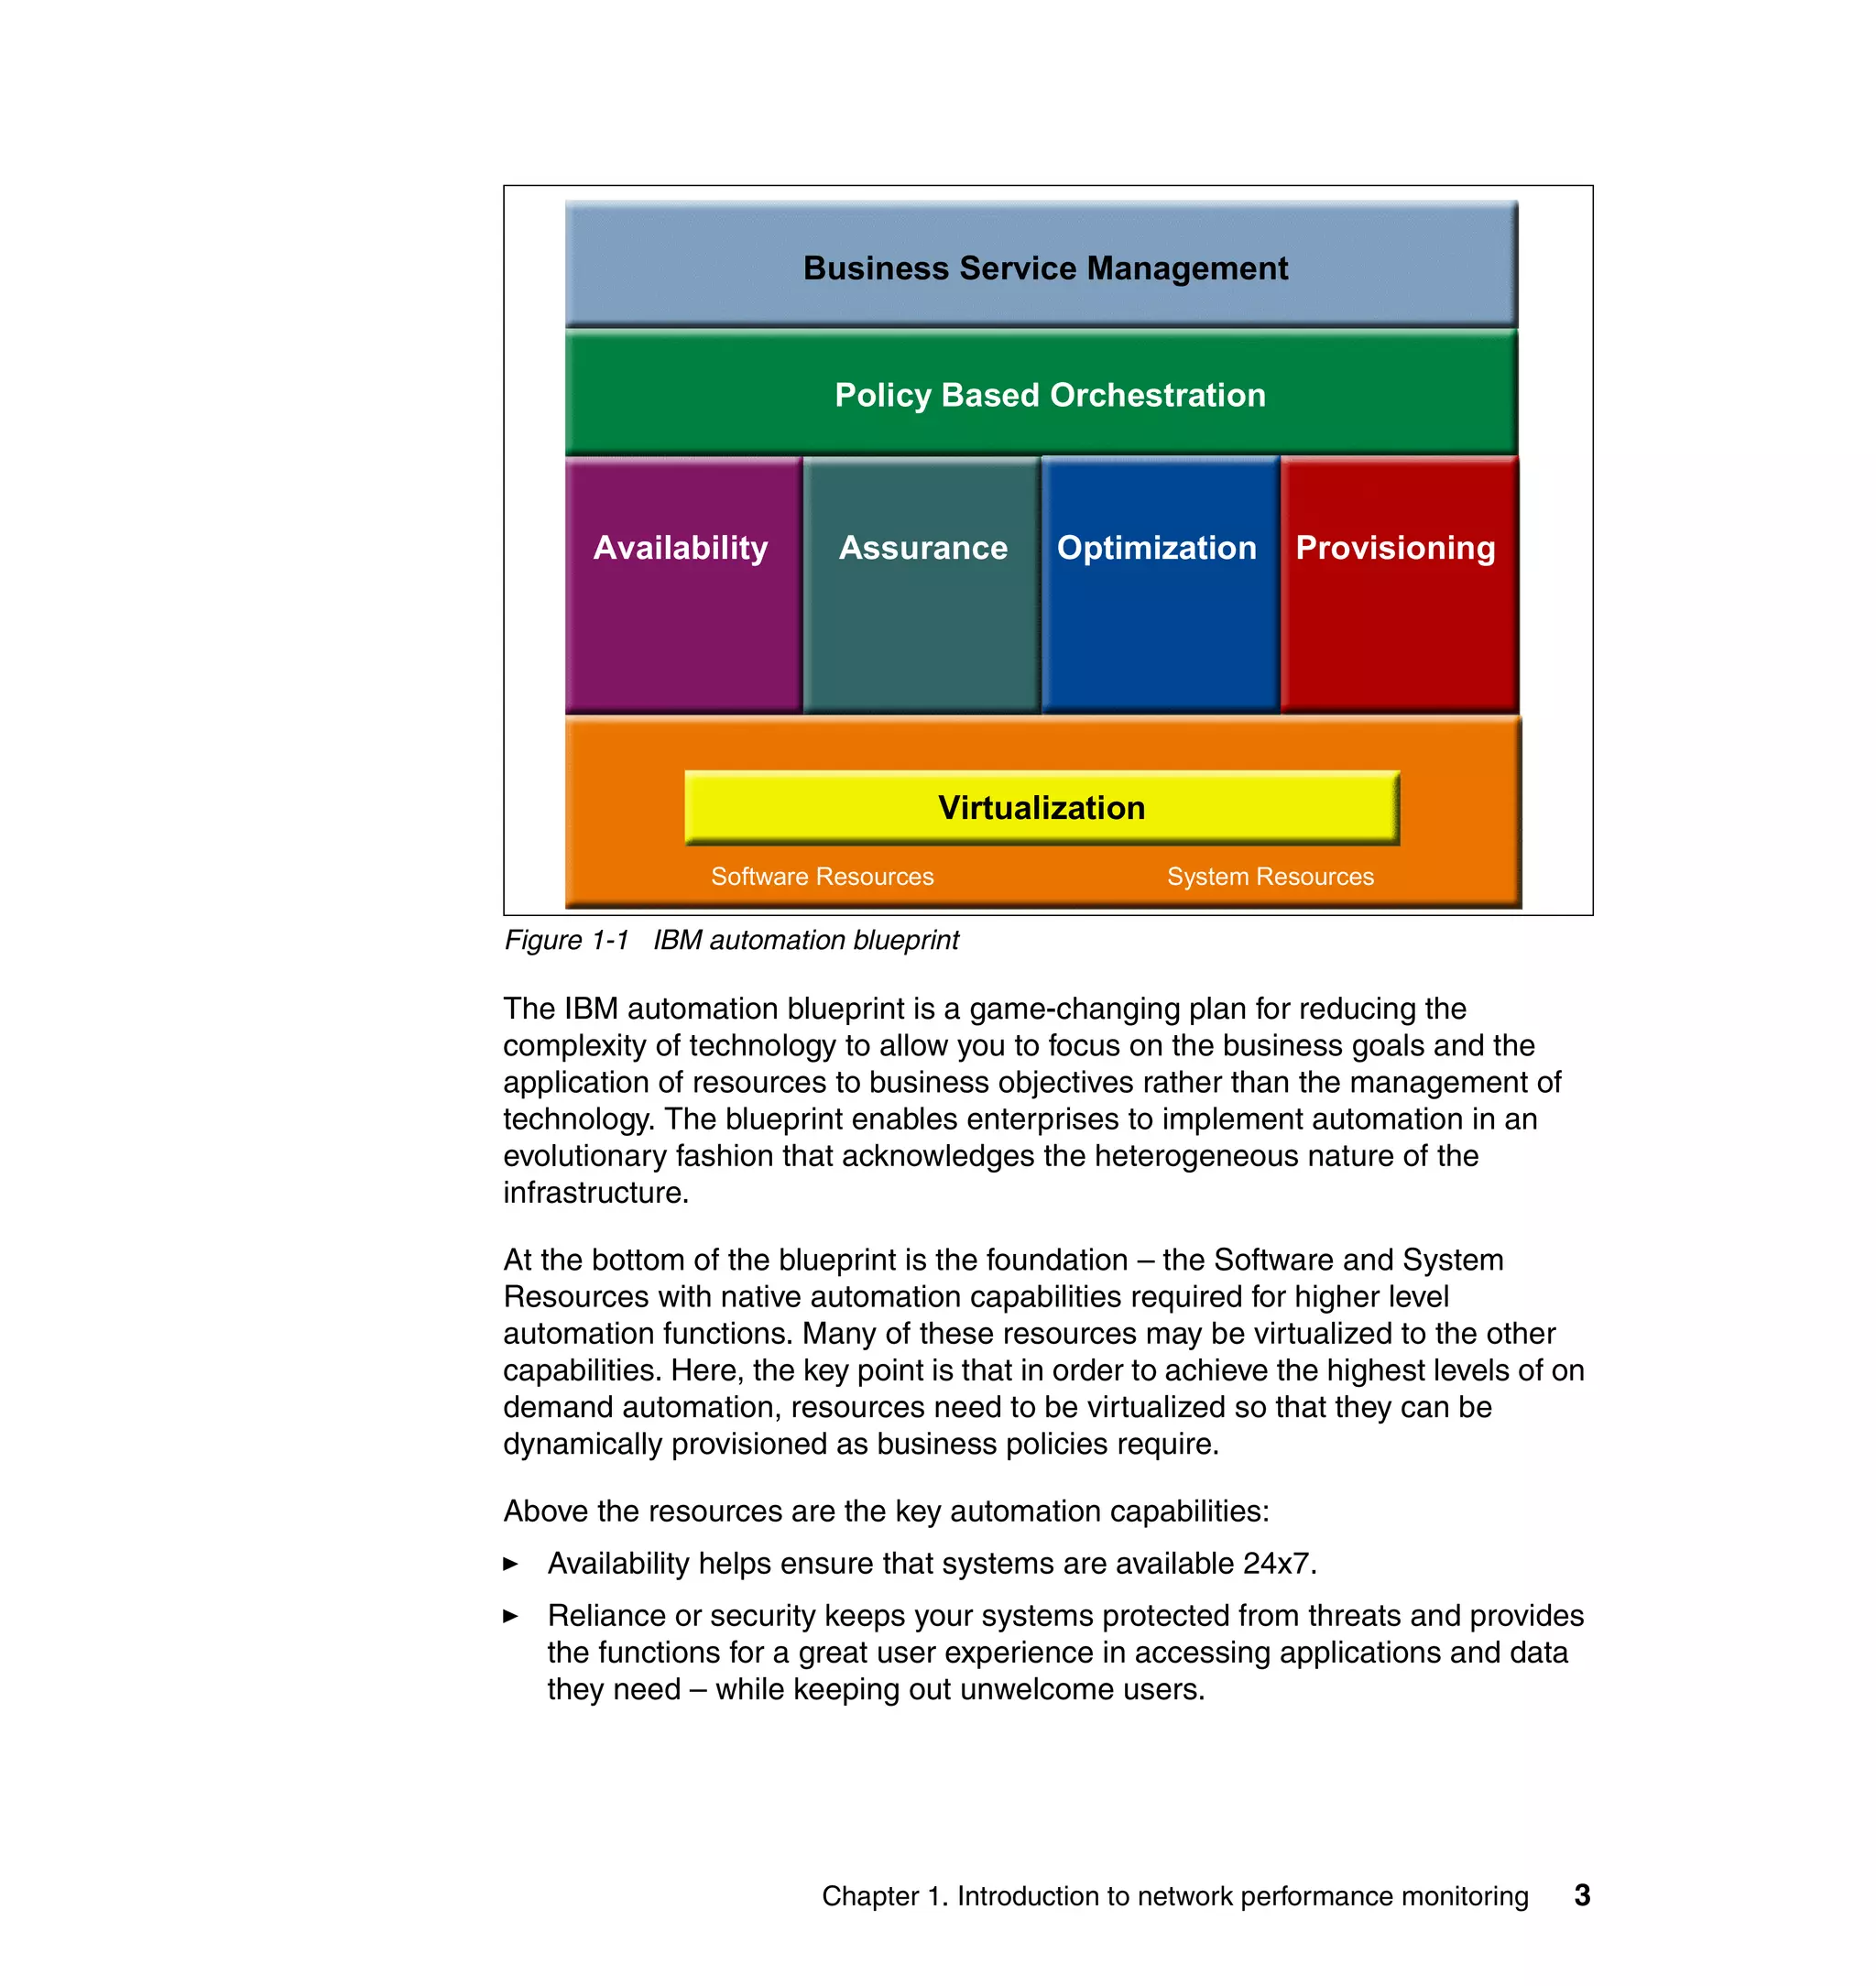
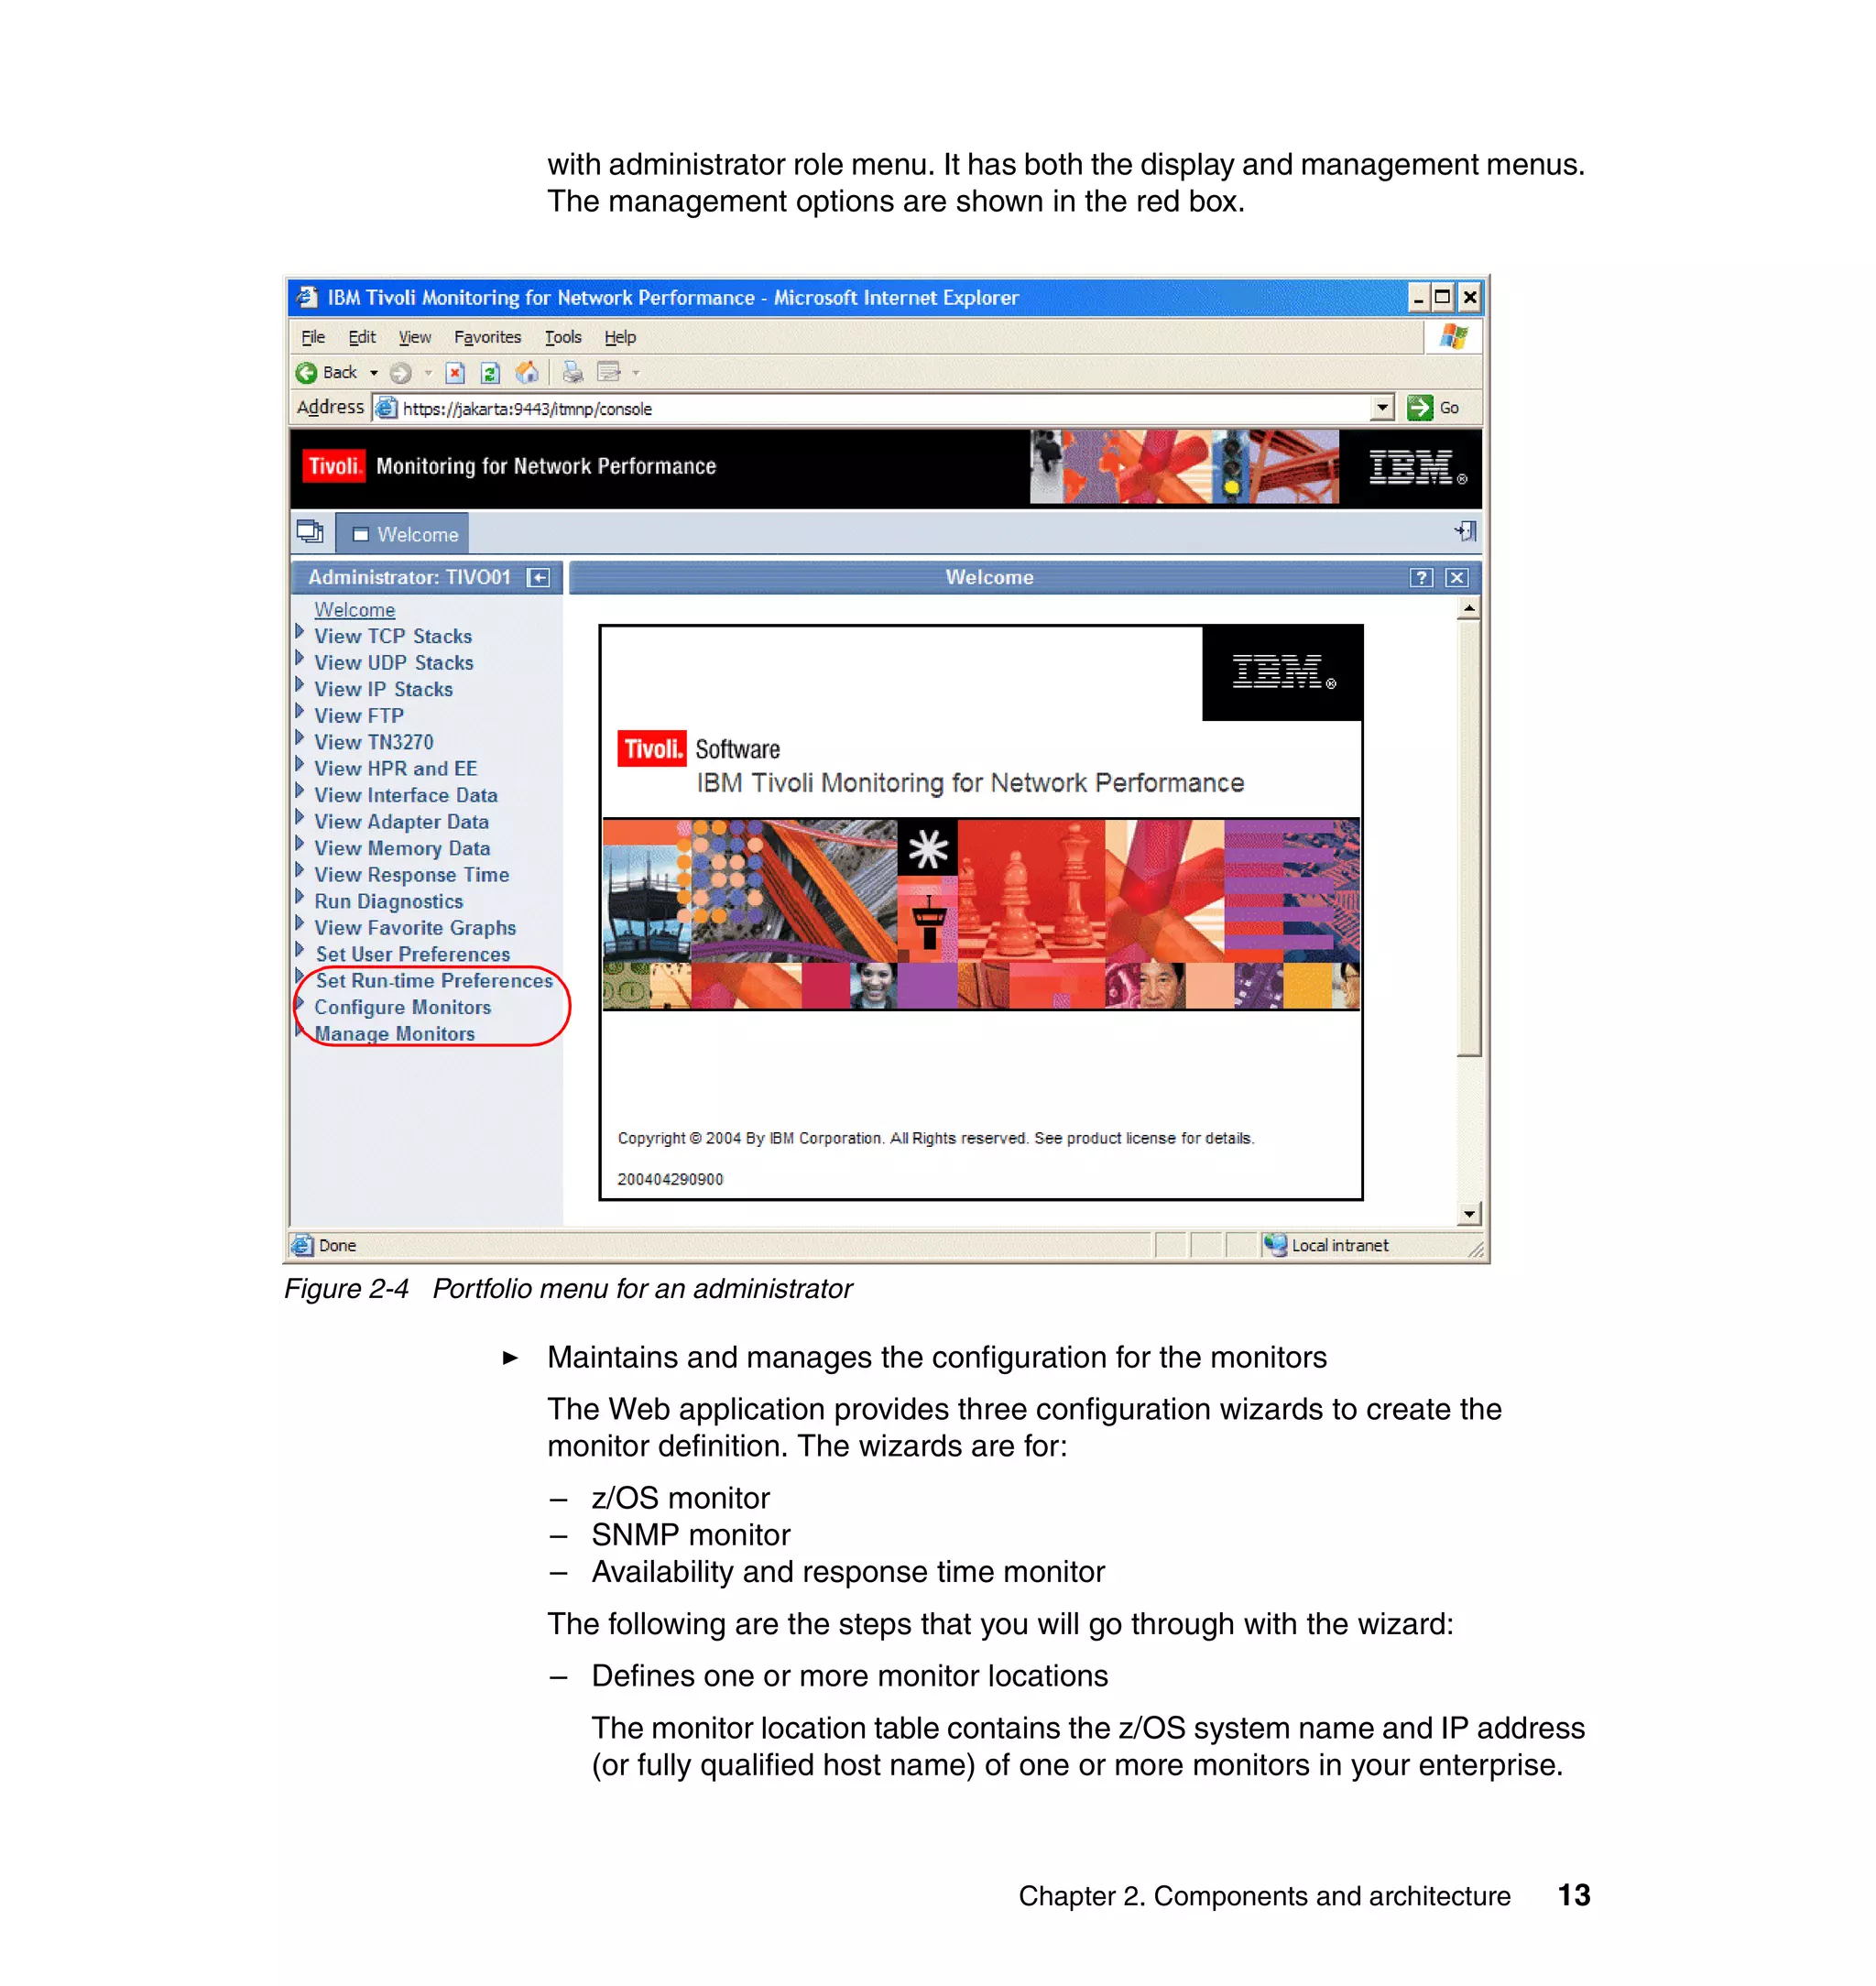

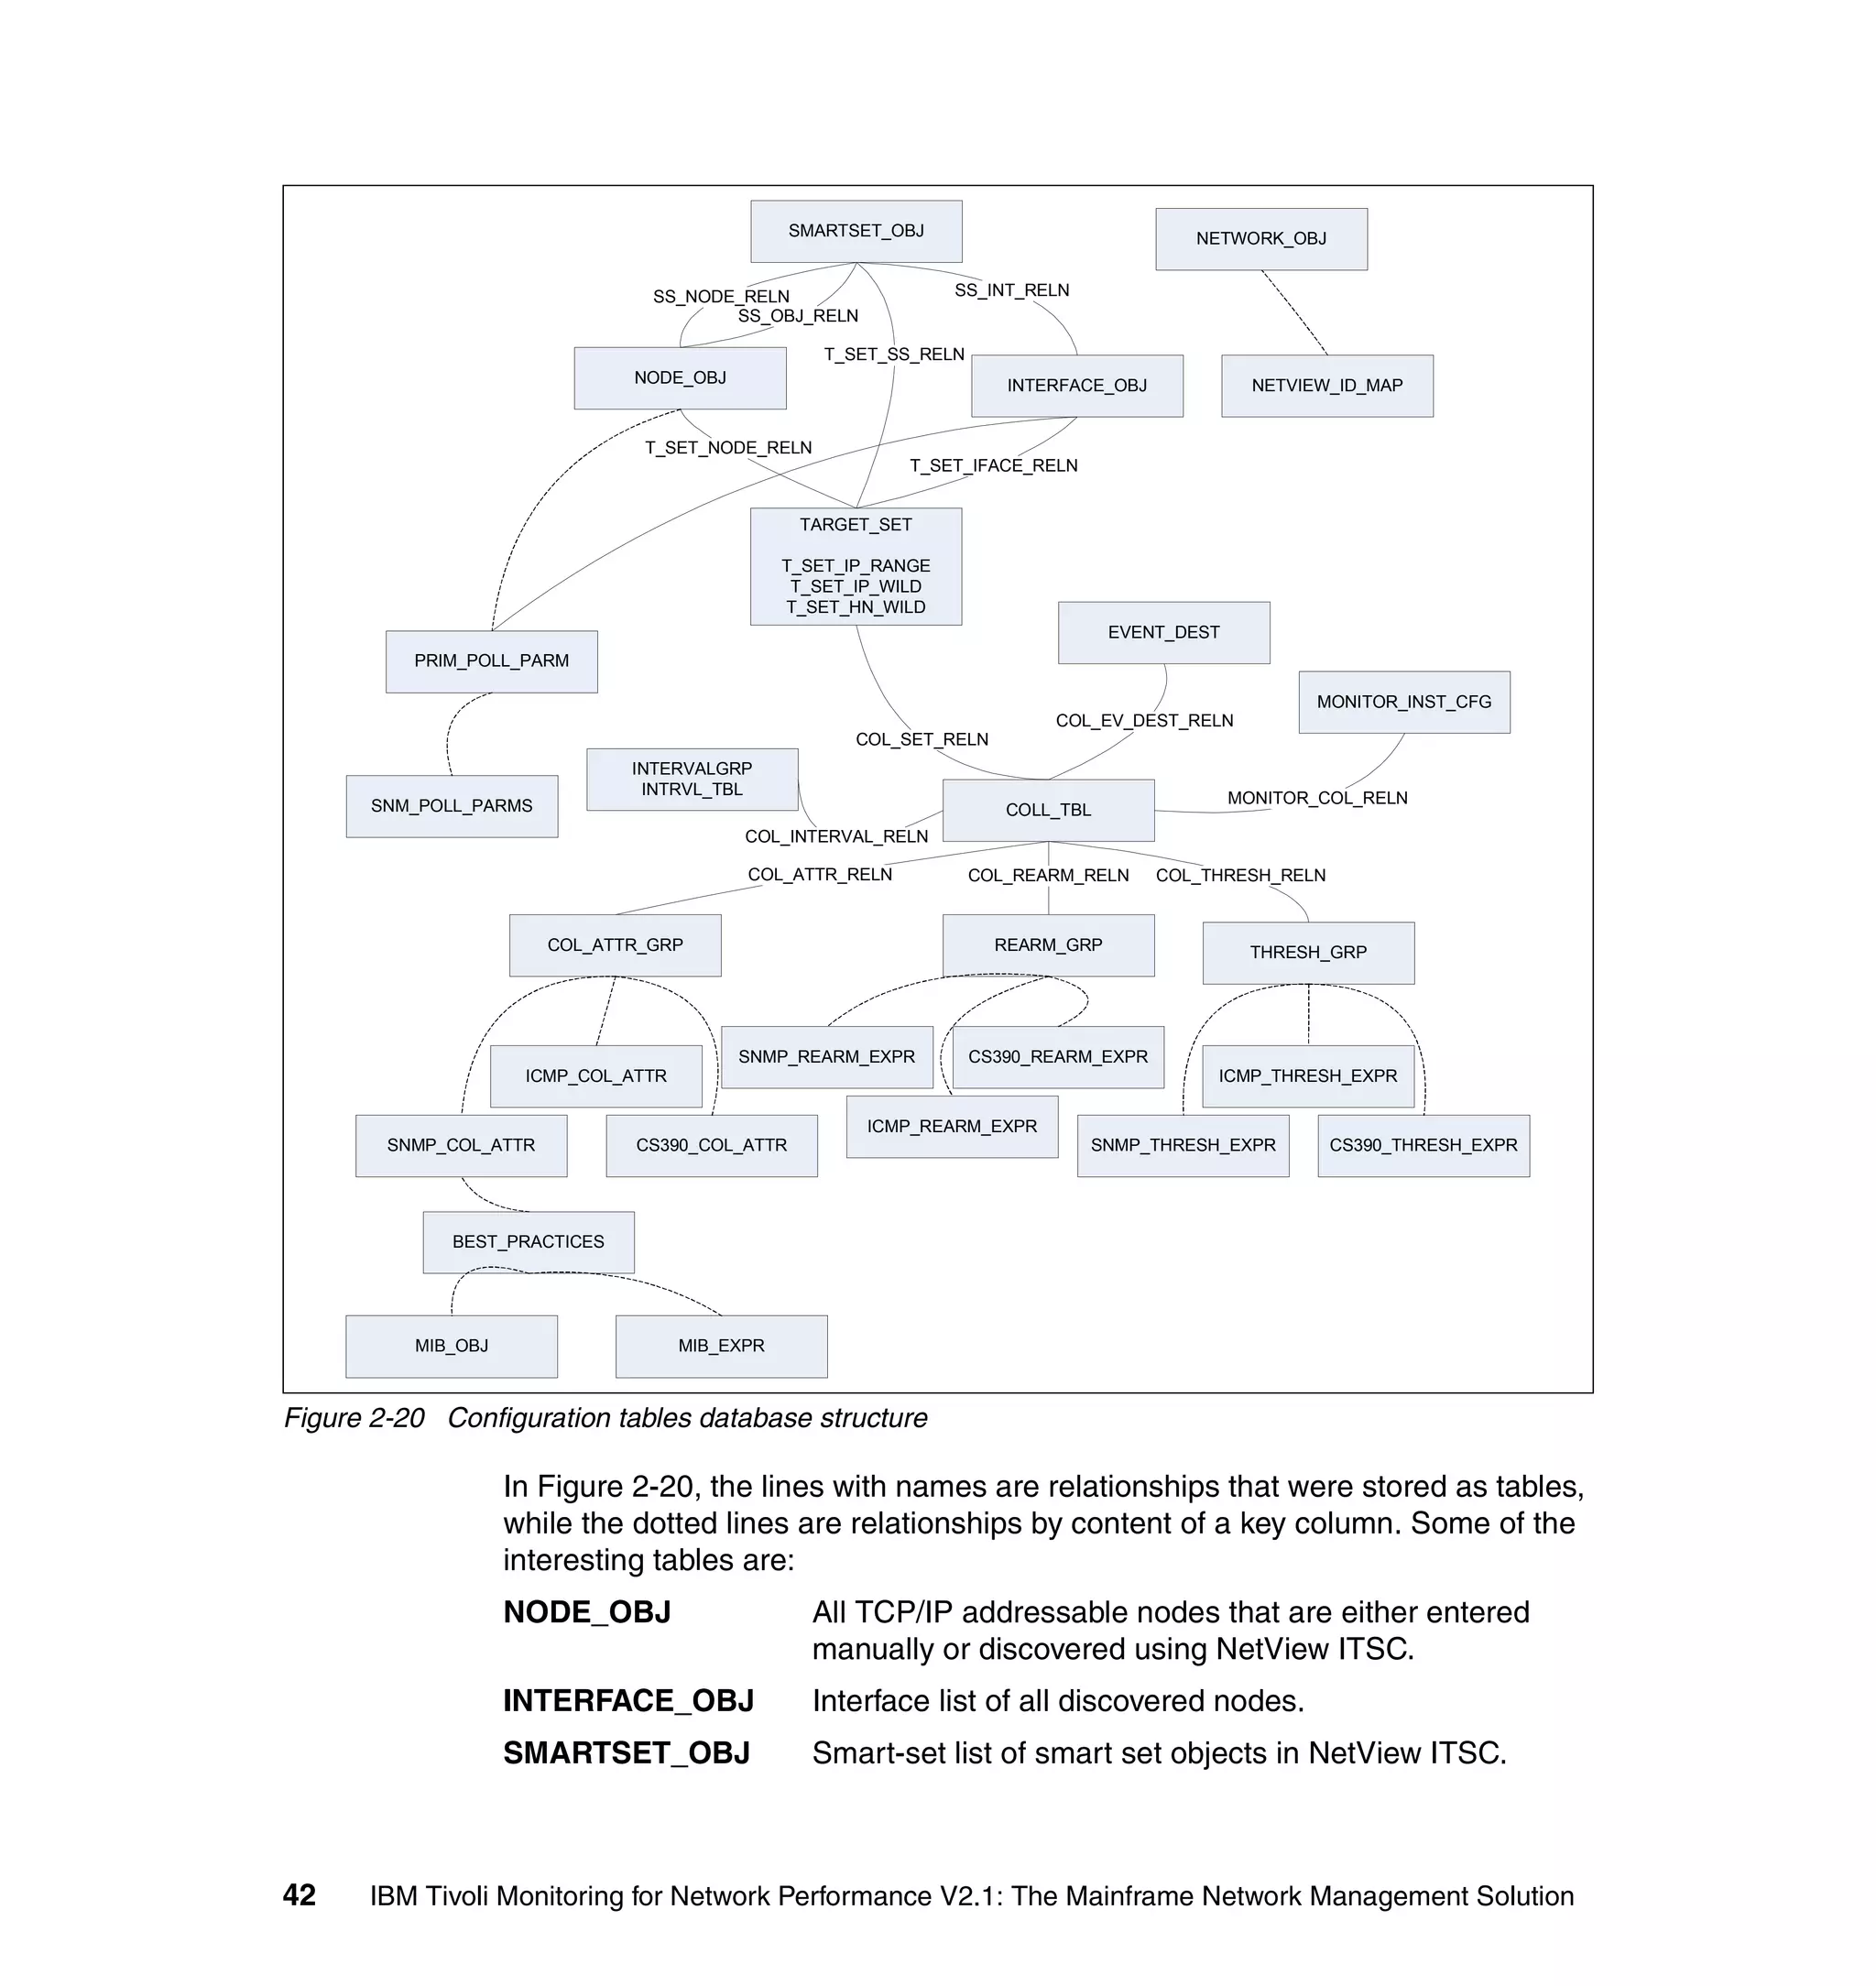

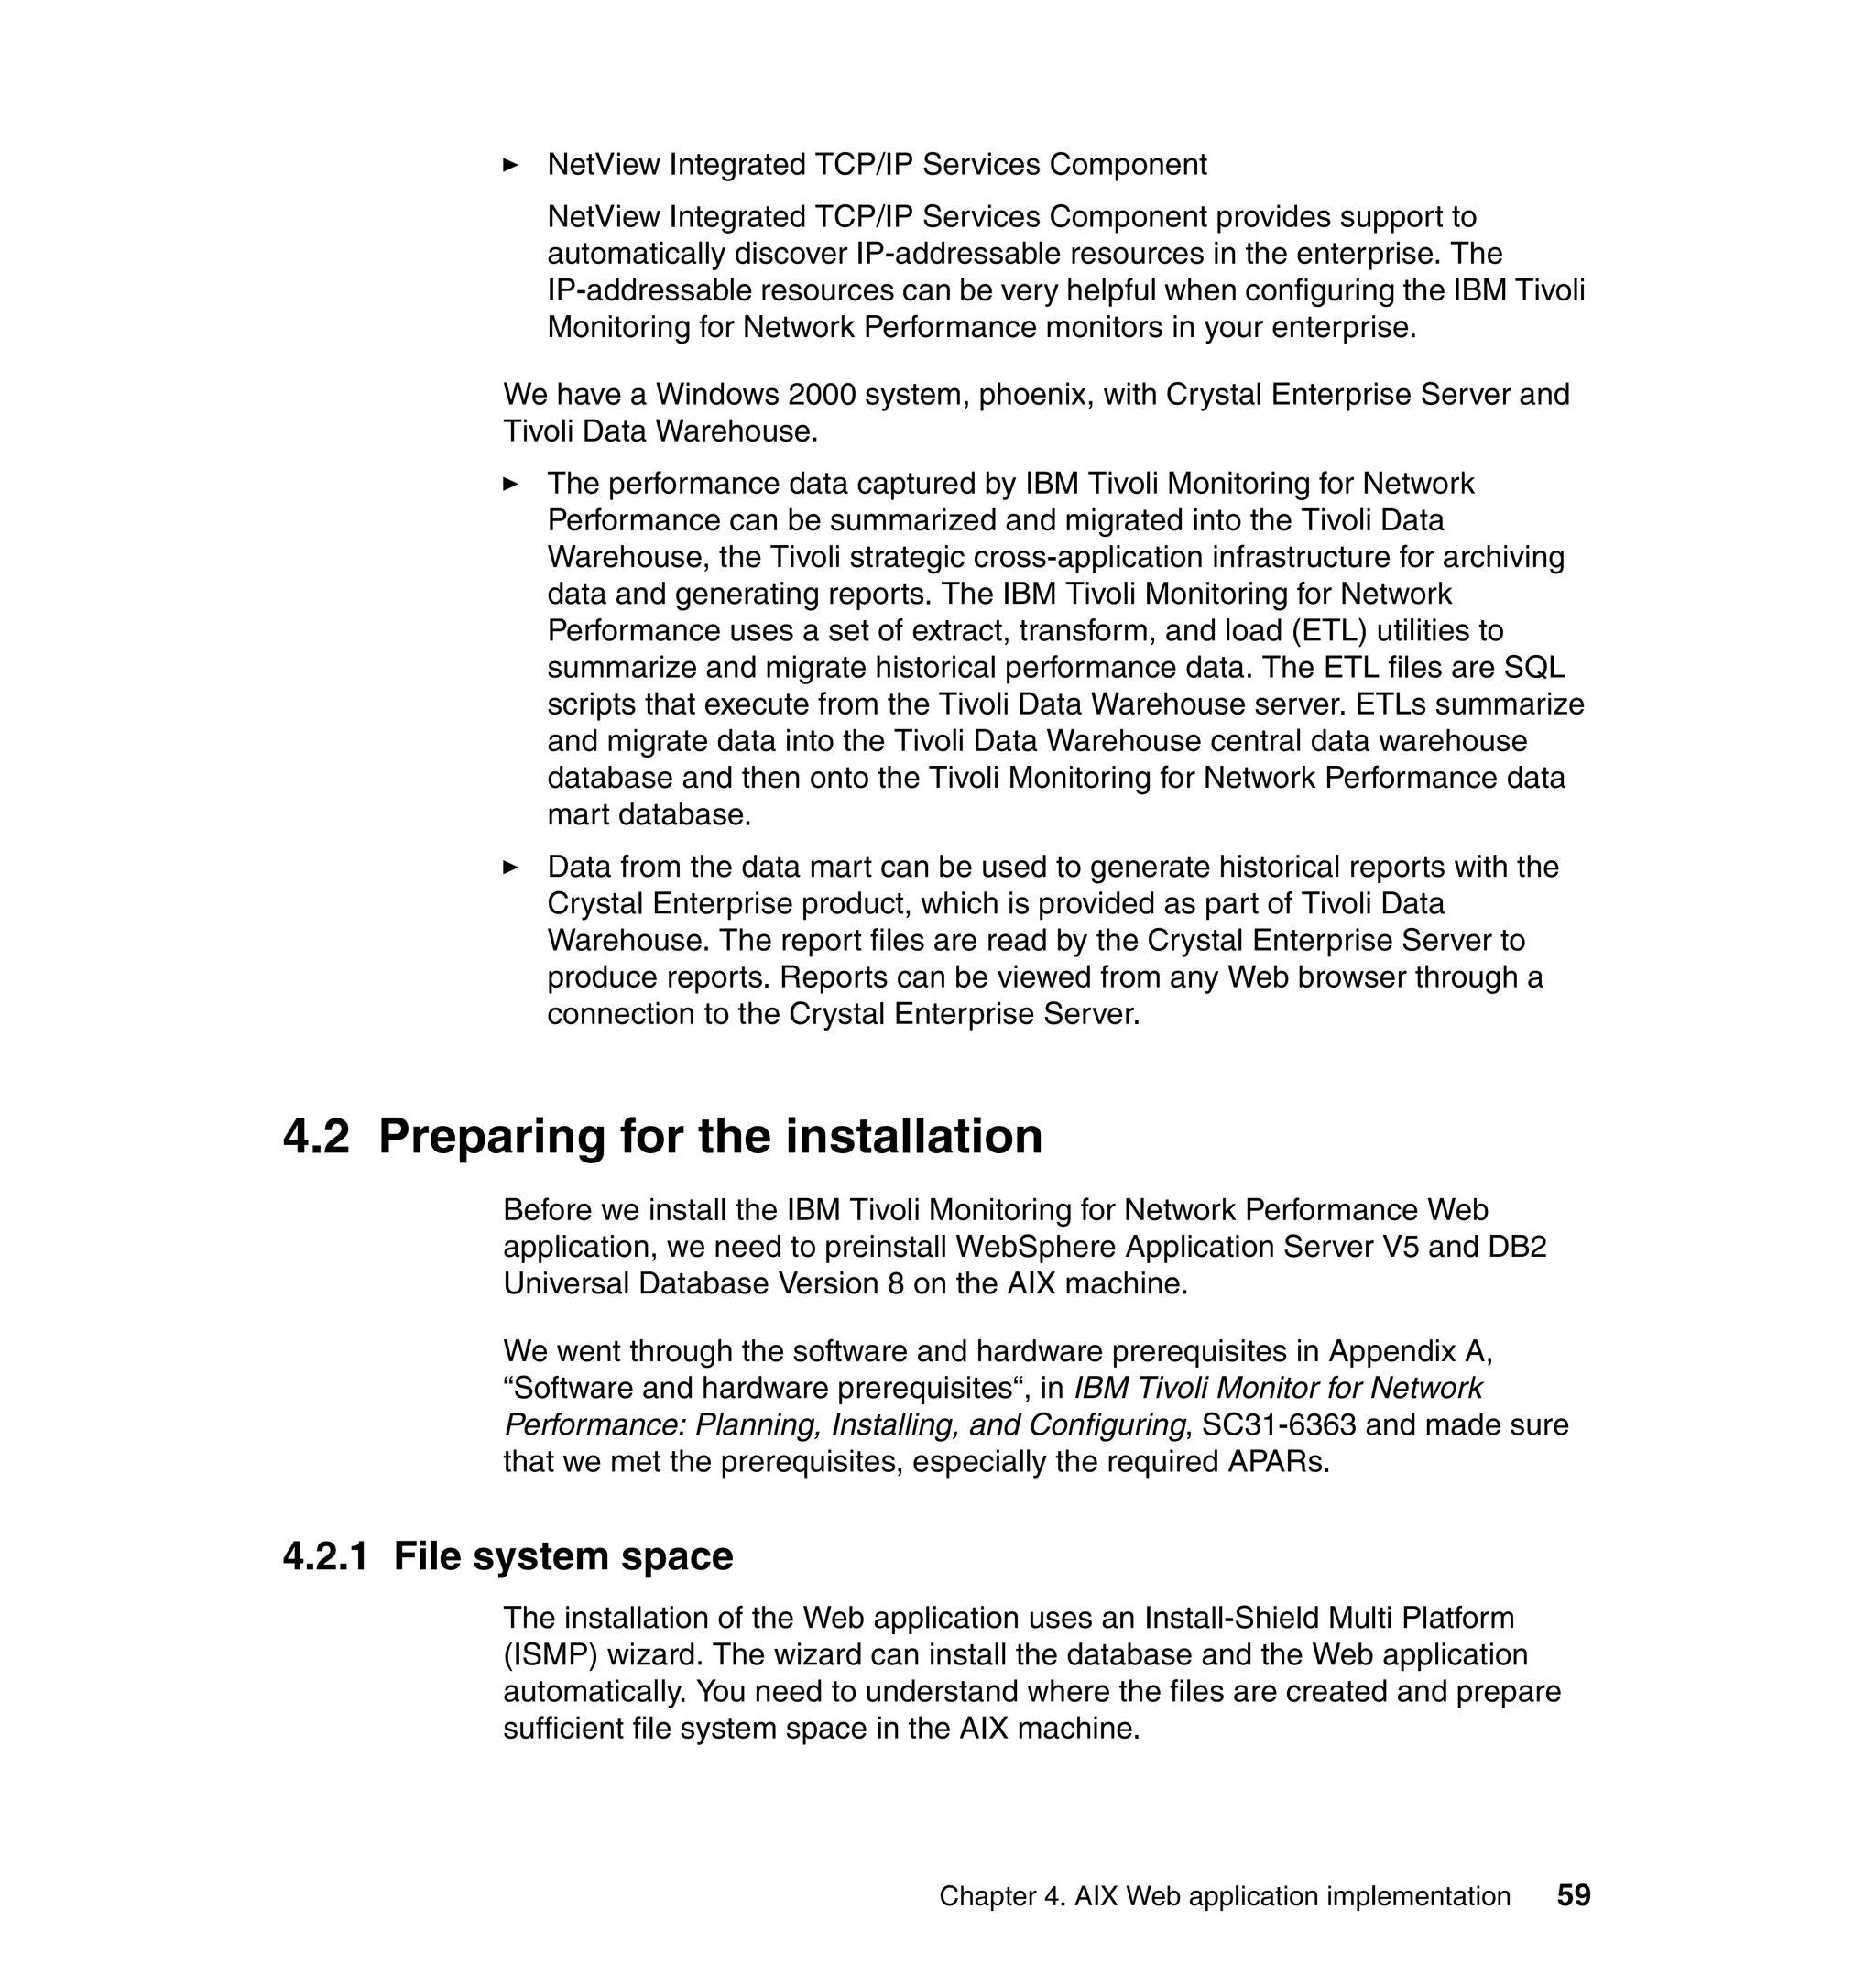
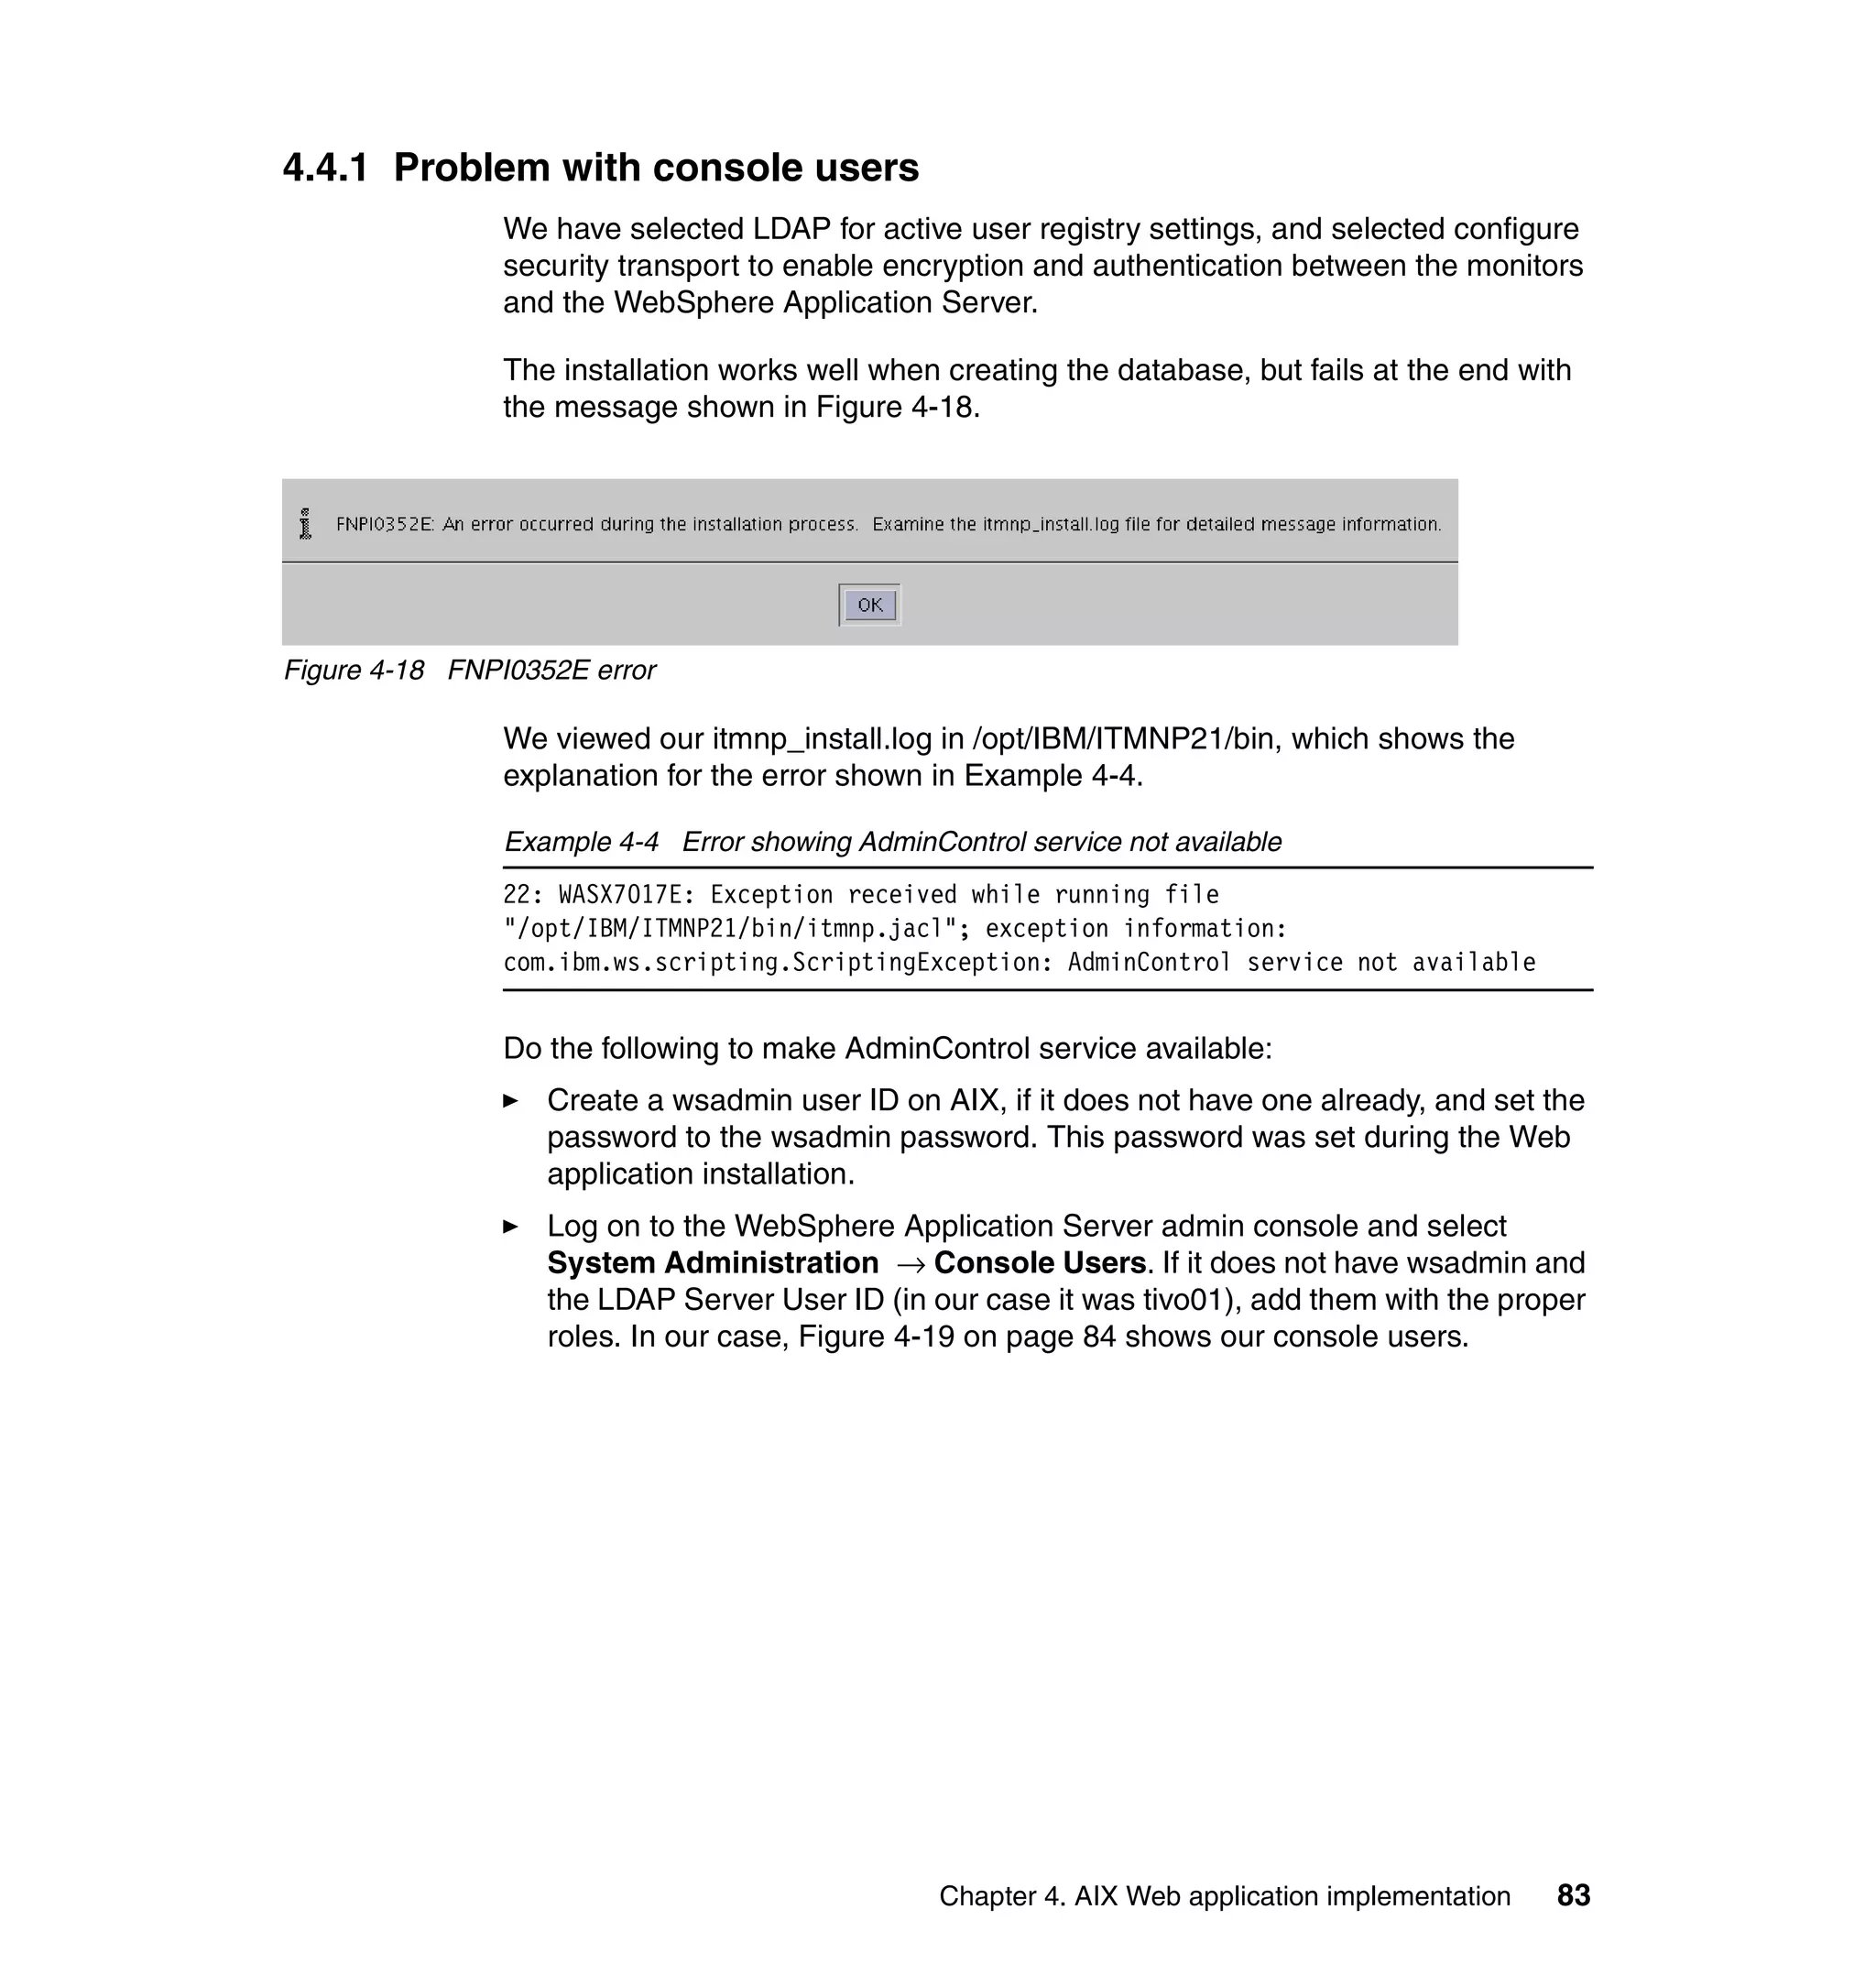
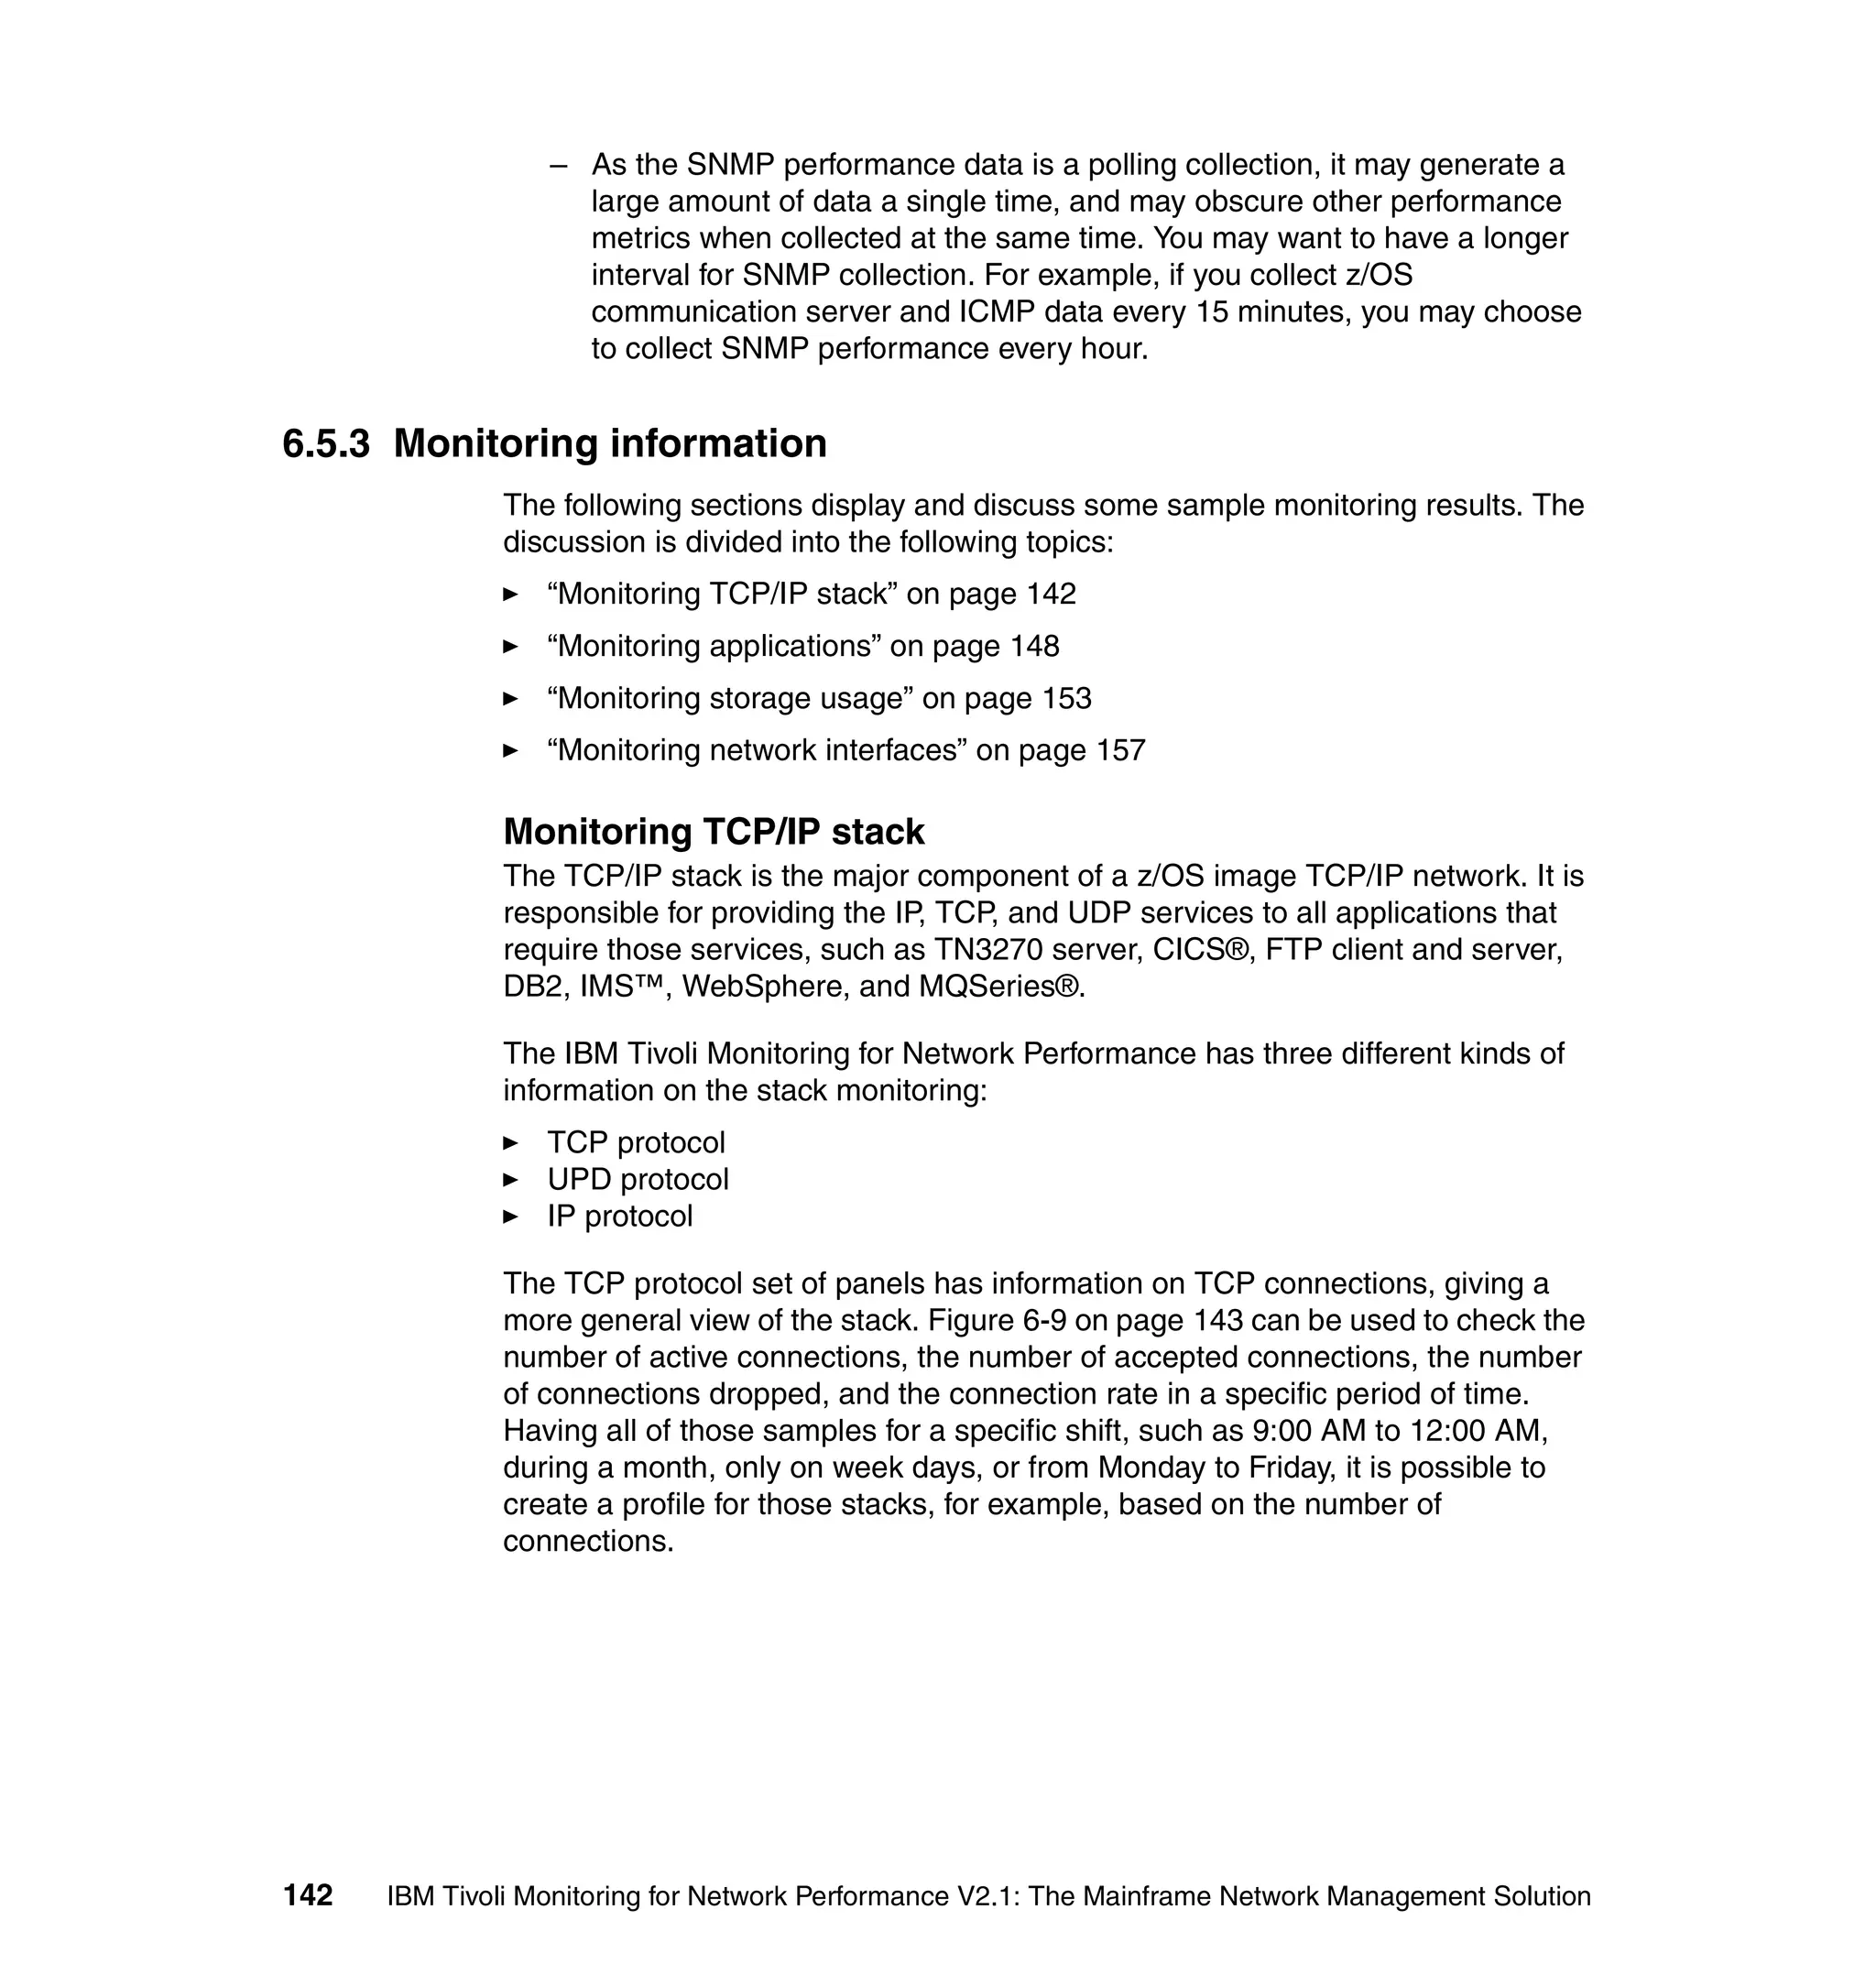
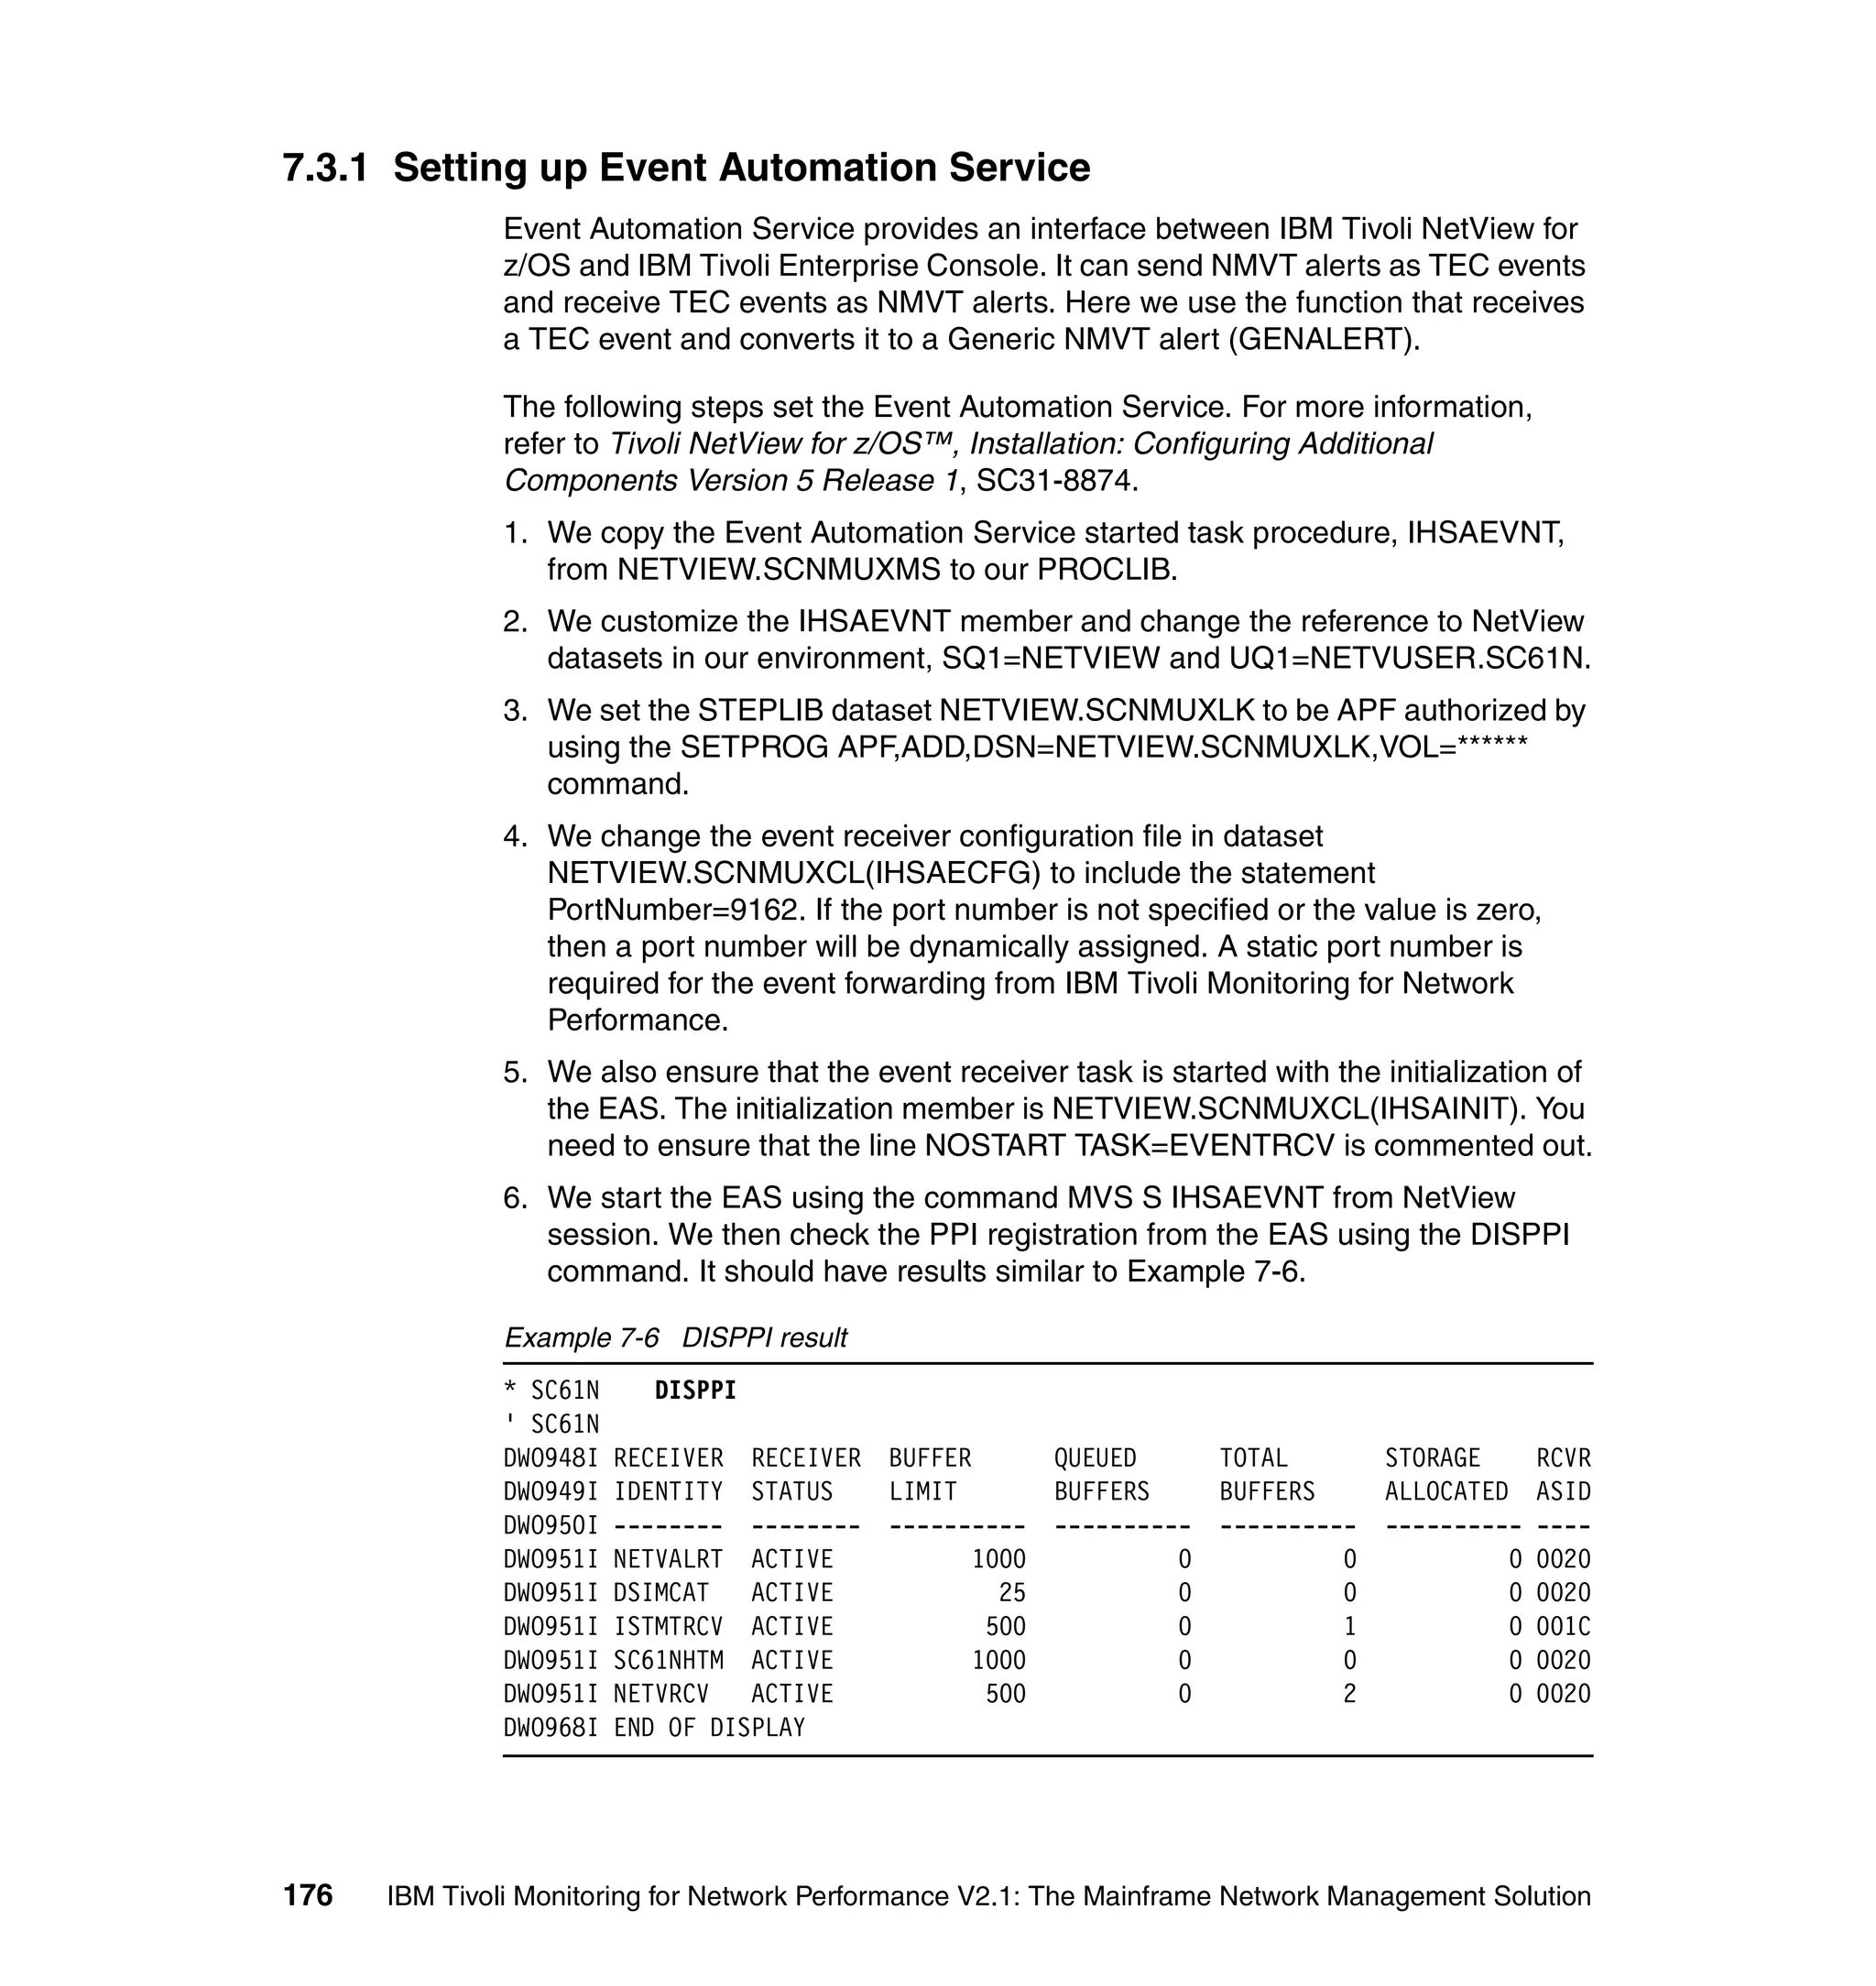
![Groups
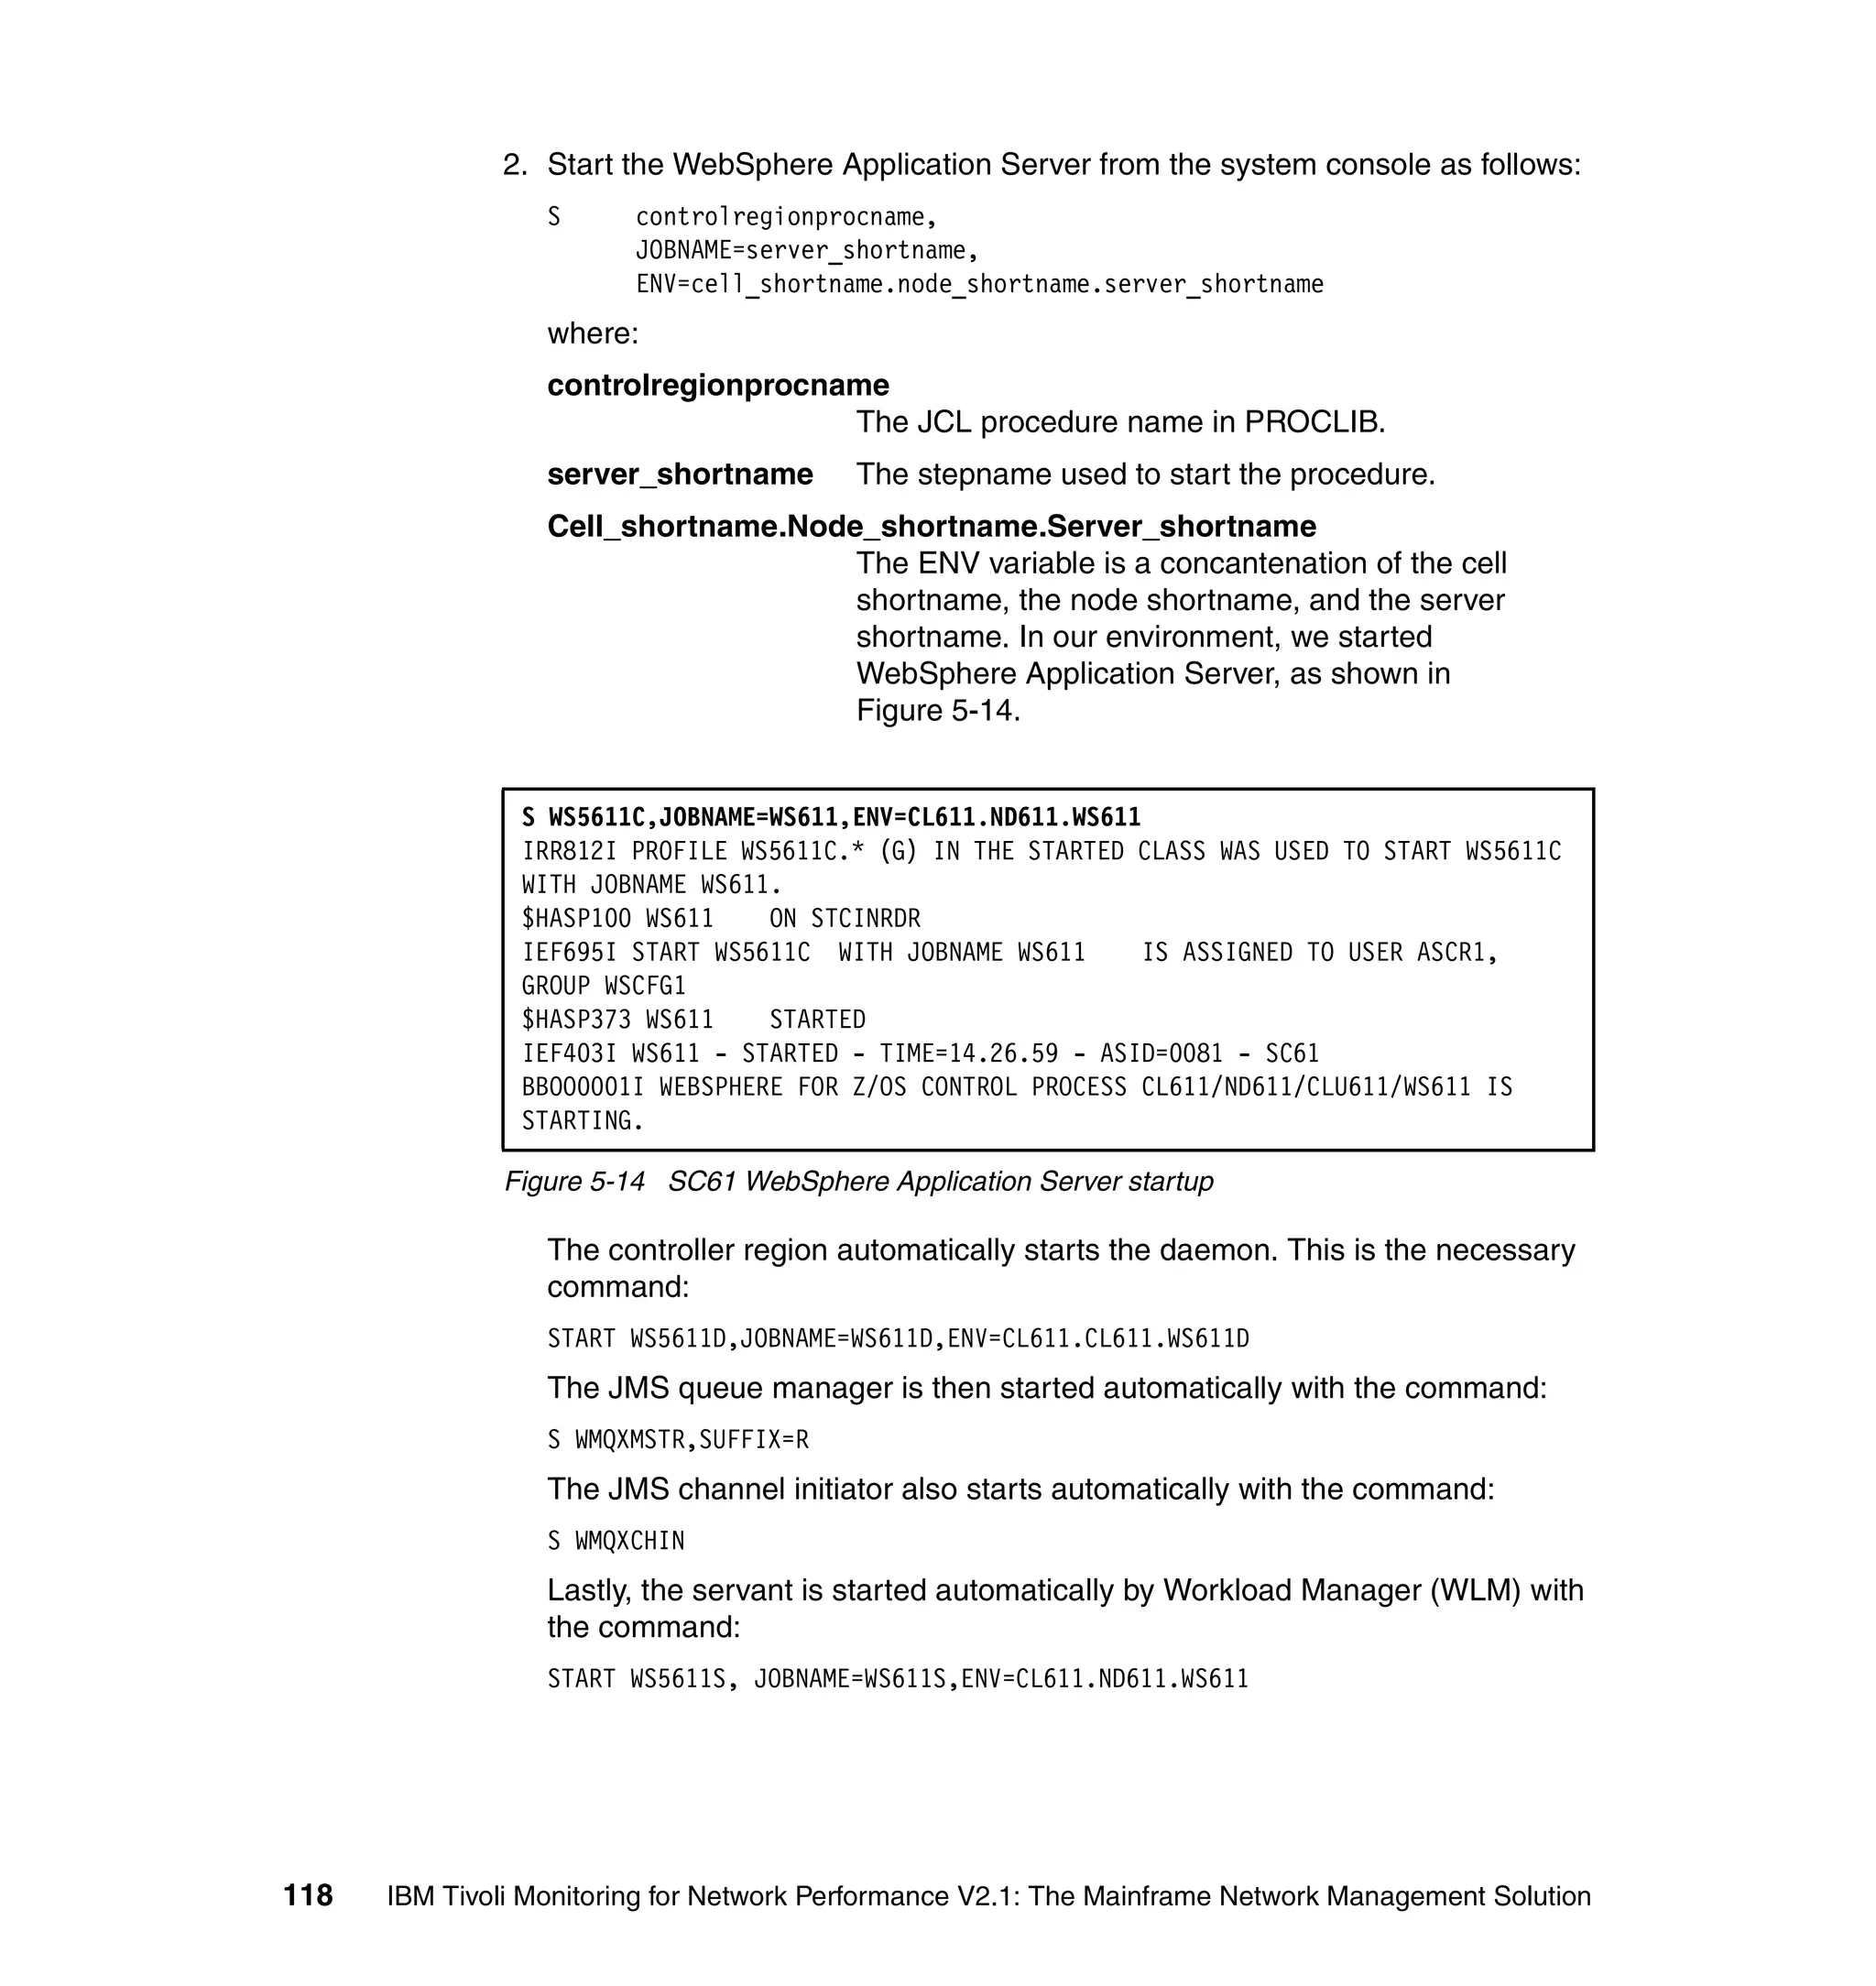
Move cursor to desired item and press Enter.
List All Groups
Add a Group
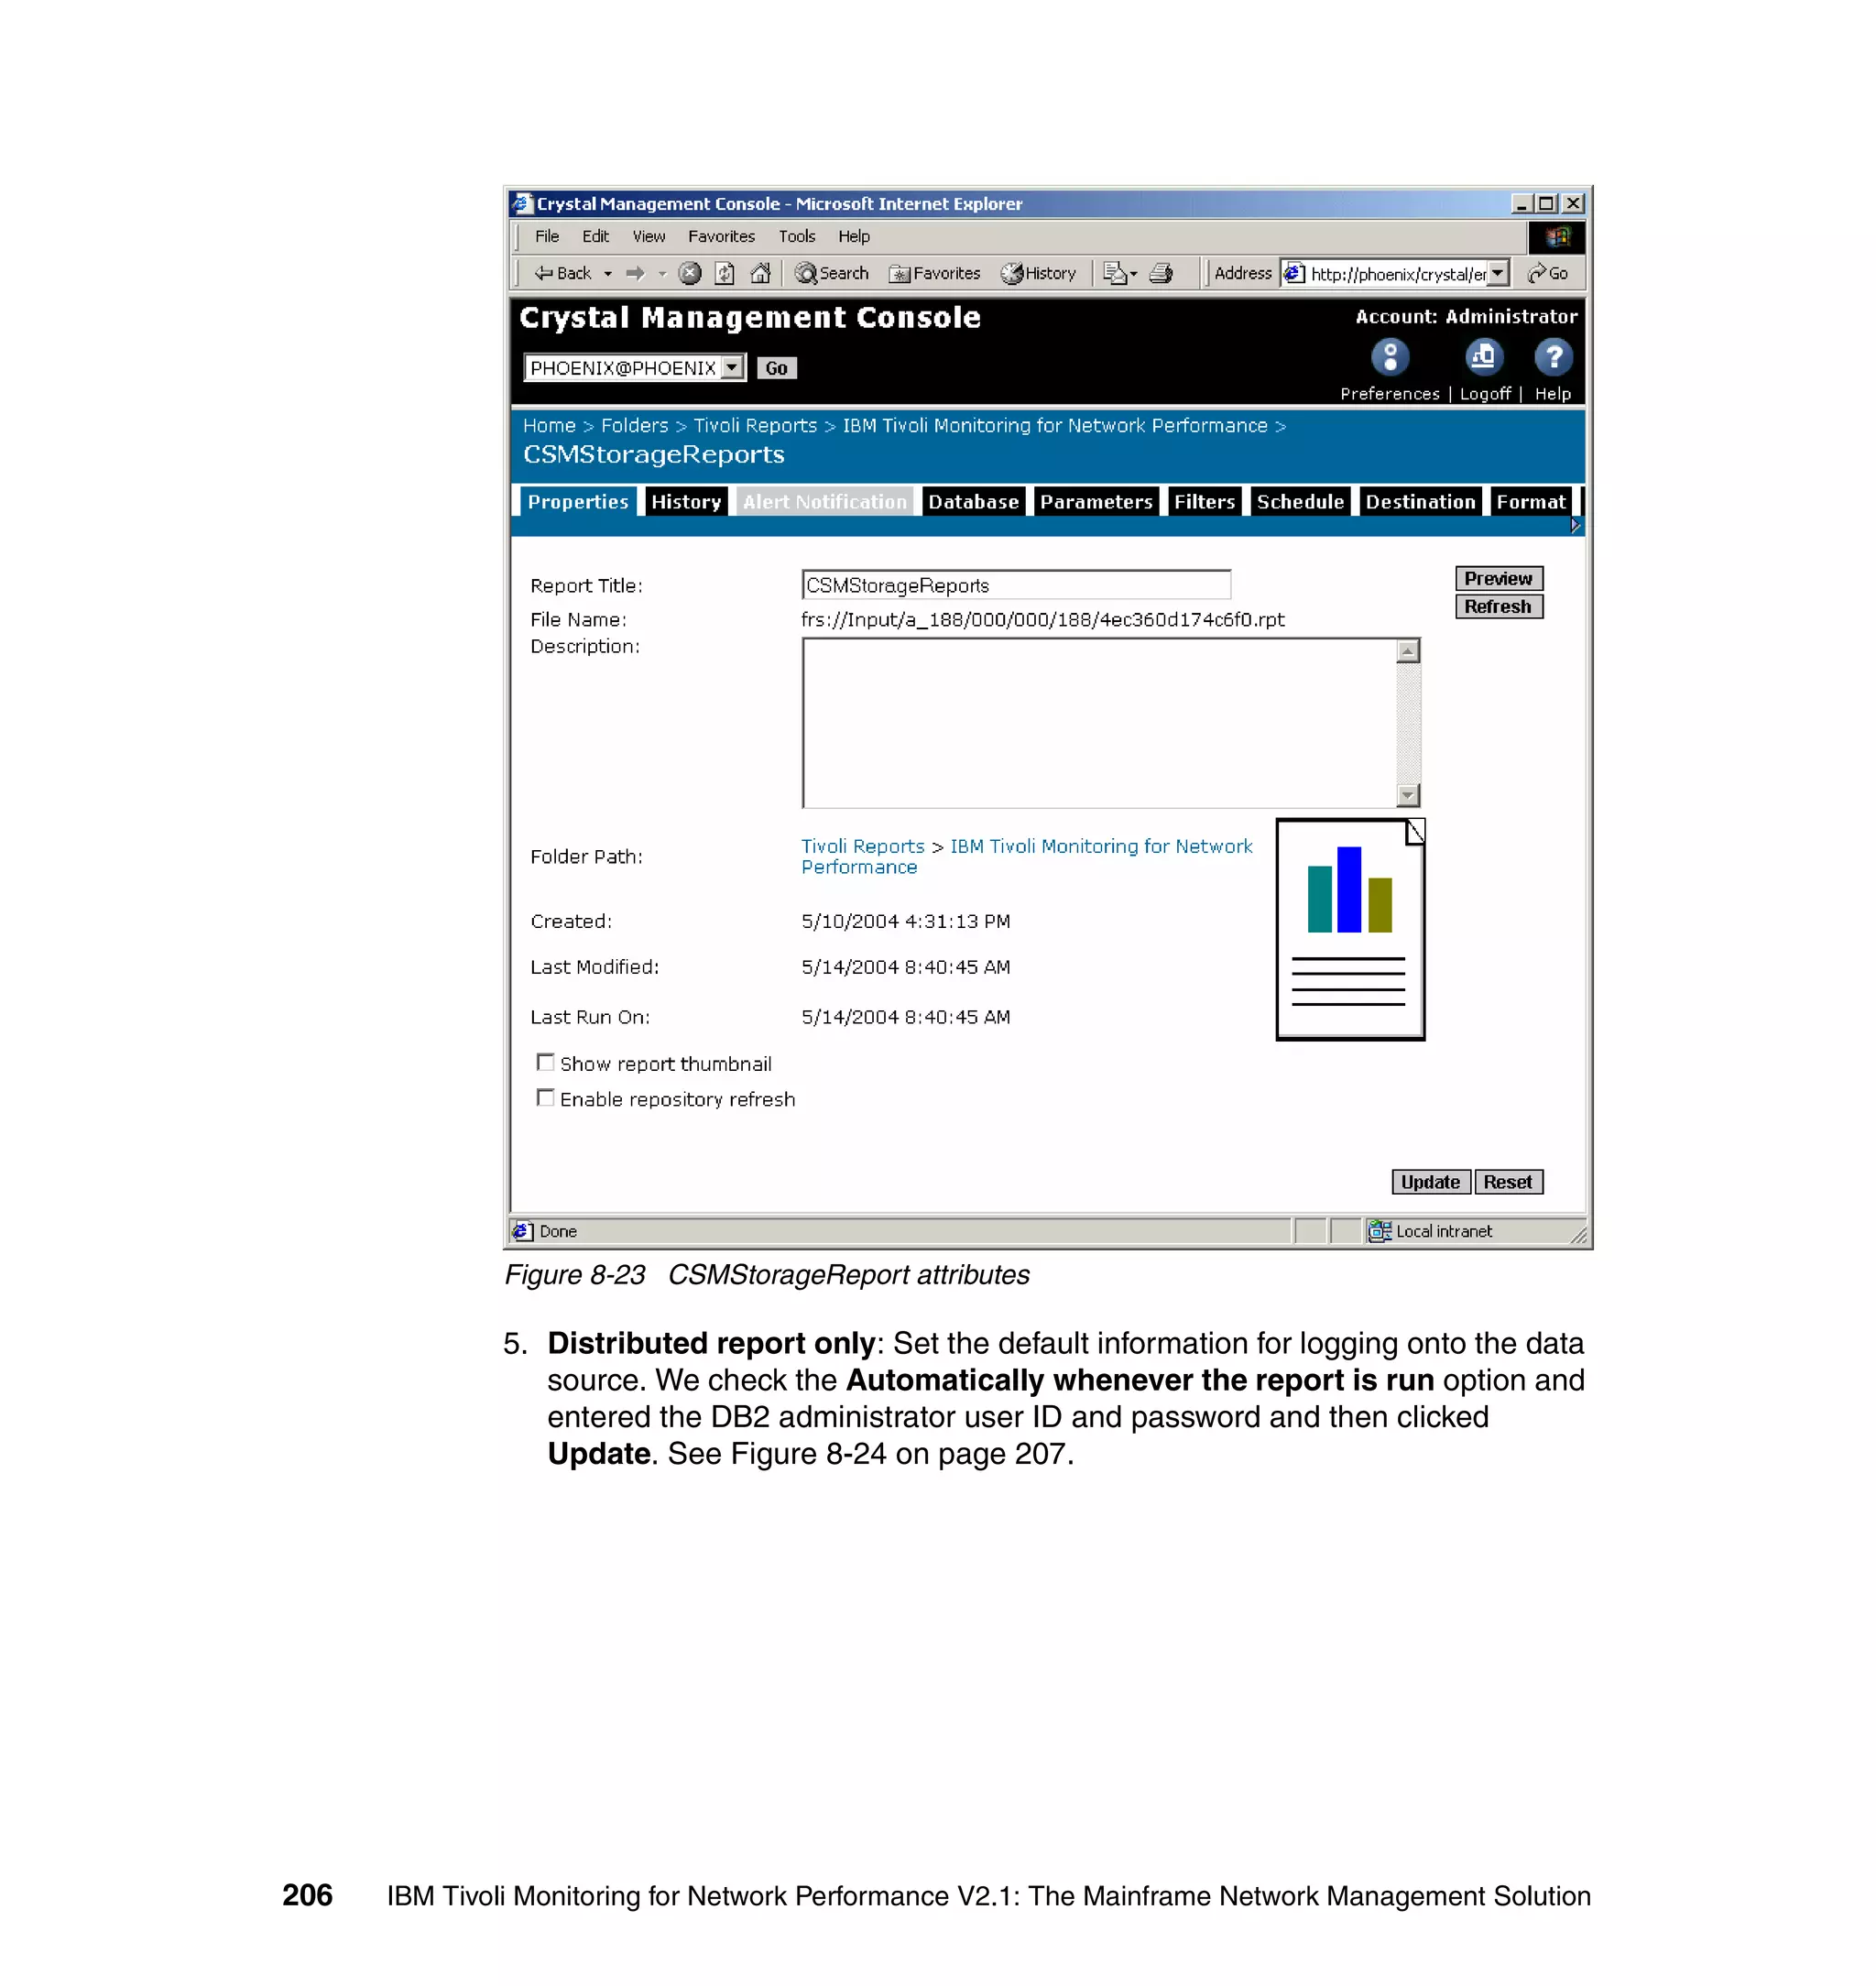
Change / Show Characteristics of a Group
Remove a Group
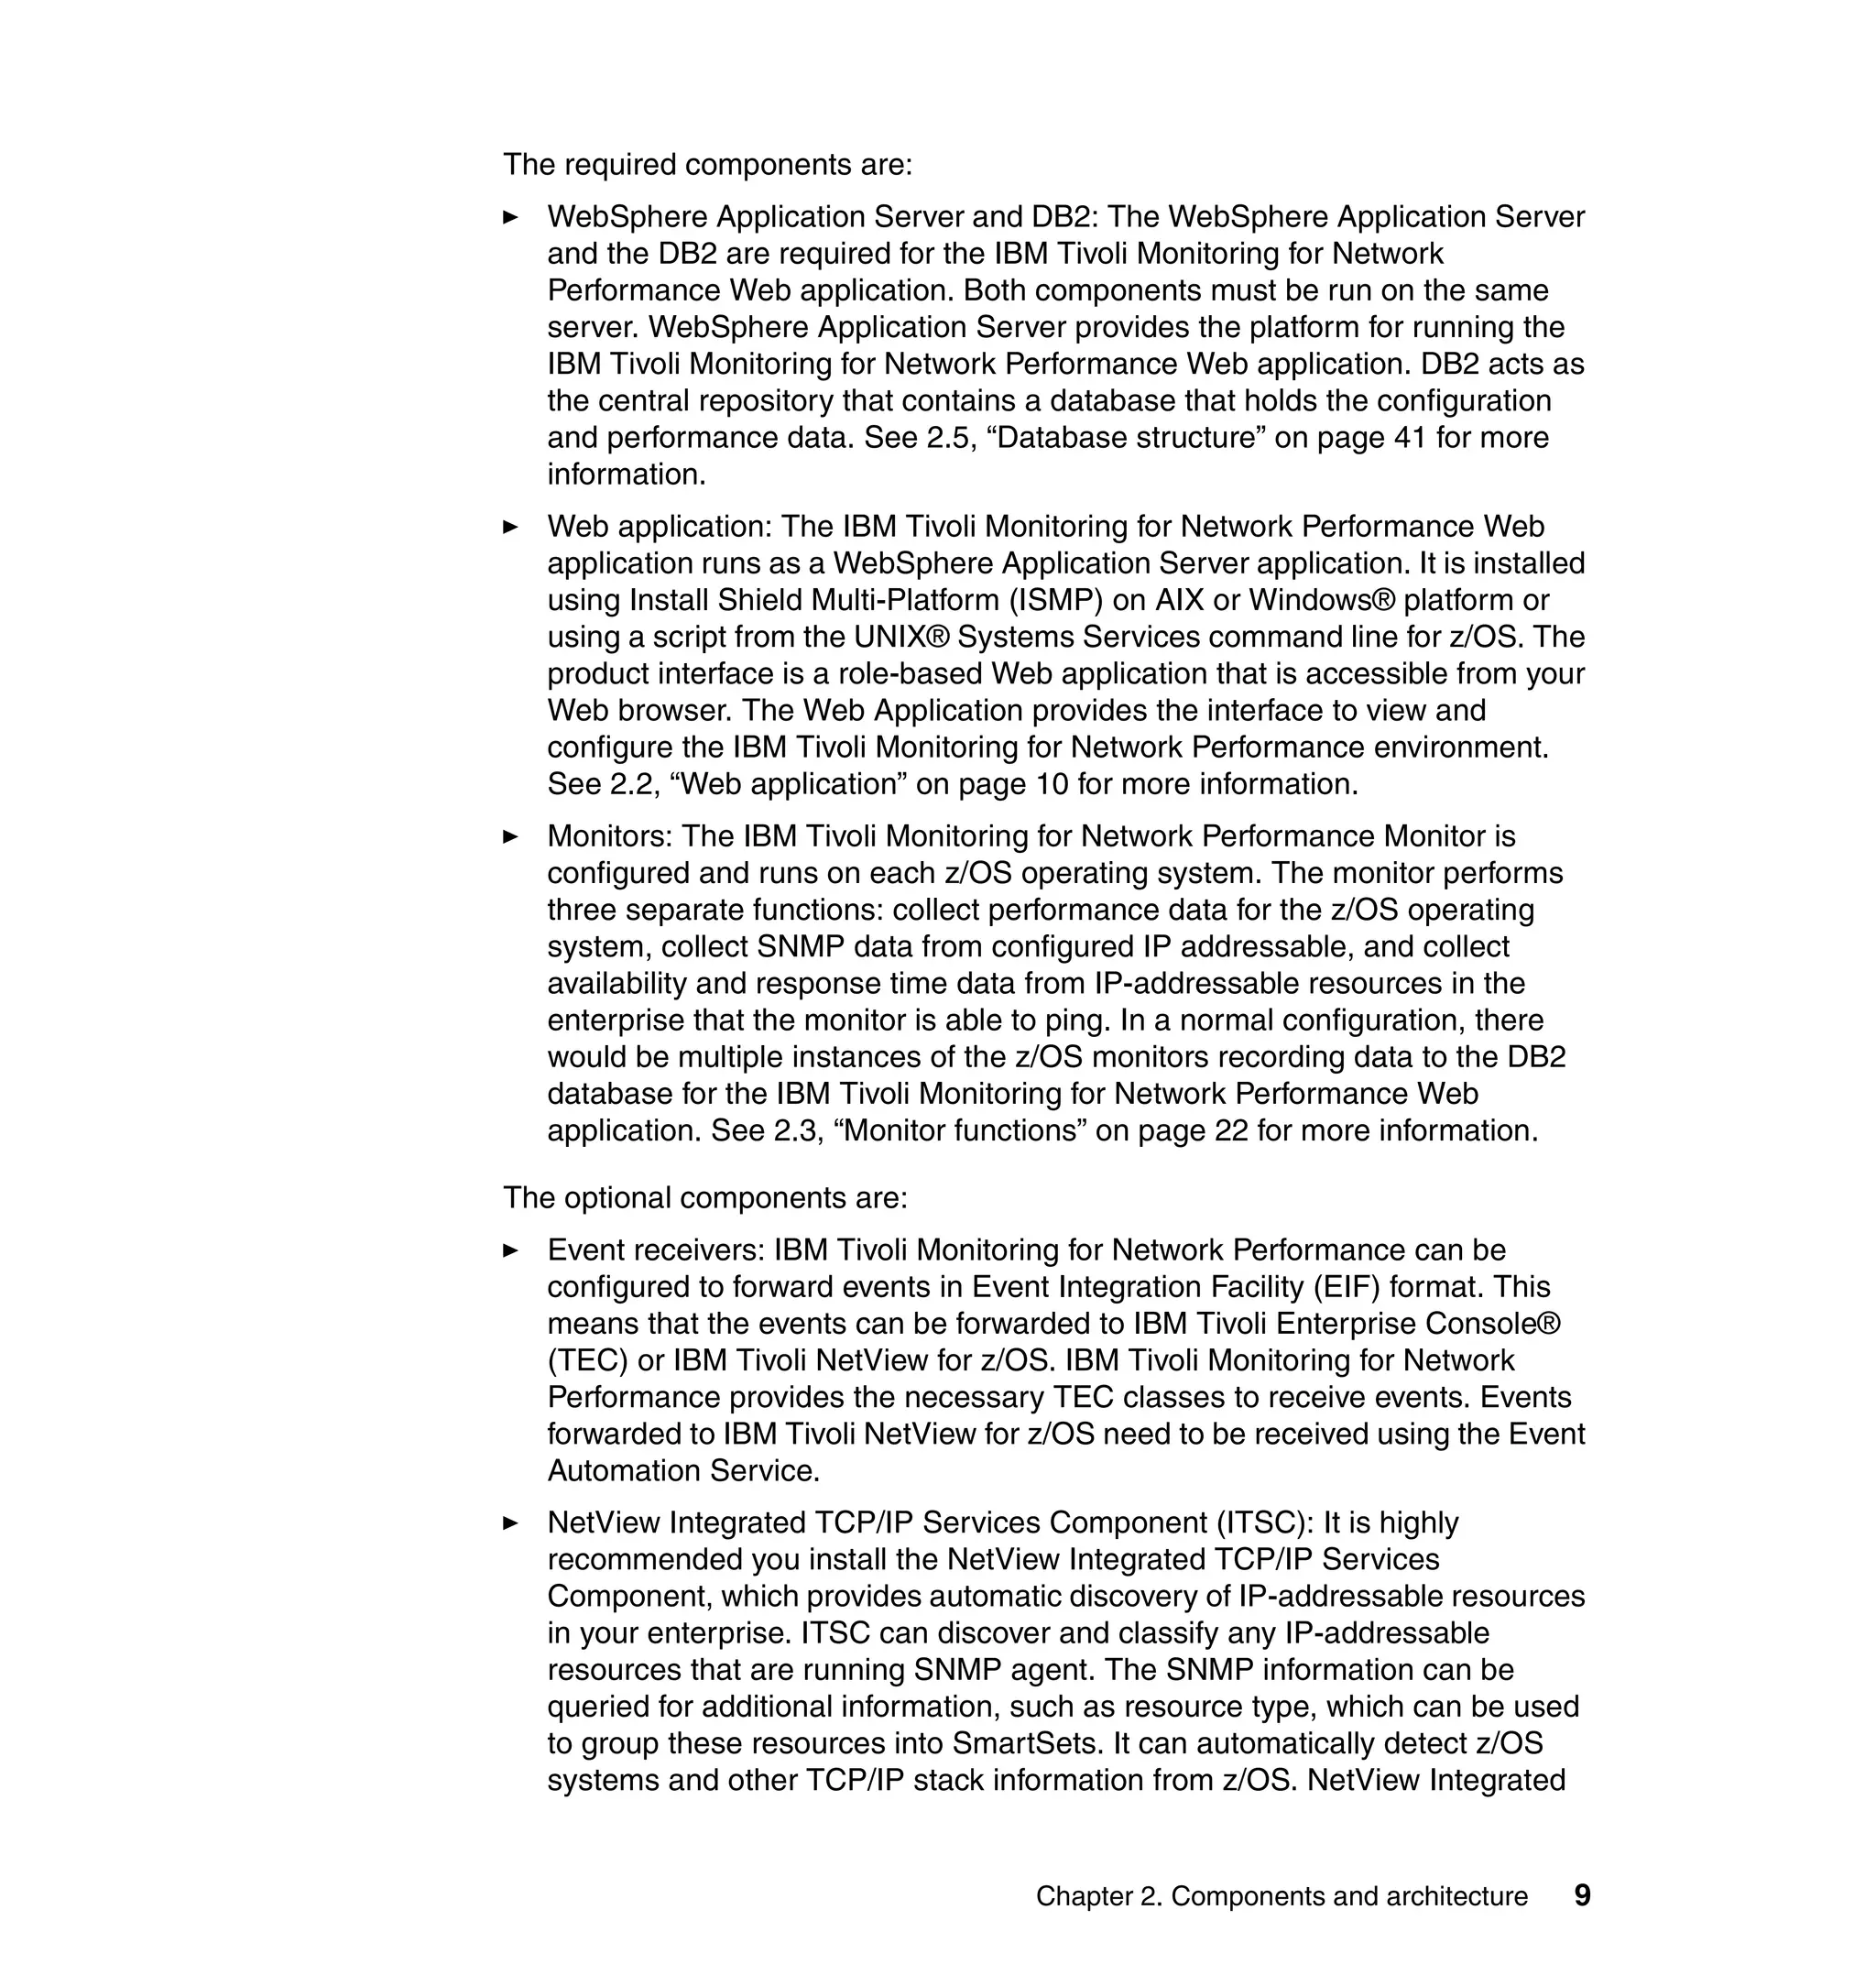
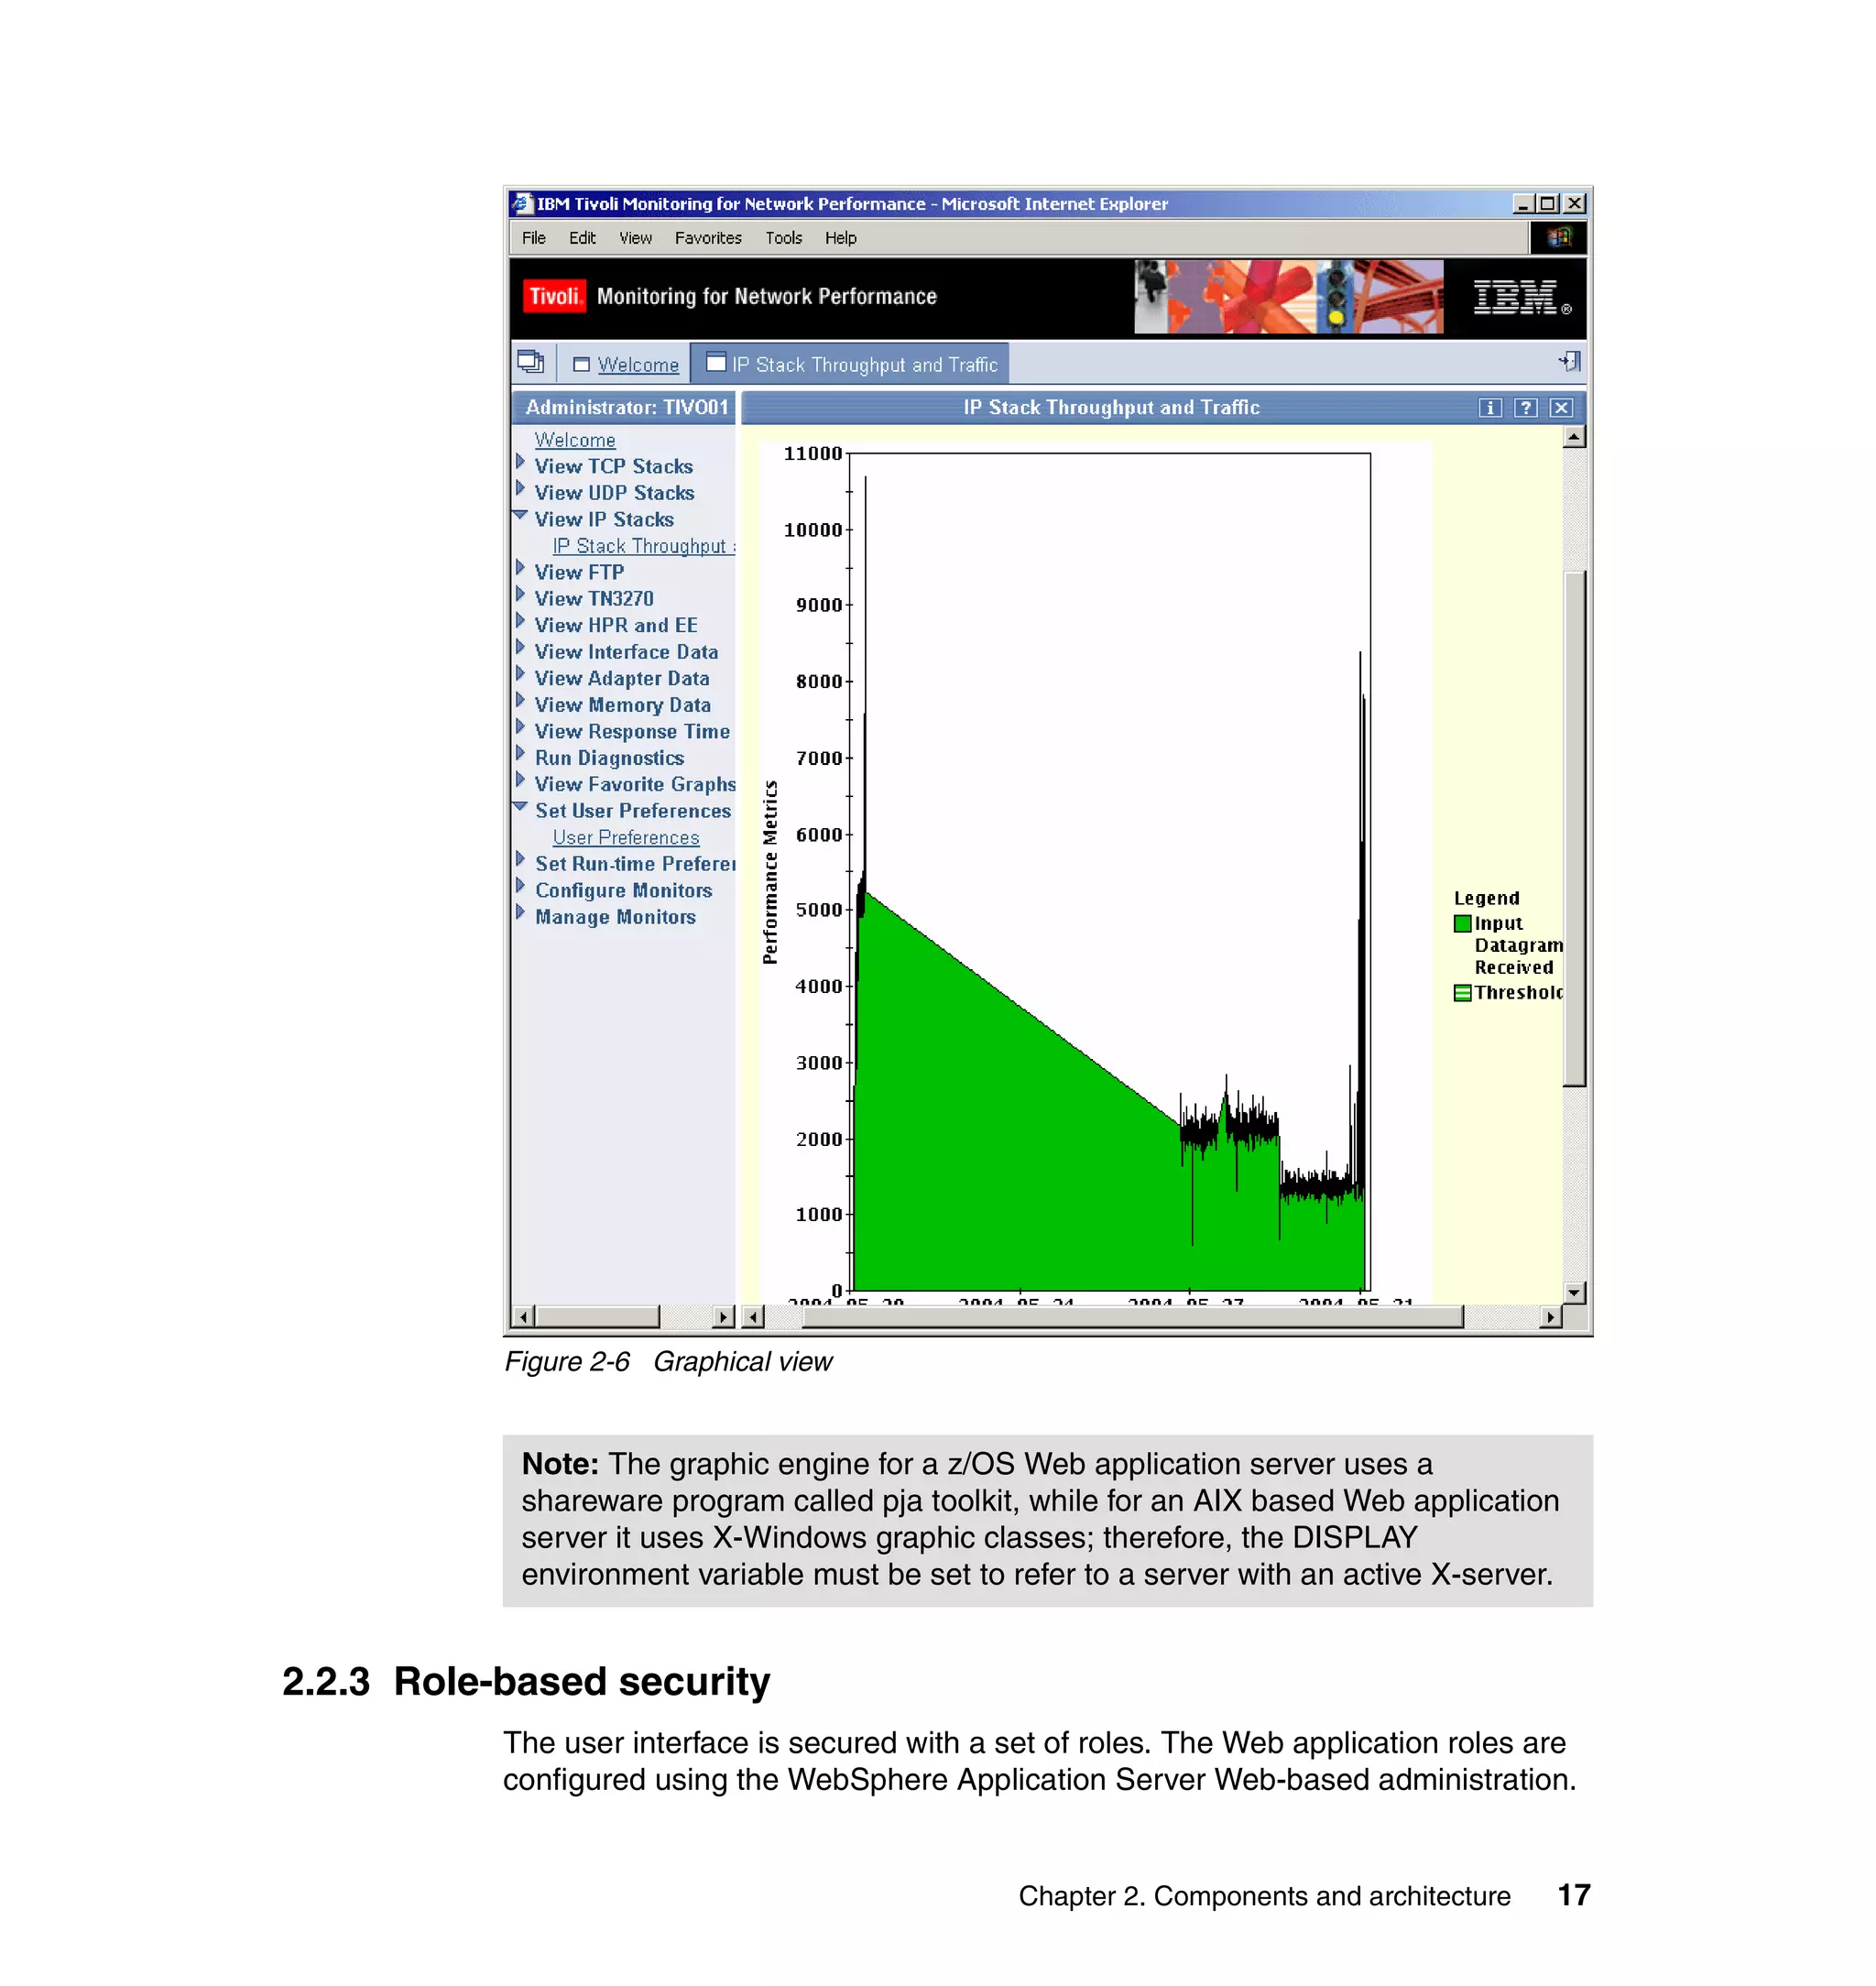
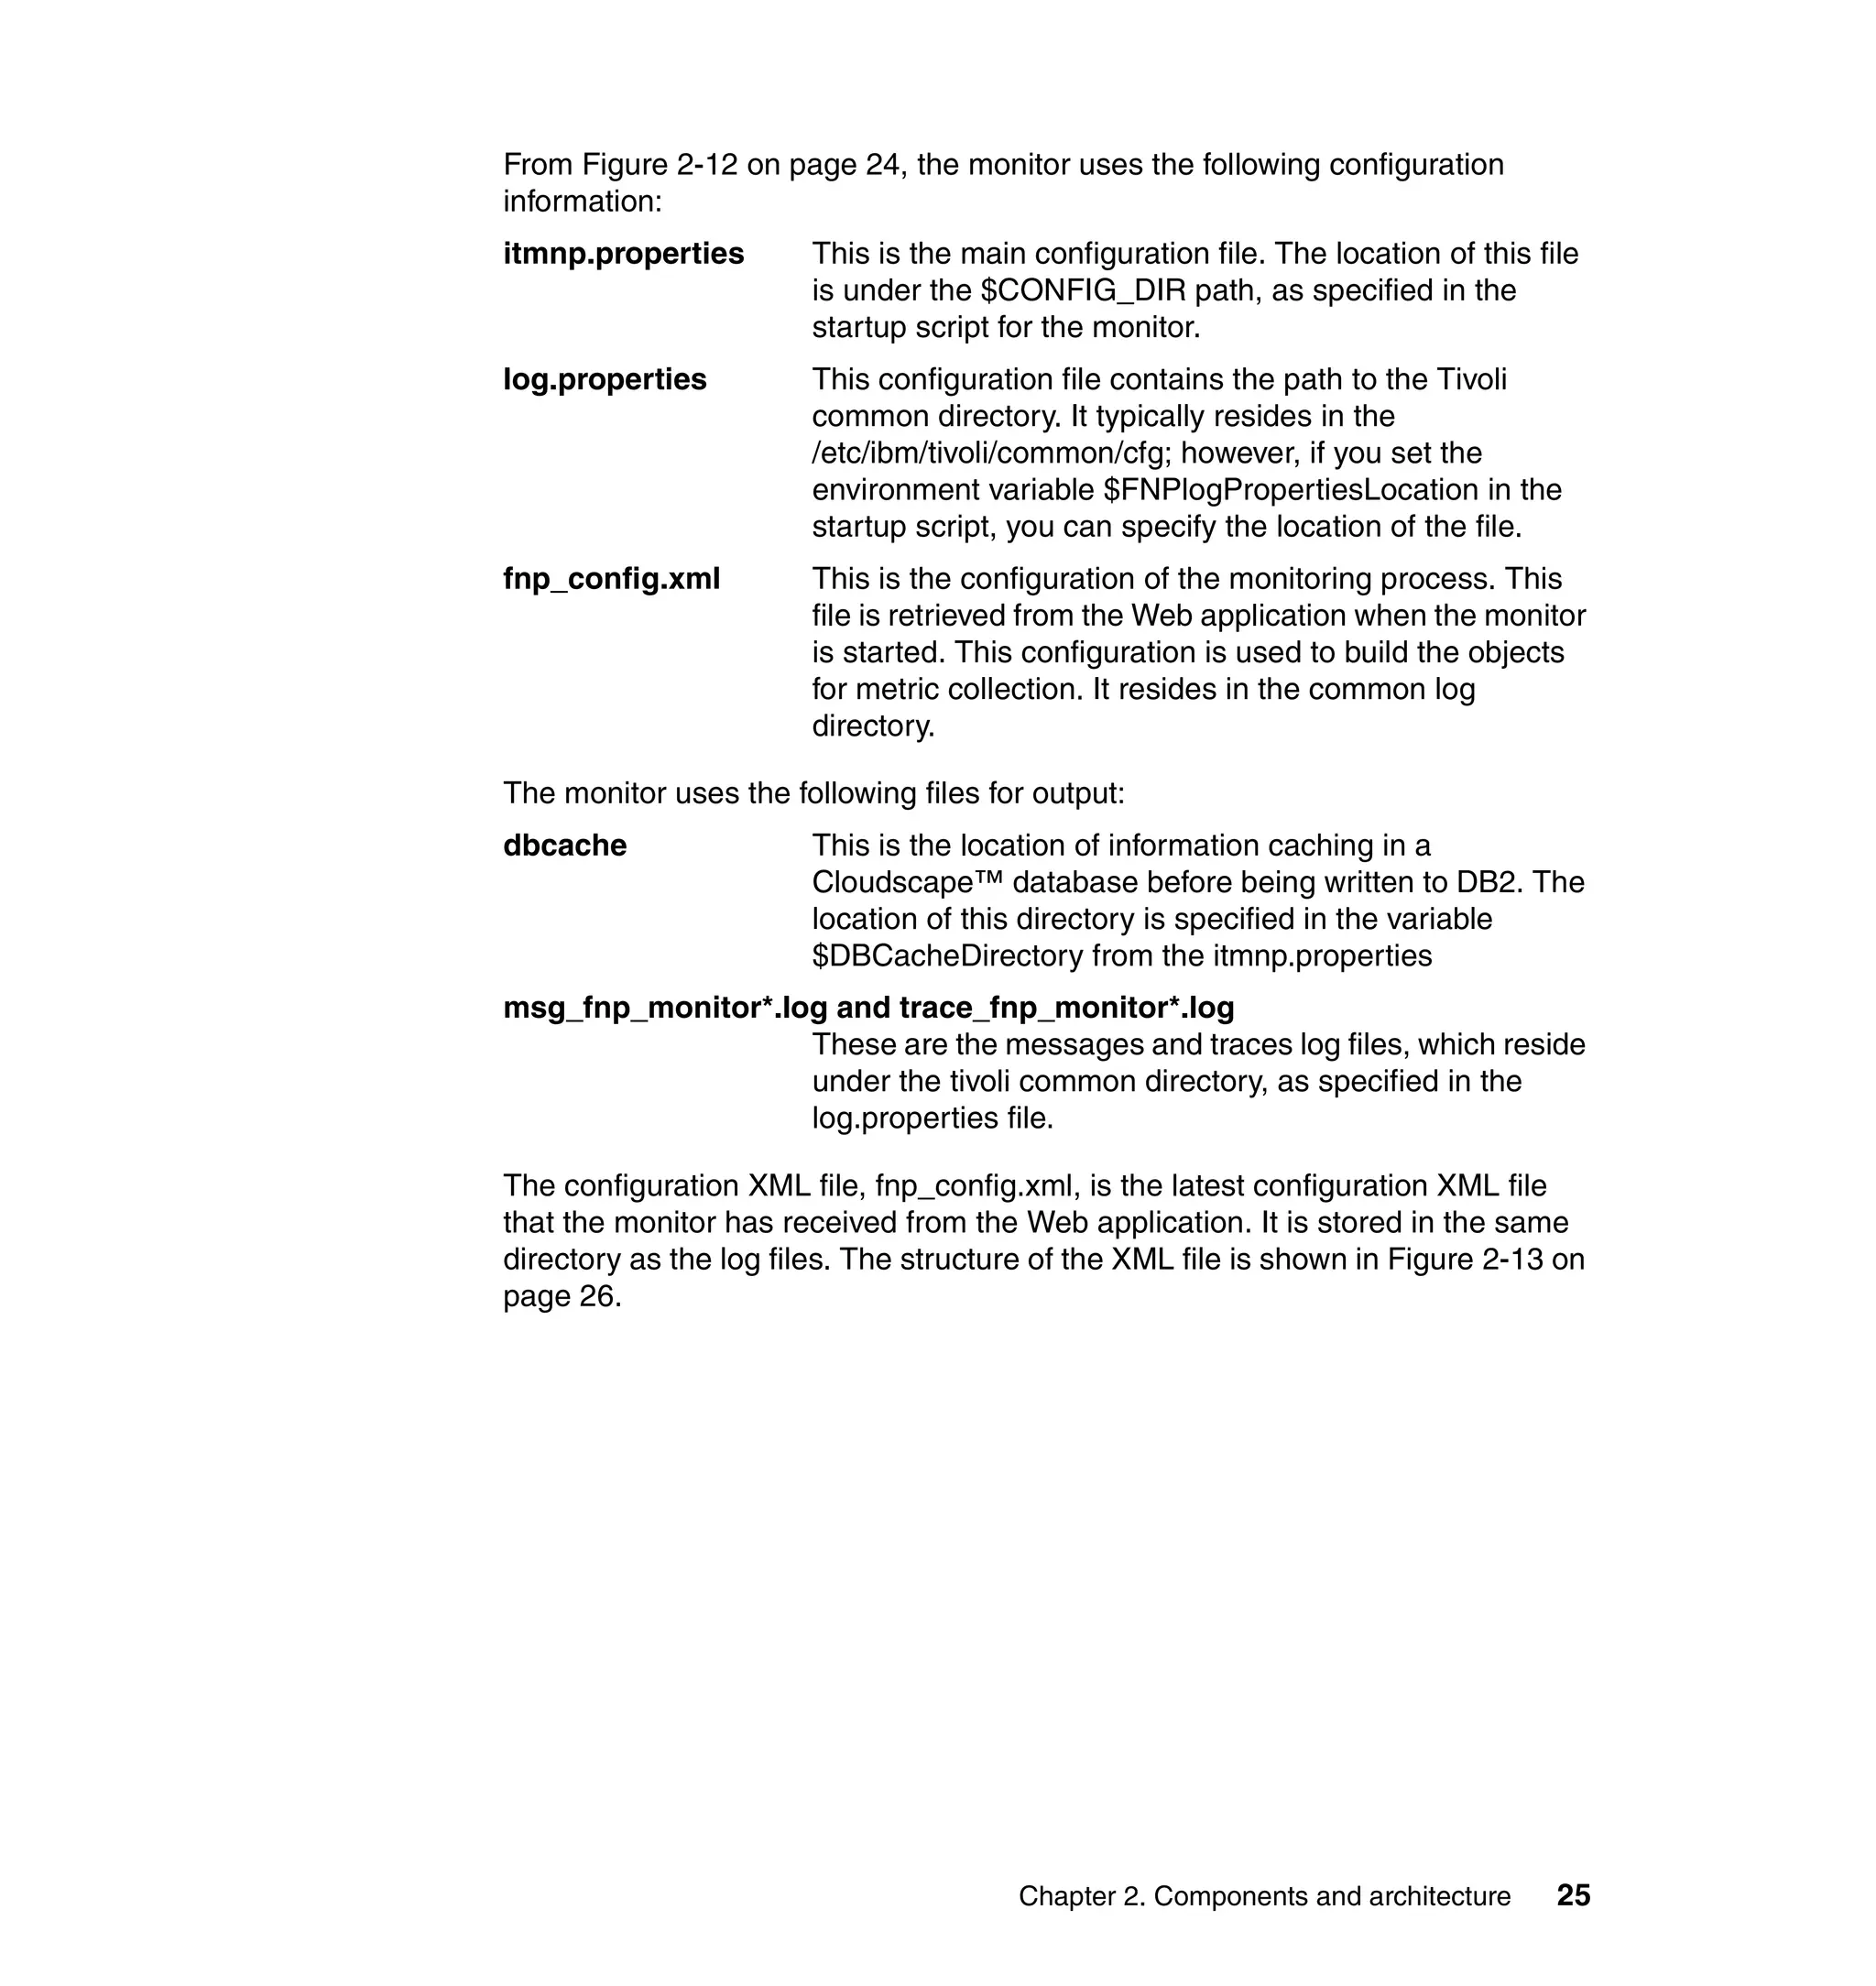
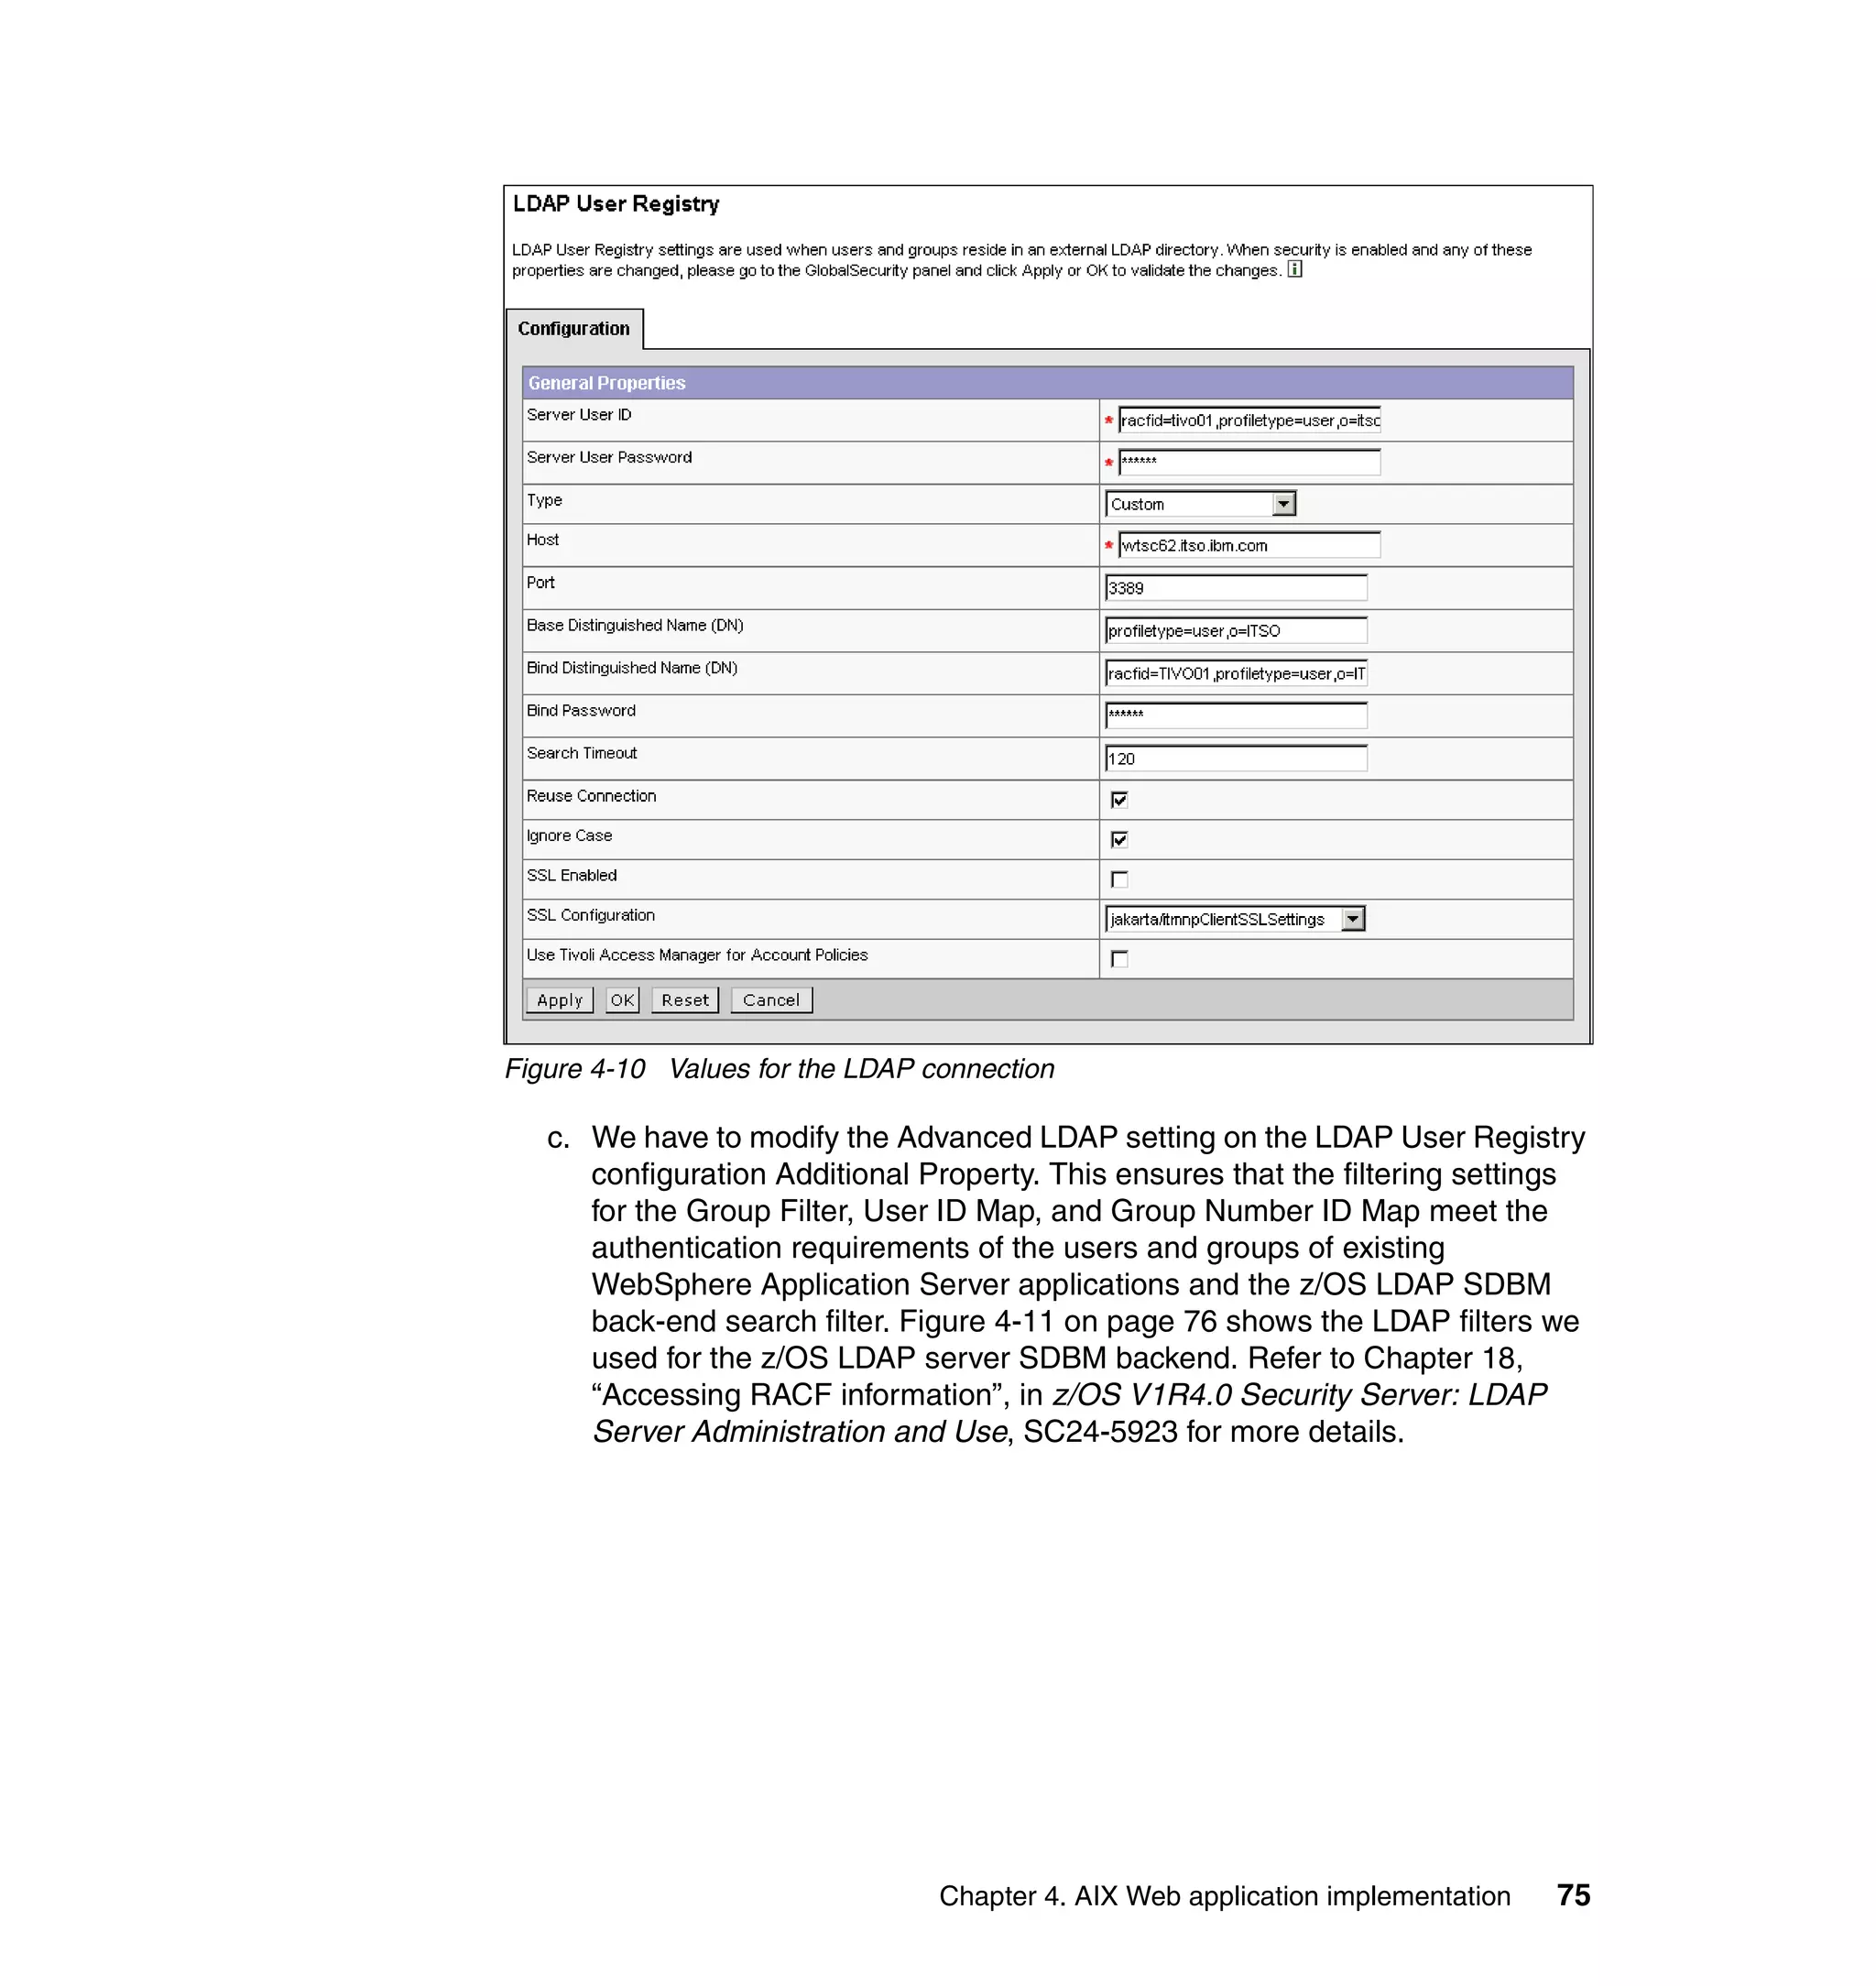
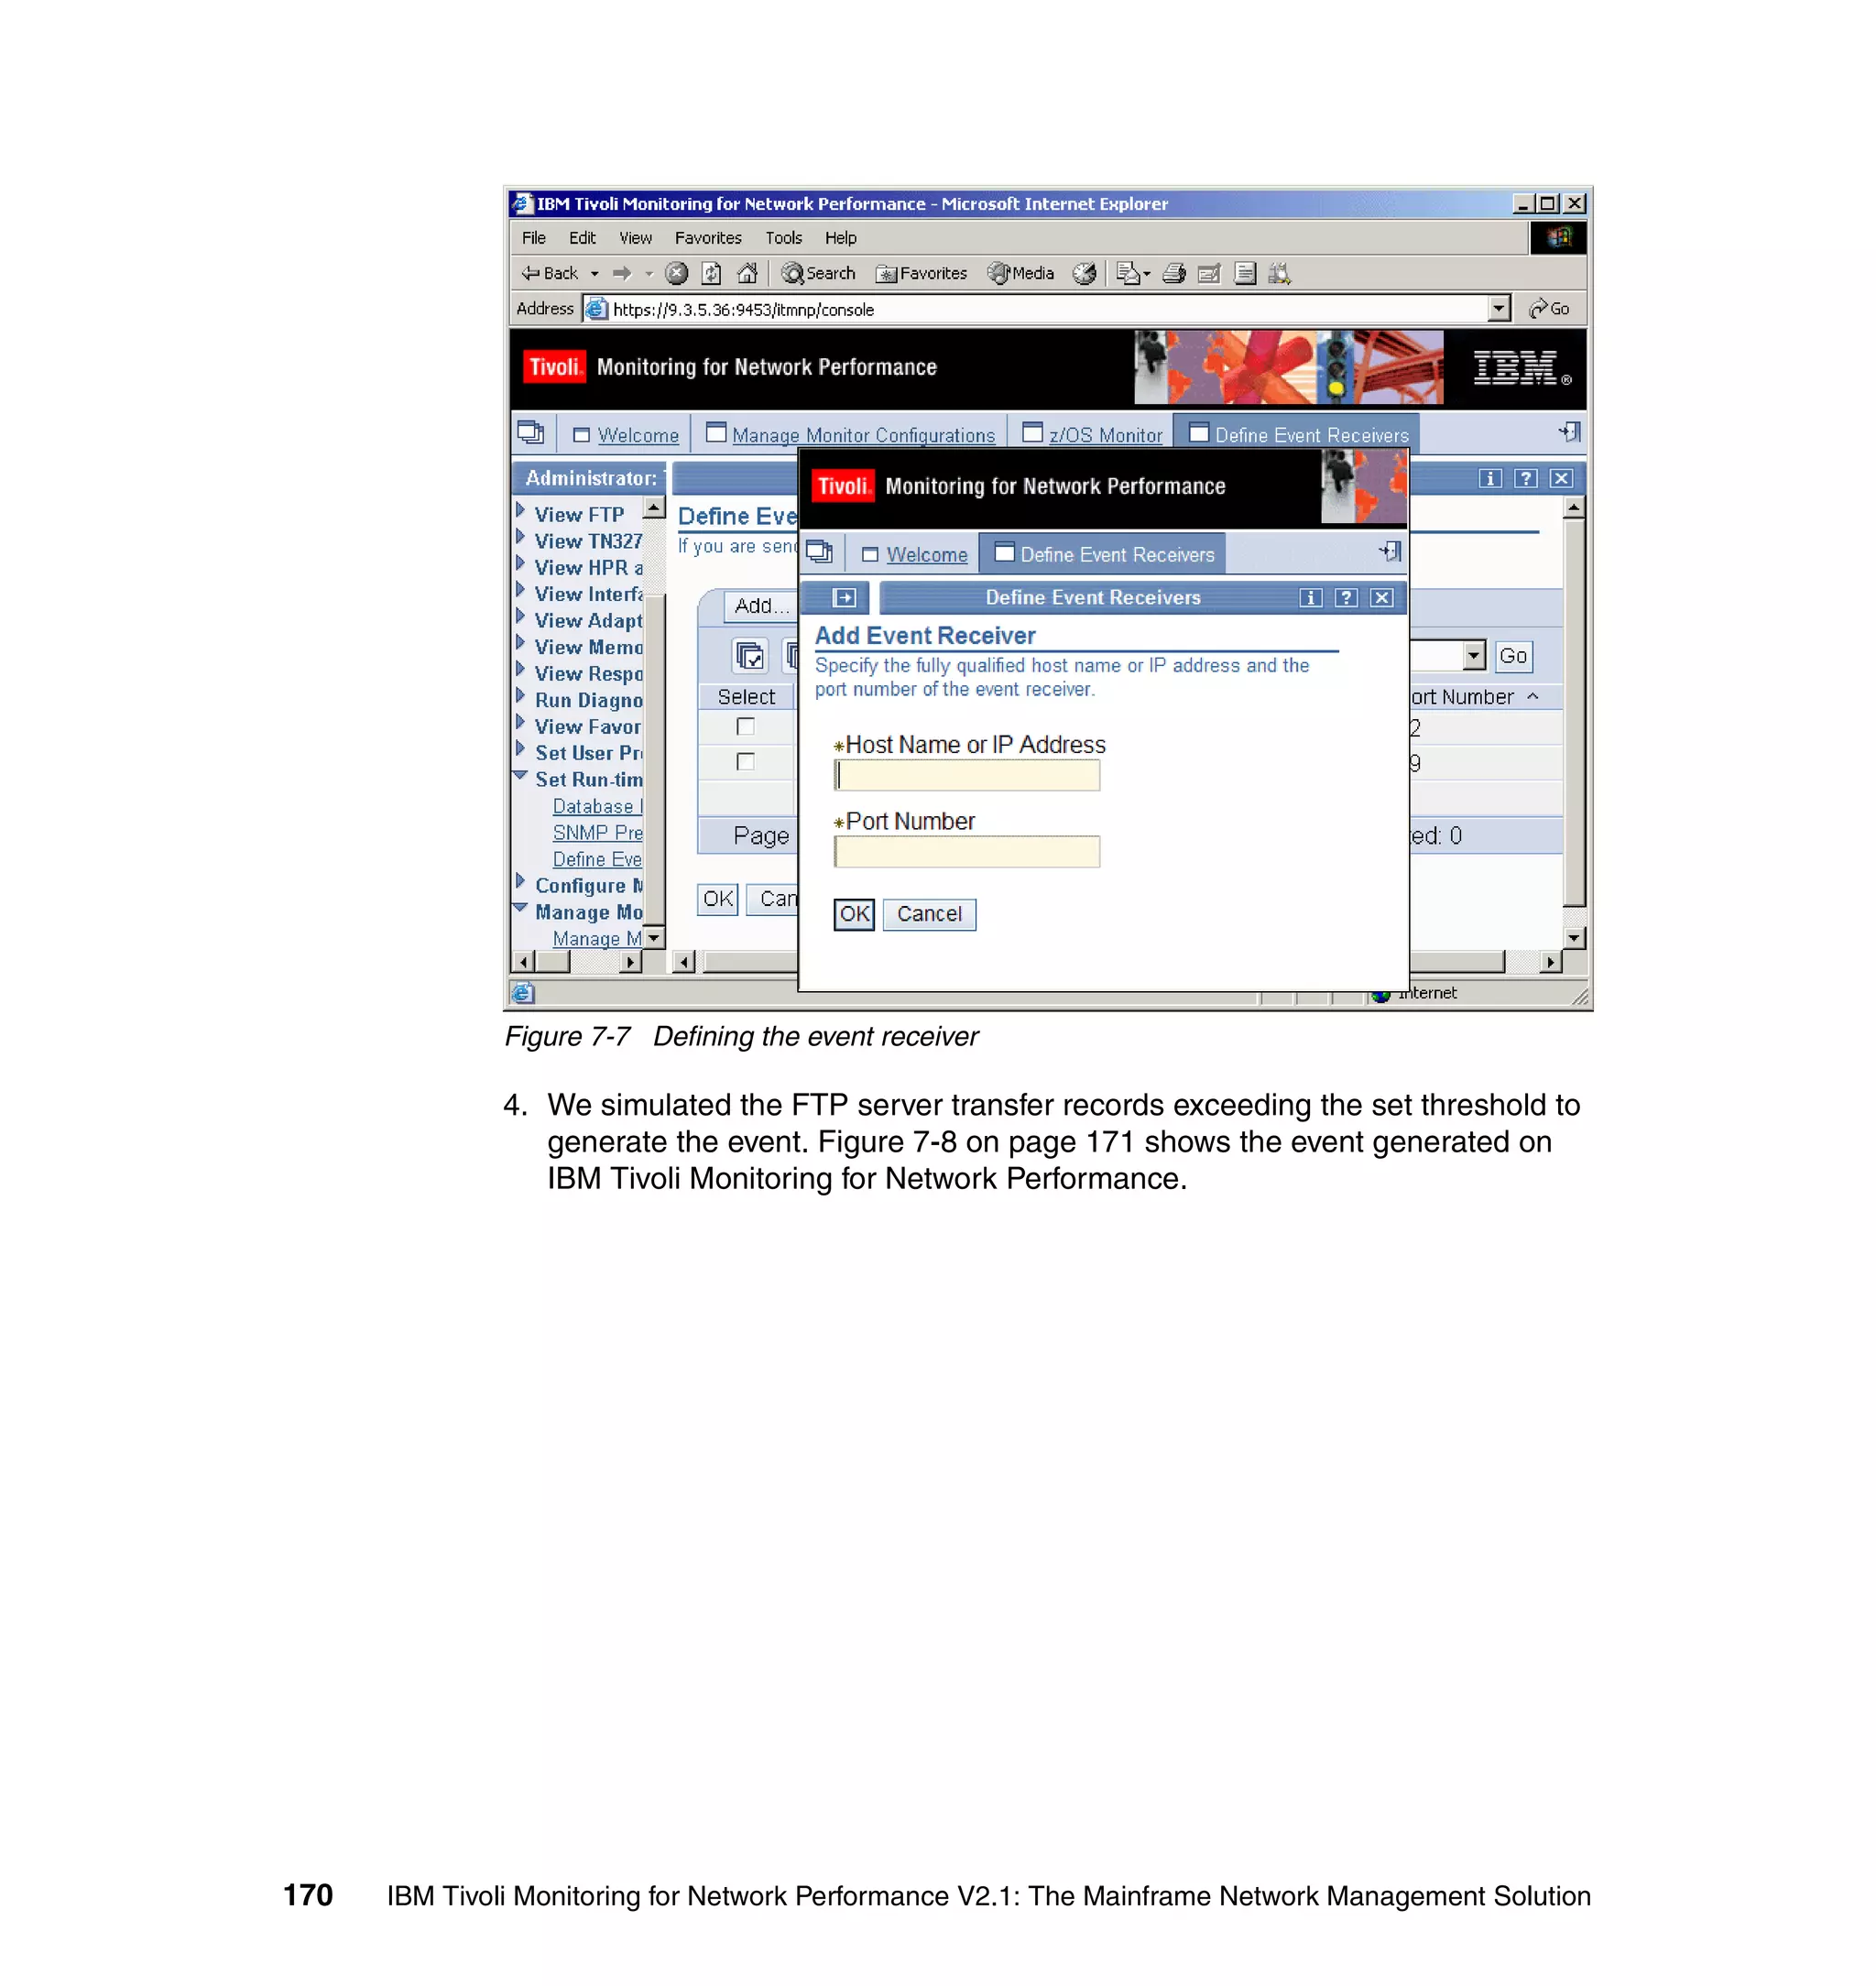
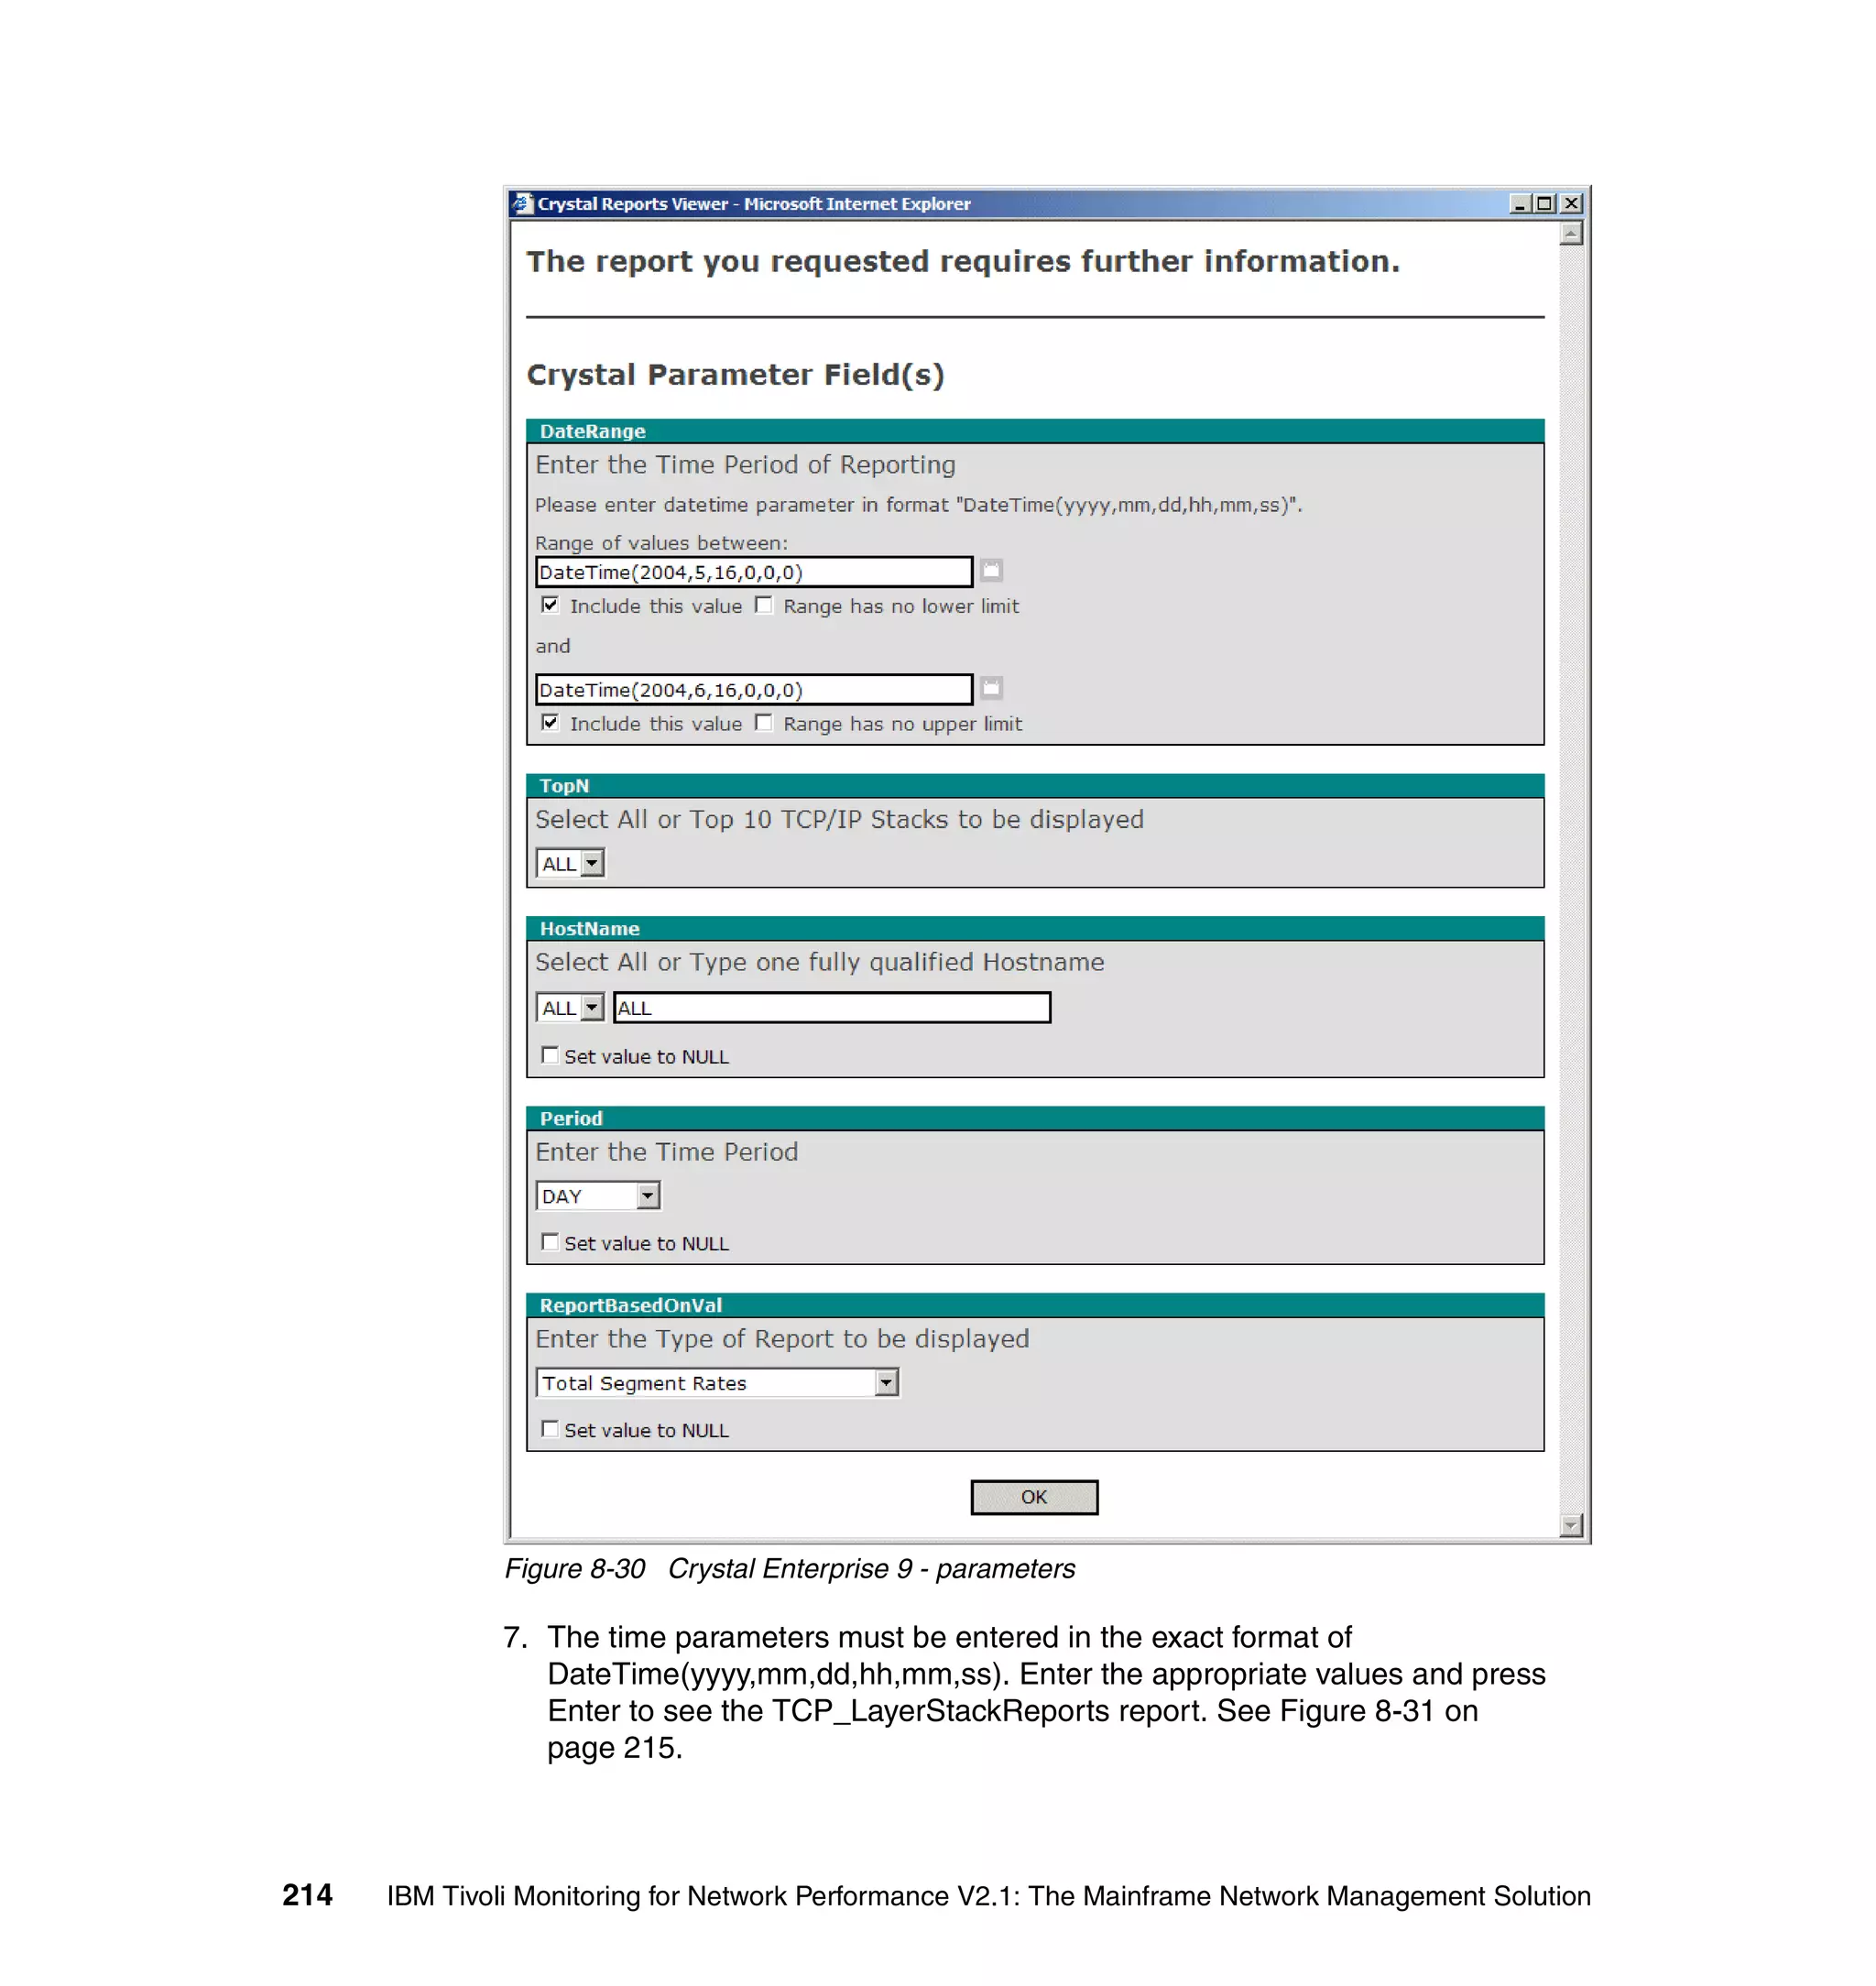
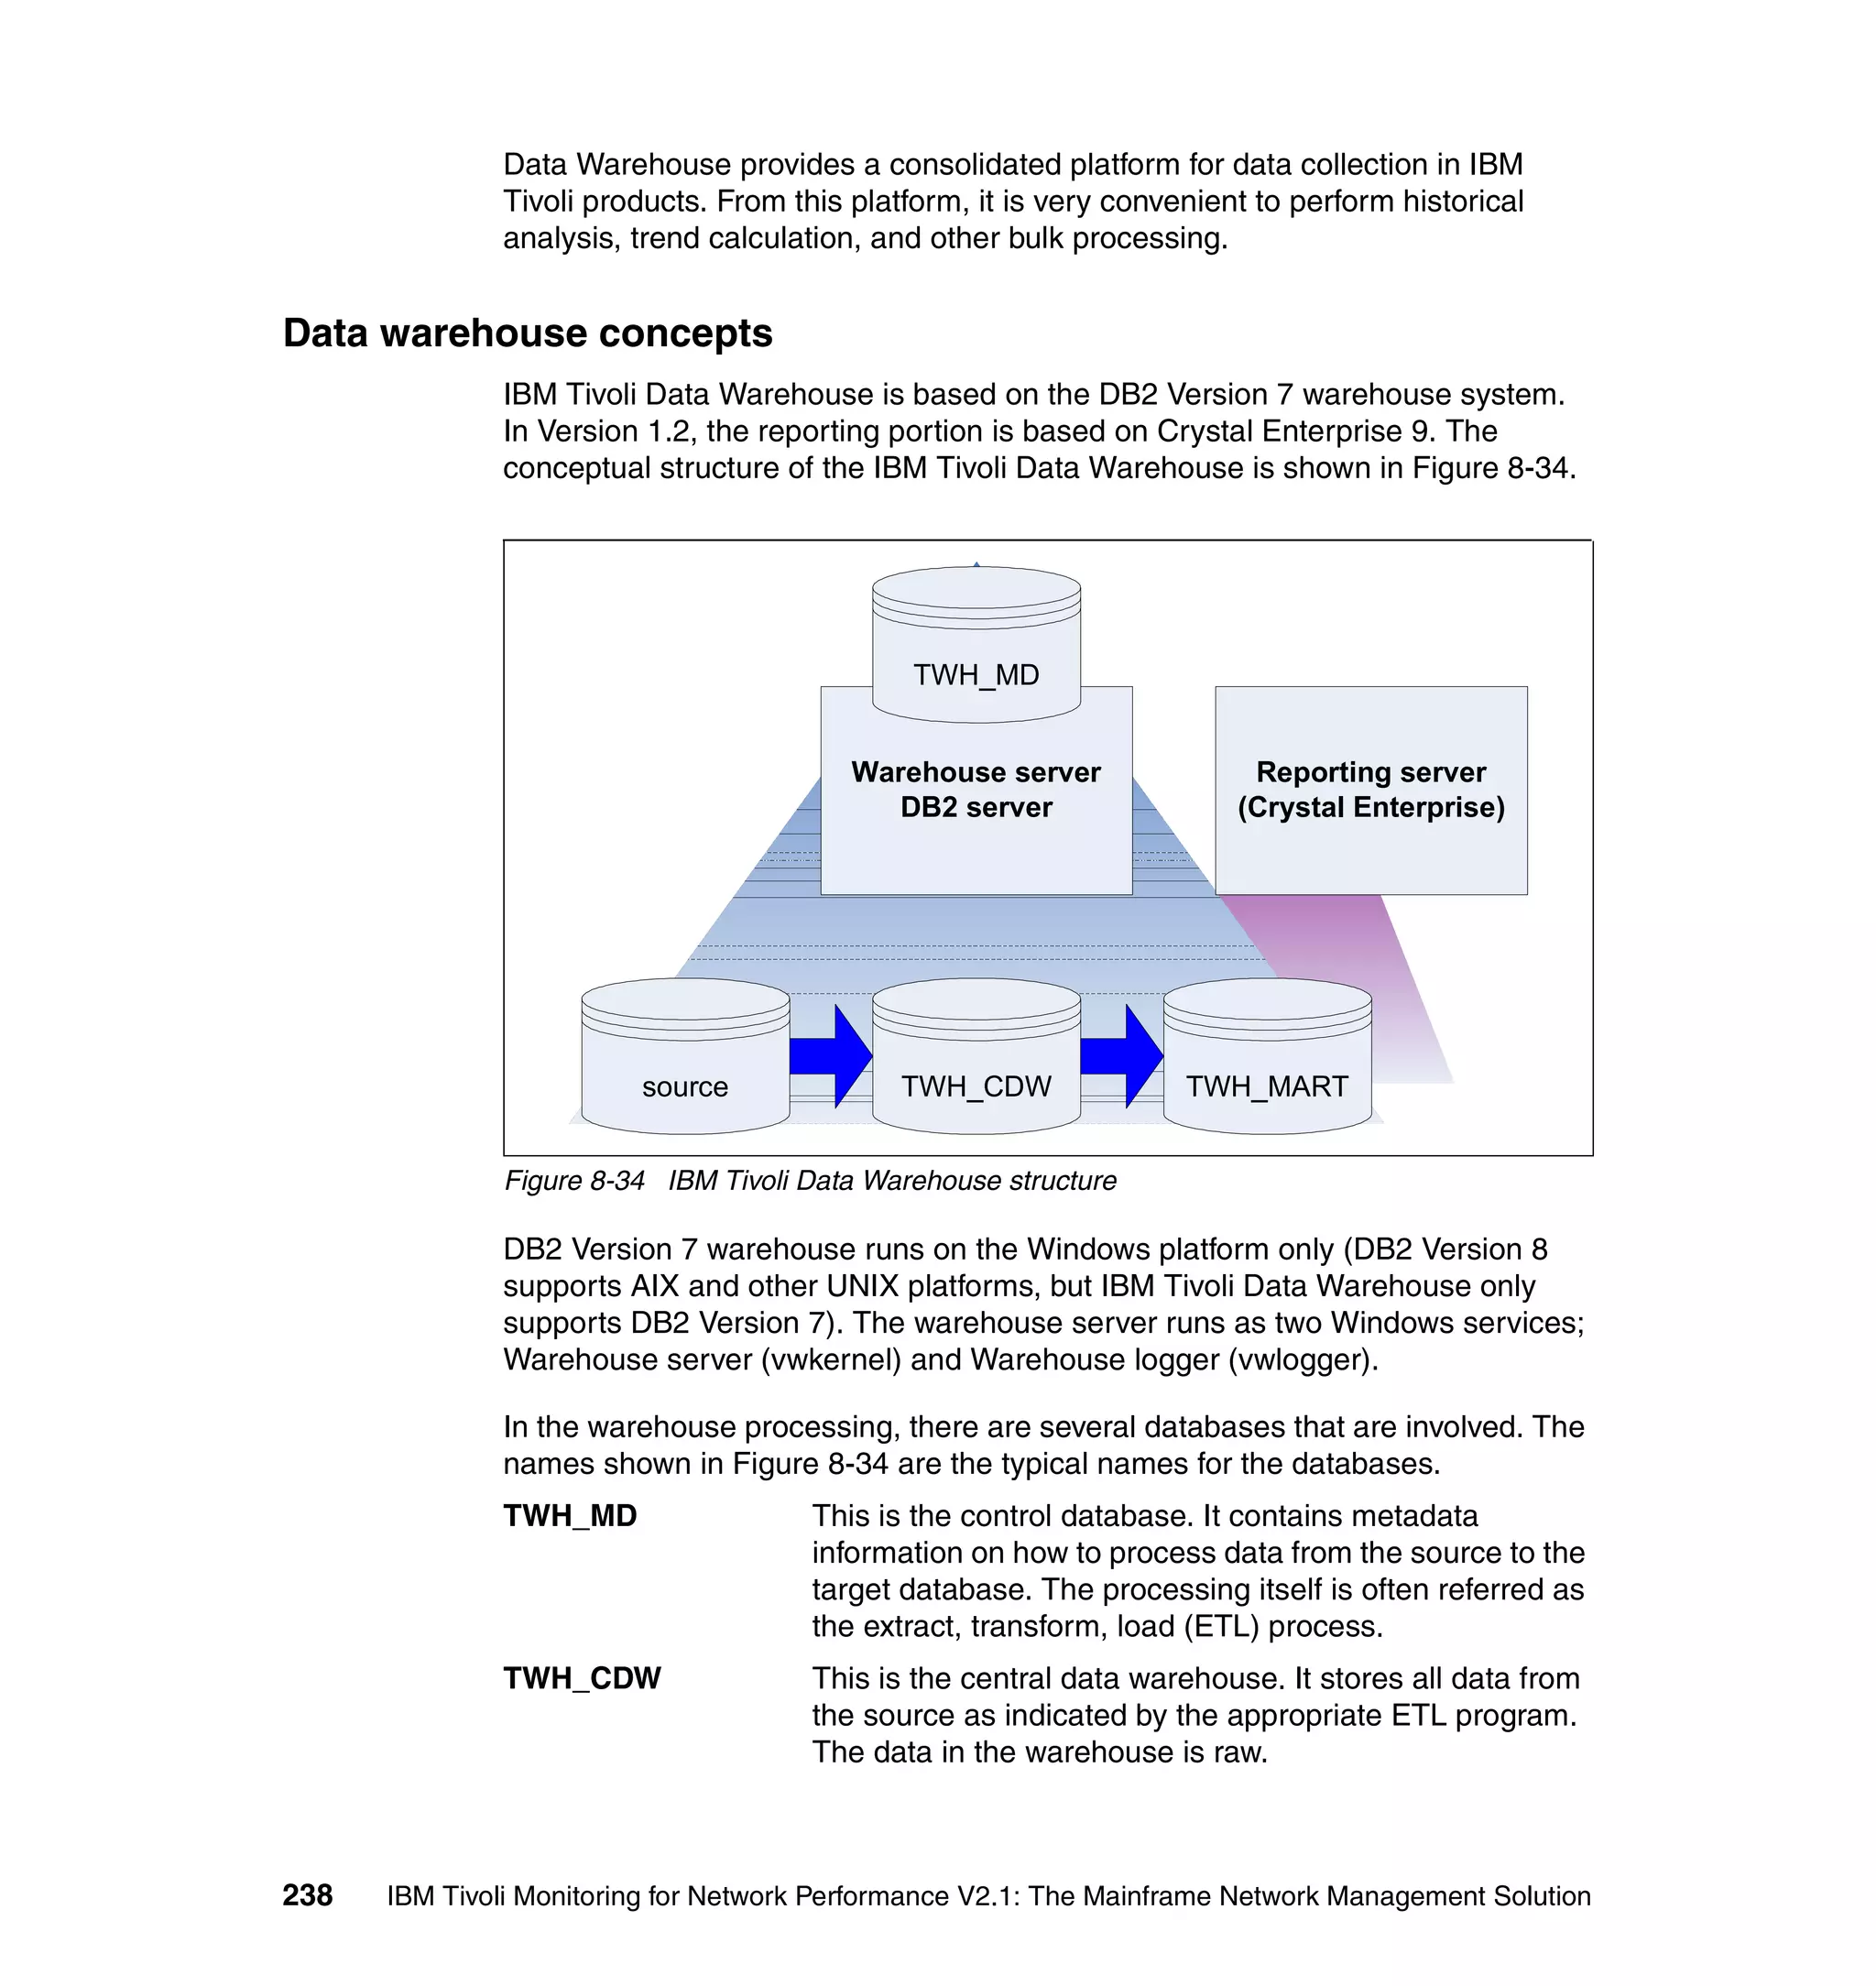
Figure 4-3 Group menu
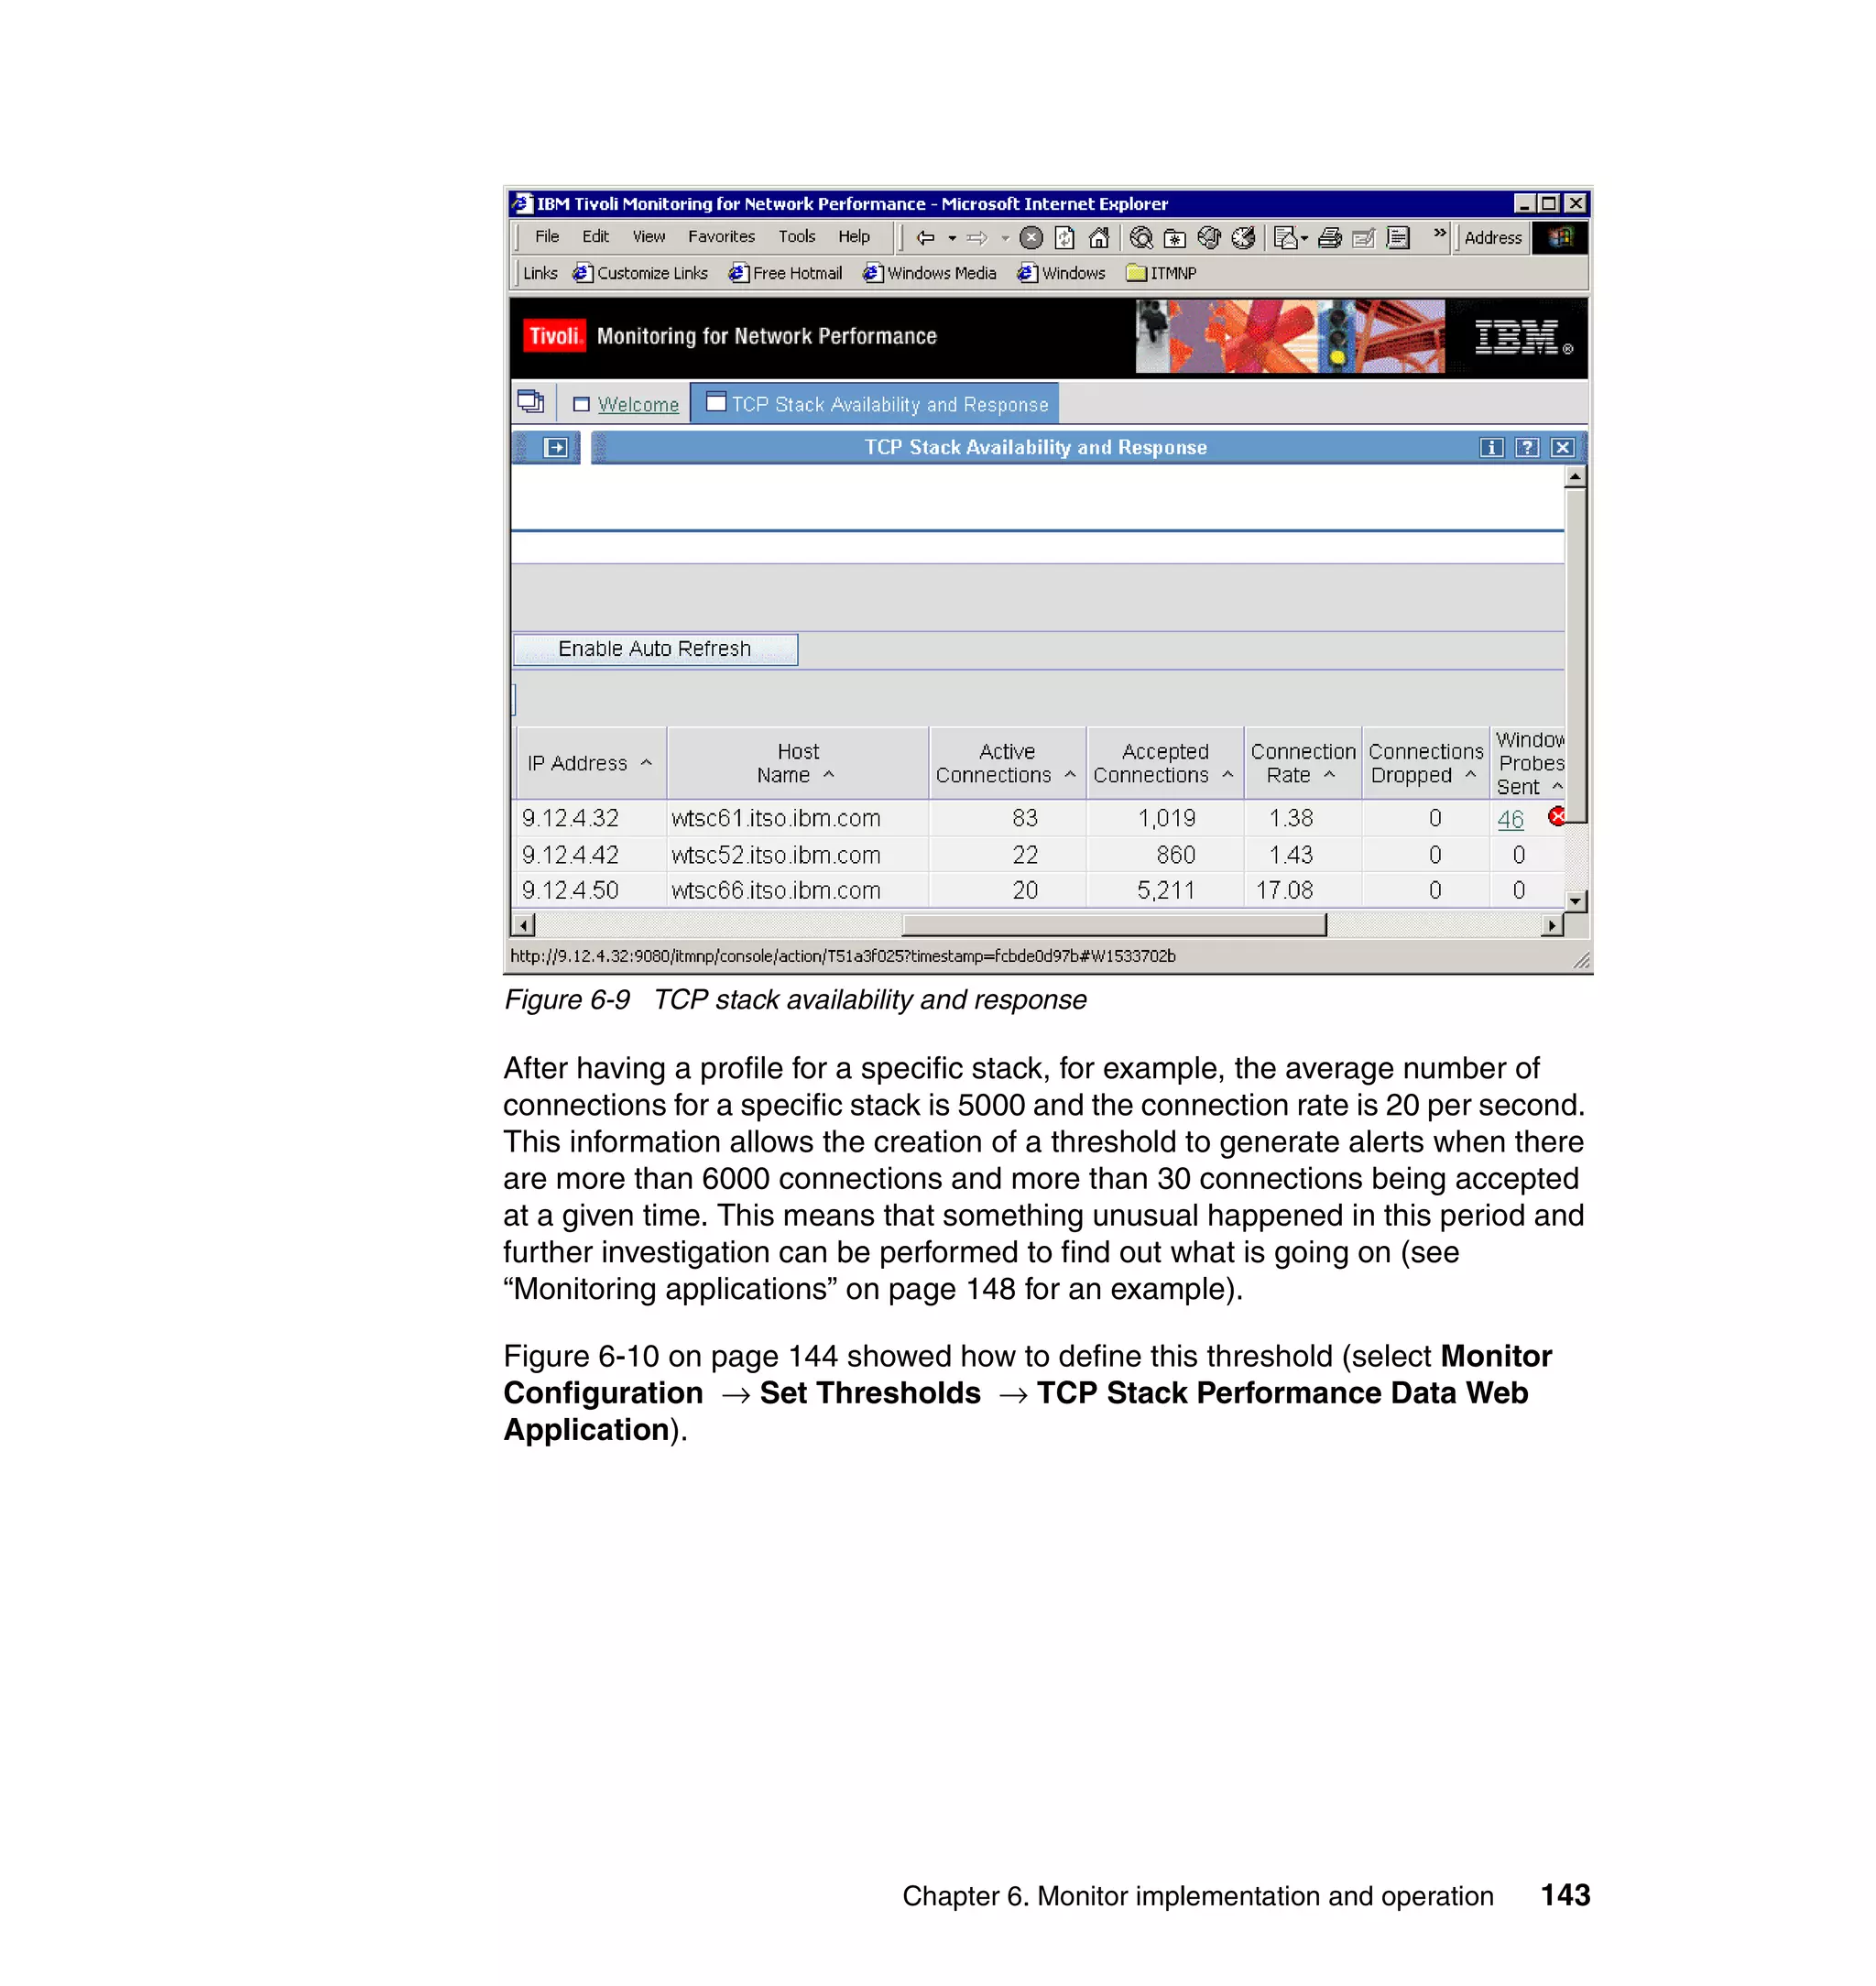
2. Choose Add a Group and press Enter. The Add Group dialog is shown in
Figure 4-4.
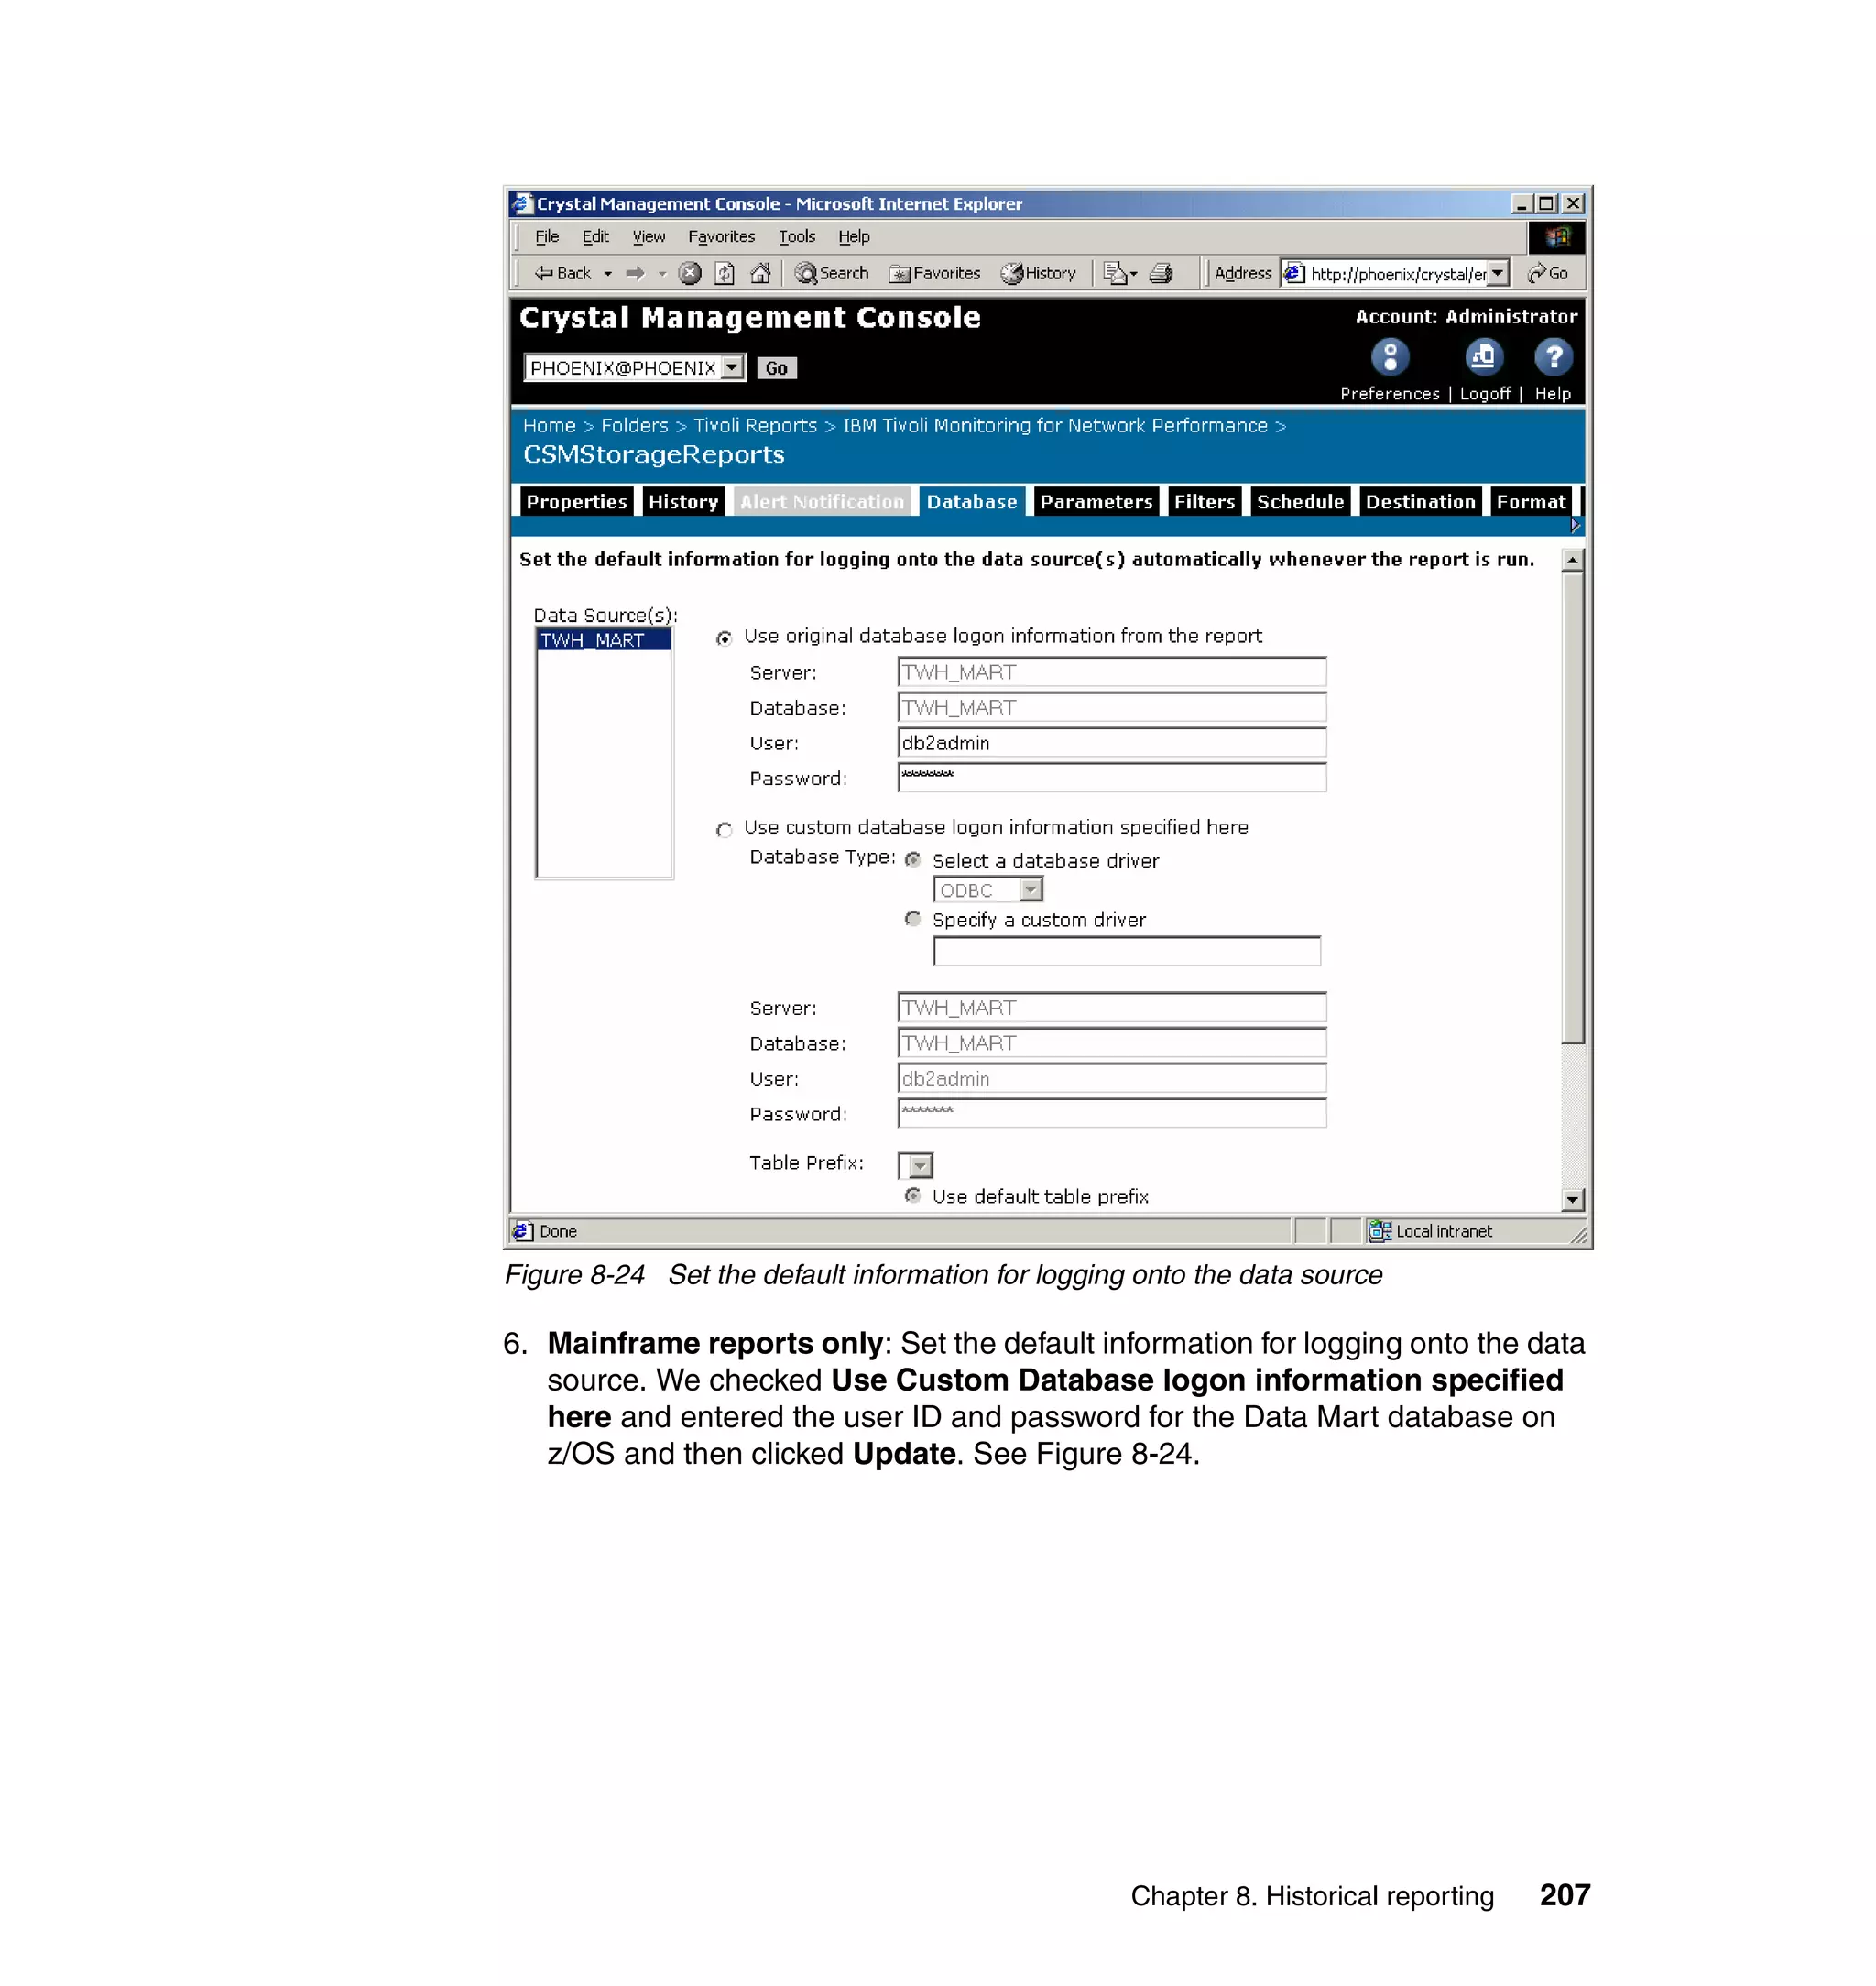
Add a Group
Type or select values in entry fields.
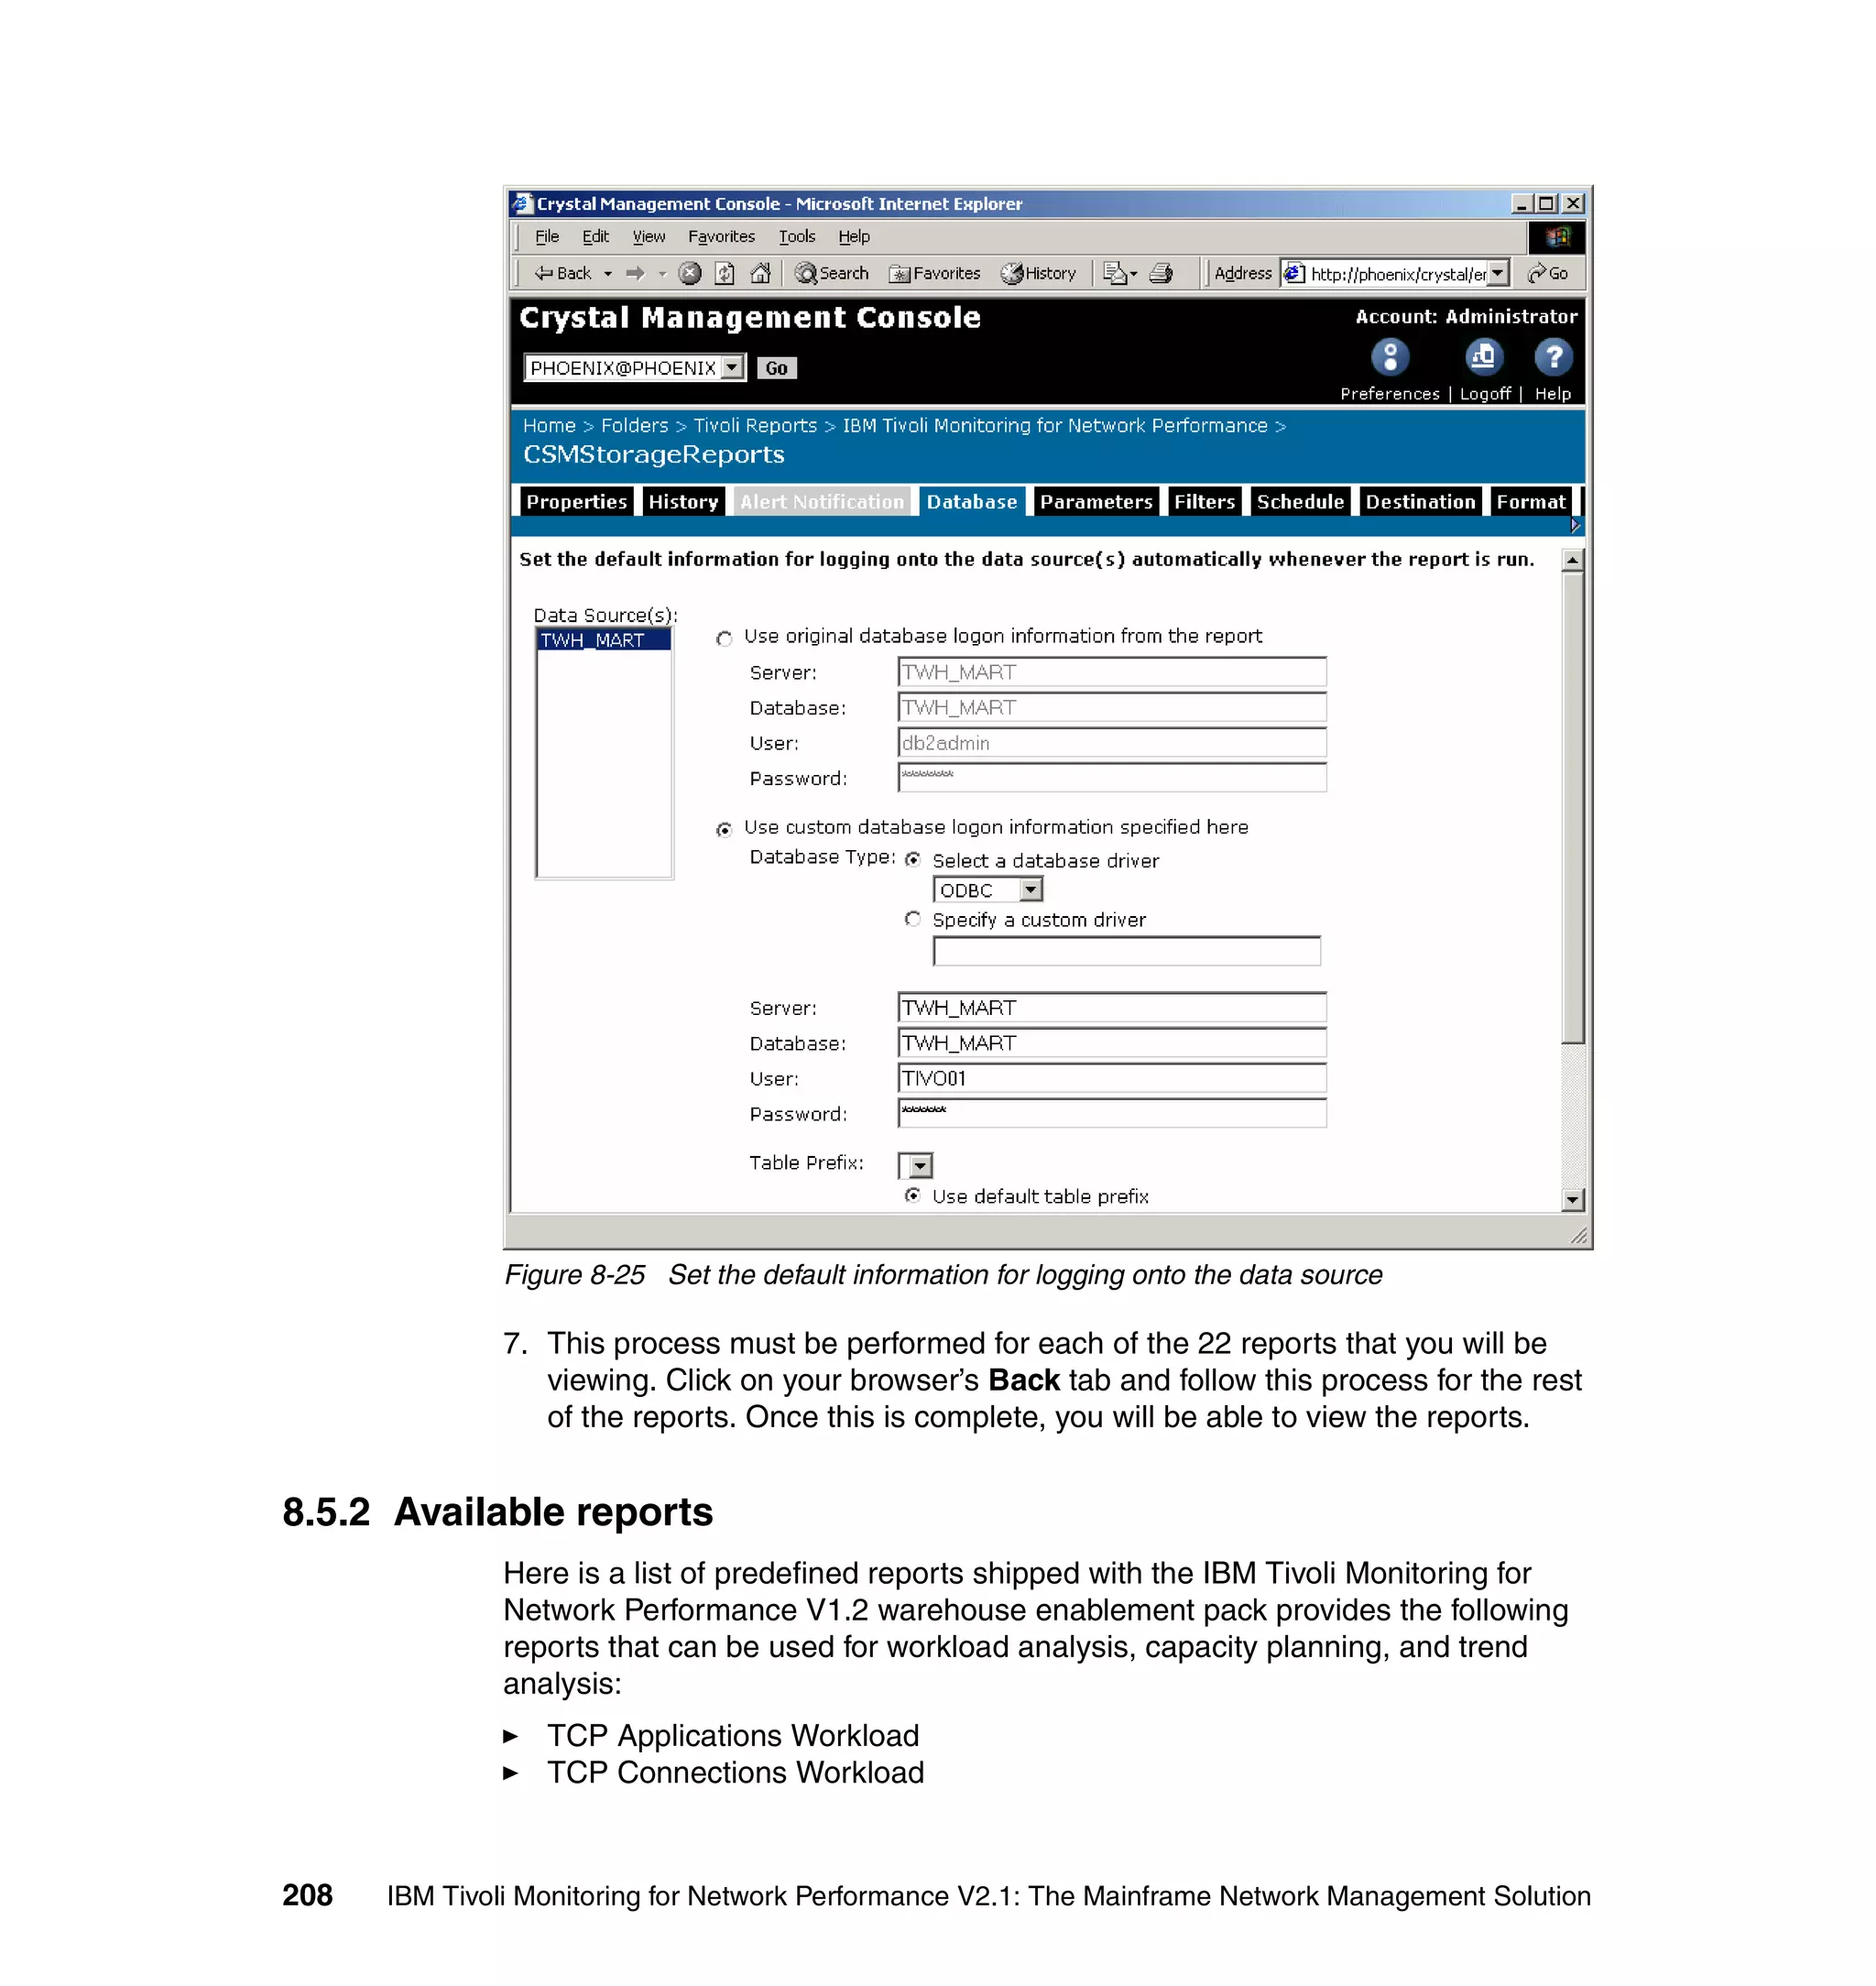
Press Enter AFTER making all desired changes.
[Entry Fields]
* Group NAME [mqm]
ADMINISTRATIVE group? false +
Group ID [] #
USER list [root] +
ADMINISTRATOR list [root] +
Figure 4-4 Add Group dialog
3. Specify the group name of mqm and press Enter.
4. Perform the same thing for group mqbrkrs.
5. Press Esc+0 to exit the smit display.
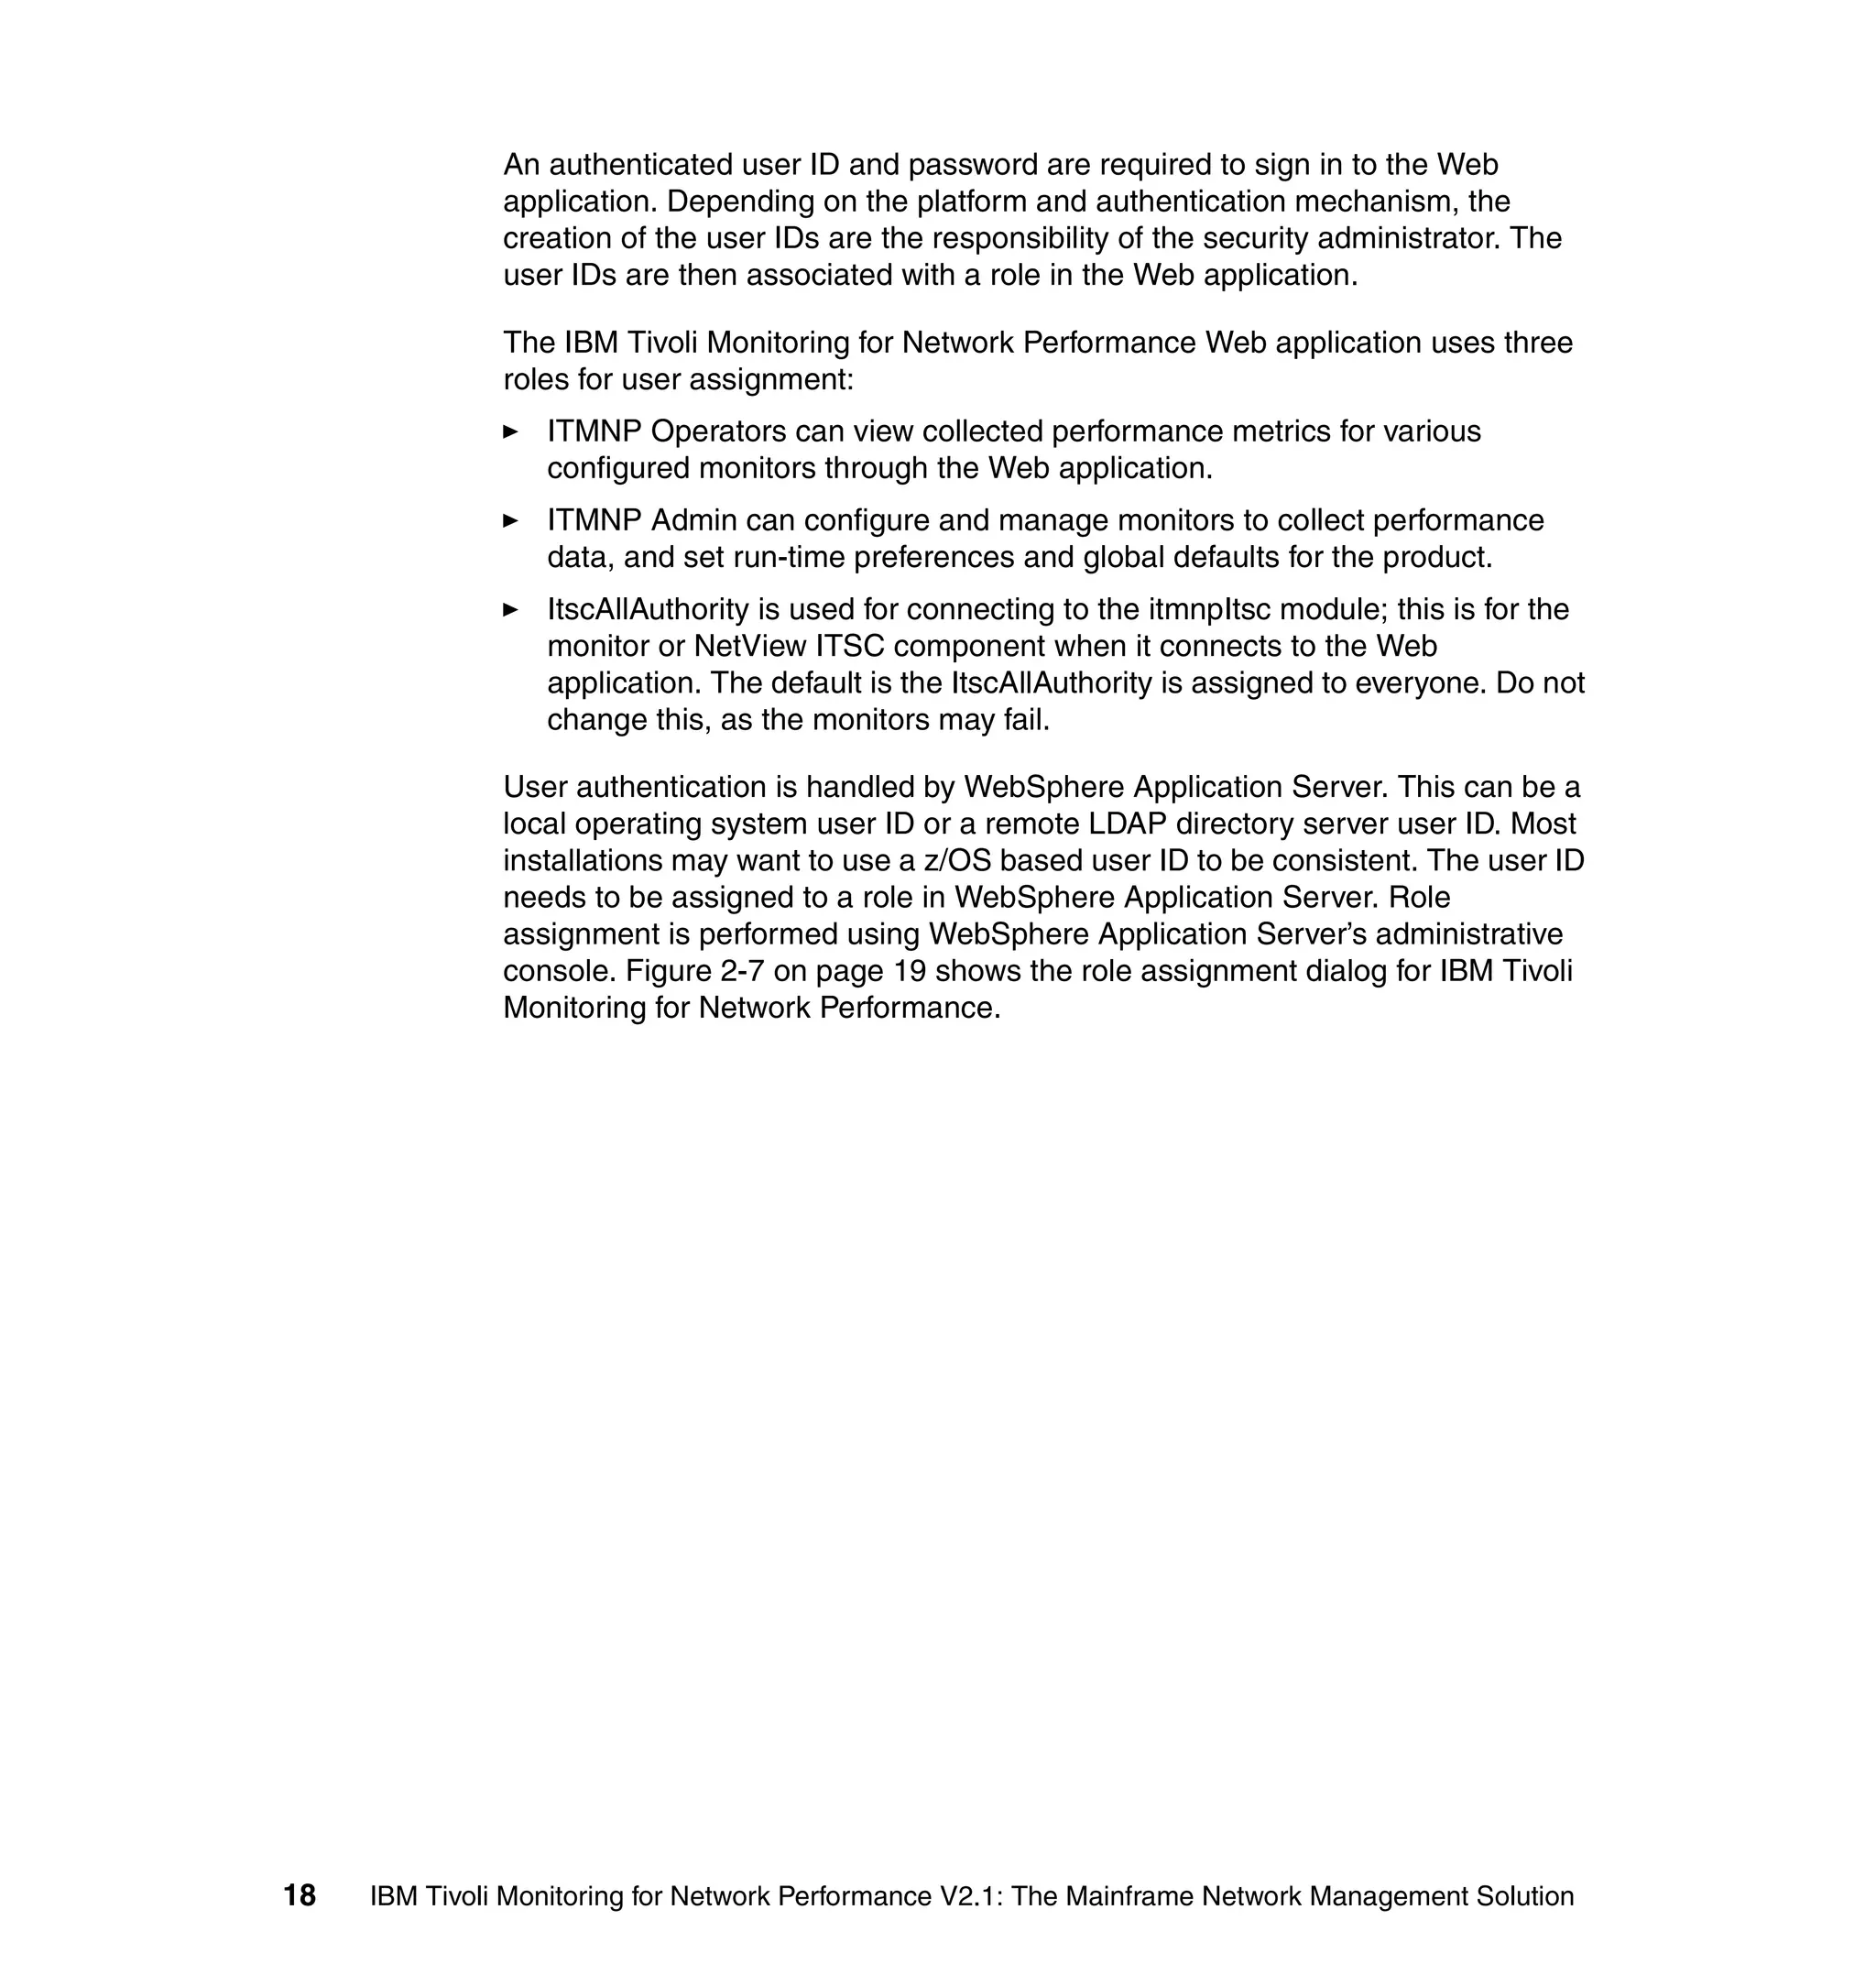
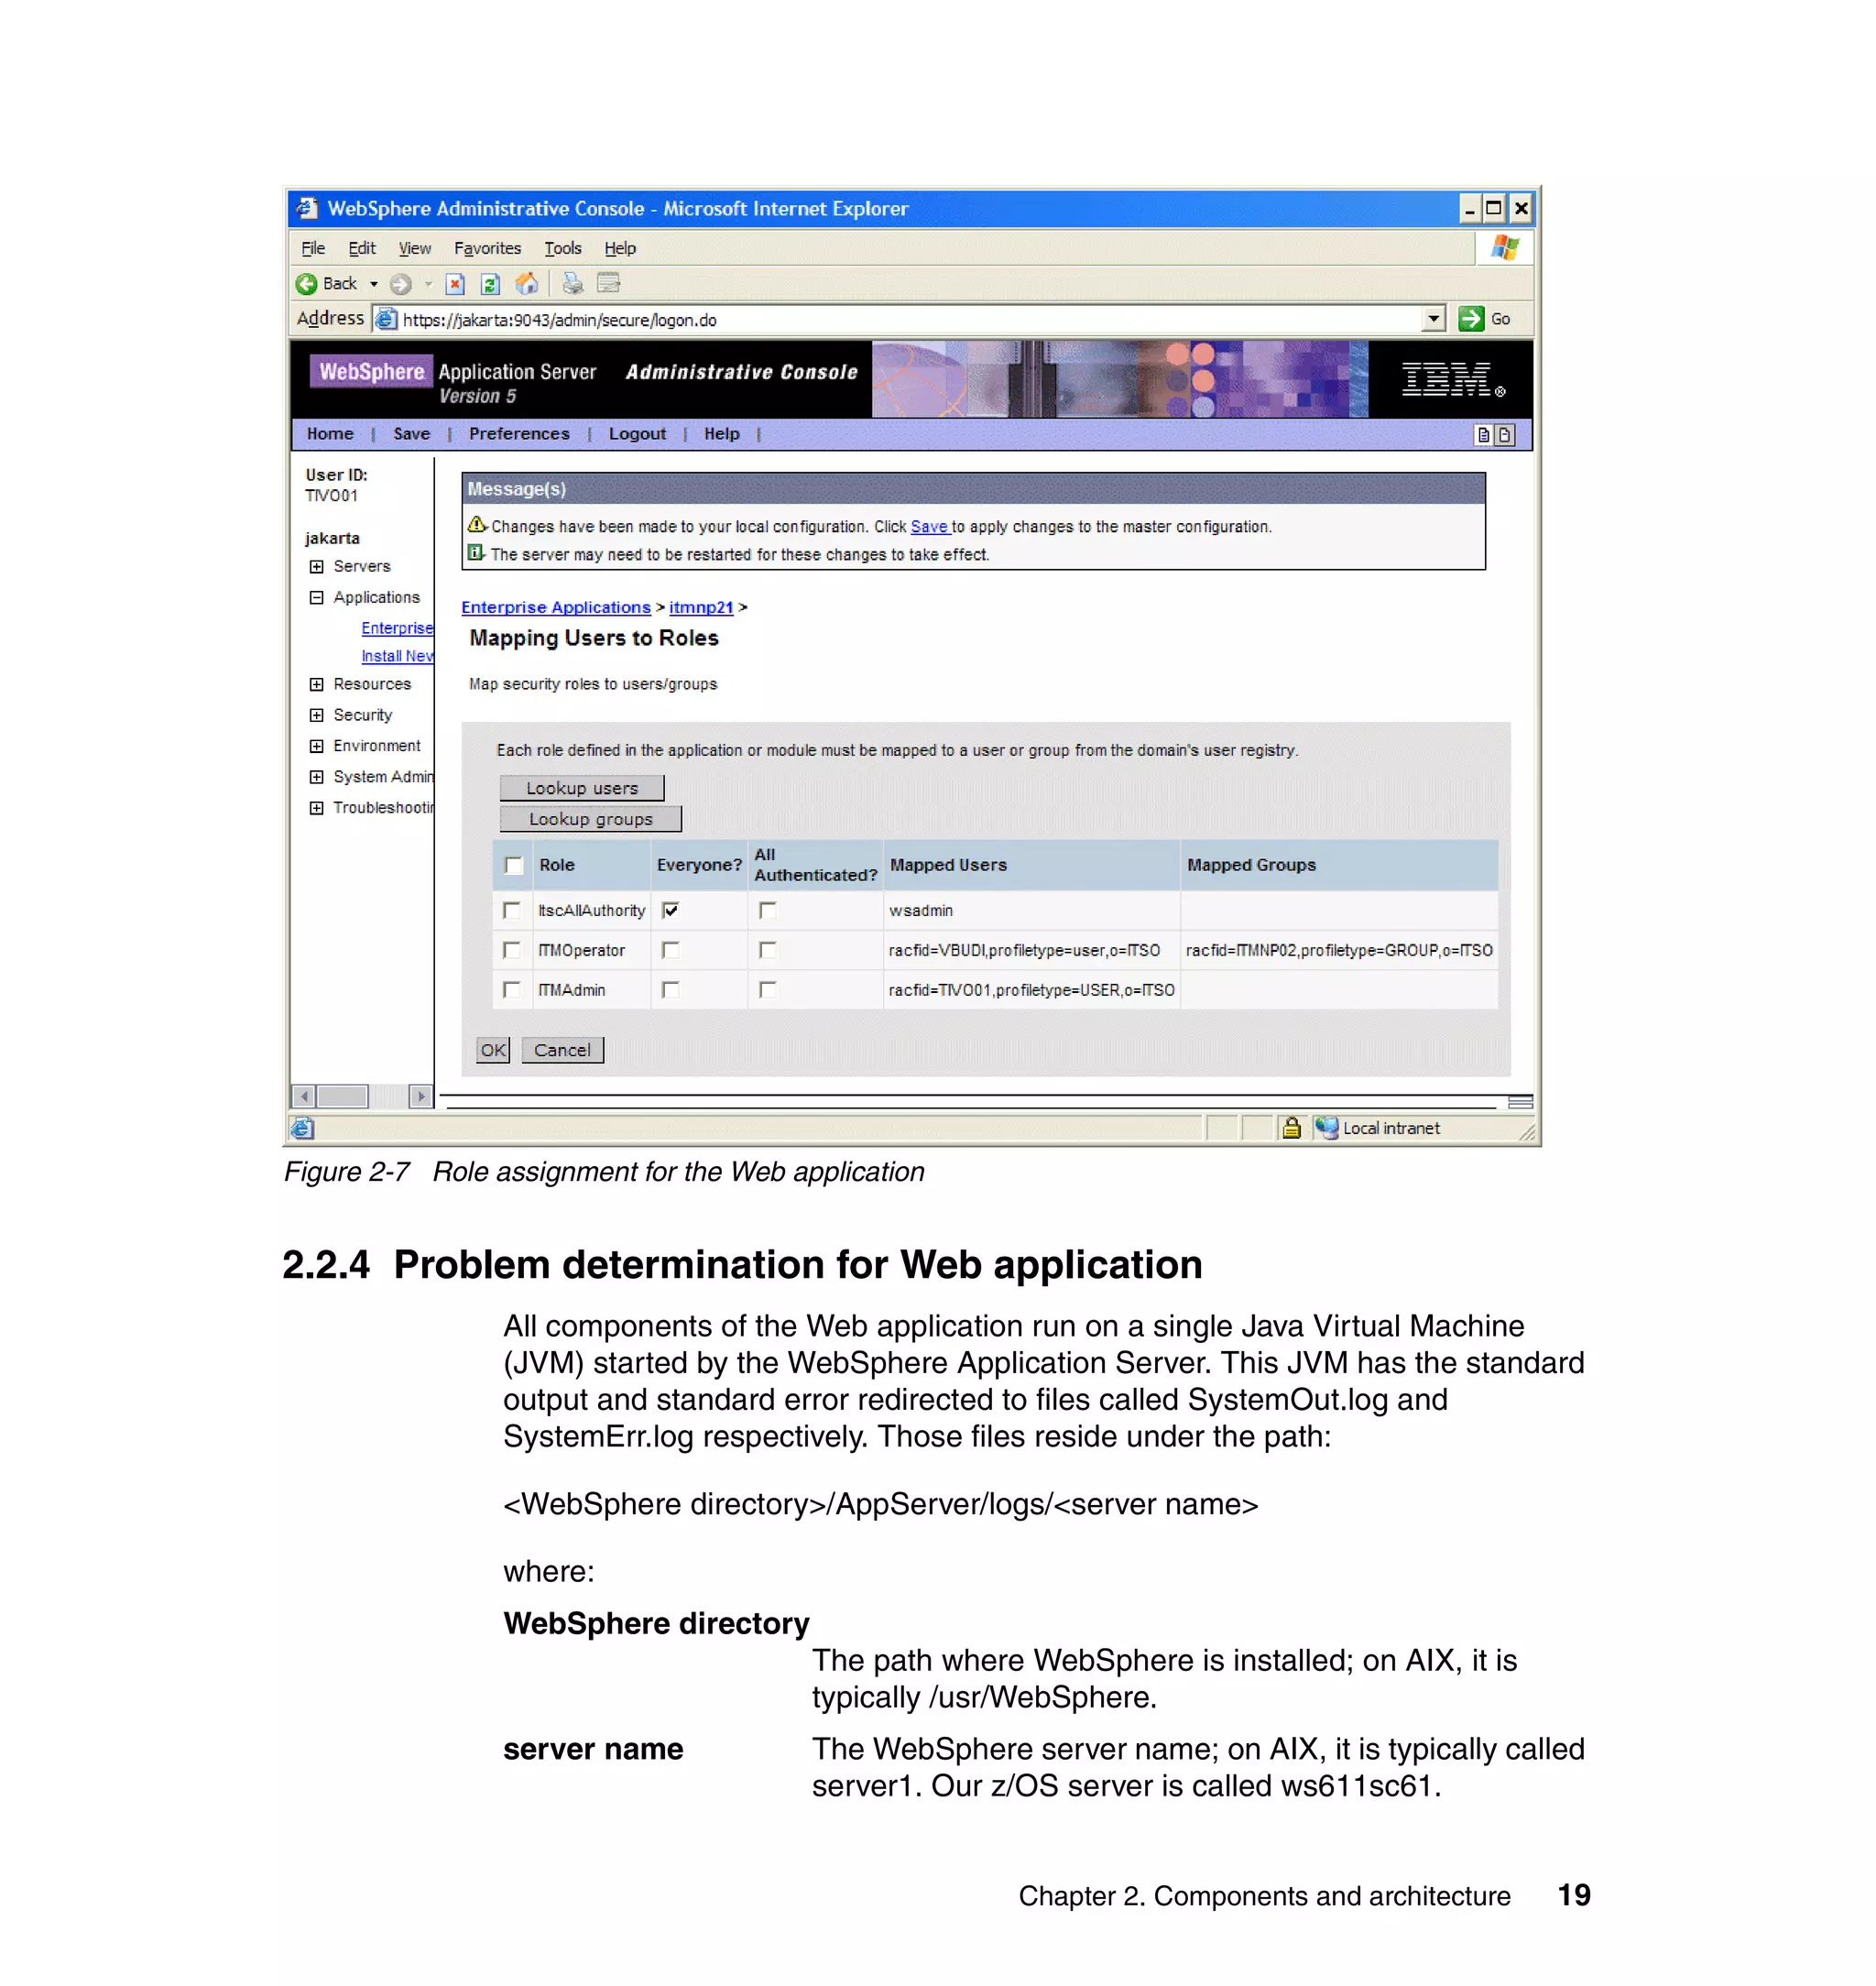
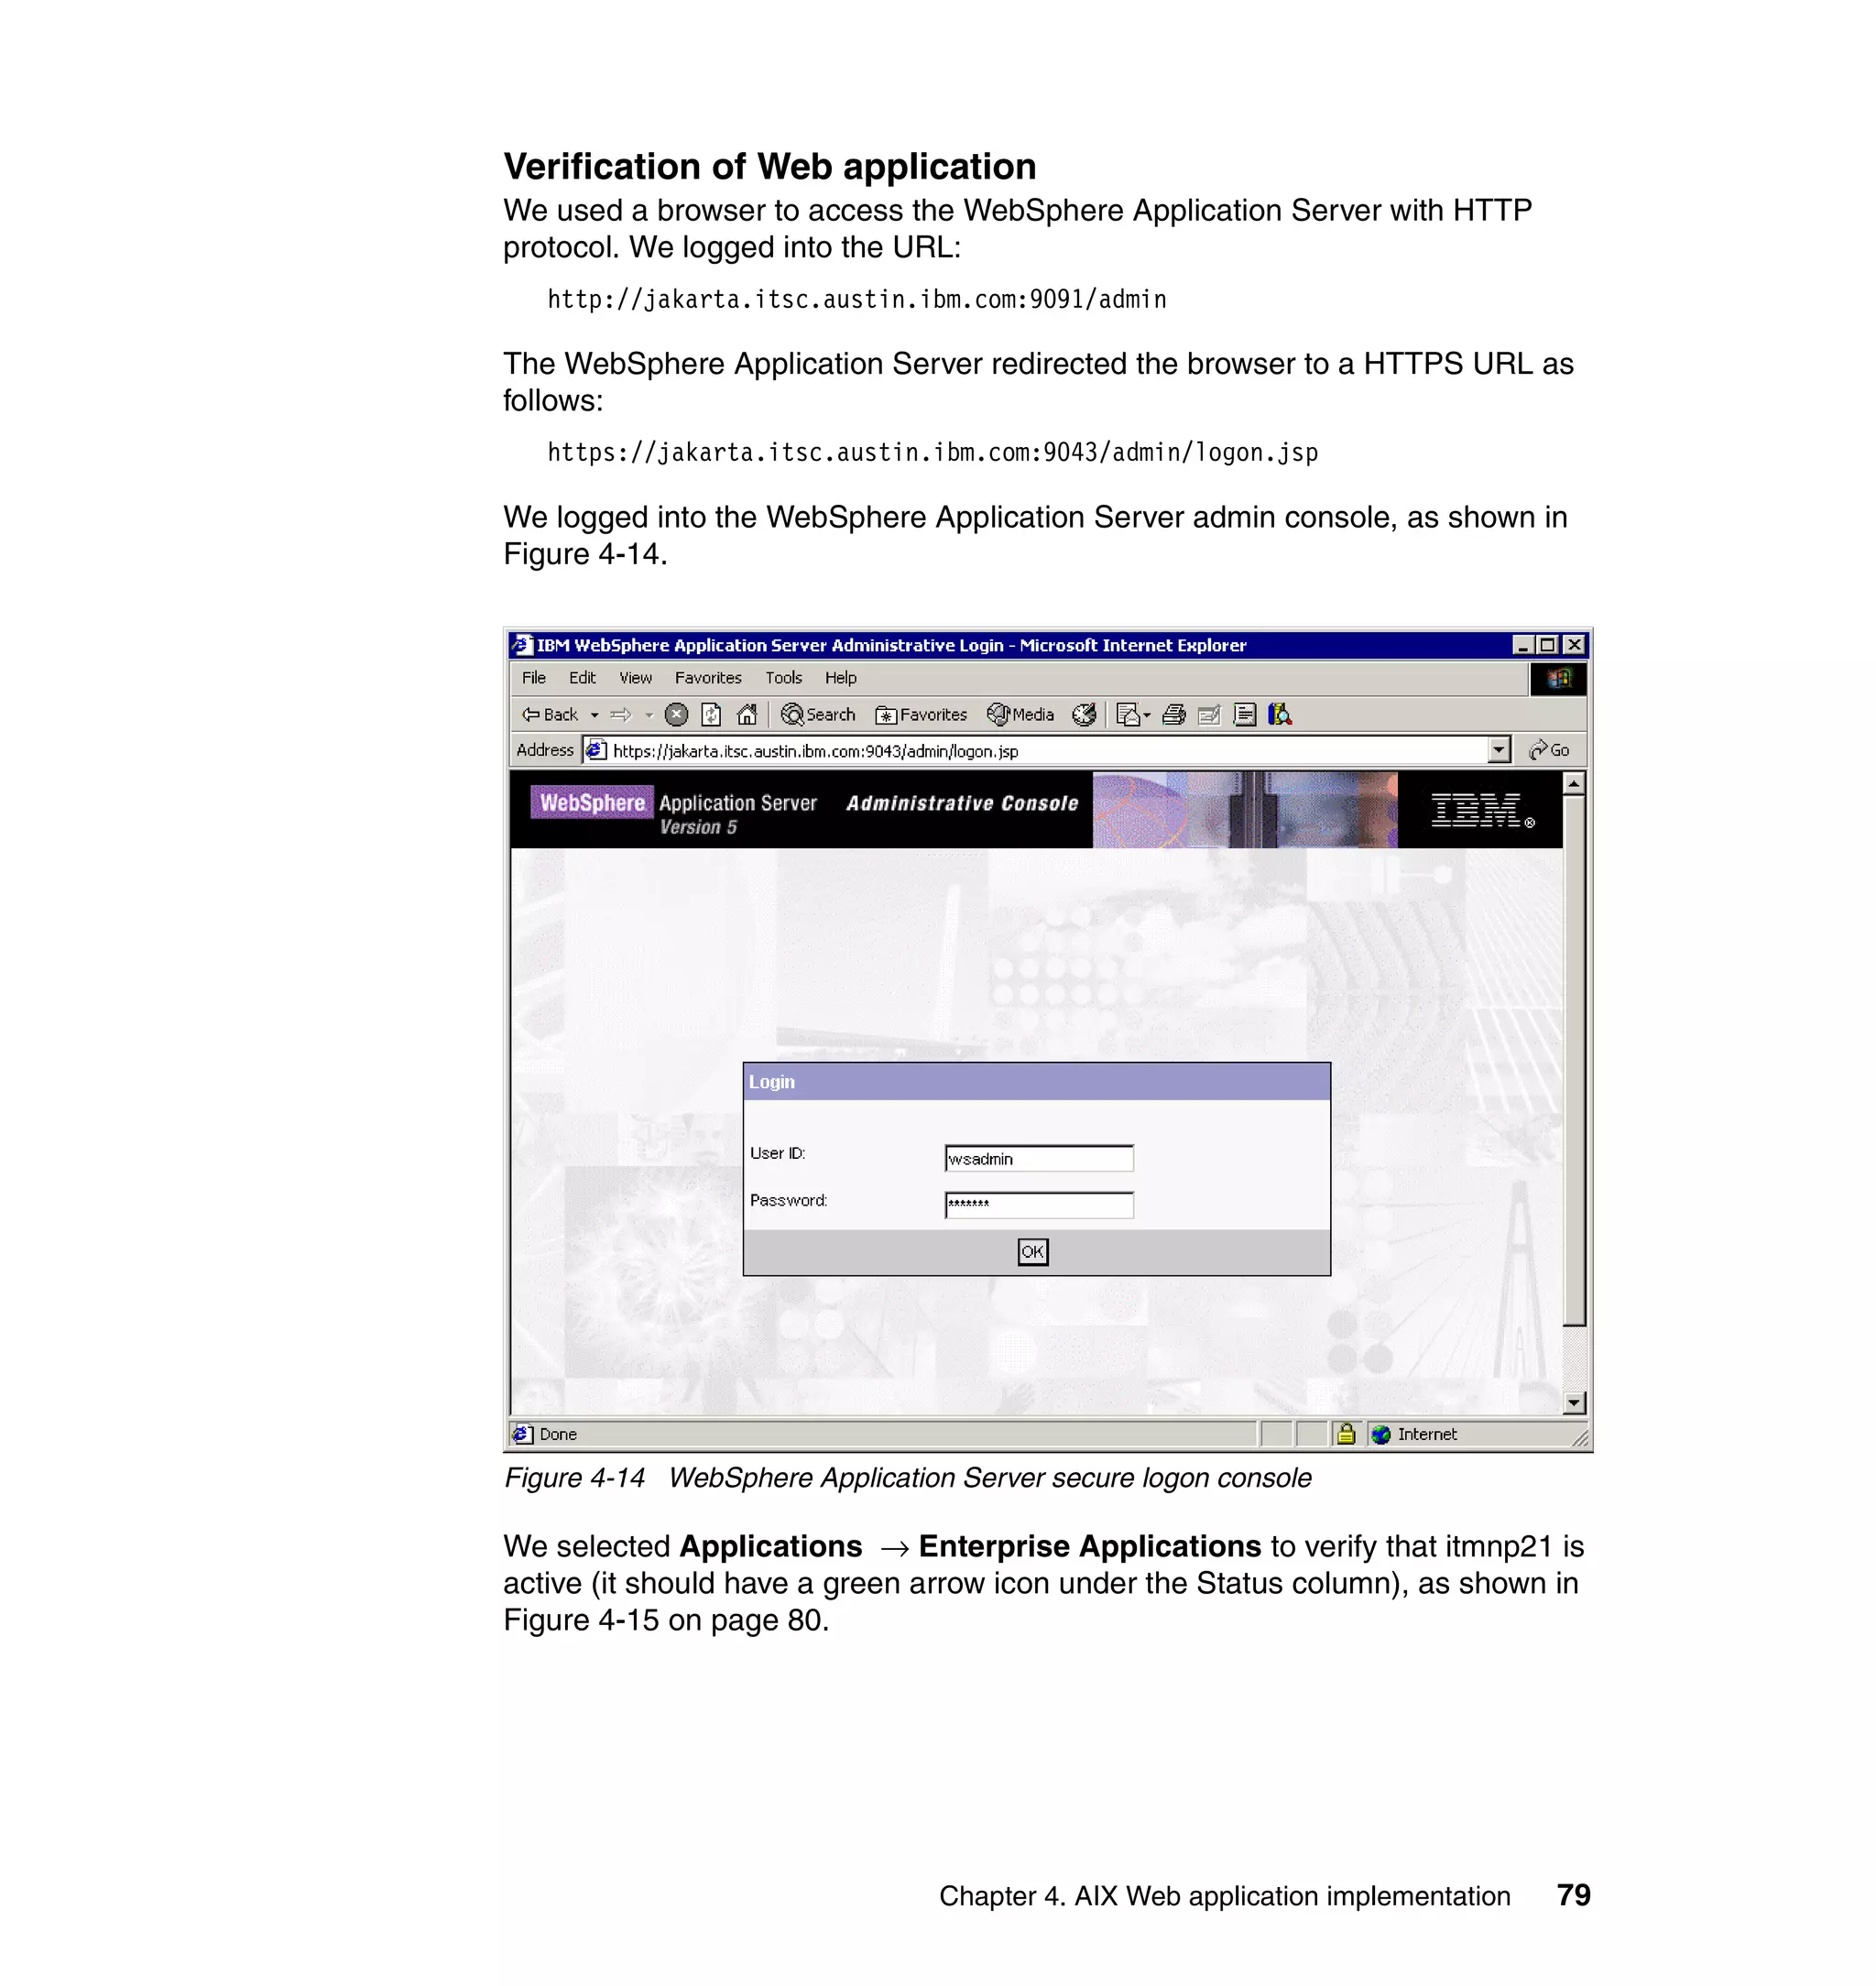
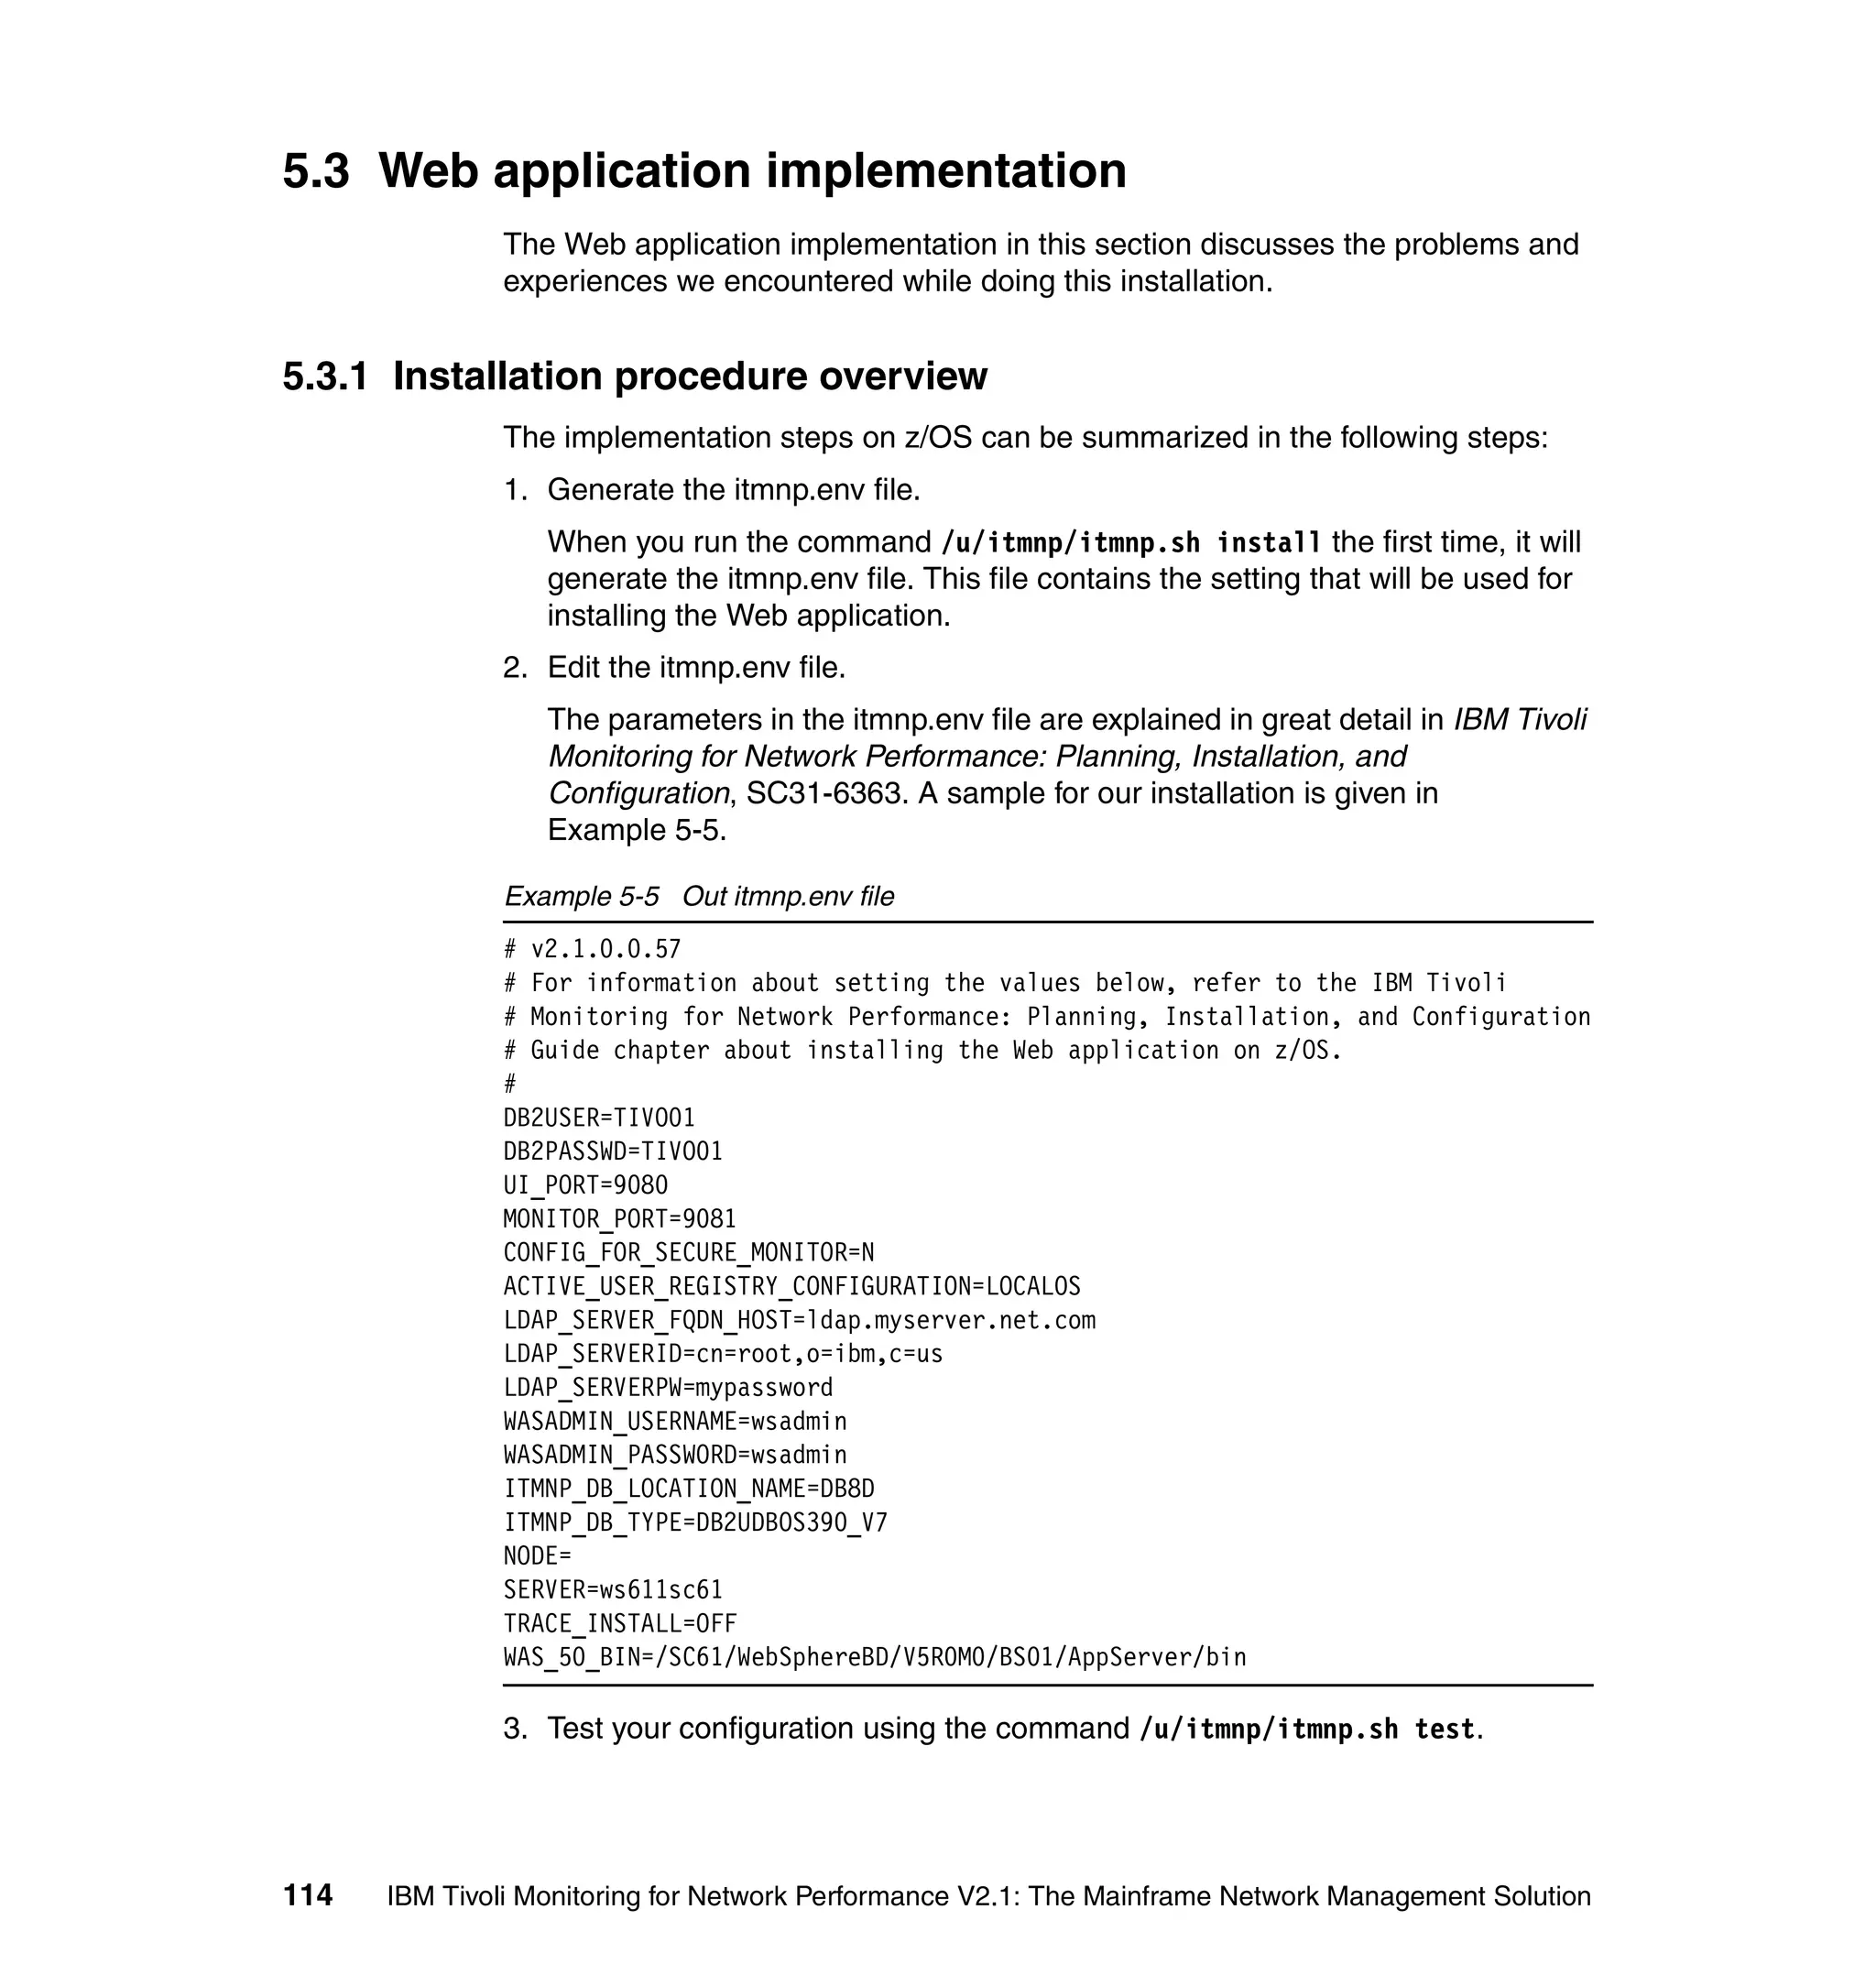
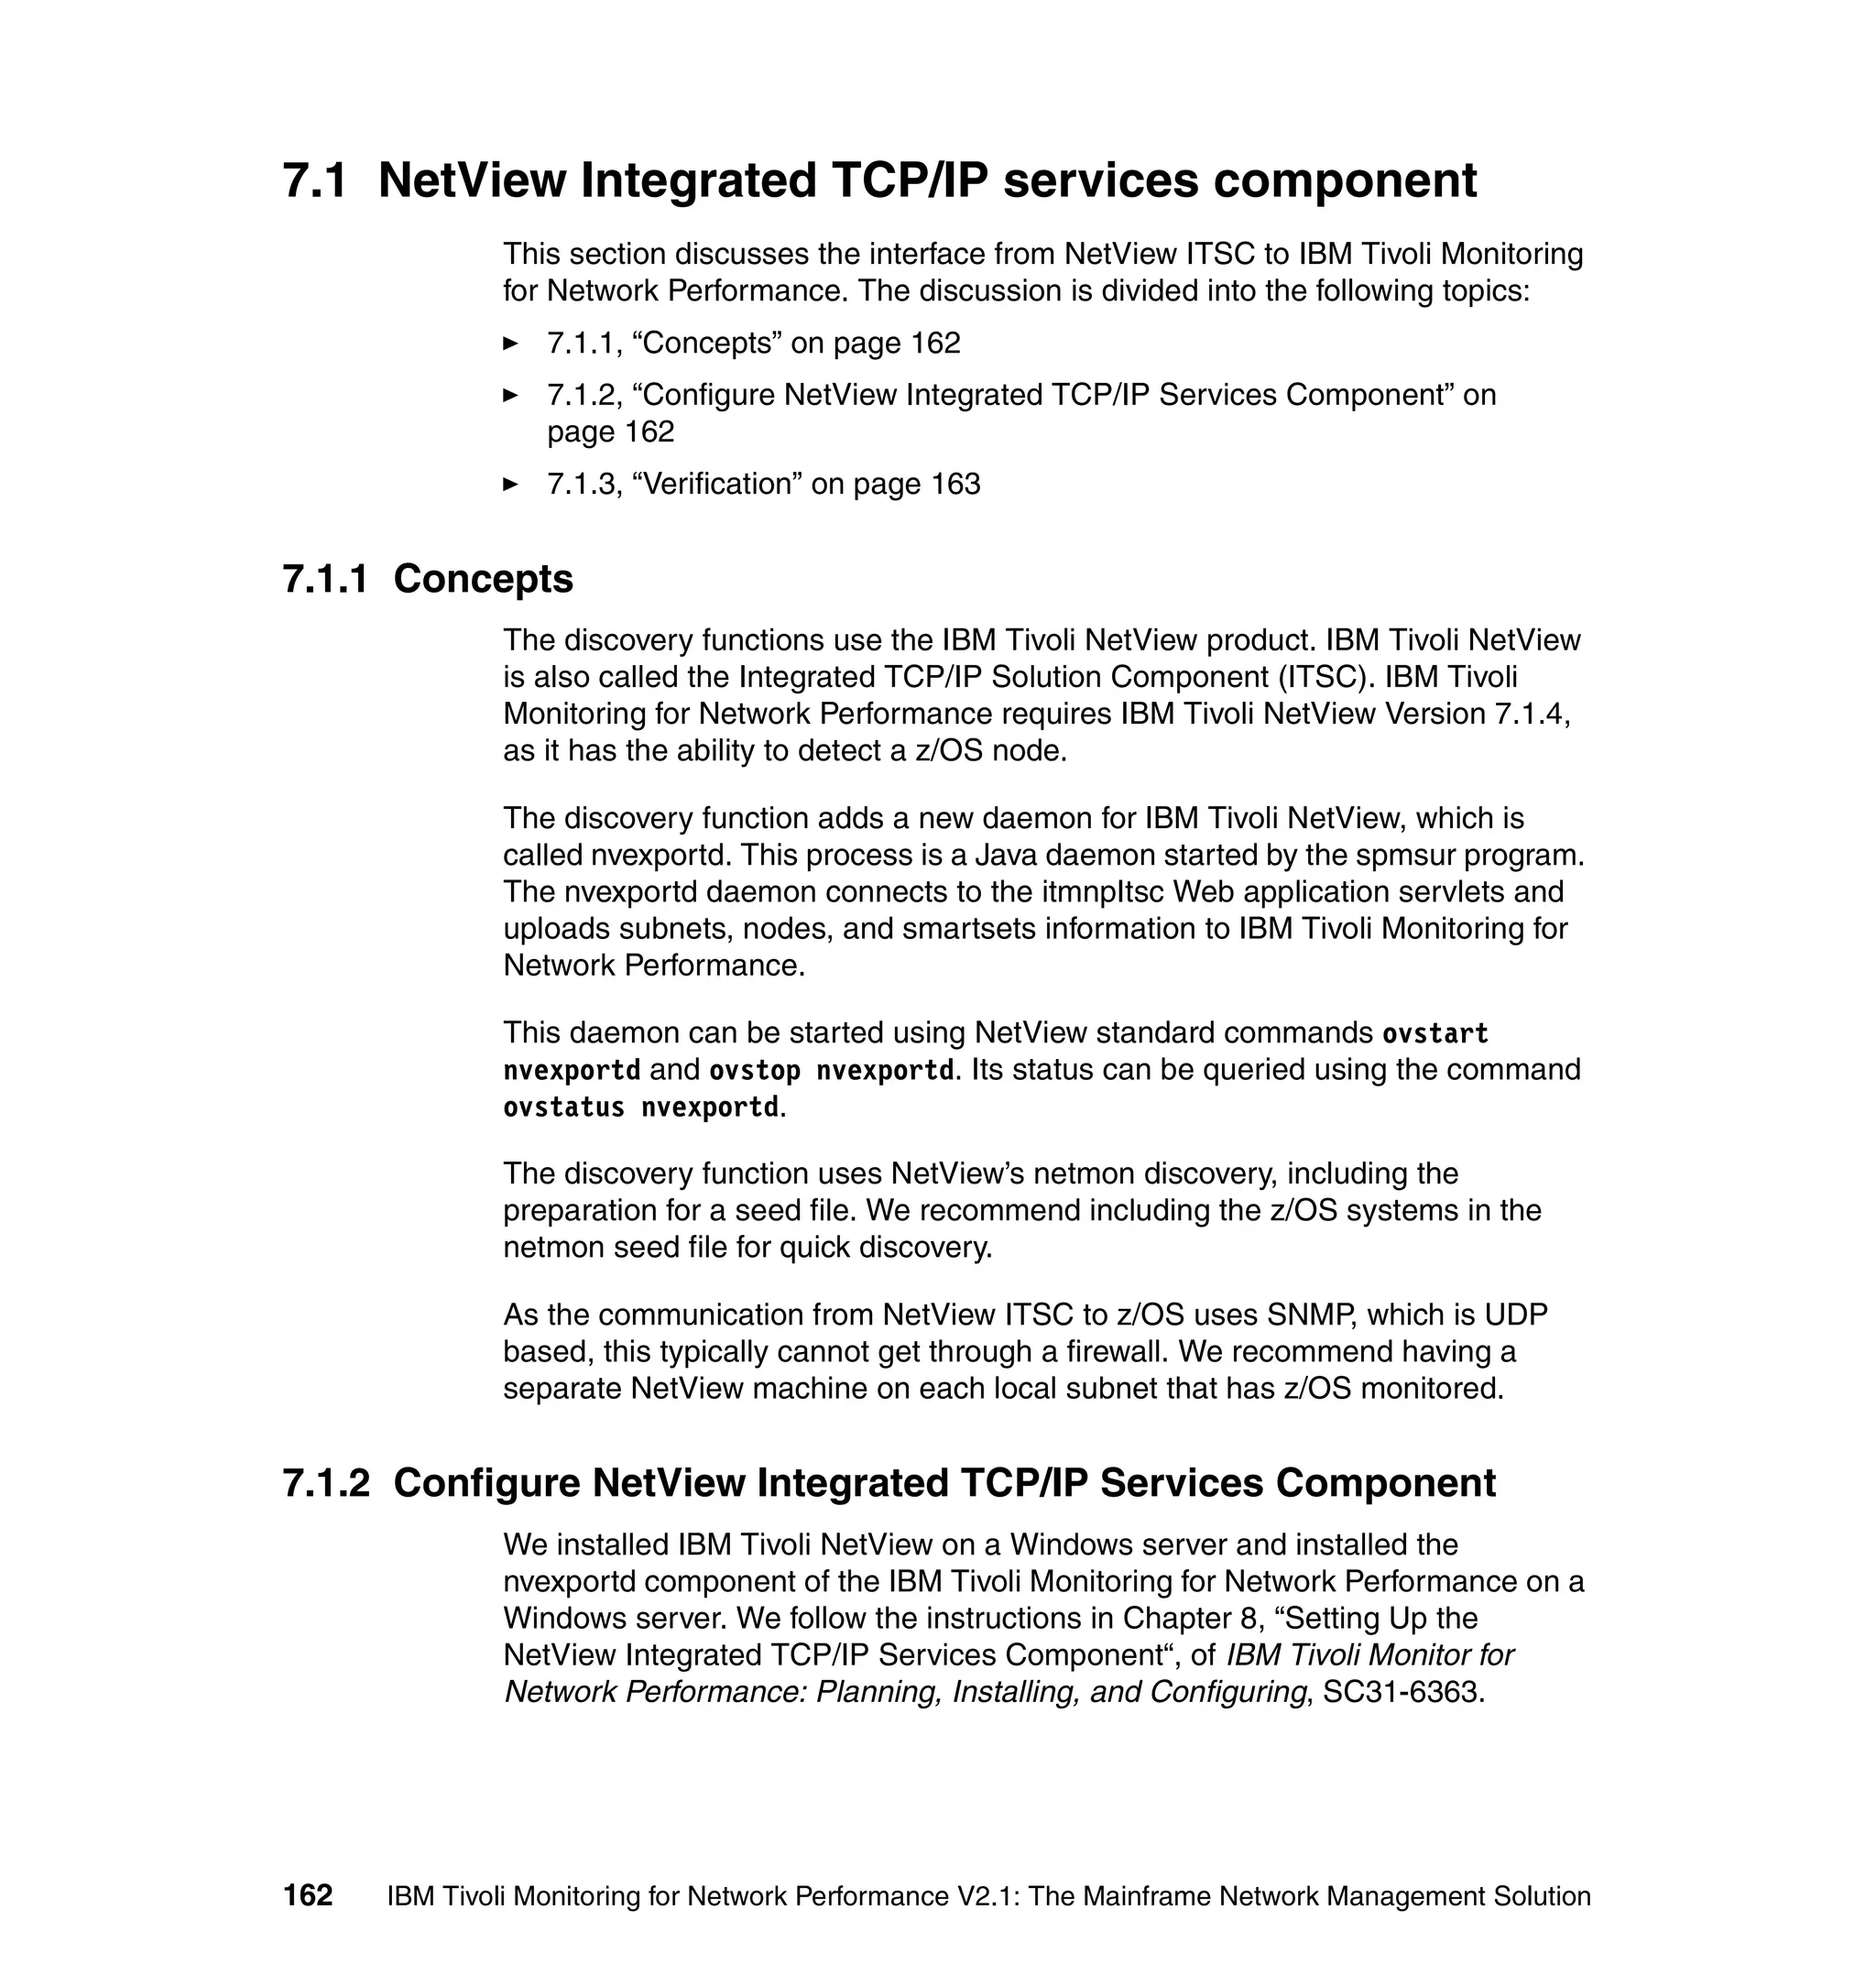
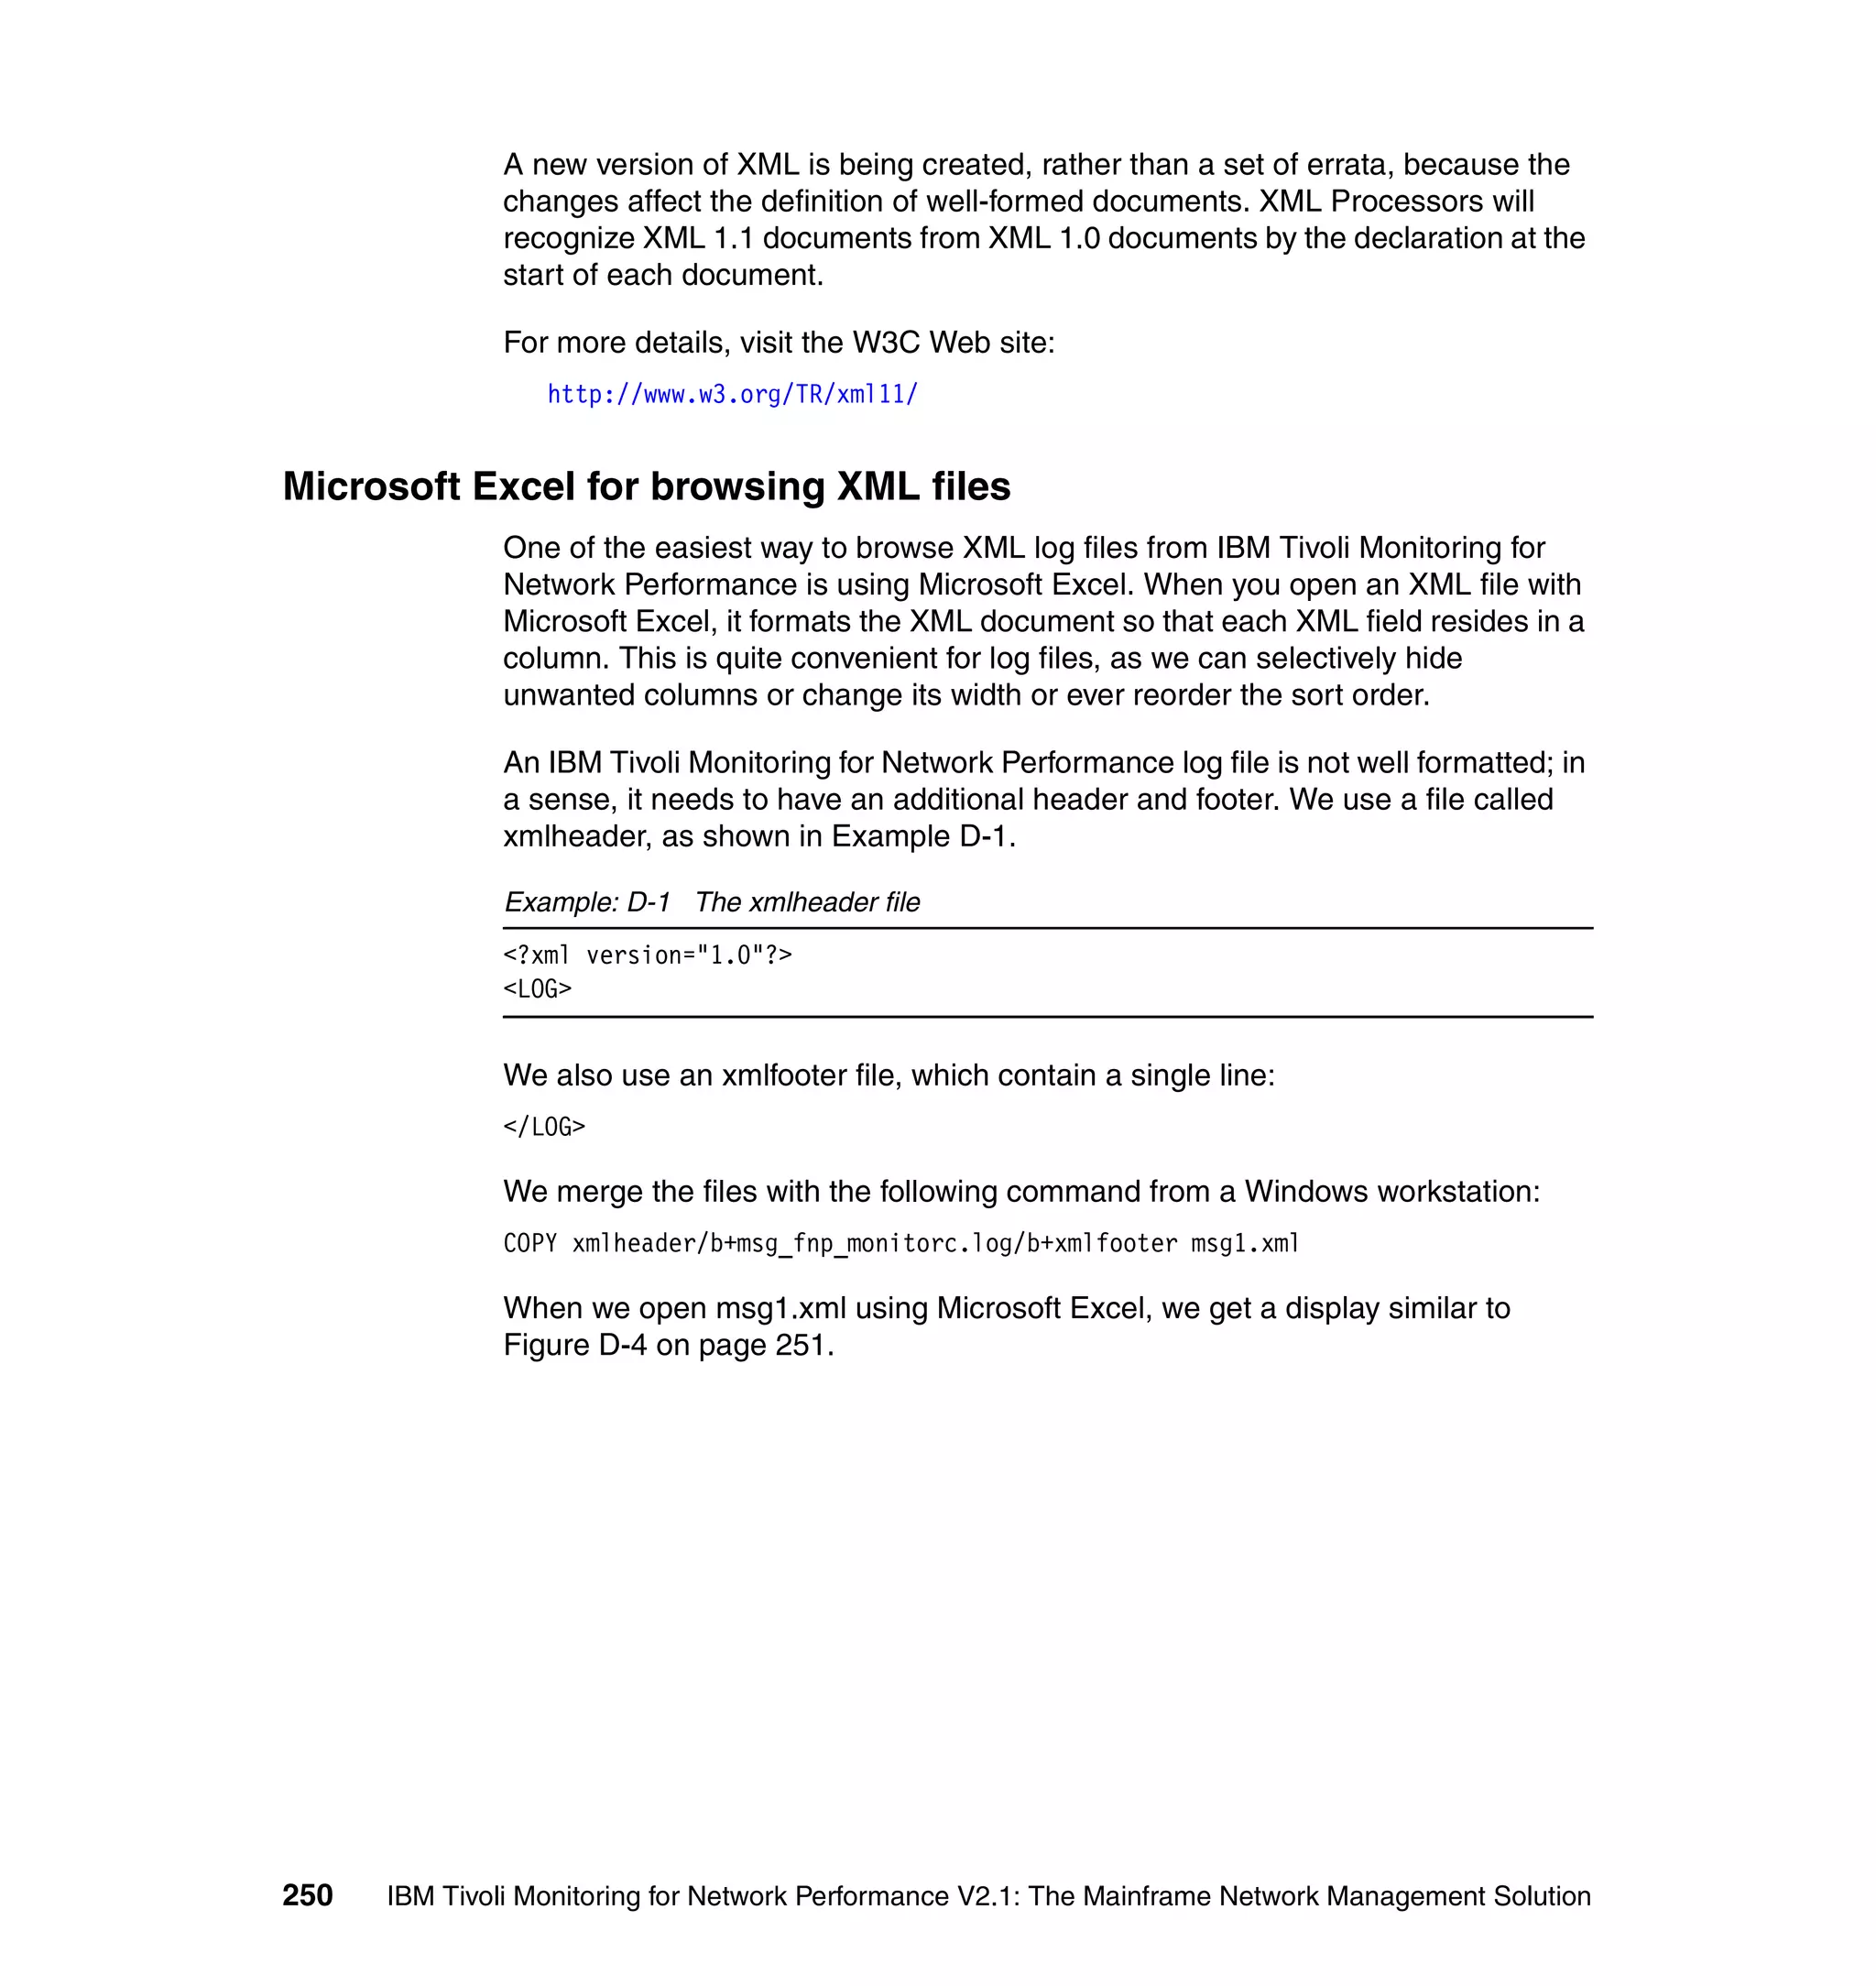
If you have an operational WebSphere Application Server, you should verify that
JMS is operational by looking at the SystemOut.log, which is located in
<WAS_HOME>/logs/server1. In our case, the SystemOut.log is in
/usr/WebSphere/AppServer/logs/server1. Examples of the JMS messages are
shown in Example 4-2, “JMS messages in SystemOut.log” on page 63.
62 IBM Tivoli Monitoring for Network Performance V2.1: The Mainframe Network Management Solution](https://image.slidesharecdn.com/ibmtivolimonitoringfornetworkperformancev2-1themainframenetworkmanagementsolutionsg246360-120524030008-phpapp02/75/Ibm-tivoli-monitoring-for-network-performance-v2-1-the-mainframe-network-management-solution-sg246360-78-2048.jpg)
![Example 4-2 JMS messages in SystemOut.log
[5/12/04 12:28:51:475 CDT] JMSEmbeddedPr MSGS0050I: Starting the Queue Manager
[5/12/04 12:28:59:851 CDT] JMSEmbeddedPr MSGS0051I: Queue Manager open for
business
[5/12/04 12:28:59:871 CDT] JMSEmbeddedPr MSGS0052I: Starting the Broker
[5/12/04 12:29:04:802 CDT] JMSEmbeddedPr MSGS0053I: Broker open for business
To make sure that the WebSphere Application Server is up and running, find the
following message in SystemOut.log:
Server server1 open for e-business
4.2.3 User authority
The user ID that performs the installation needs to be authorized to the file
systems and the DB2 database. Authorization to the WebSphere Application
Server is acquired using a user ID and password that is specified in the wizard.
Typically, when WebSphere Application Server is installed, security is disabled
so that there is no authentication needed.
We perform the installation using the root user. The root user needs access to
DB2 database, which is owned by the so-called DB2 instance owner. Typically,
the instance owner user is called db2inst1 with group db2grp1. Unless you
connect root to the DB2 owner group, the database will not be created by the
wizard. Perform the following to add root to the DB2 group db2grp1.
Note: This should be performed after DB2 has already been installed.
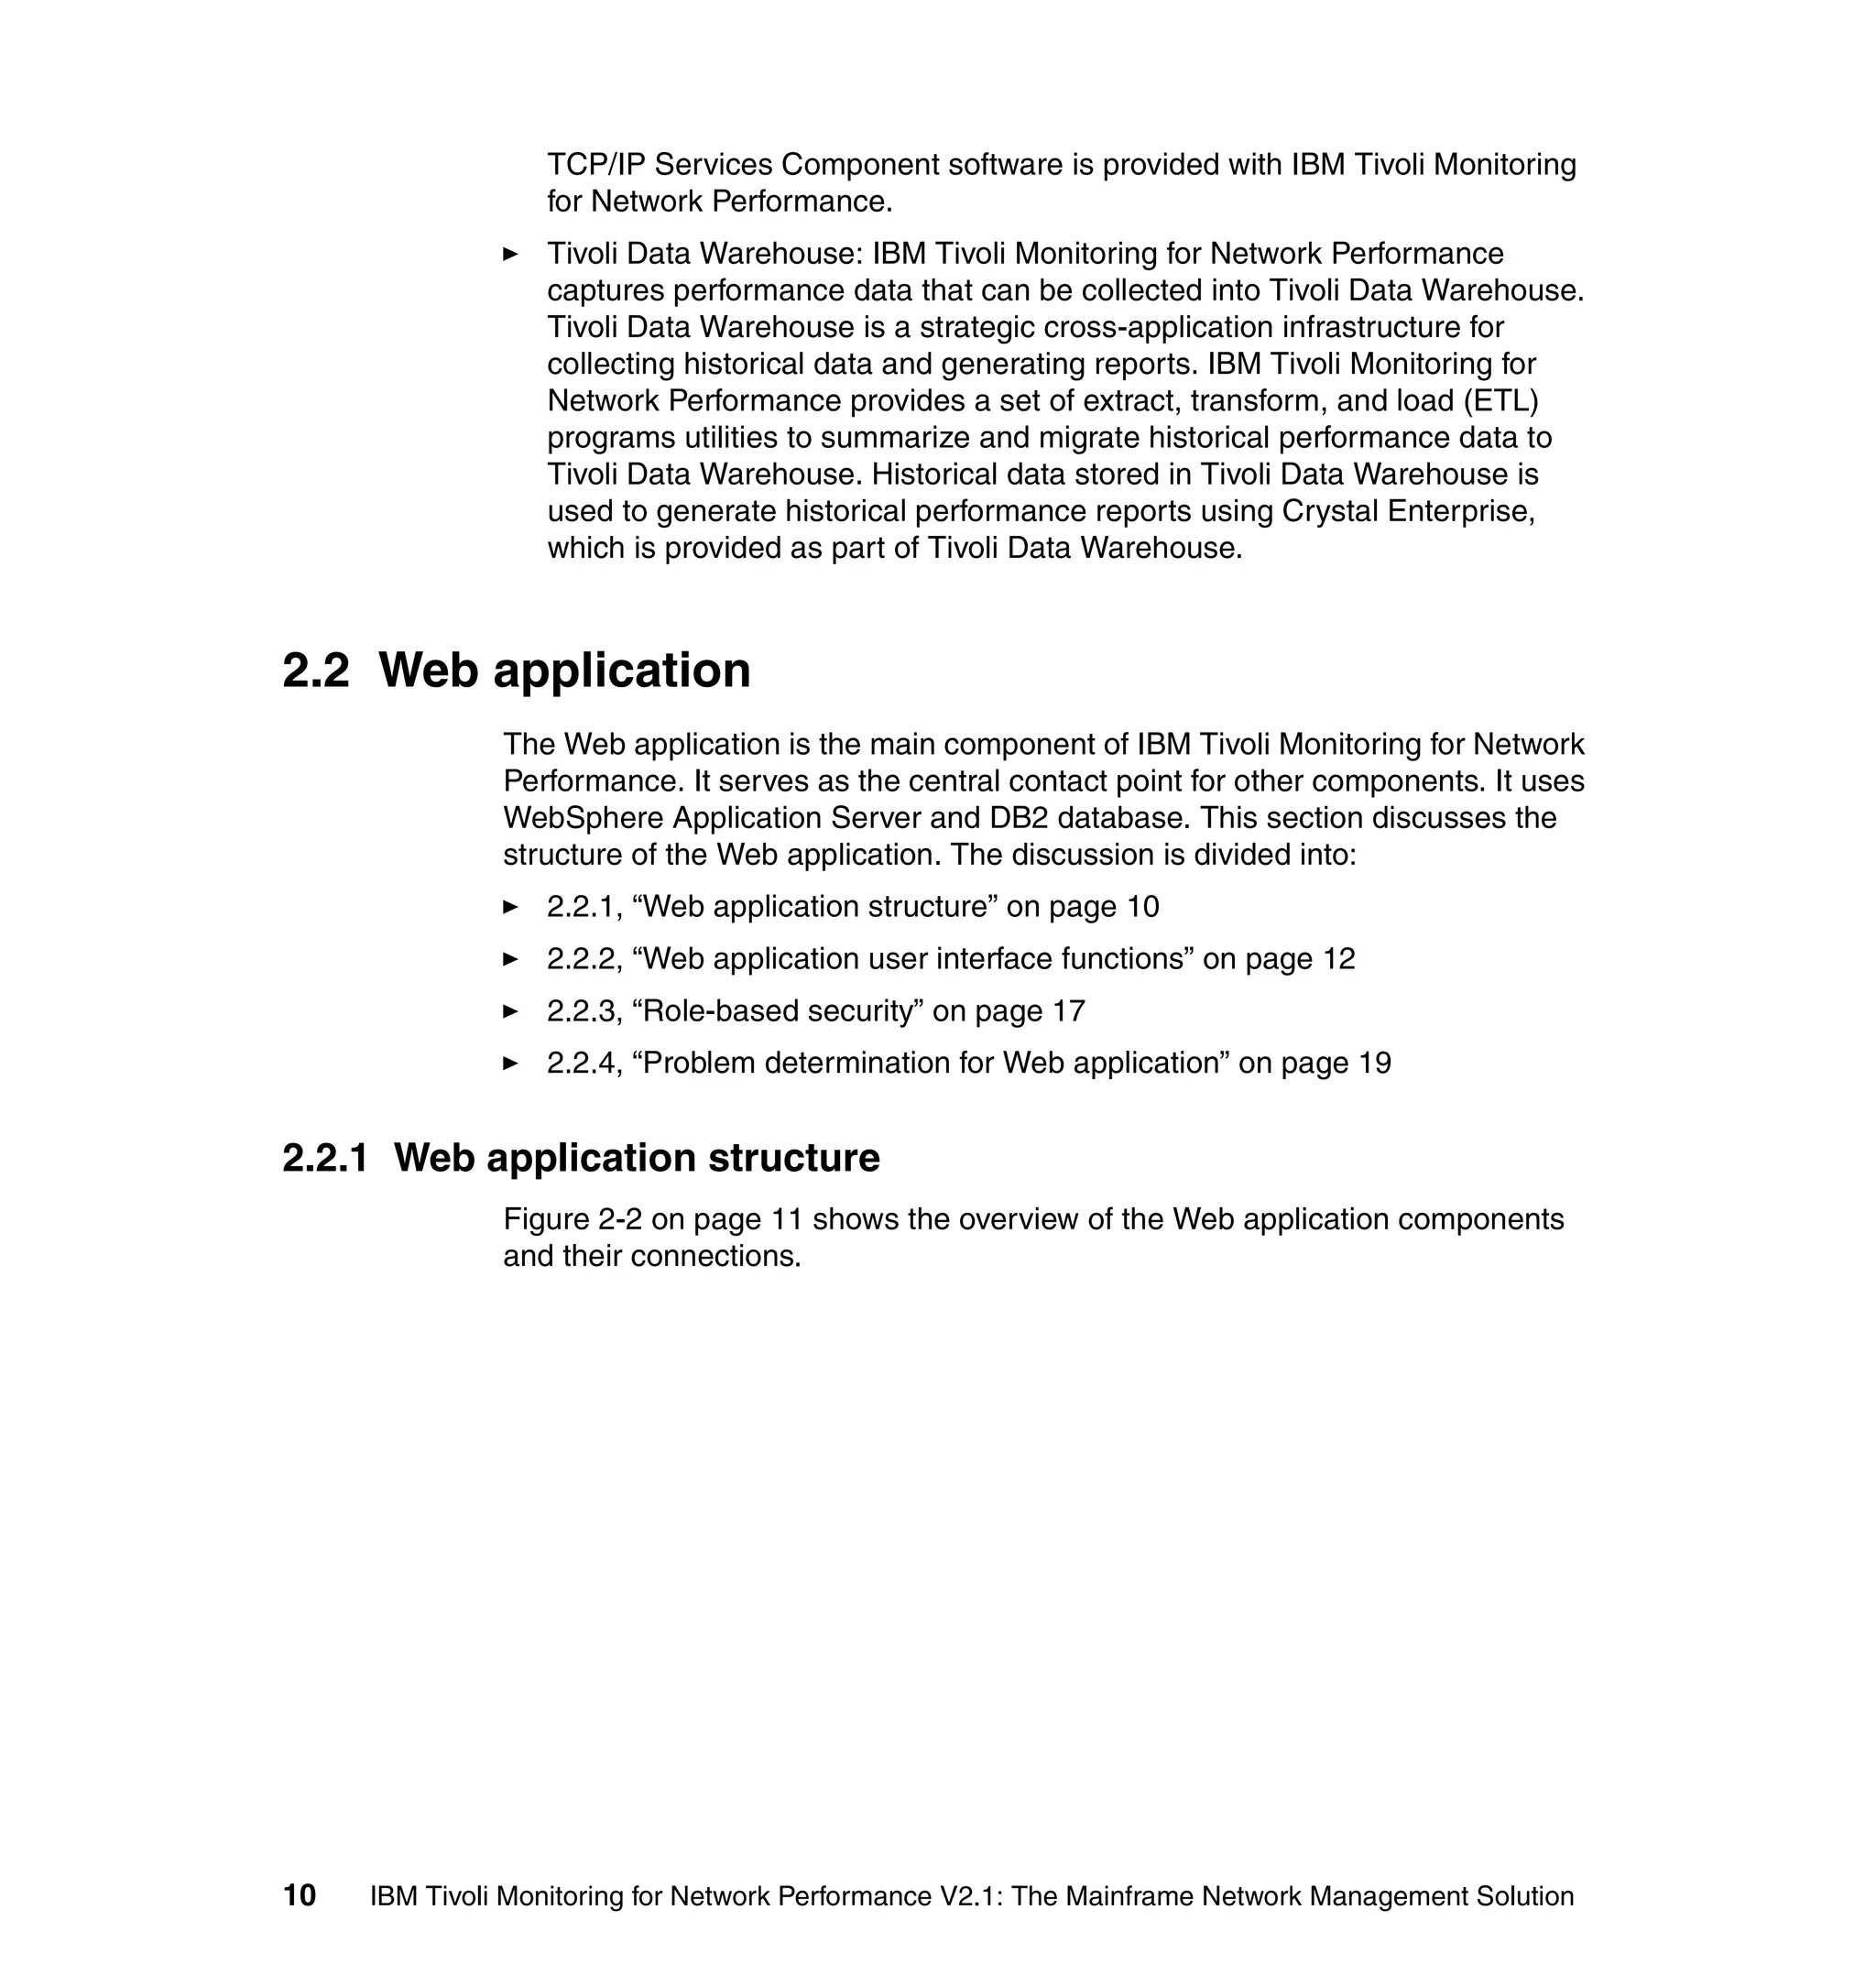
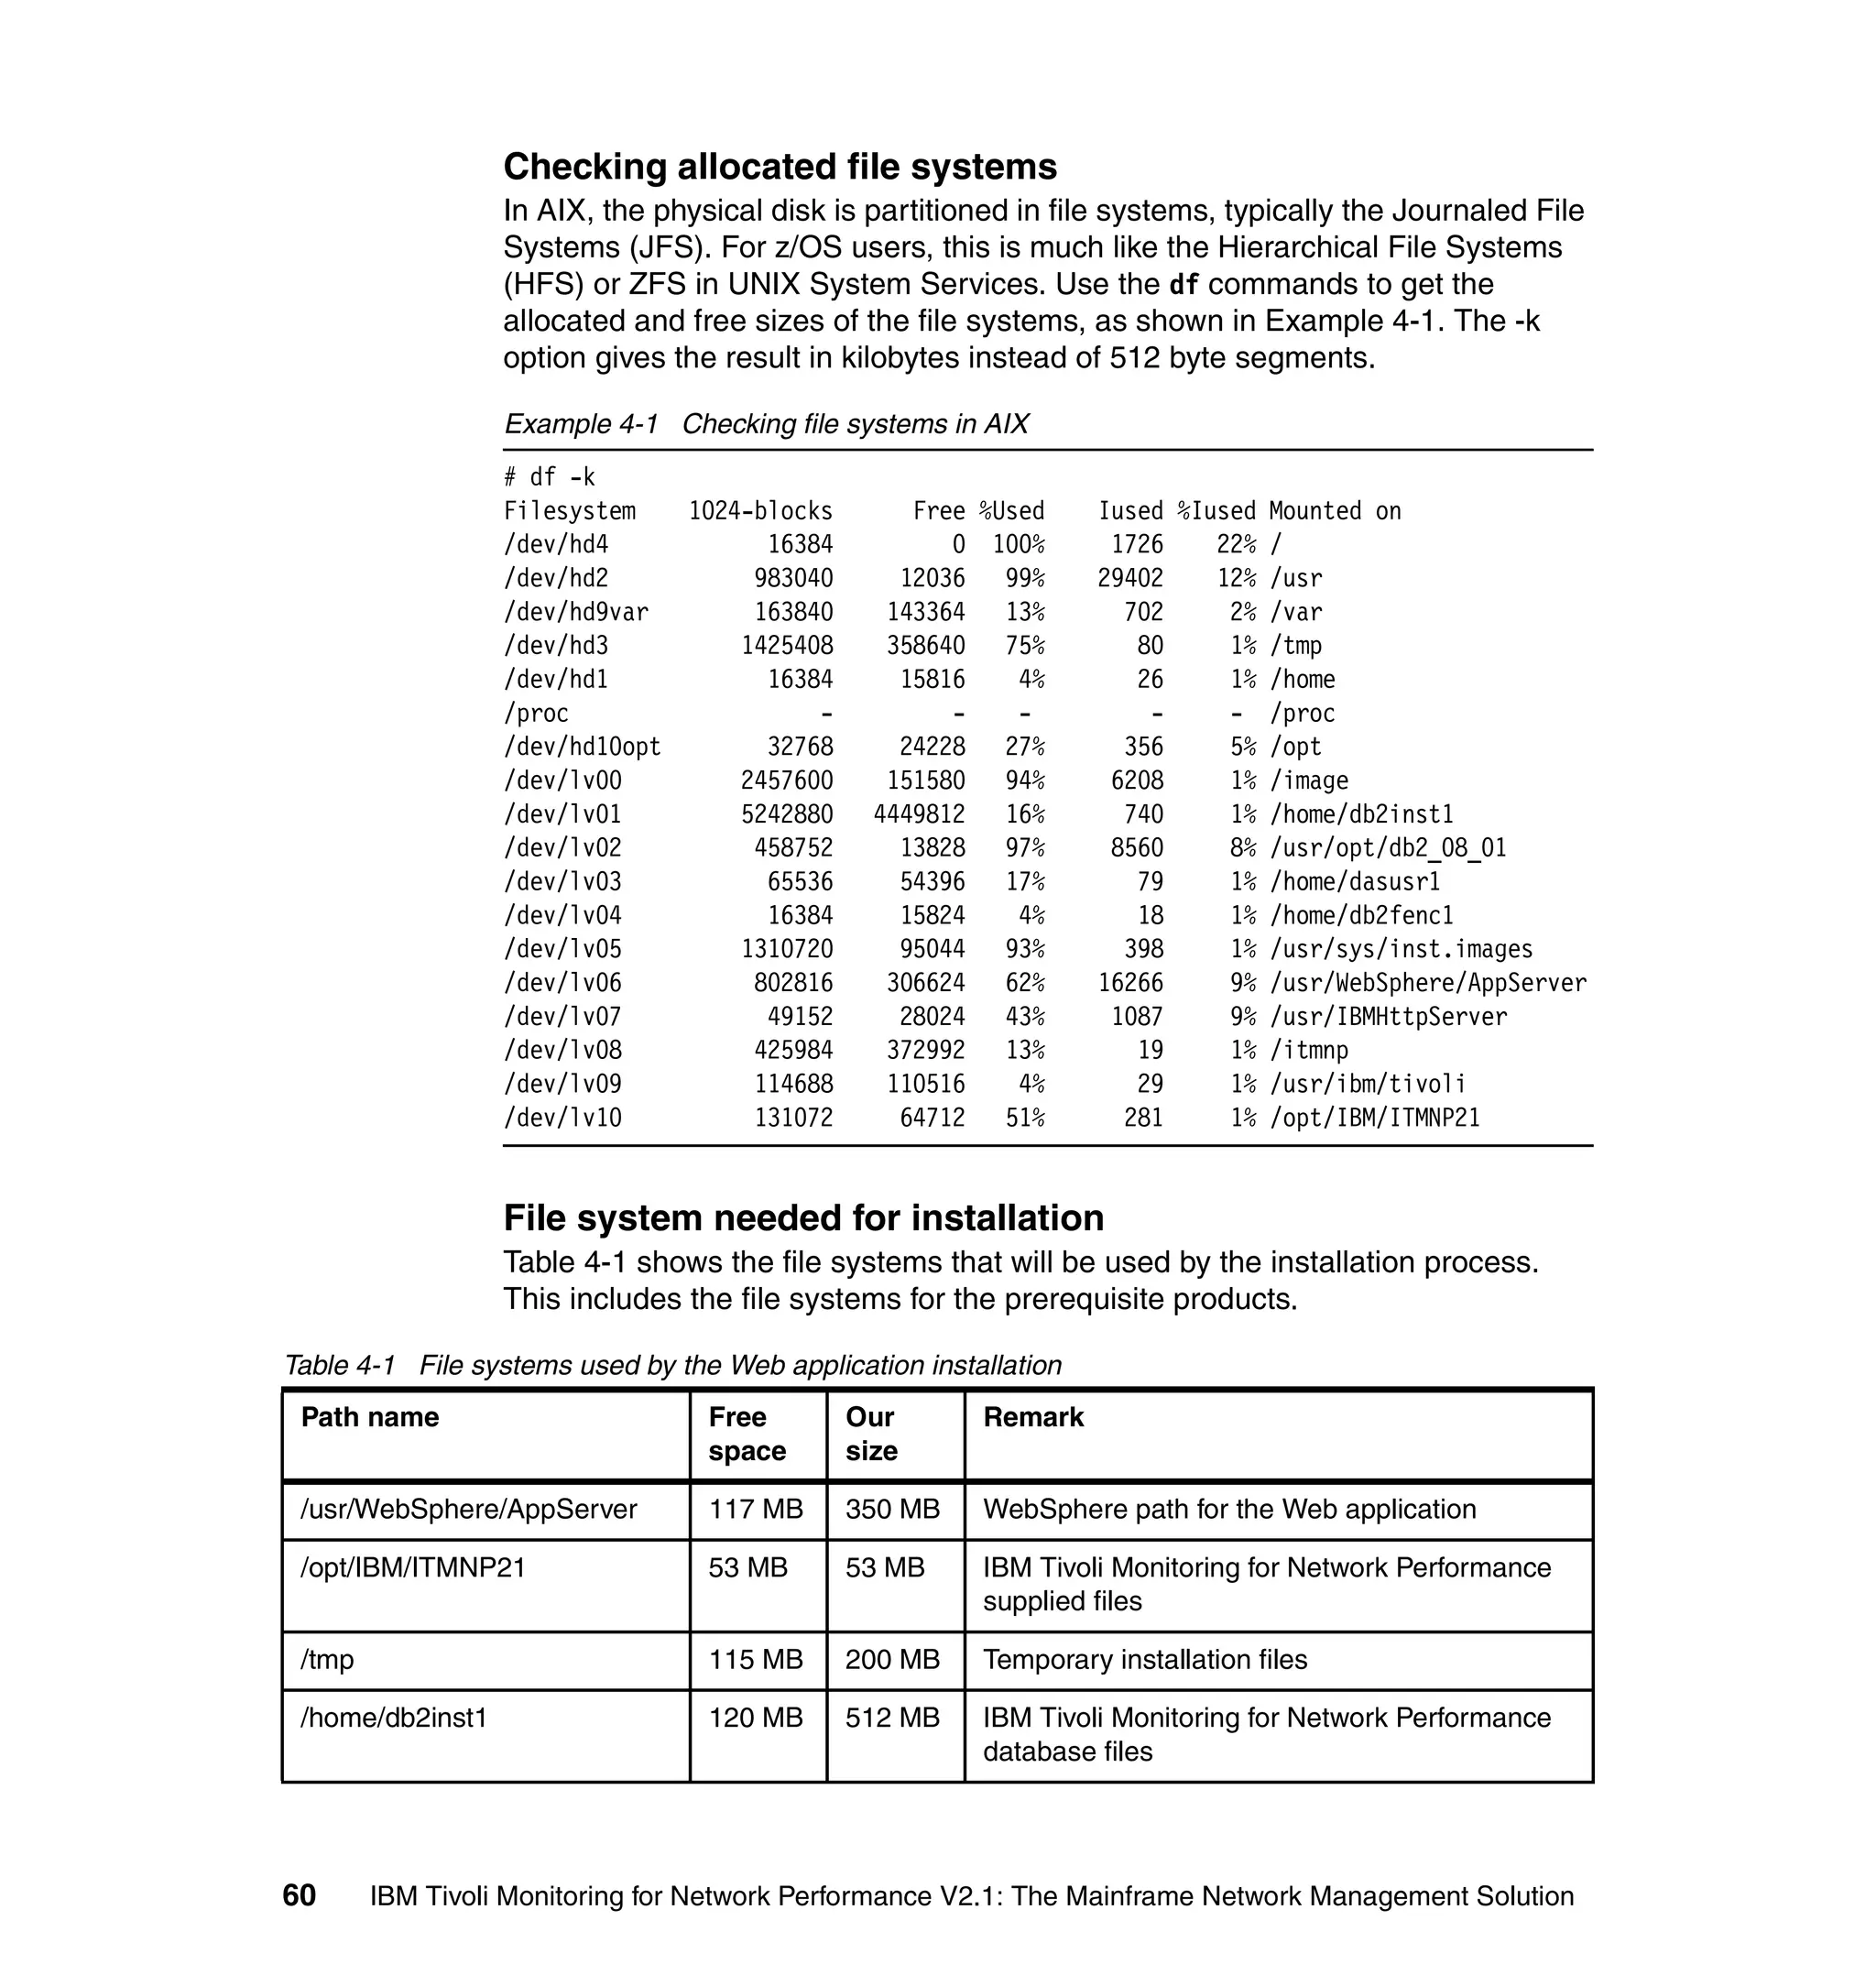
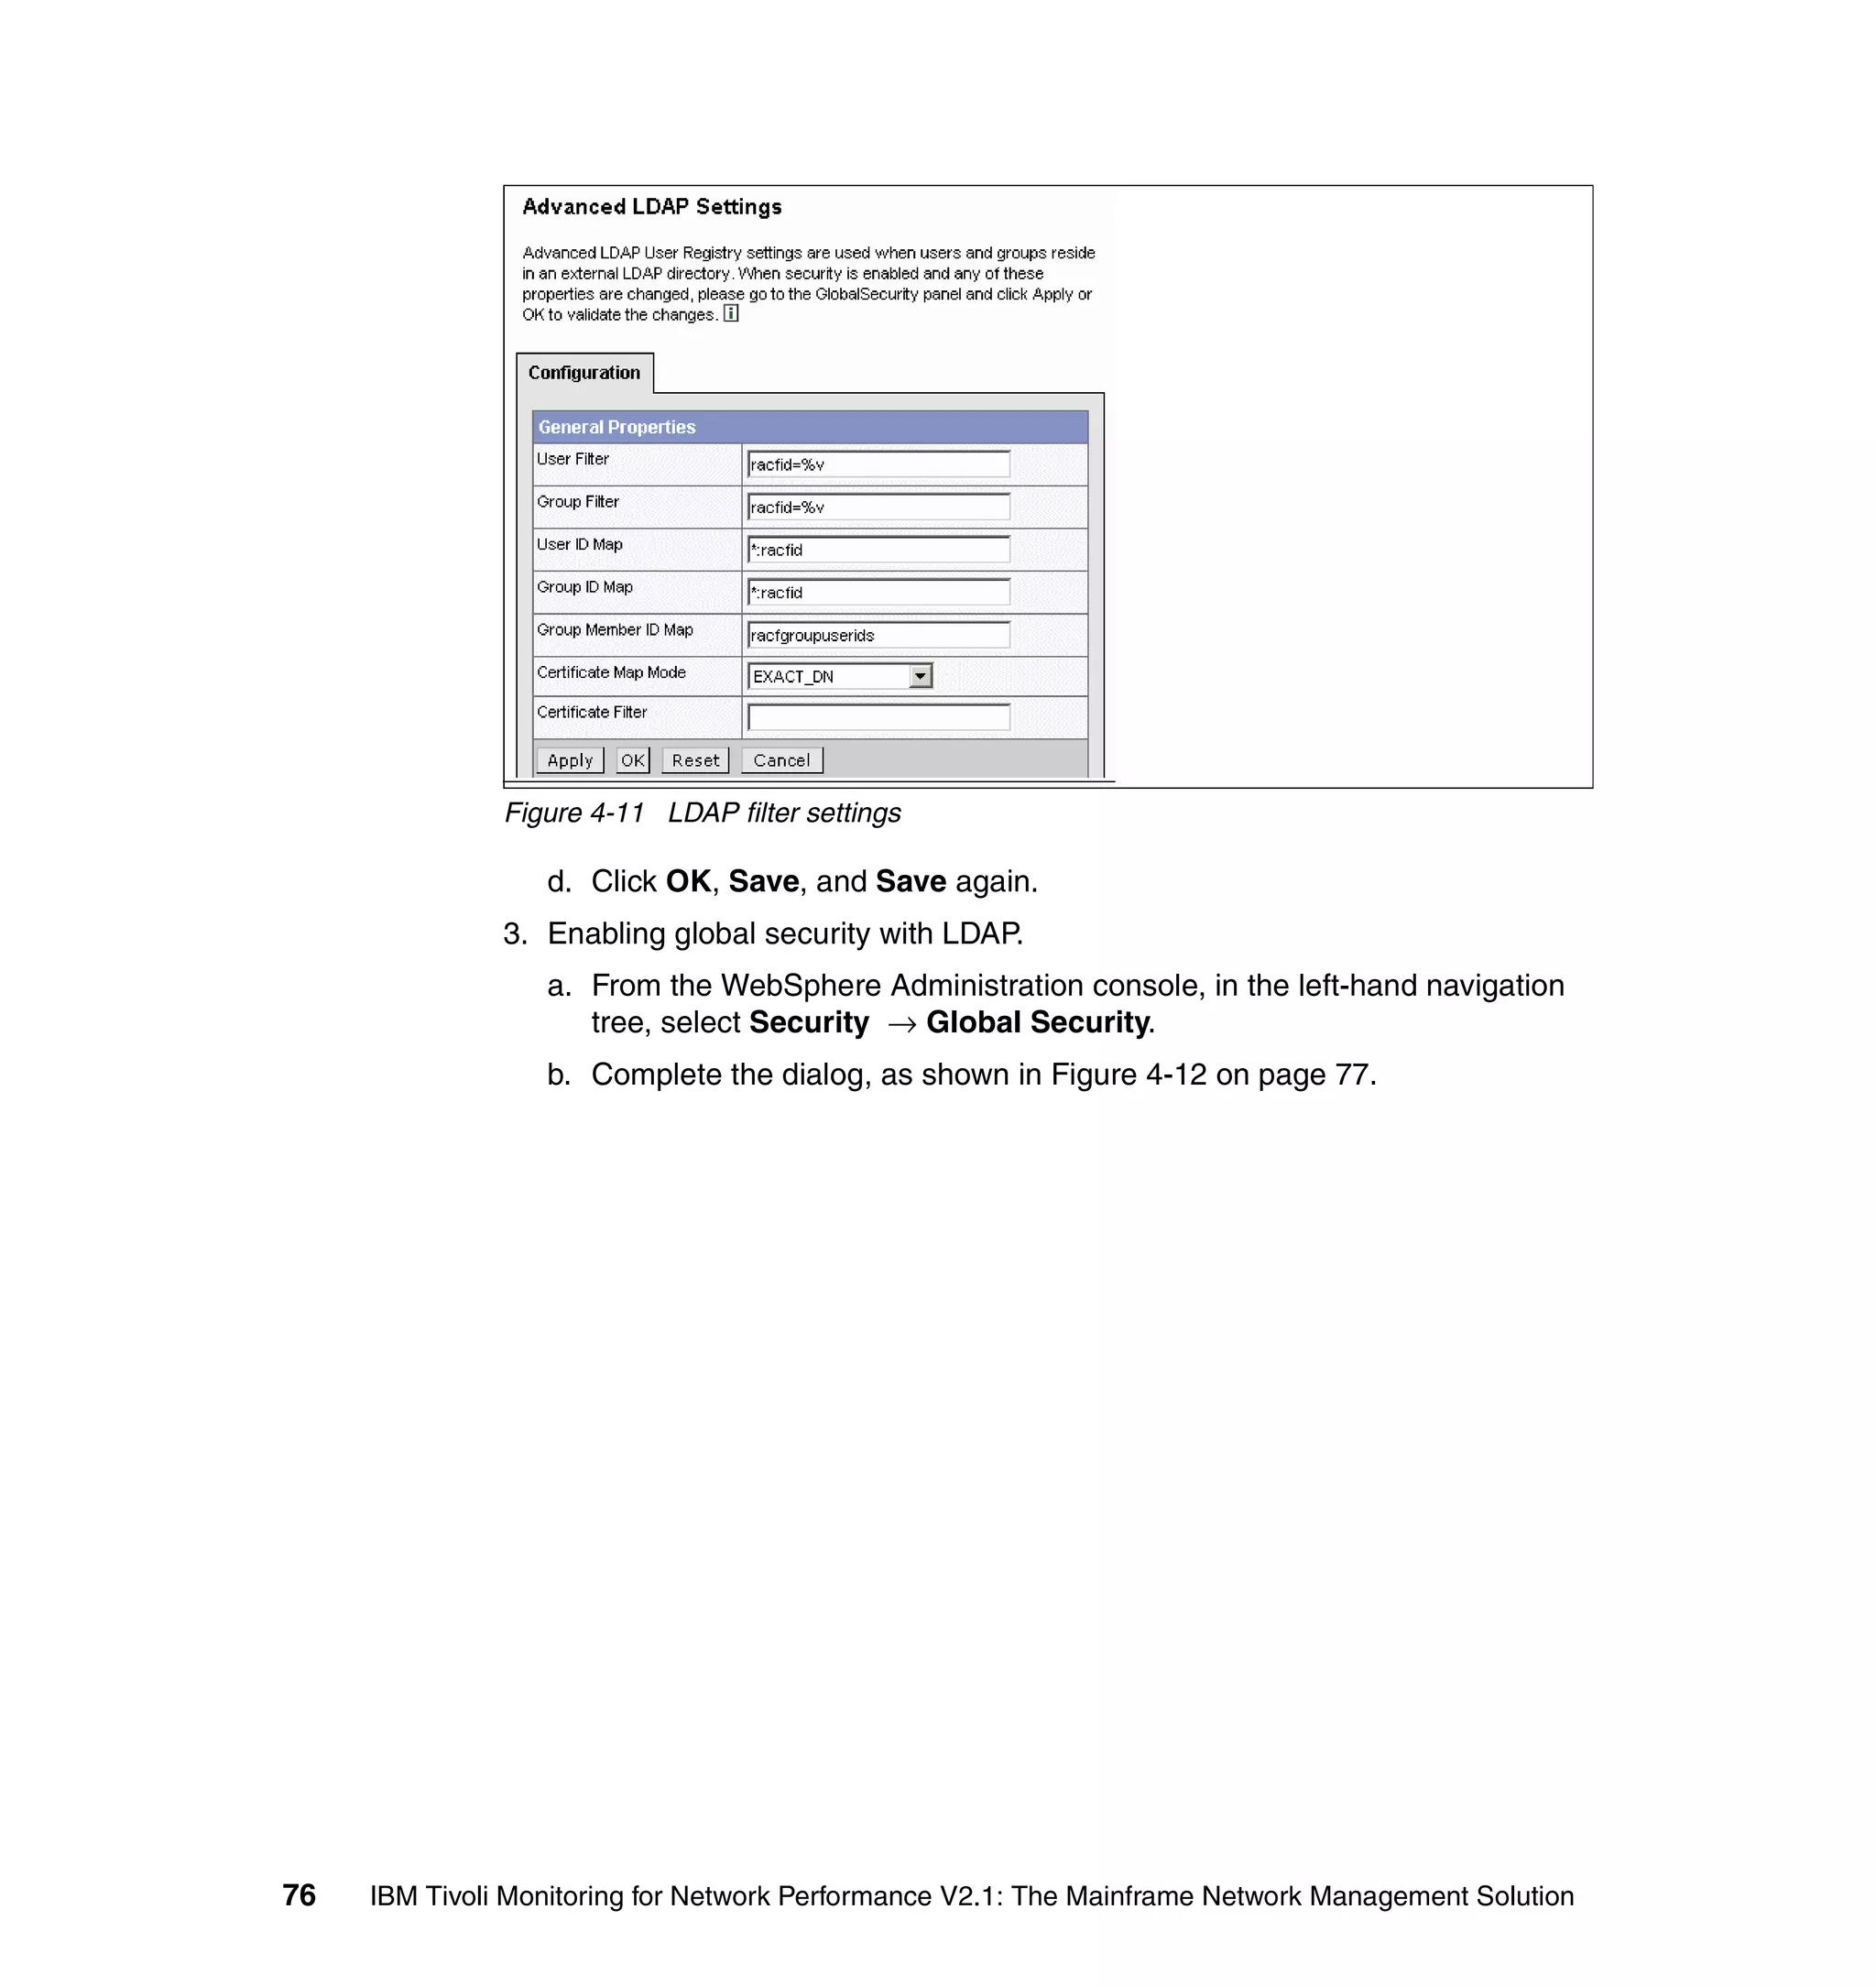
1. In AIX session, log in as root.
2. Run the command smit user, which gives the screen shown in Figure 4-5 on
page 64.
Chapter 4. AIX Web application implementation 63](https://image.slidesharecdn.com/ibmtivolimonitoringfornetworkperformancev2-1themainframenetworkmanagementsolutionsg246360-120524030008-phpapp02/75/Ibm-tivoli-monitoring-for-network-performance-v2-1-the-mainframe-network-management-solution-sg246360-79-2048.jpg)
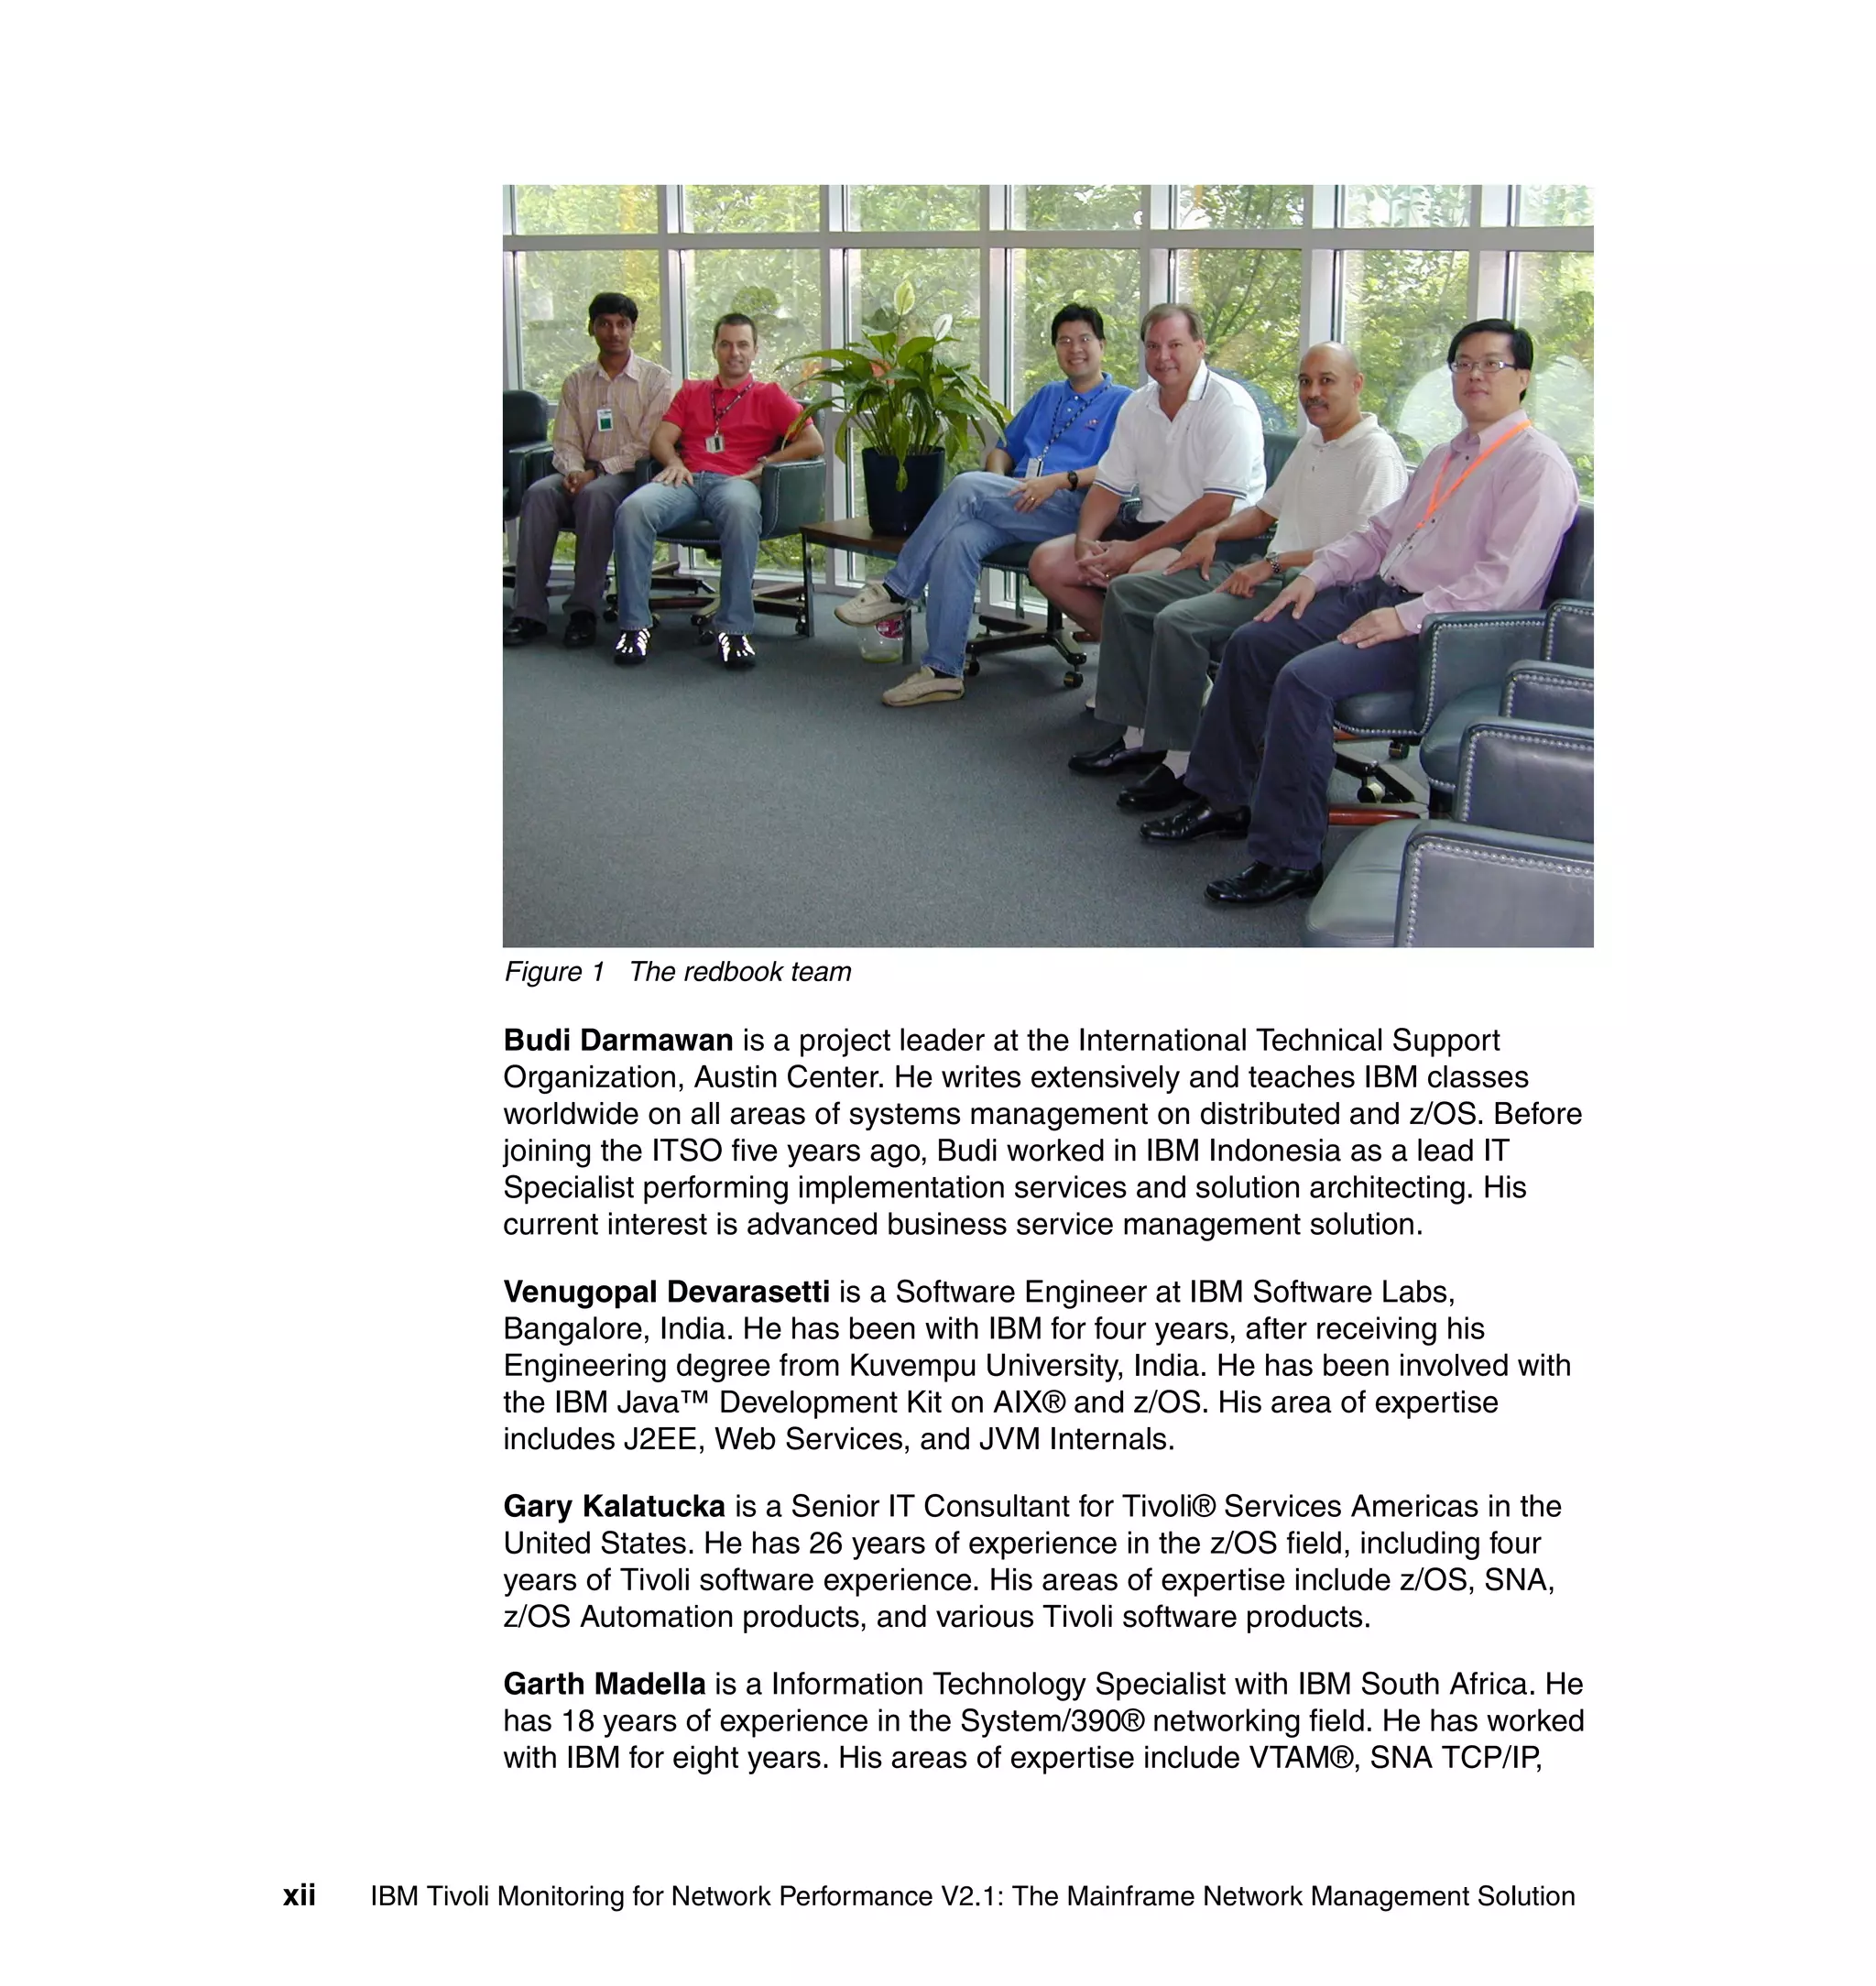
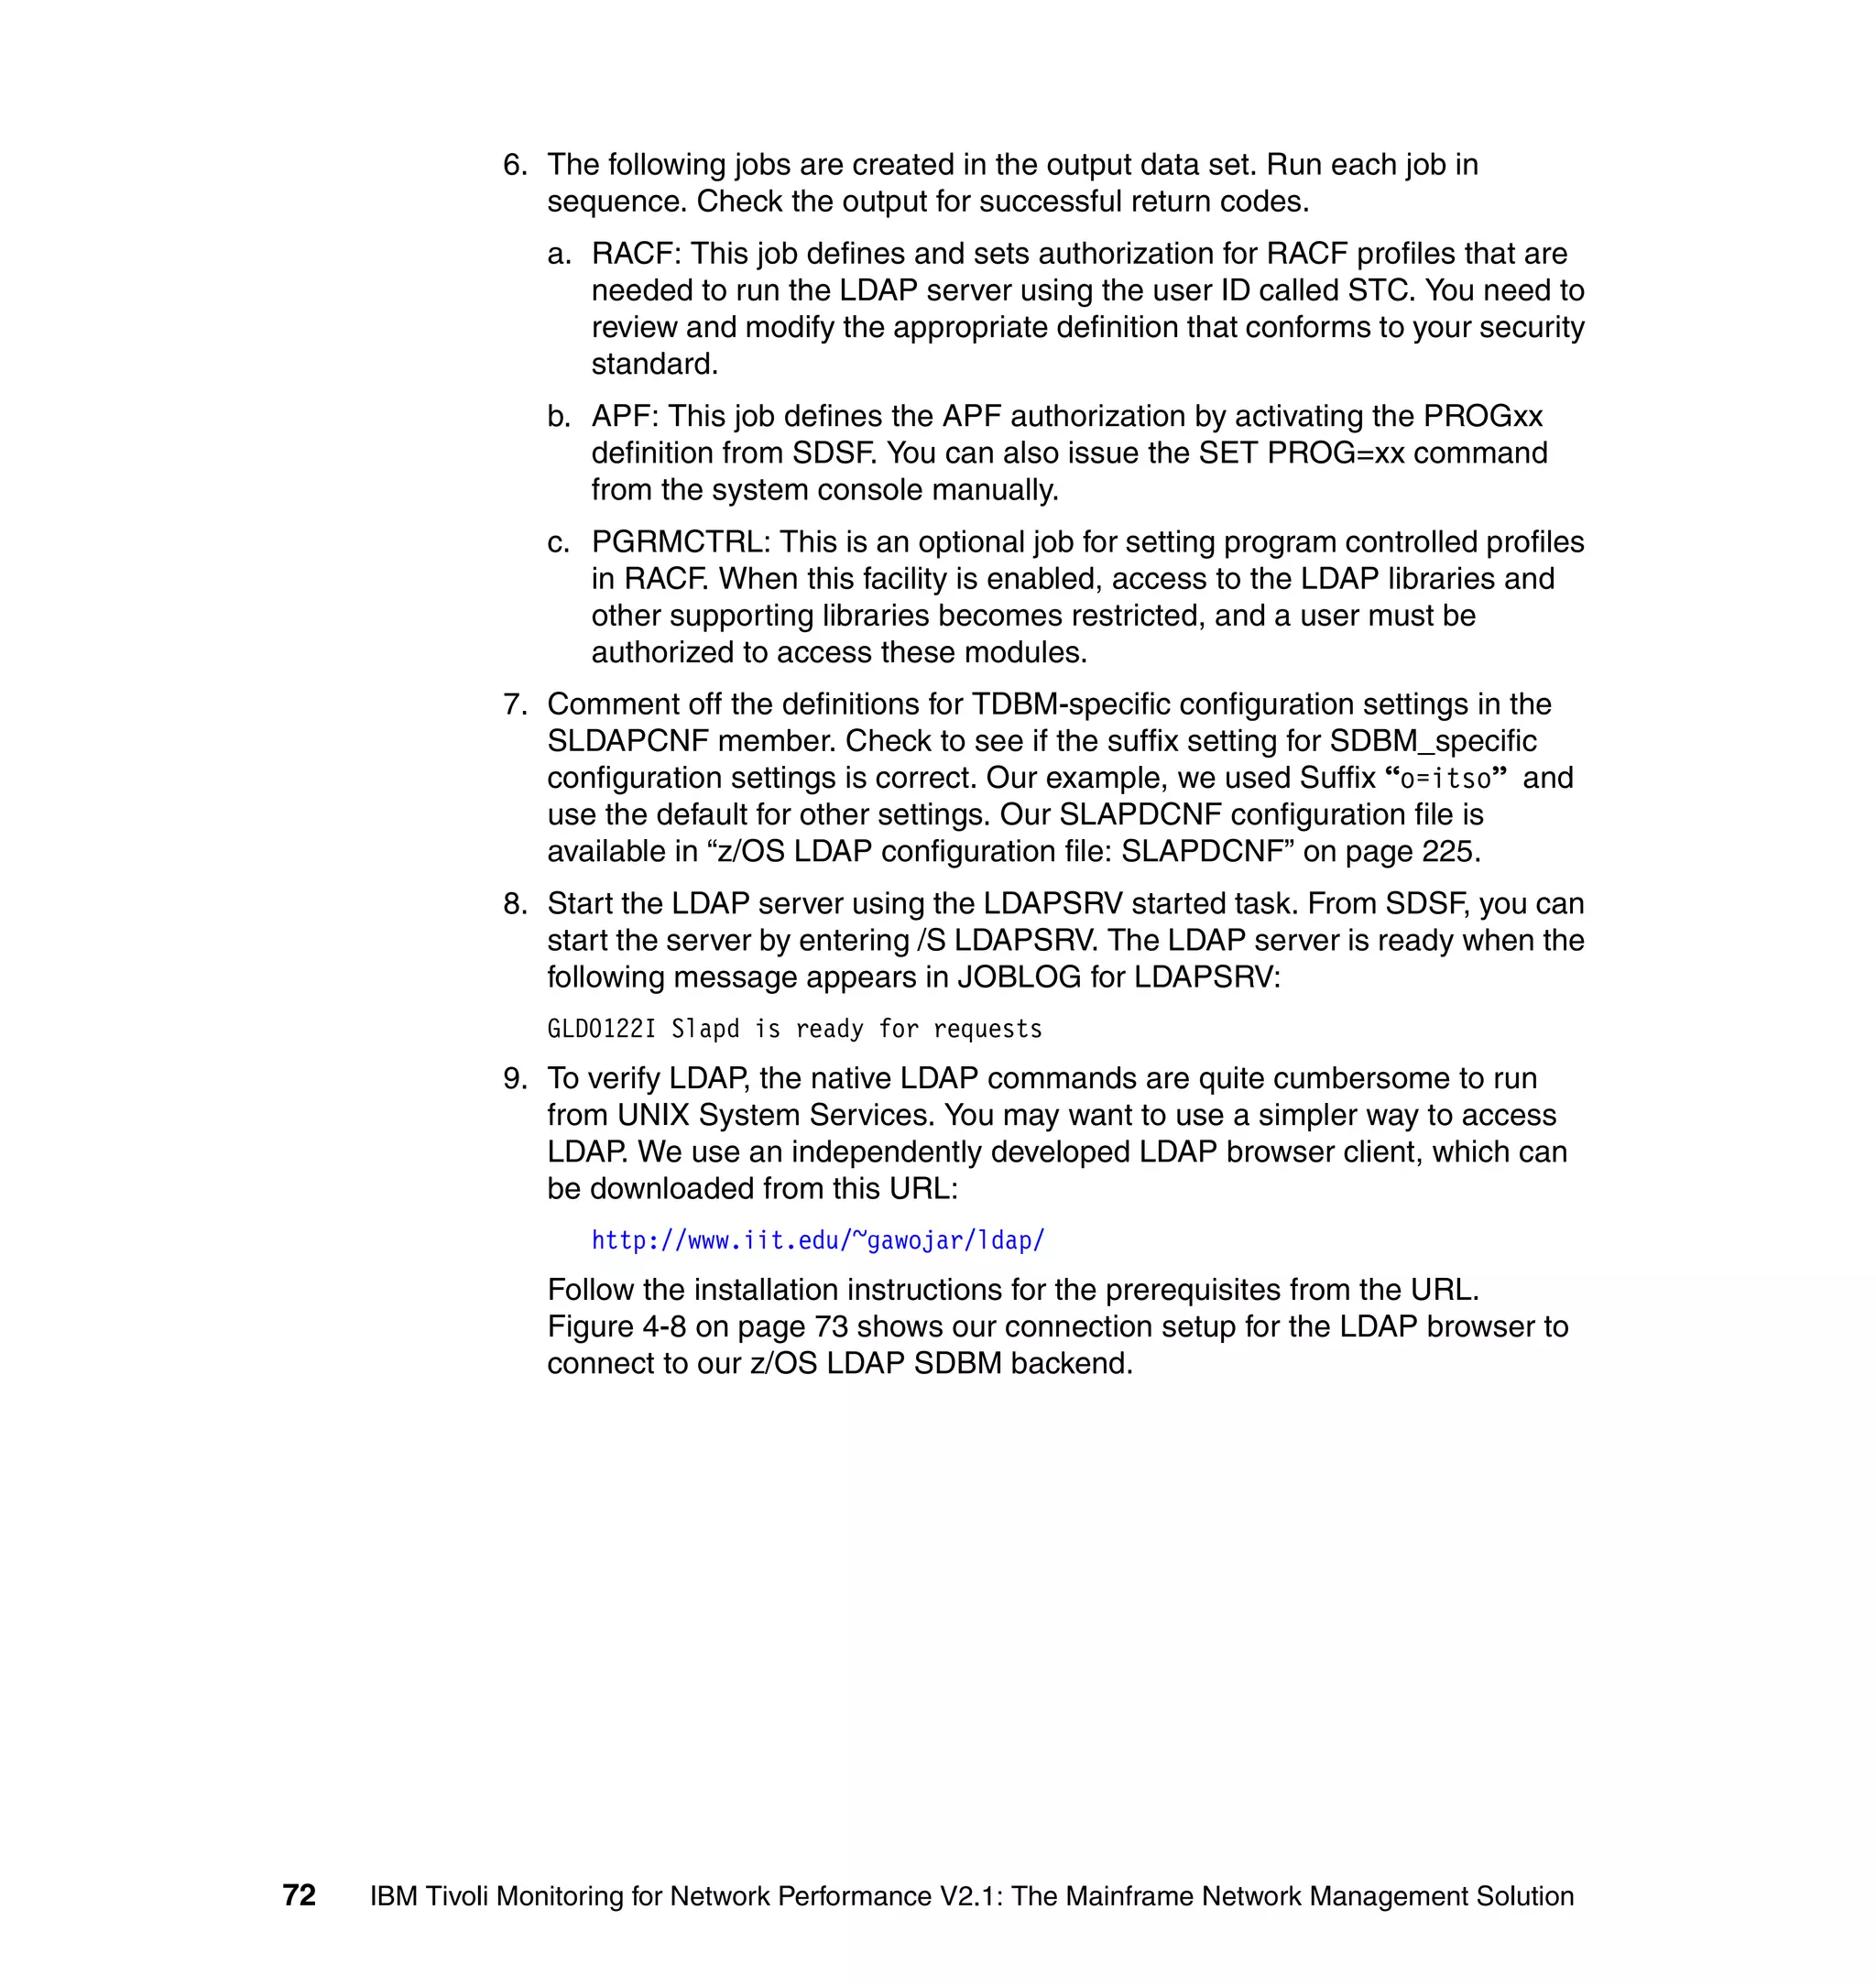
![Users
Move cursor to desired item and press Enter.
Add a User
Change a User's Password
Change / Show Characteristics of a User
Lock / Unlock a User's Account
Reset User's Failed Login Count
Remove a User
List All Users
Figure 4-5 The smit user display
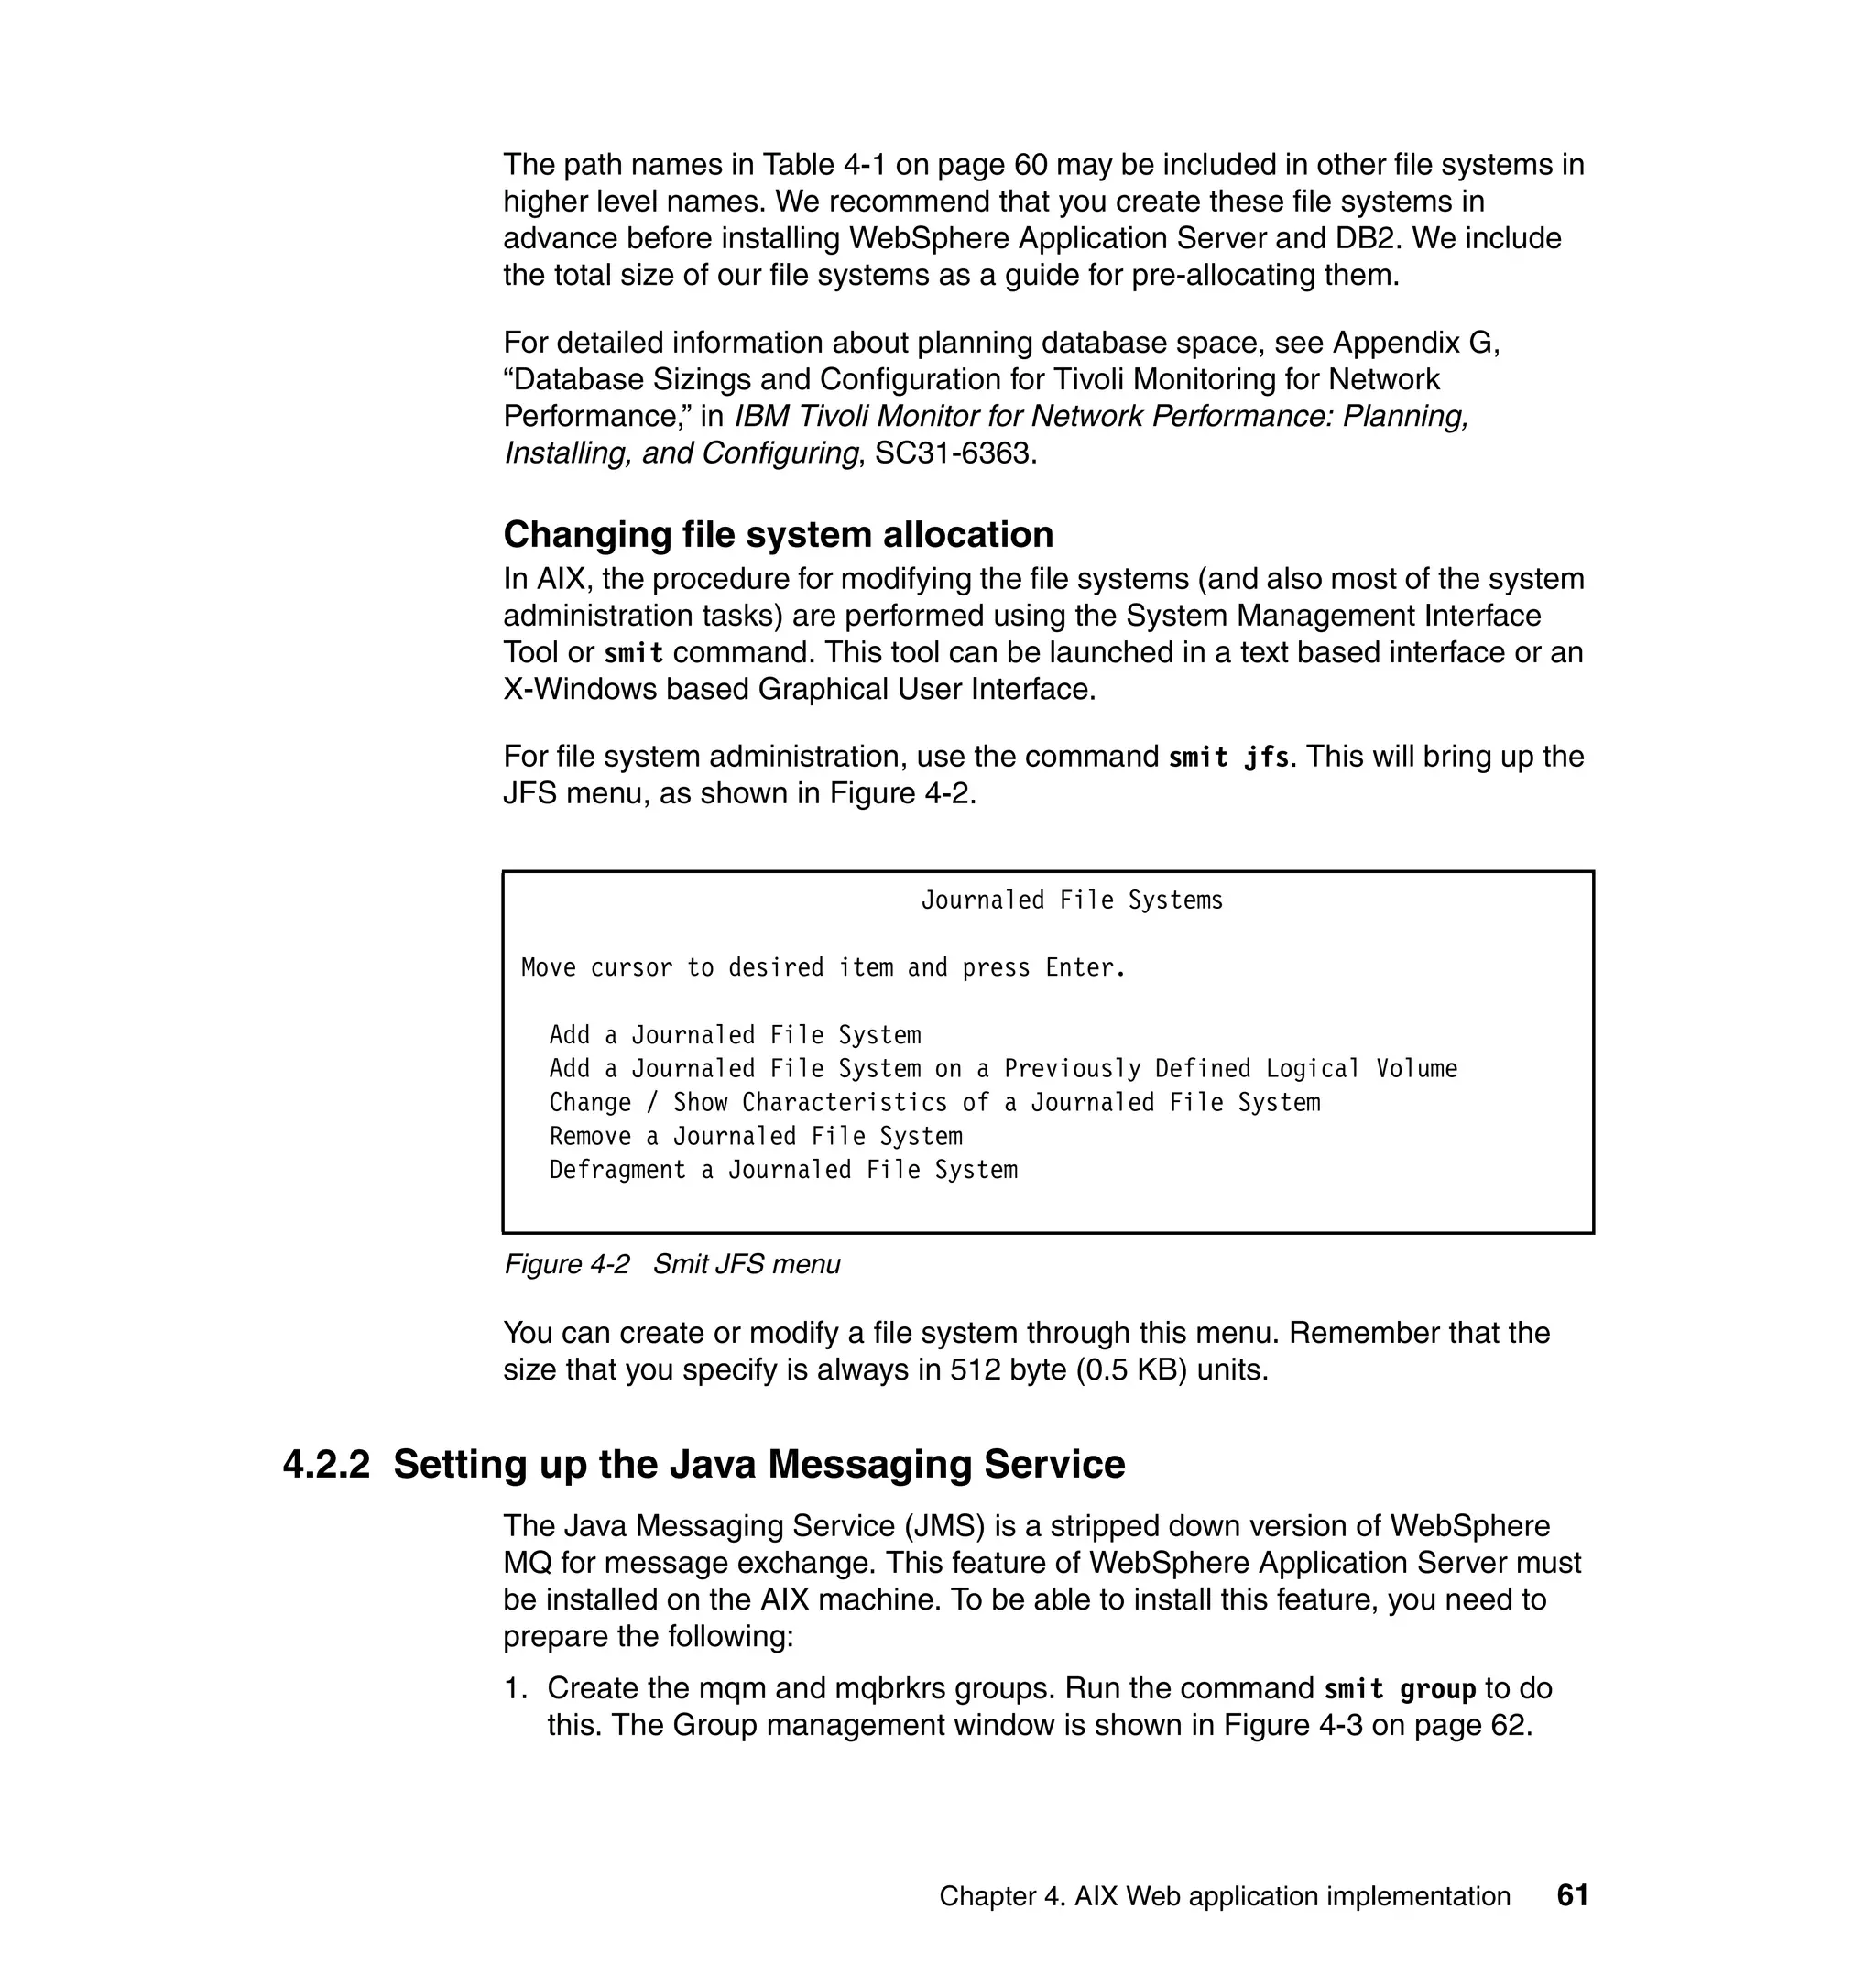
3. Choose Change / Show Characteristics of a User, which gives you the
screen shown in Figure 4-6.
Change / Show Characteristics of a User
Type or select a value for the entry field.
Press Enter AFTER making all desired changes.
[Entry Fields]
* User NAME [root] +
Figure 4-6 Change / Show characteristics of a User
4. Put root in the User NAME field and press Enter. This gives you the screen
shown in Figure 4-7 on page 65.
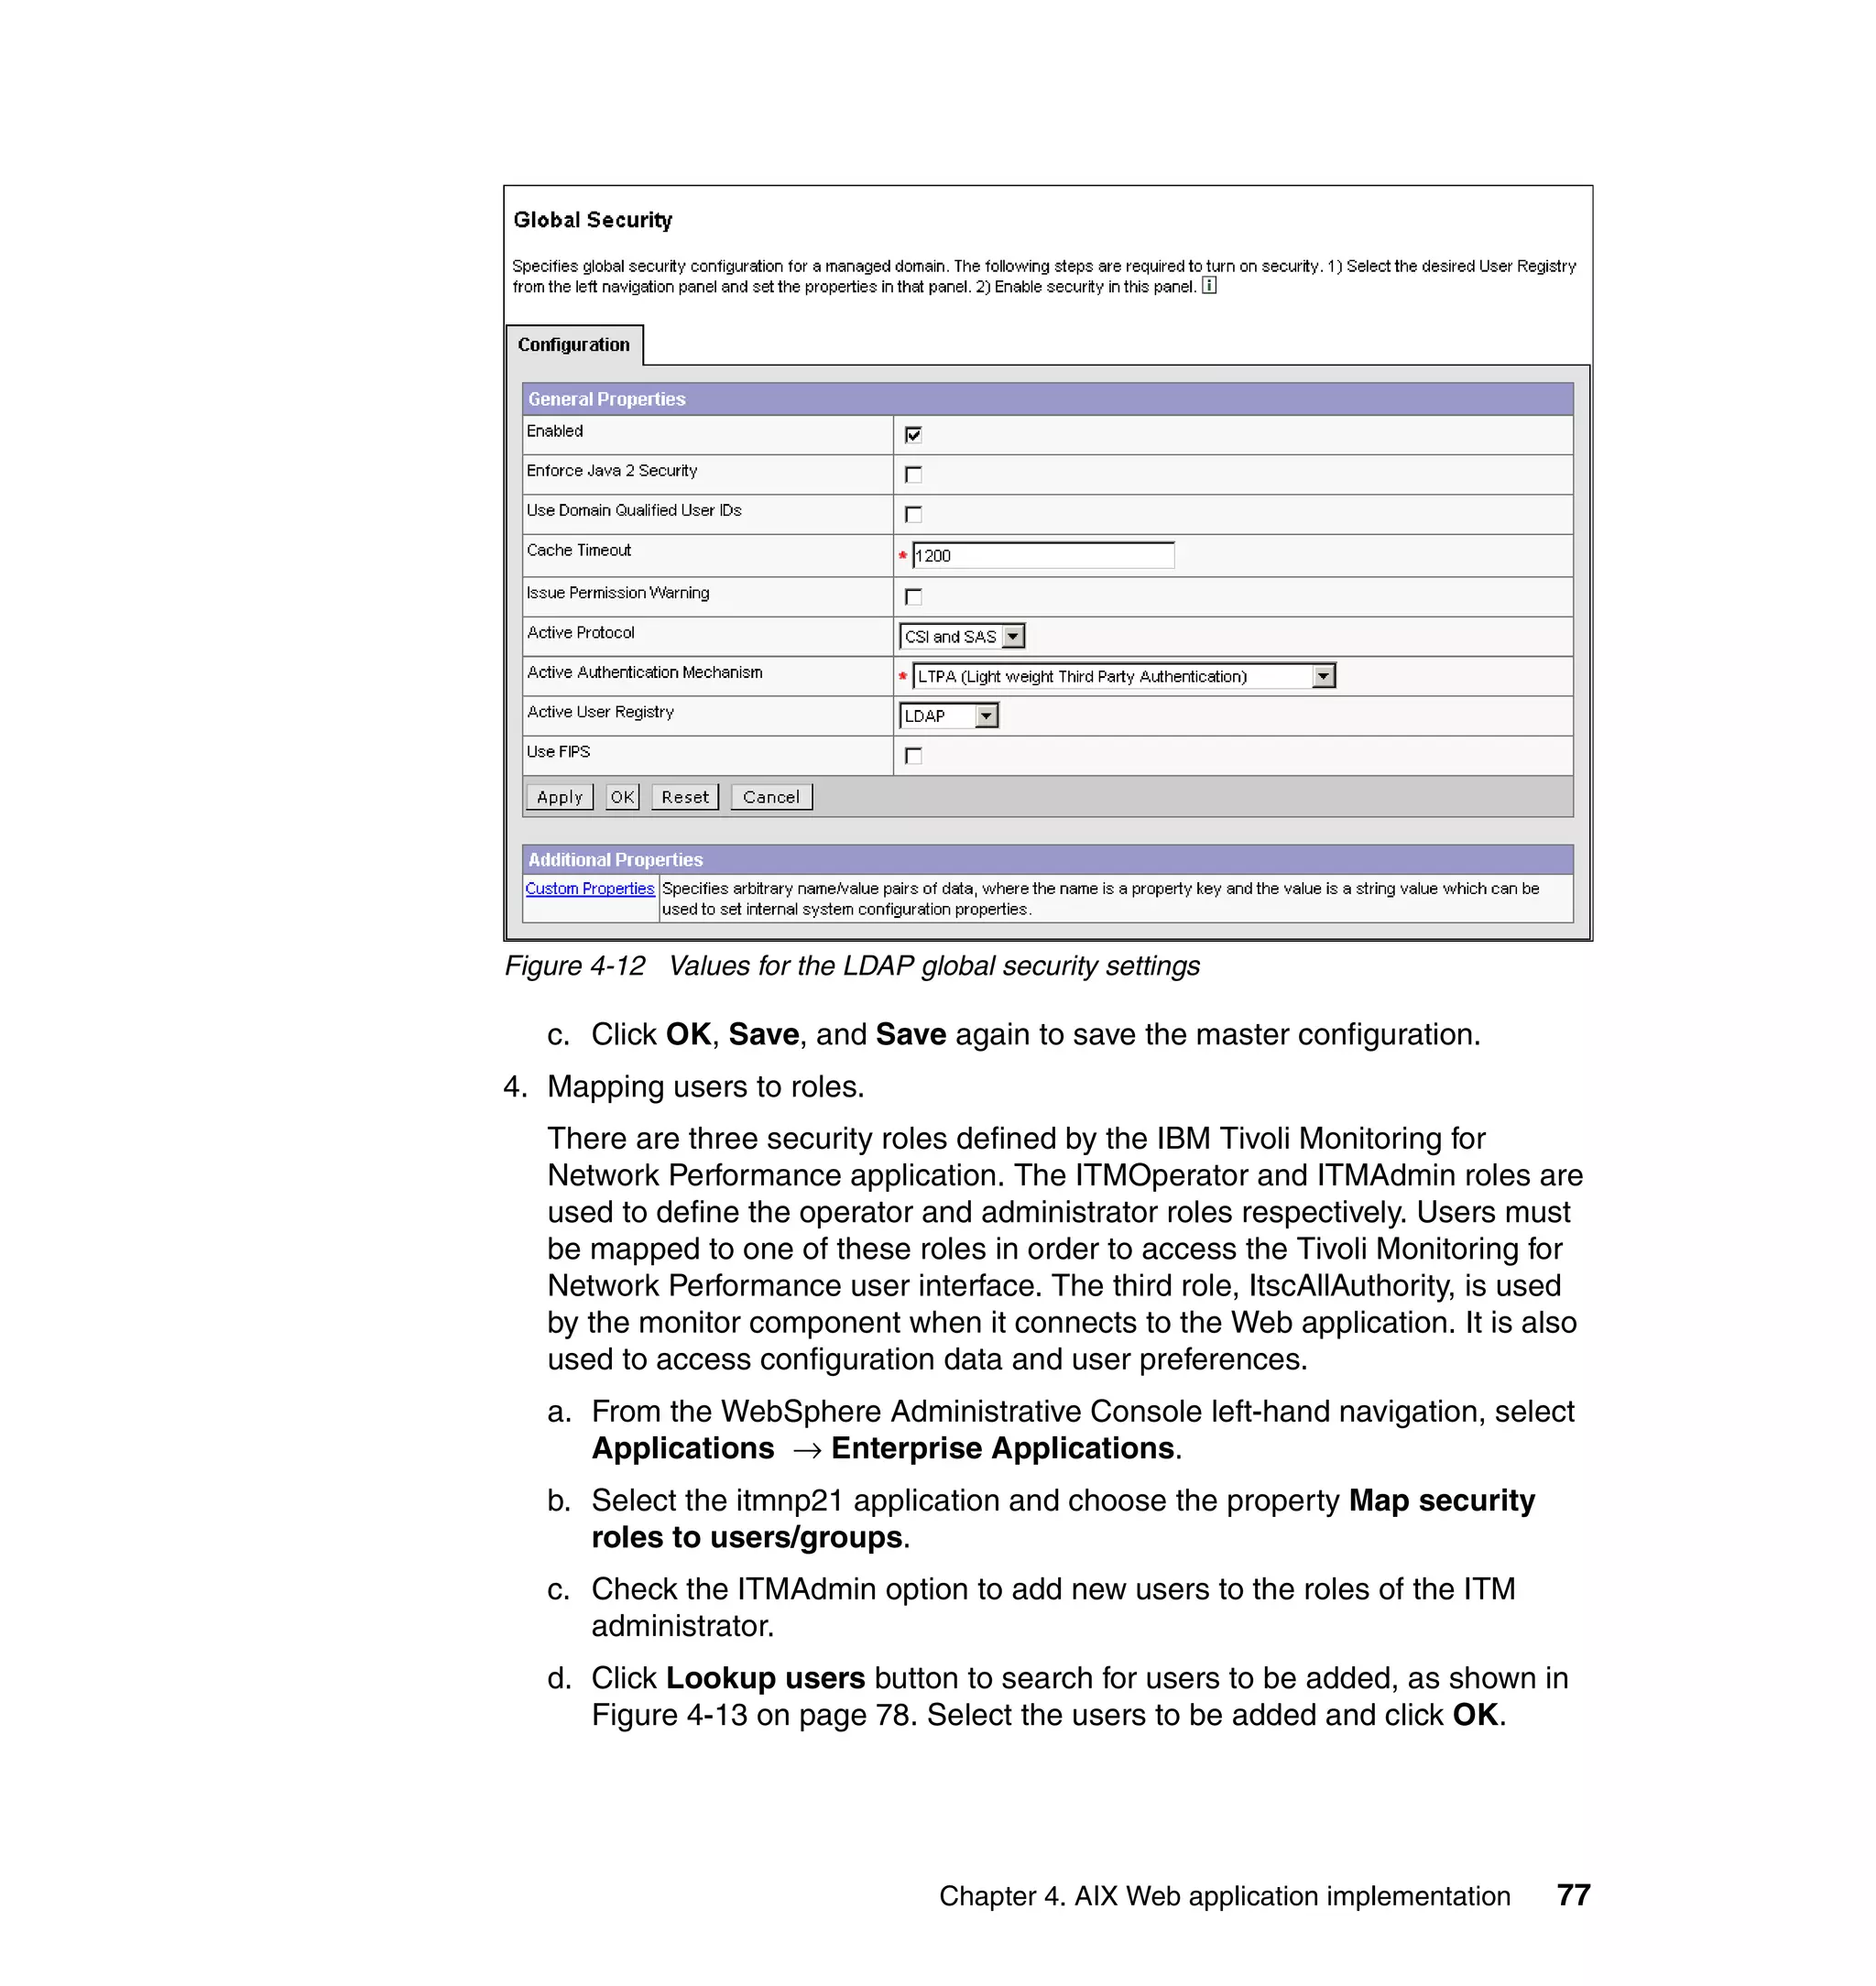
64 IBM Tivoli Monitoring for Network Performance V2.1: The Mainframe Network Management Solution](https://image.slidesharecdn.com/ibmtivolimonitoringfornetworkperformancev2-1themainframenetworkmanagementsolutionsg246360-120524030008-phpapp02/75/Ibm-tivoli-monitoring-for-network-performance-v2-1-the-mainframe-network-management-solution-sg246360-80-2048.jpg)
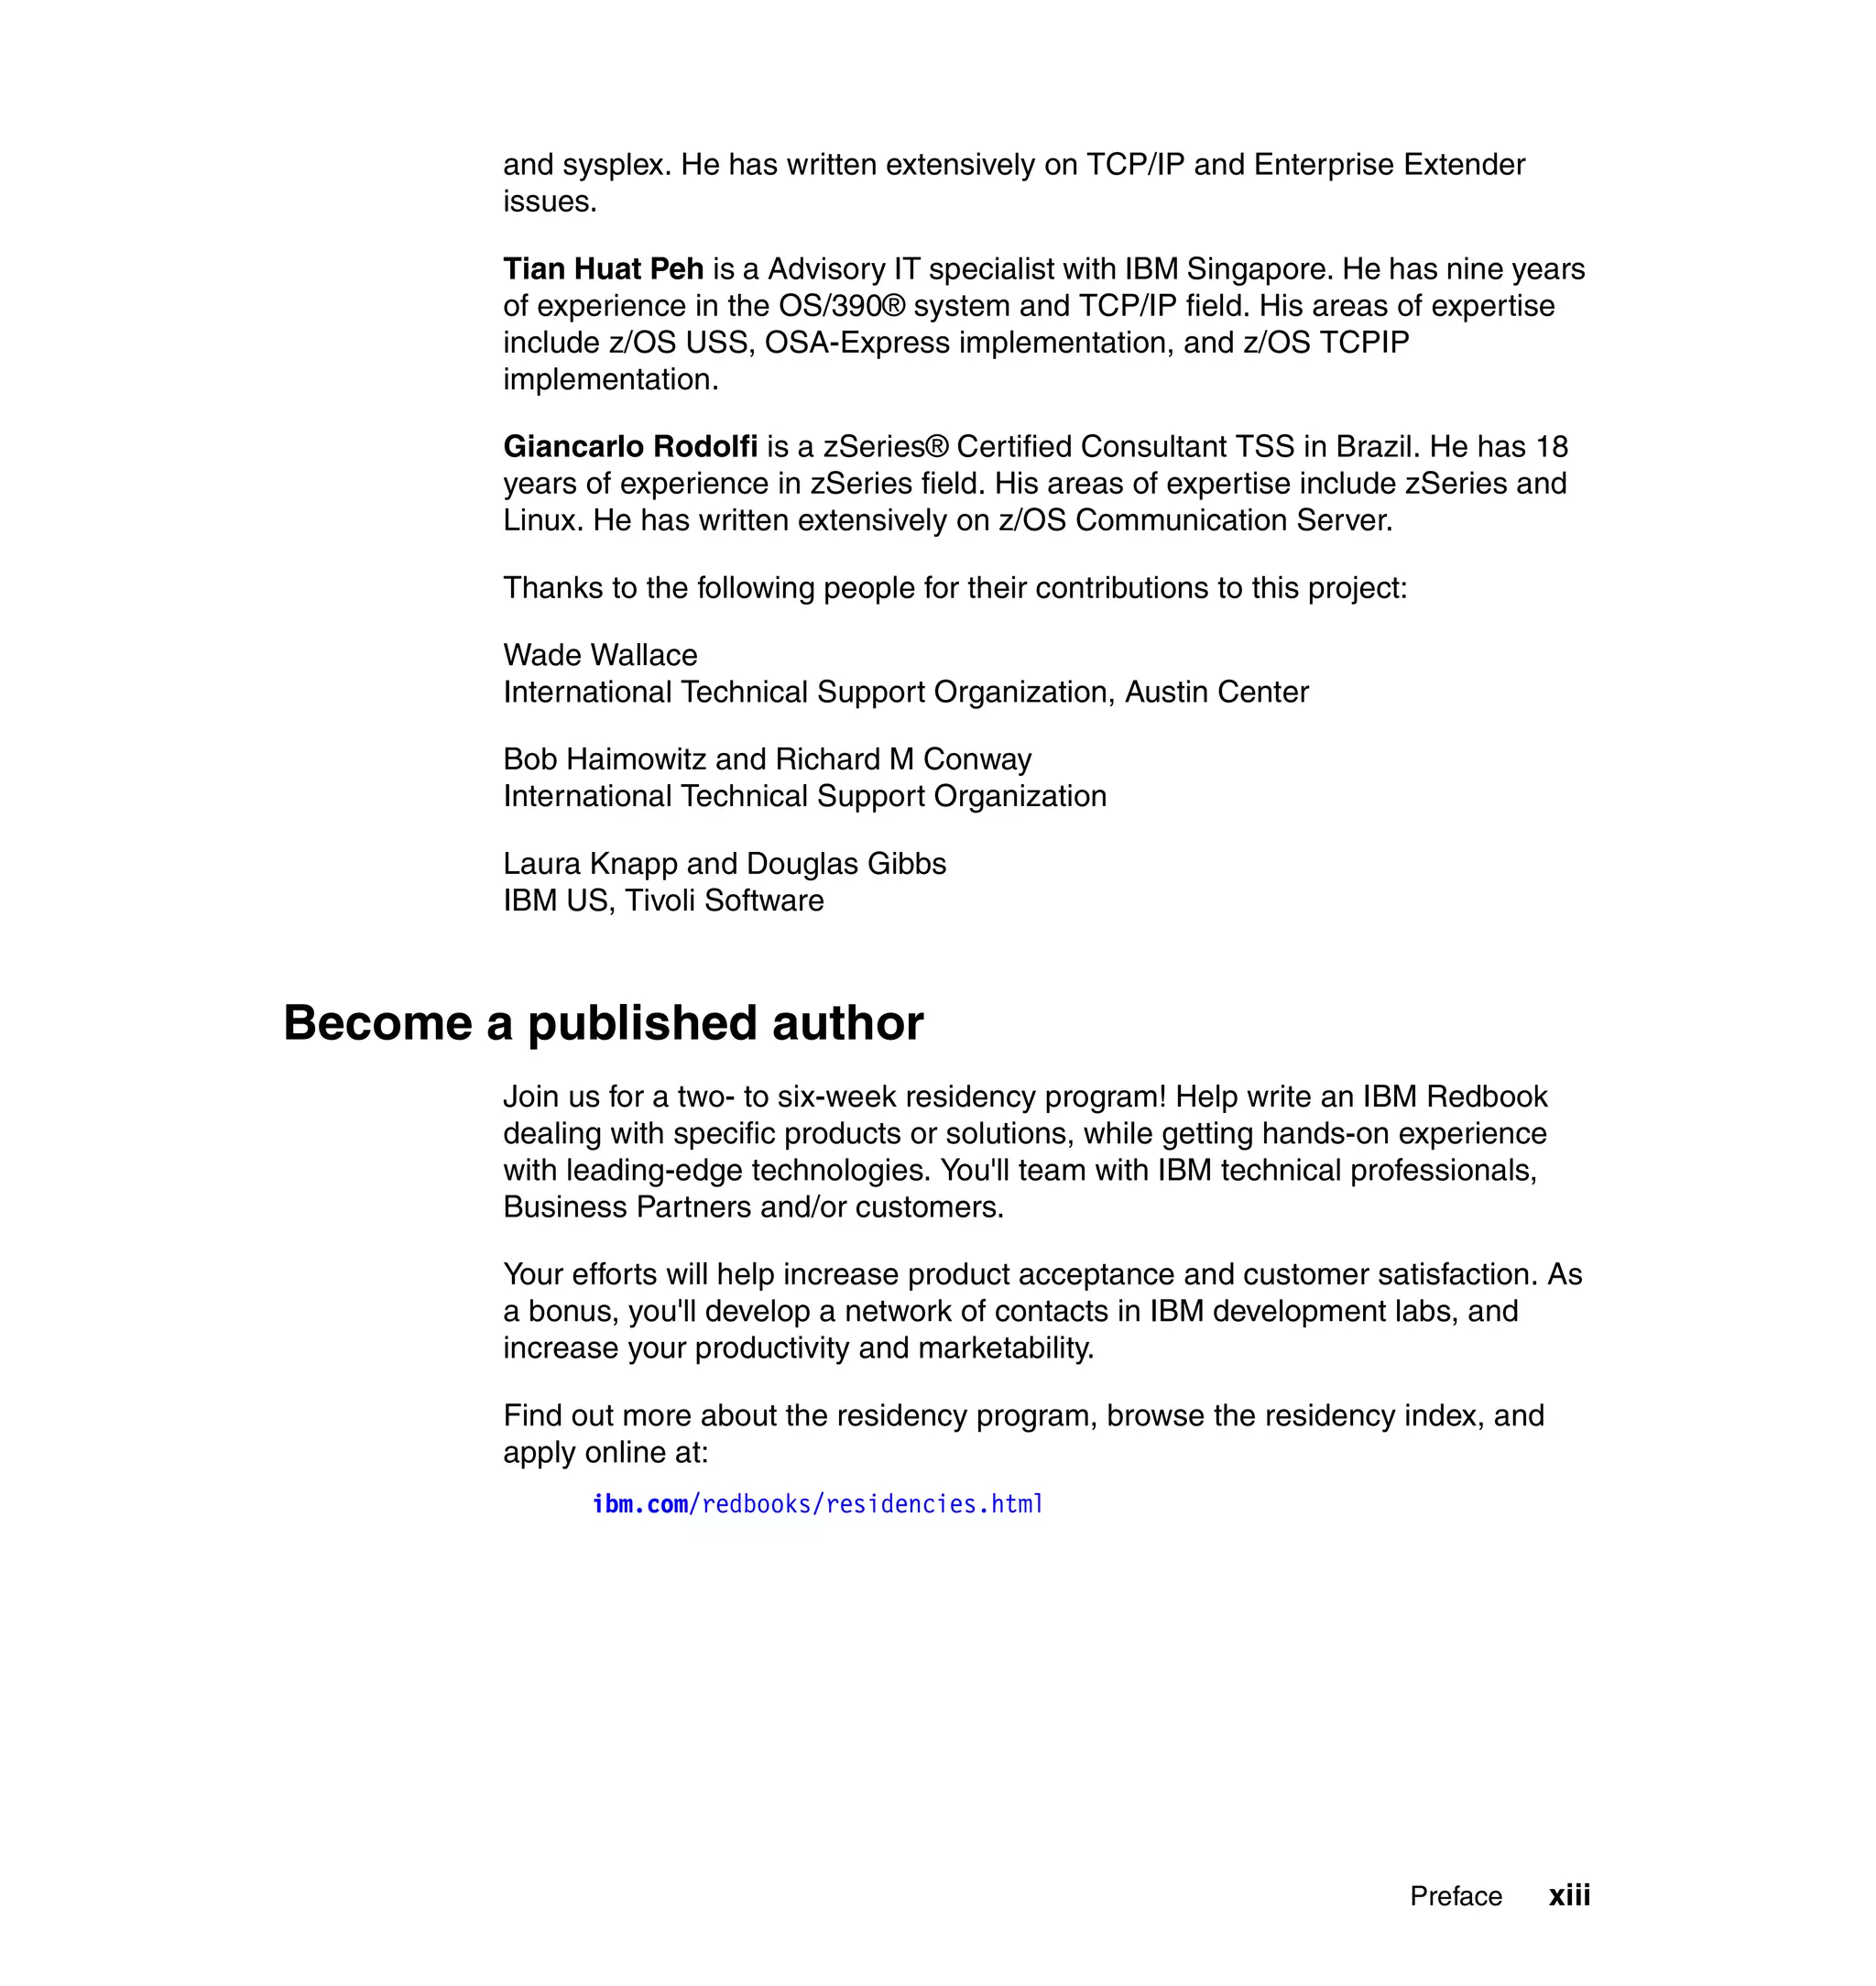
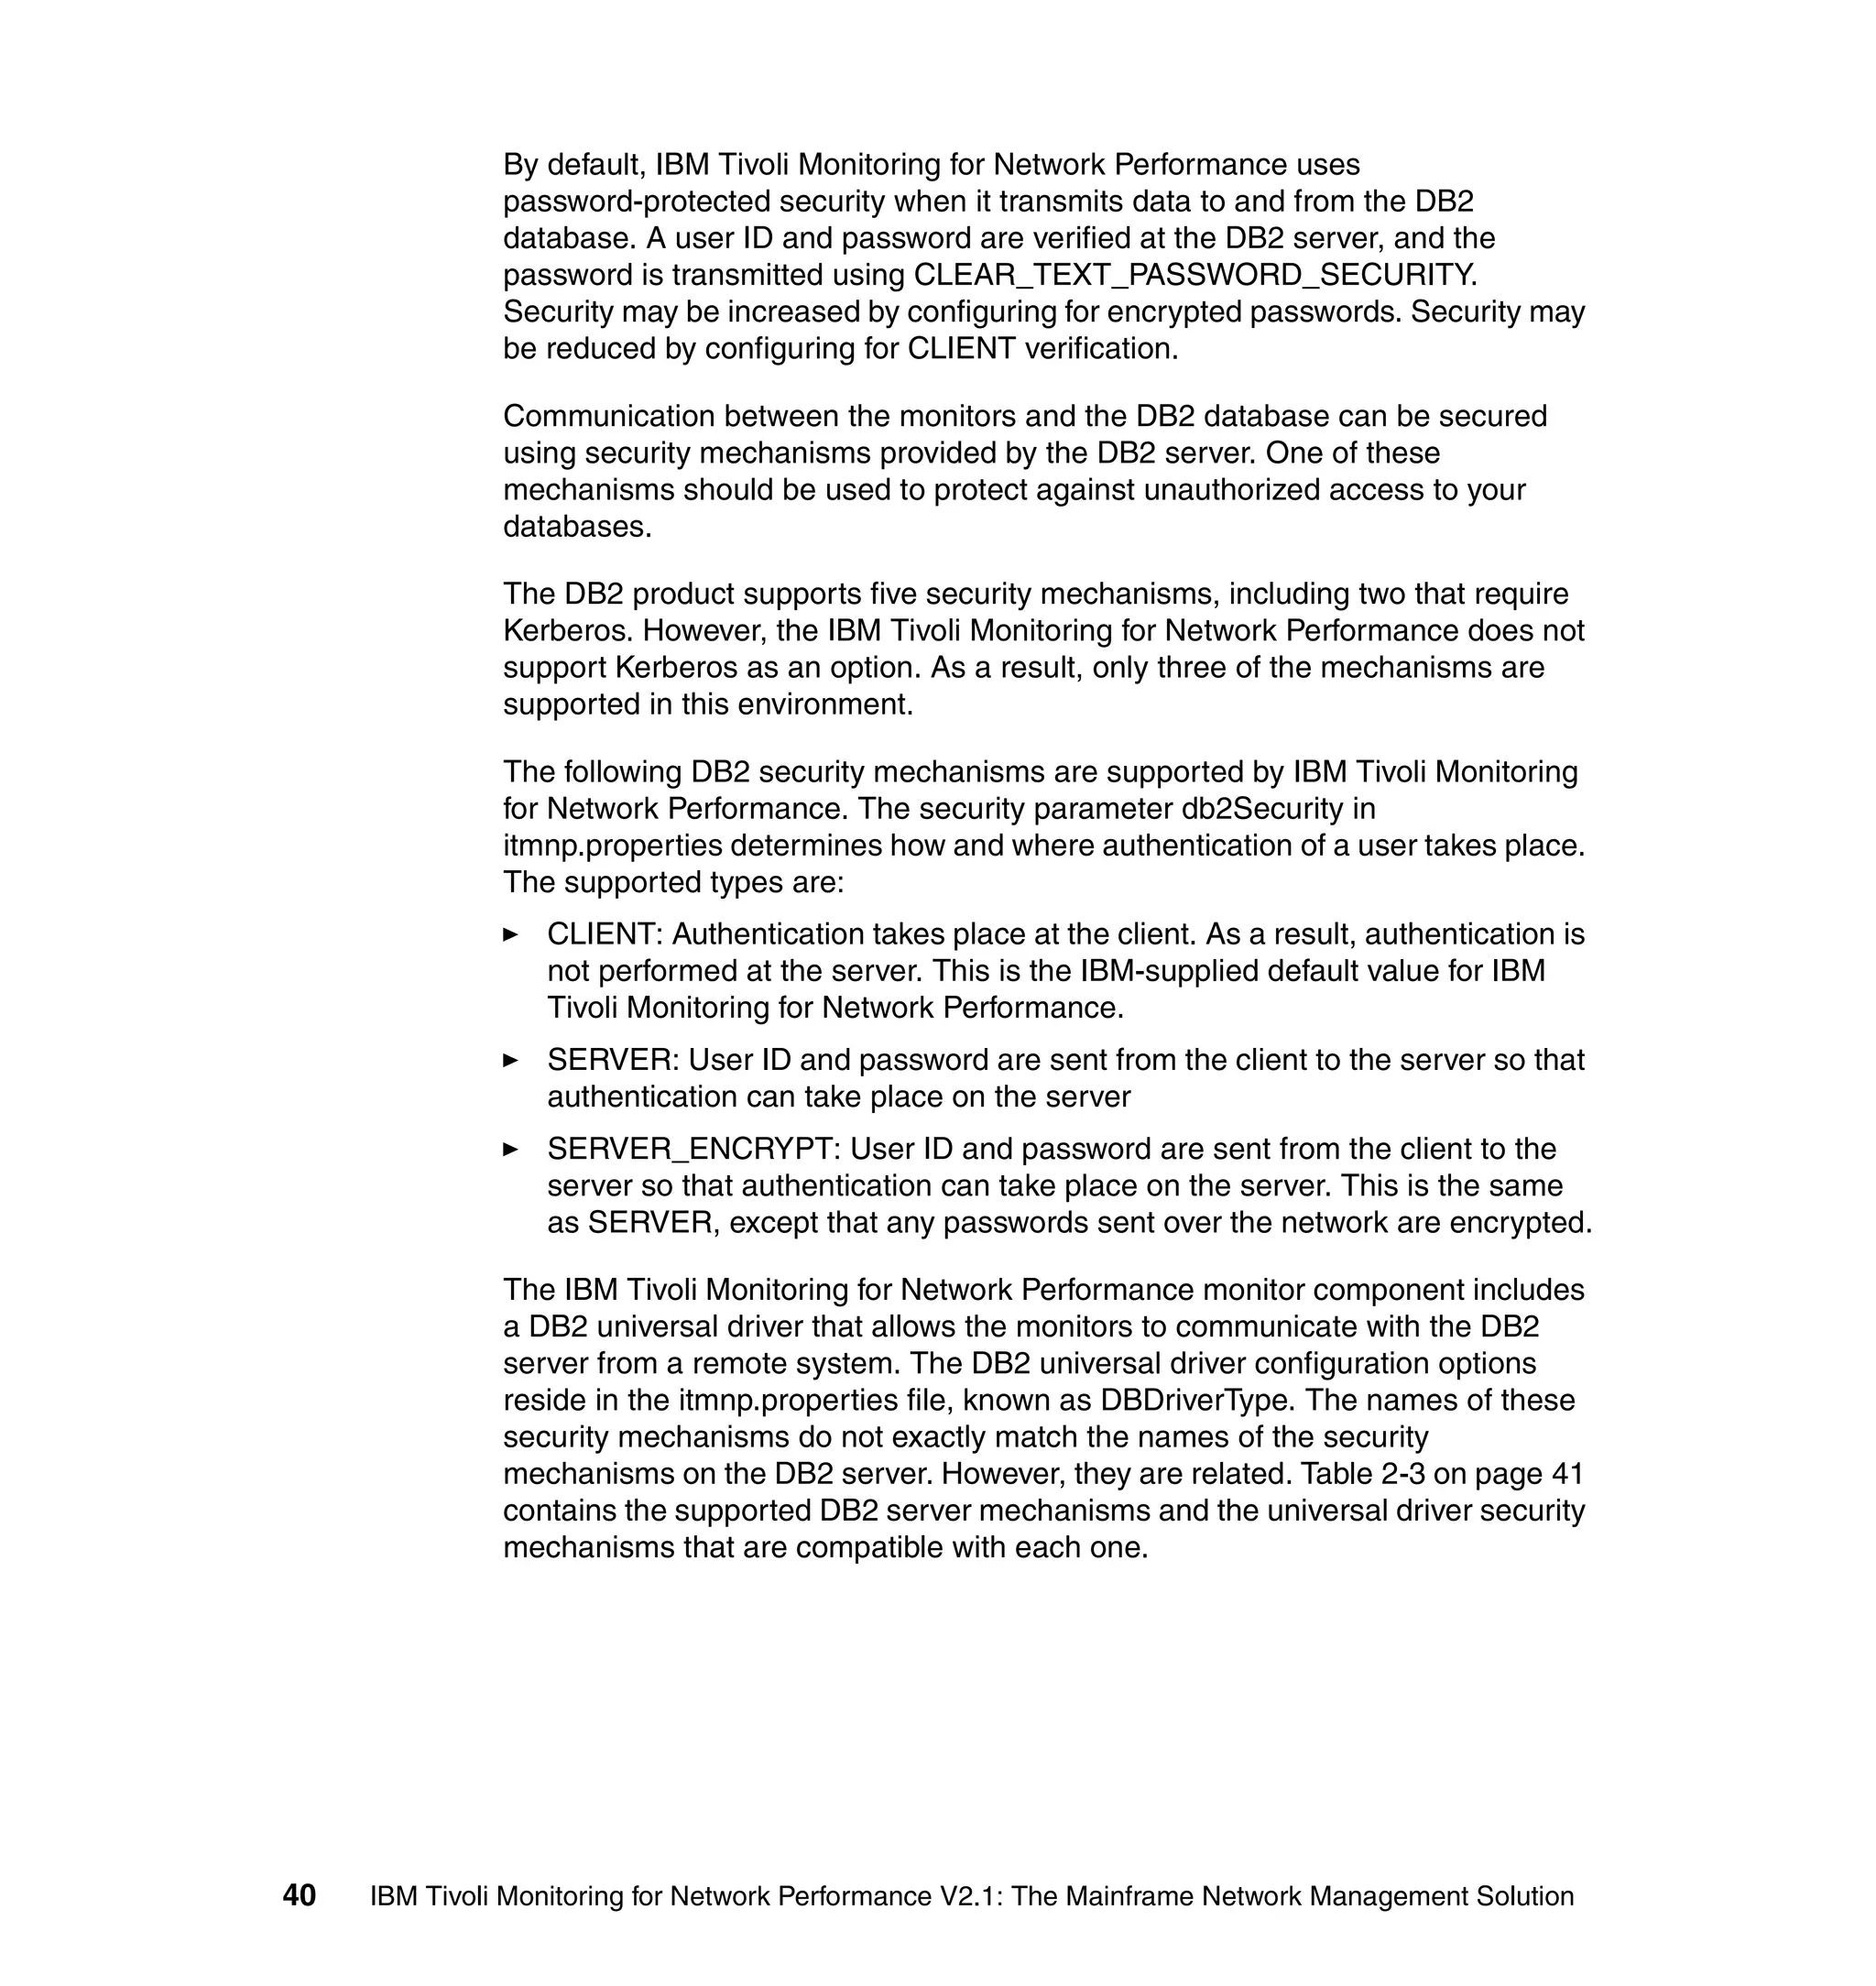
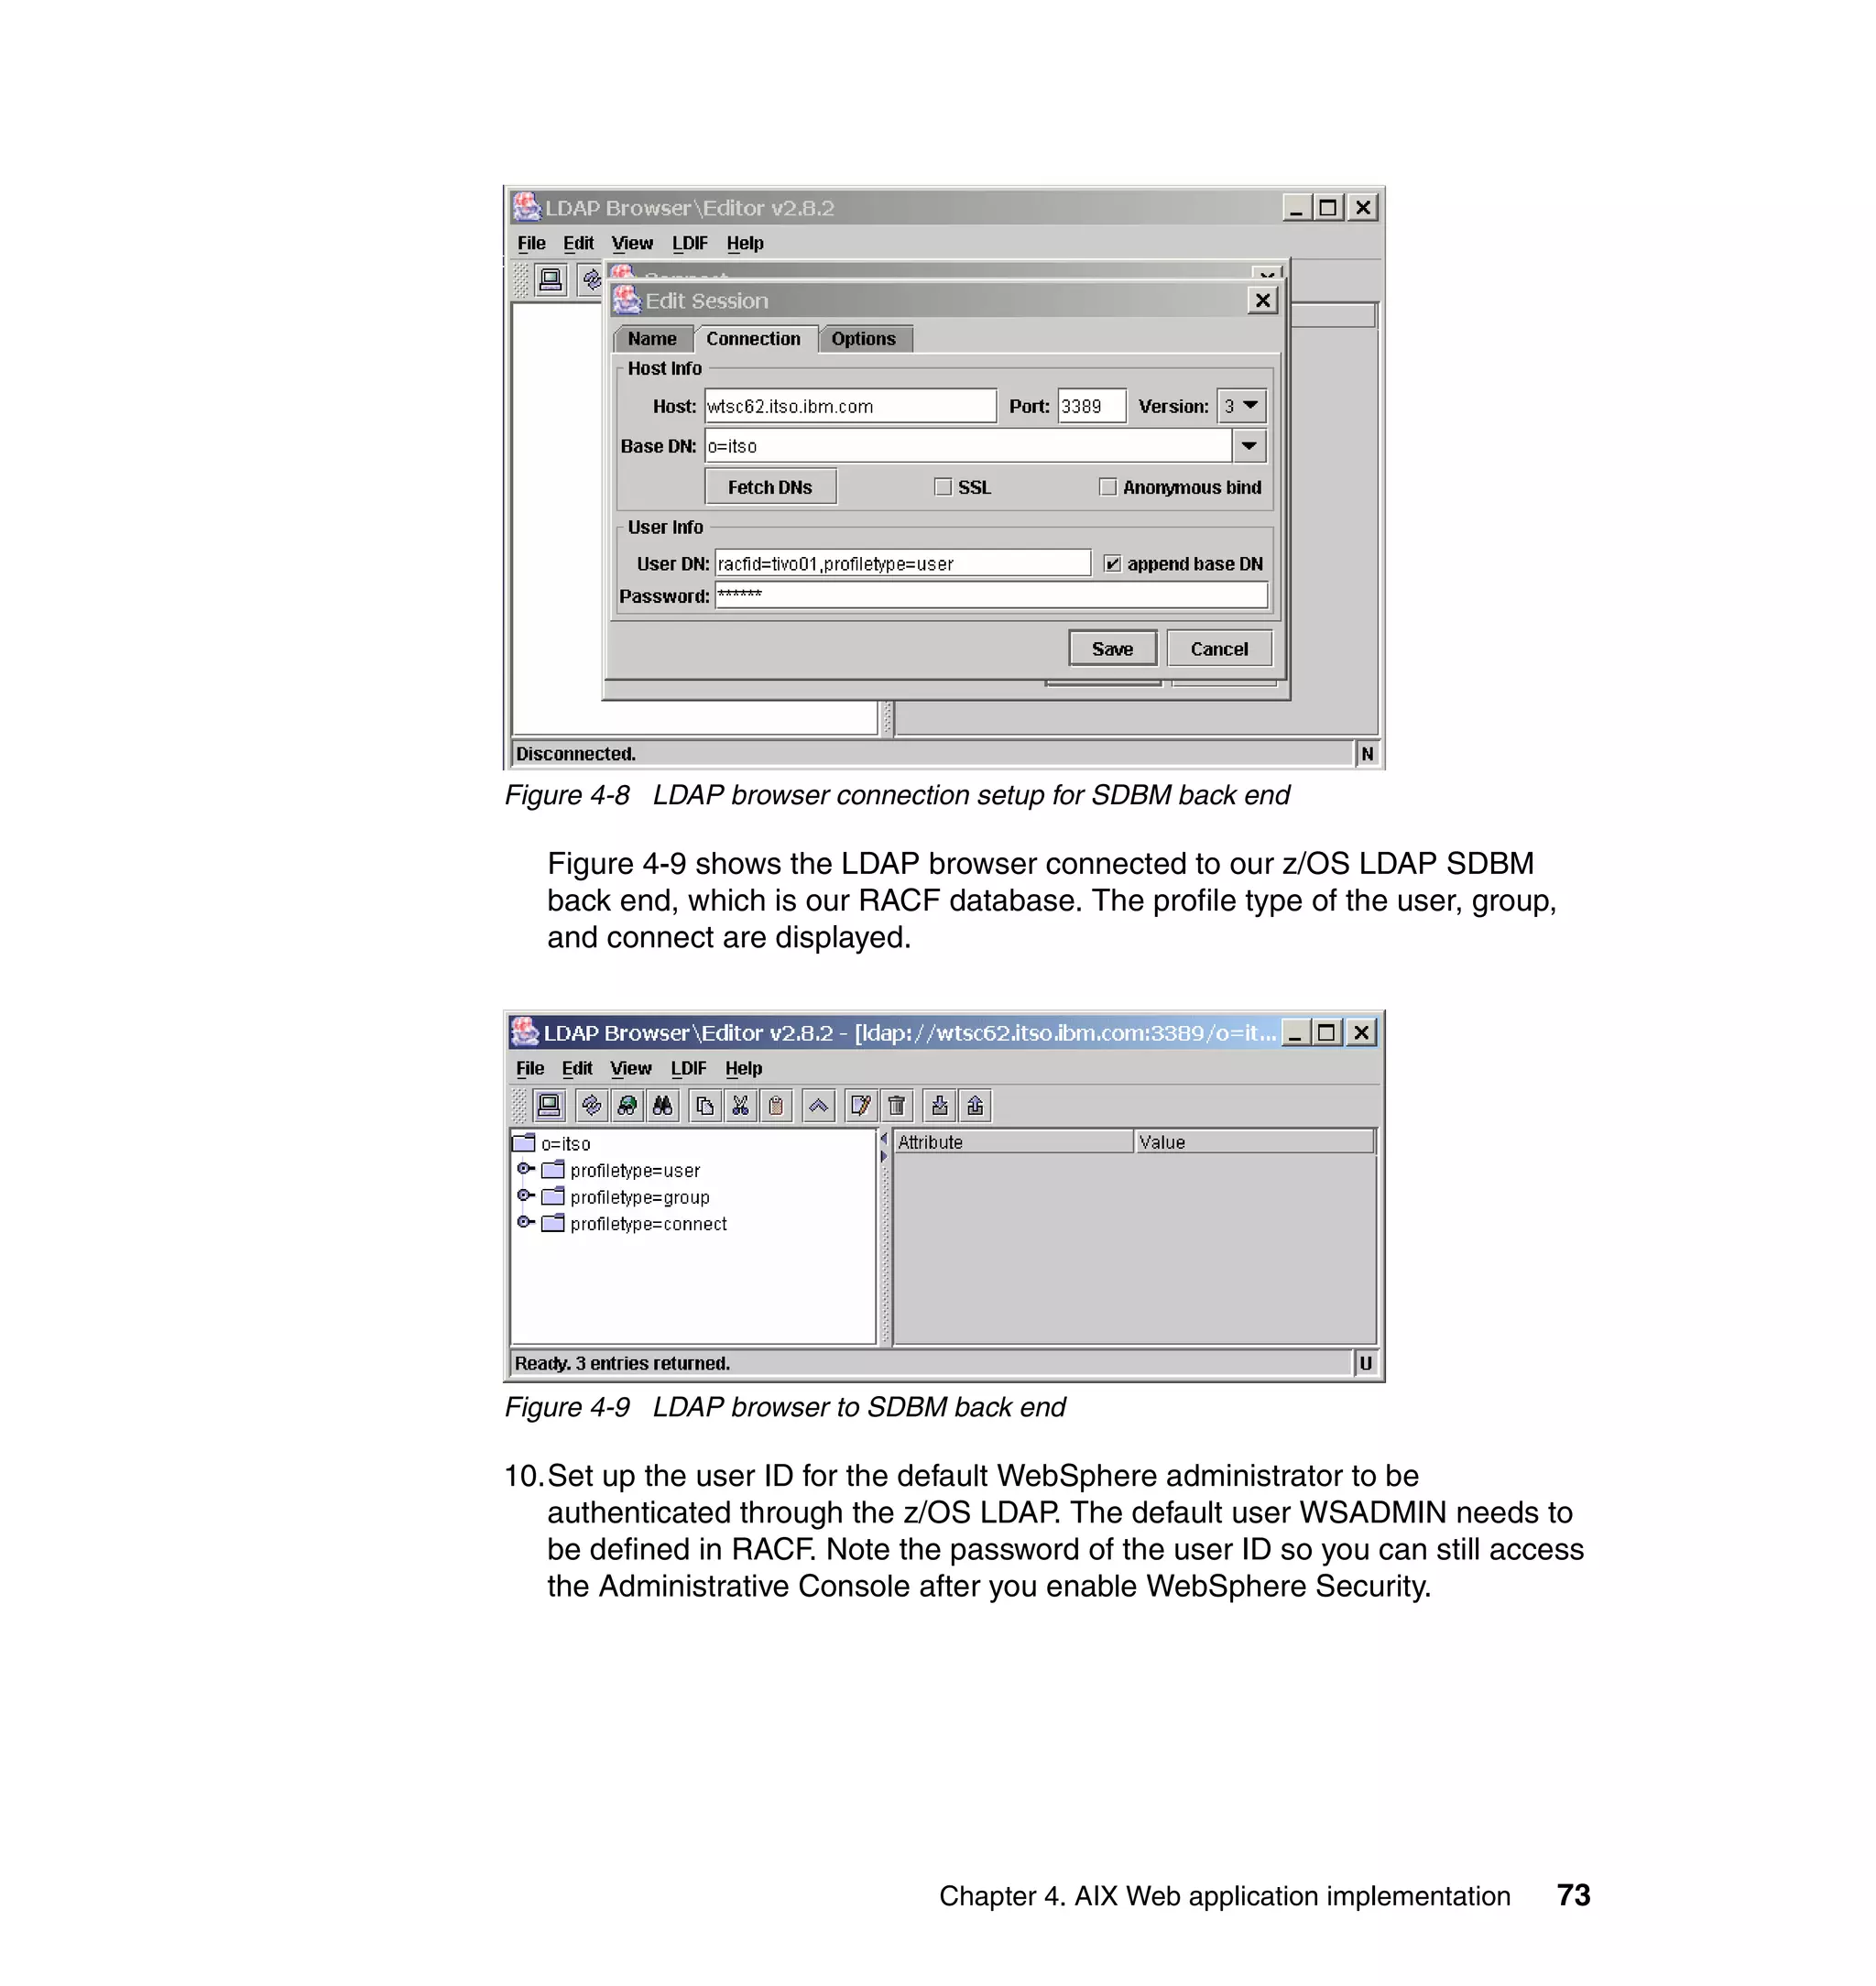
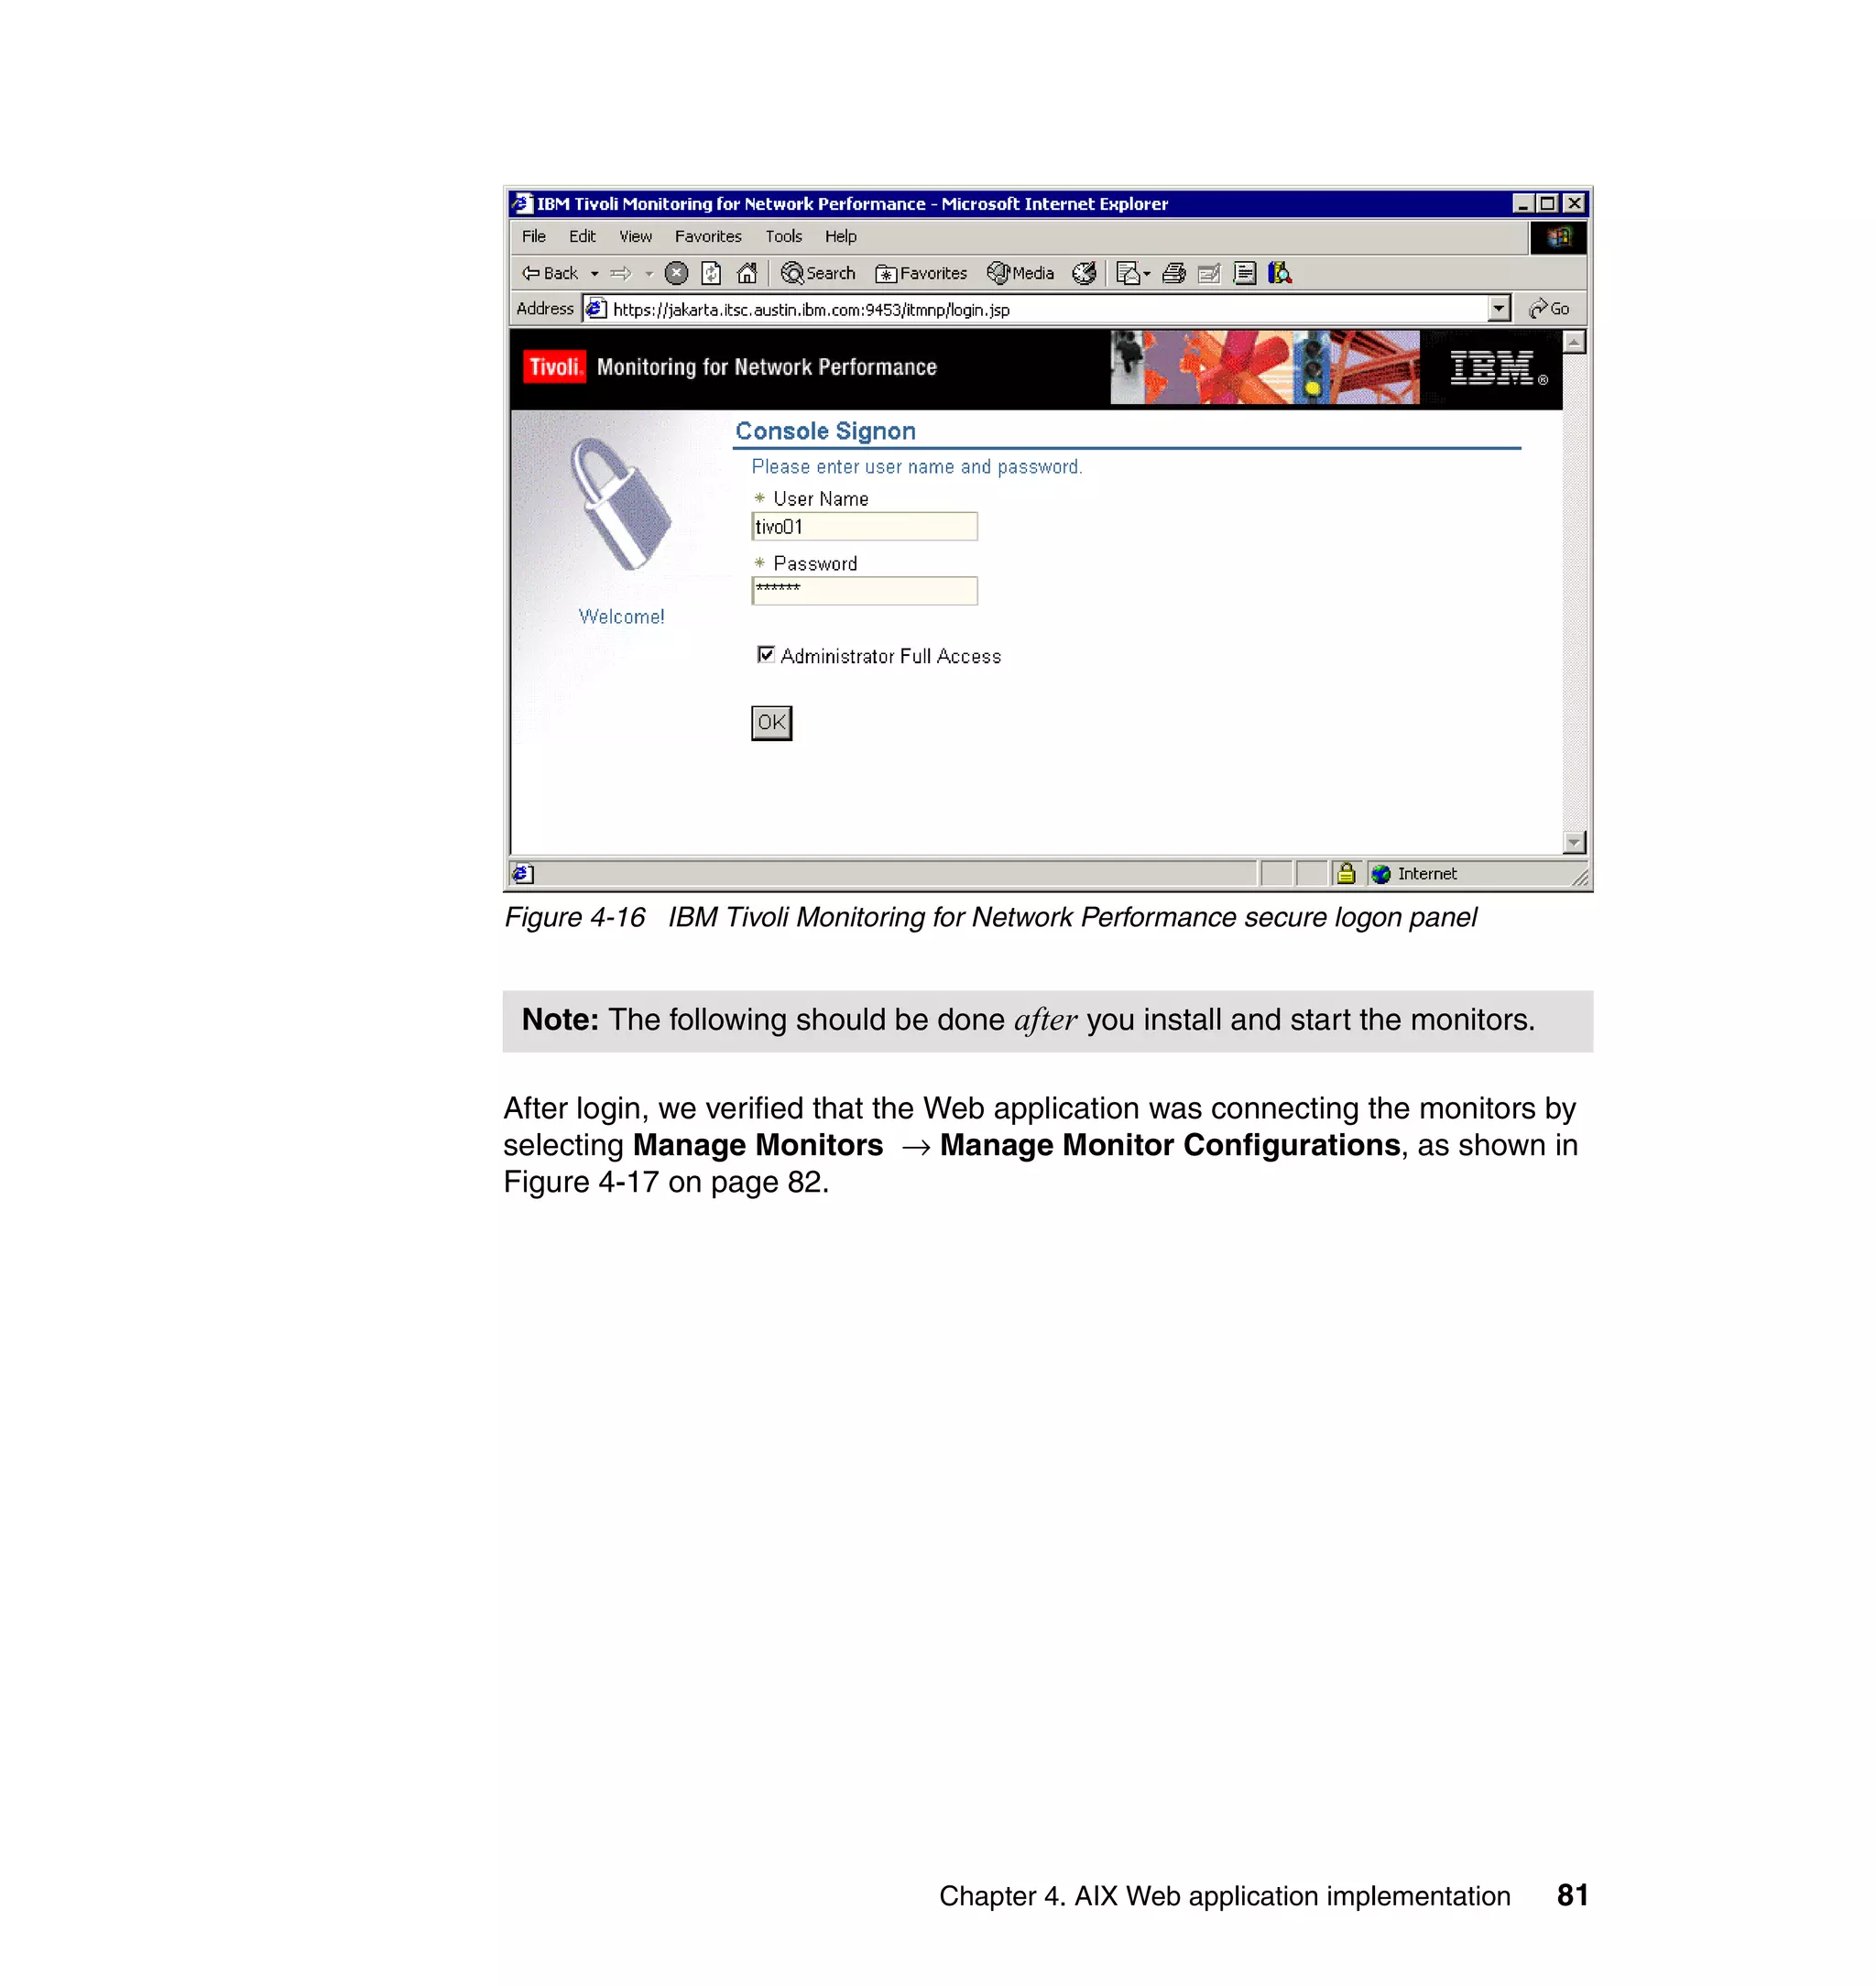
![Change / Show Characteristics of a User
Type or select values in entry fields.
Press Enter AFTER making all desired changes.
[TOP] [Entry Fields]
* User NAME root
User ID [0]
#
ADMINISTRATIVE USER? true +
Primary GROUP [system] +
Group SET <dit,lp,db2grp1,mqm,mq> +
ADMINISTRATIVE GROUPS [mqbrkrs,mqm] +
ROLES [] +
Another user can SU TO USER? true +
SU GROUPS [ALL] +
HOME directory [/]
Initial PROGRAM [/usr/bin/ksh]
User INFORMATION []
EXPIRATION date (MMDDhhmmyy) [0]
Is this user ACCOUNT LOCKED? false +
[MORE...36]
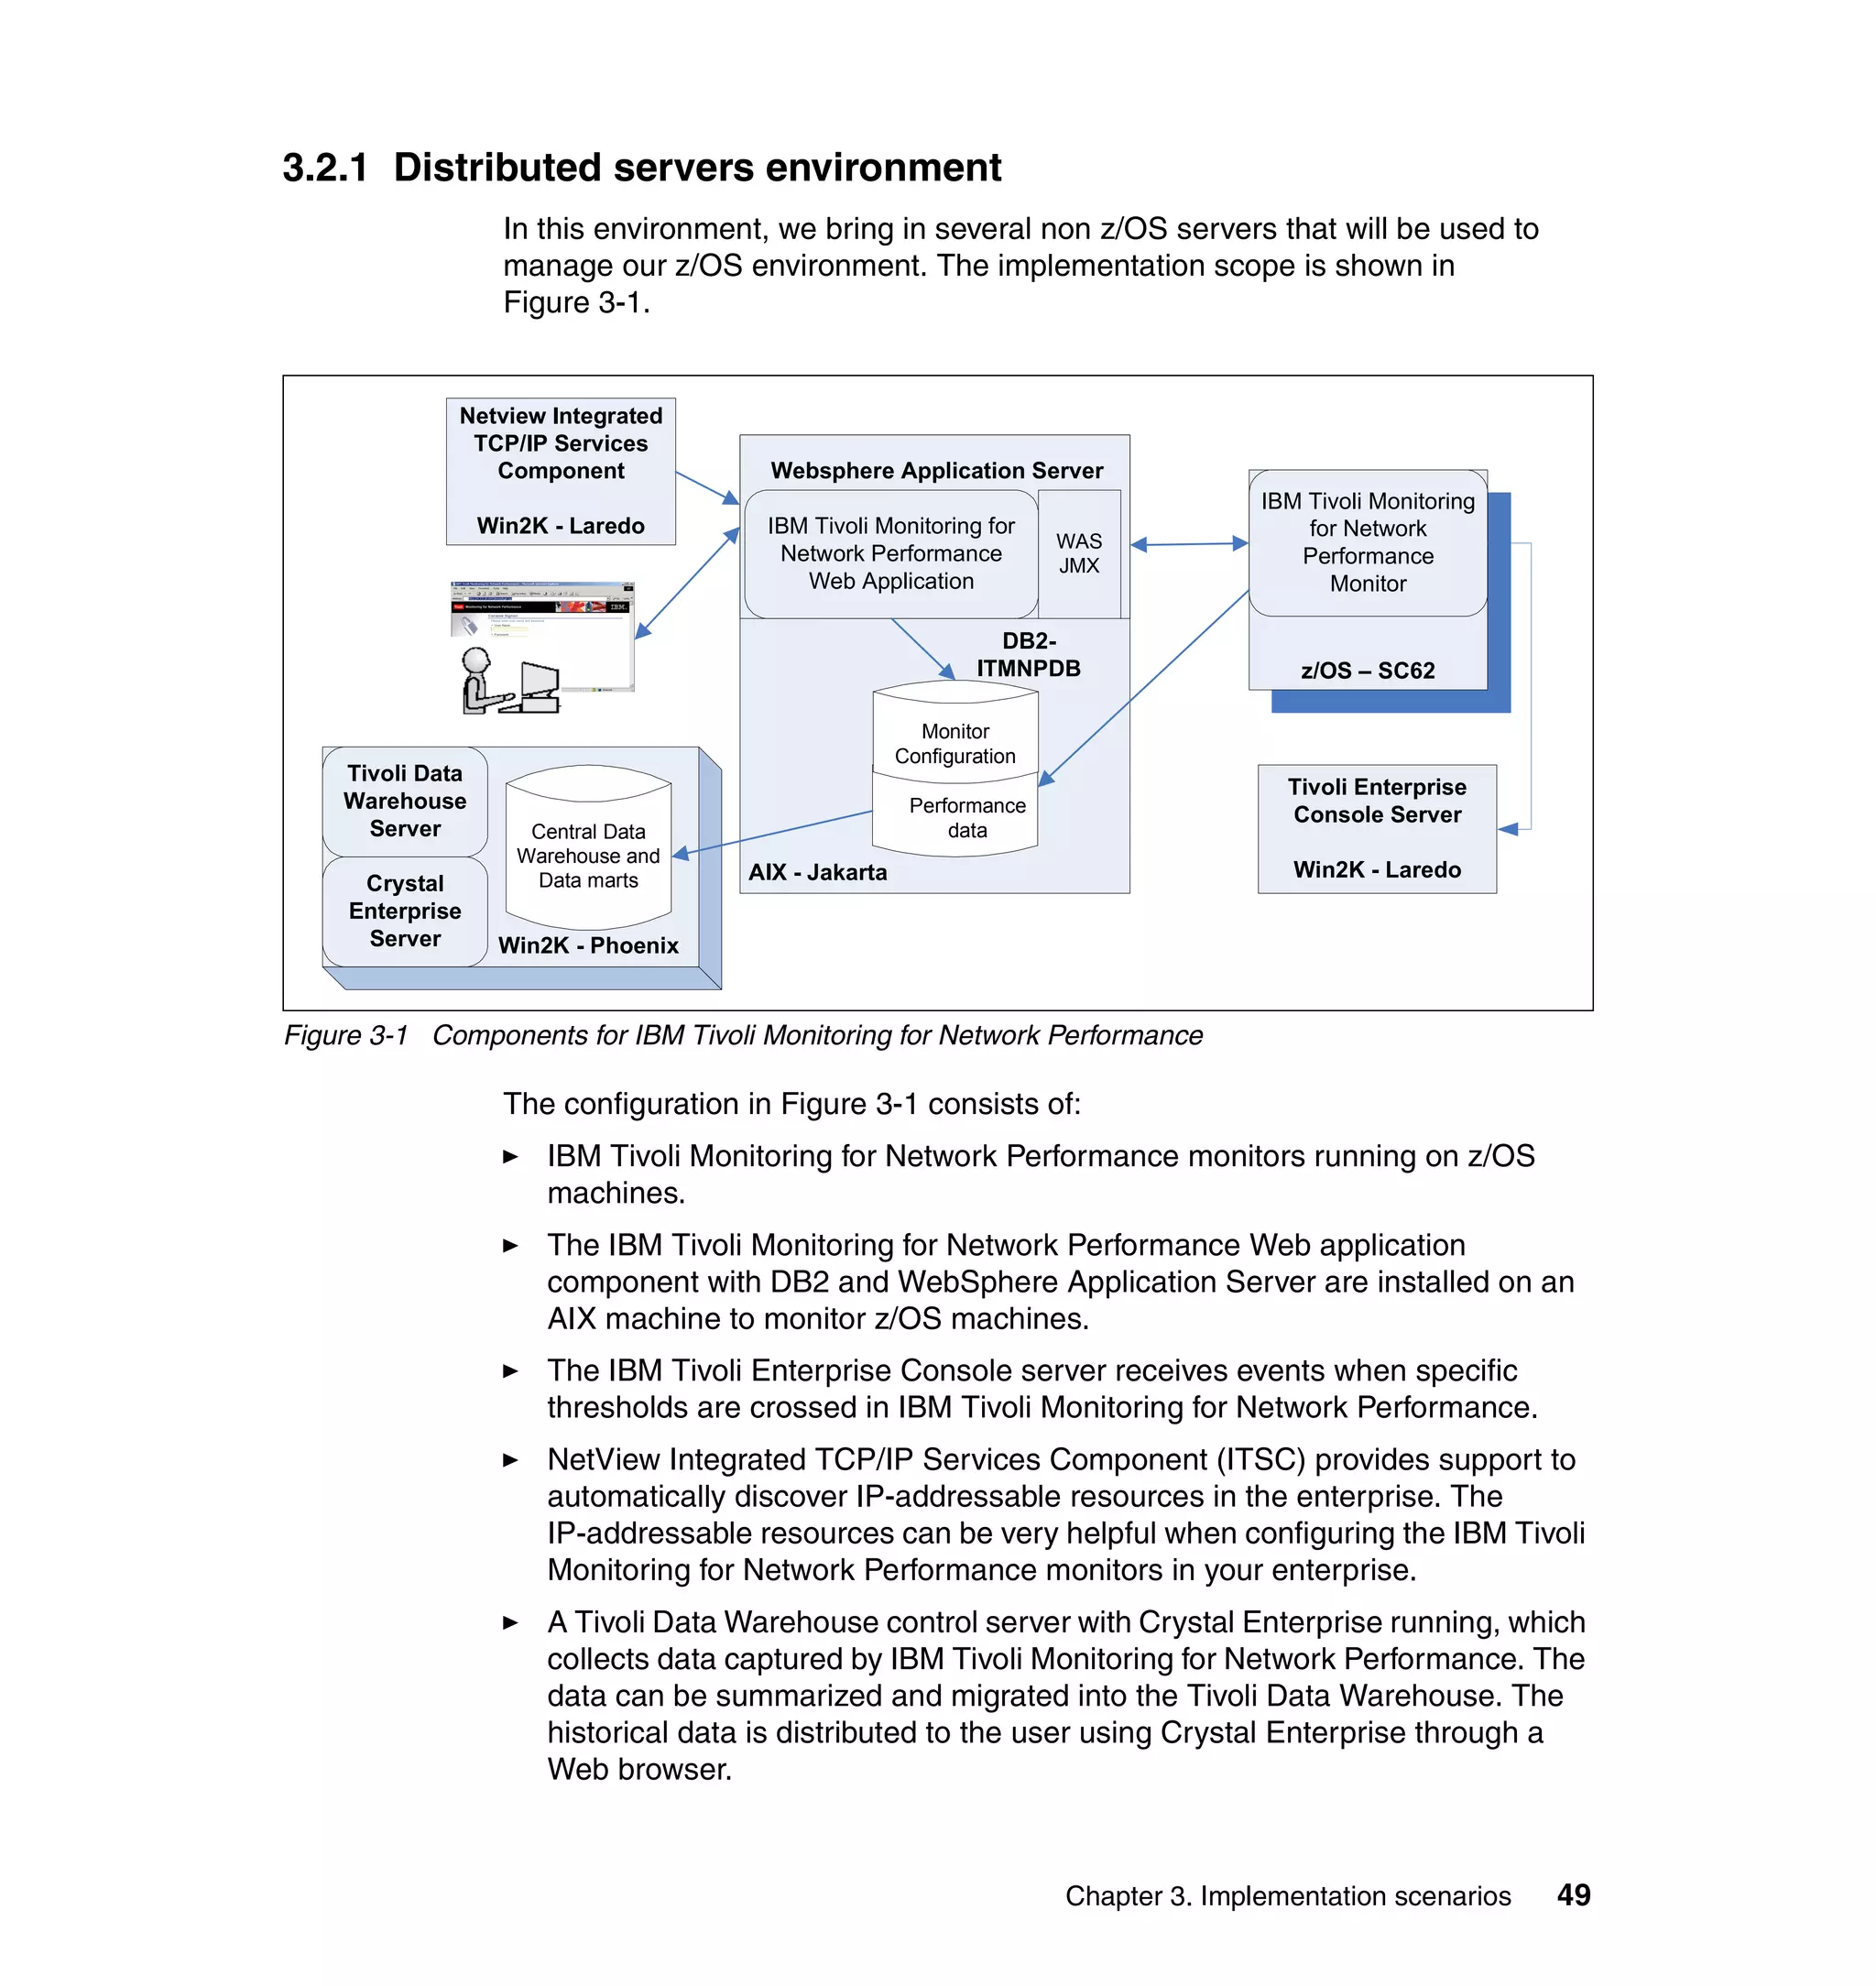
Figure 4-7 Root user properties
5. Add db2grp1 to the Group SET and press Enter to apply the changes (shown
highlighted in Figure 4-7). When the command status is OK, press Esc+0 to
exit from the smit interface.
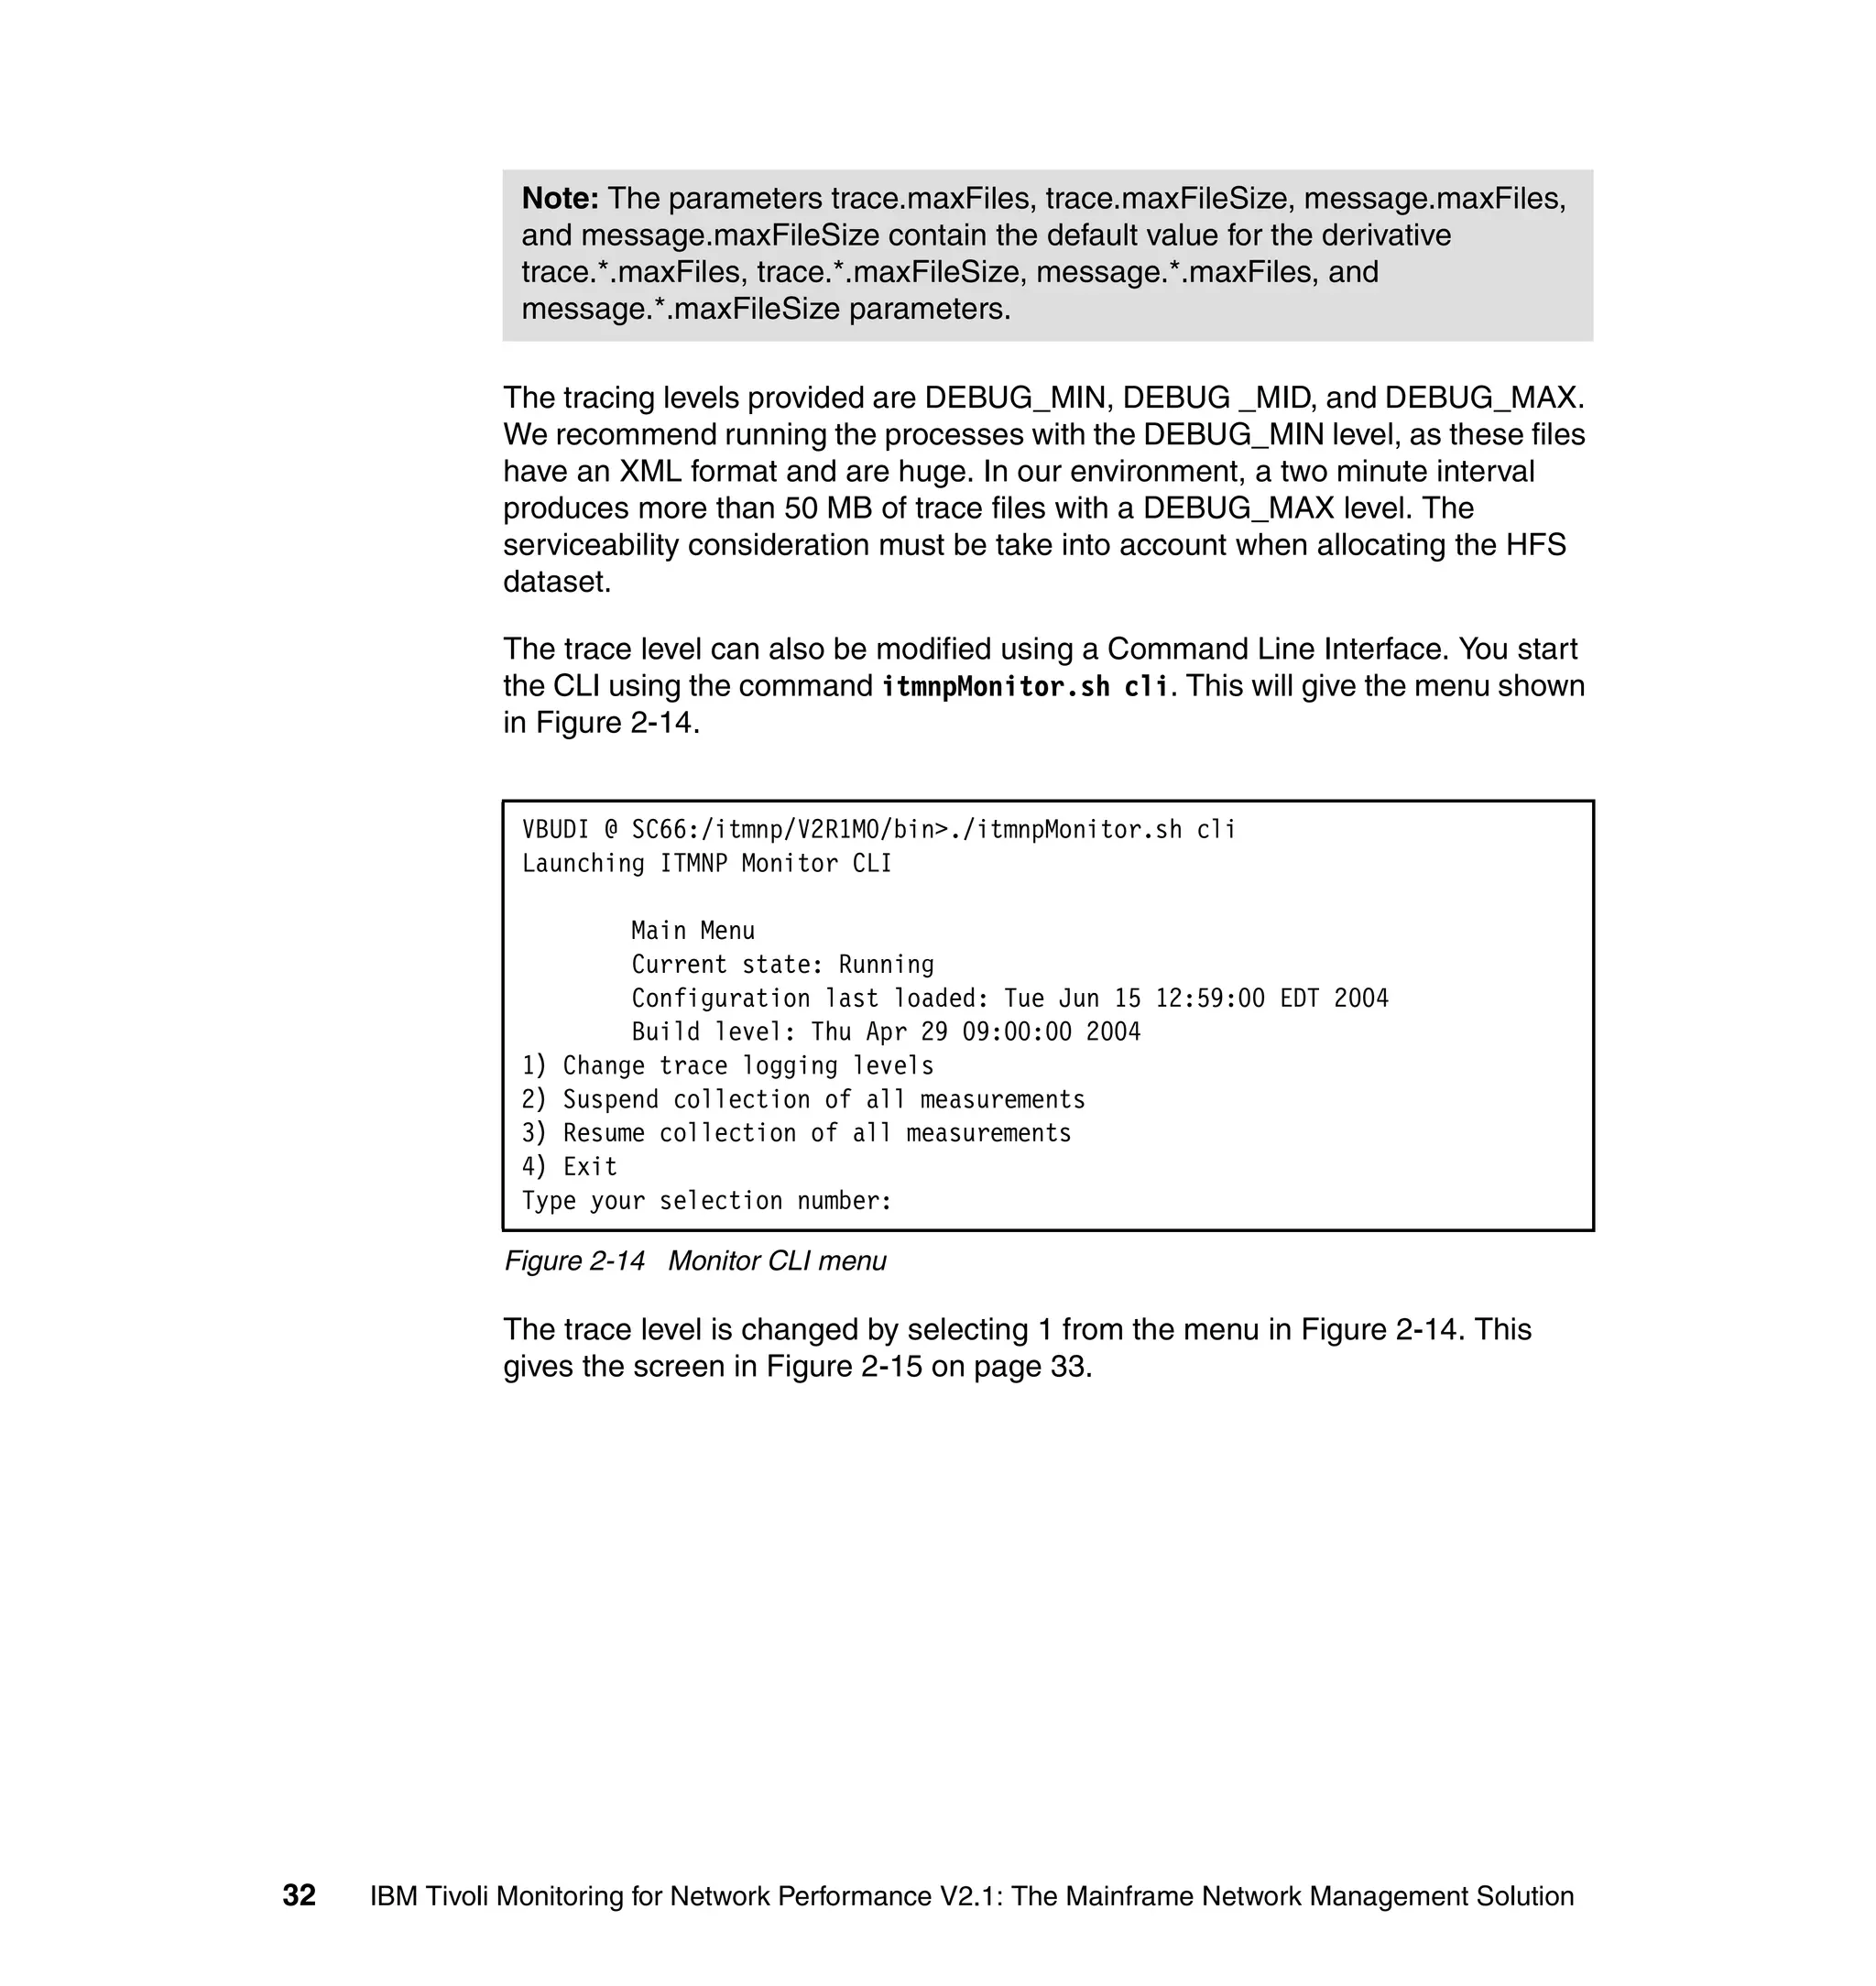
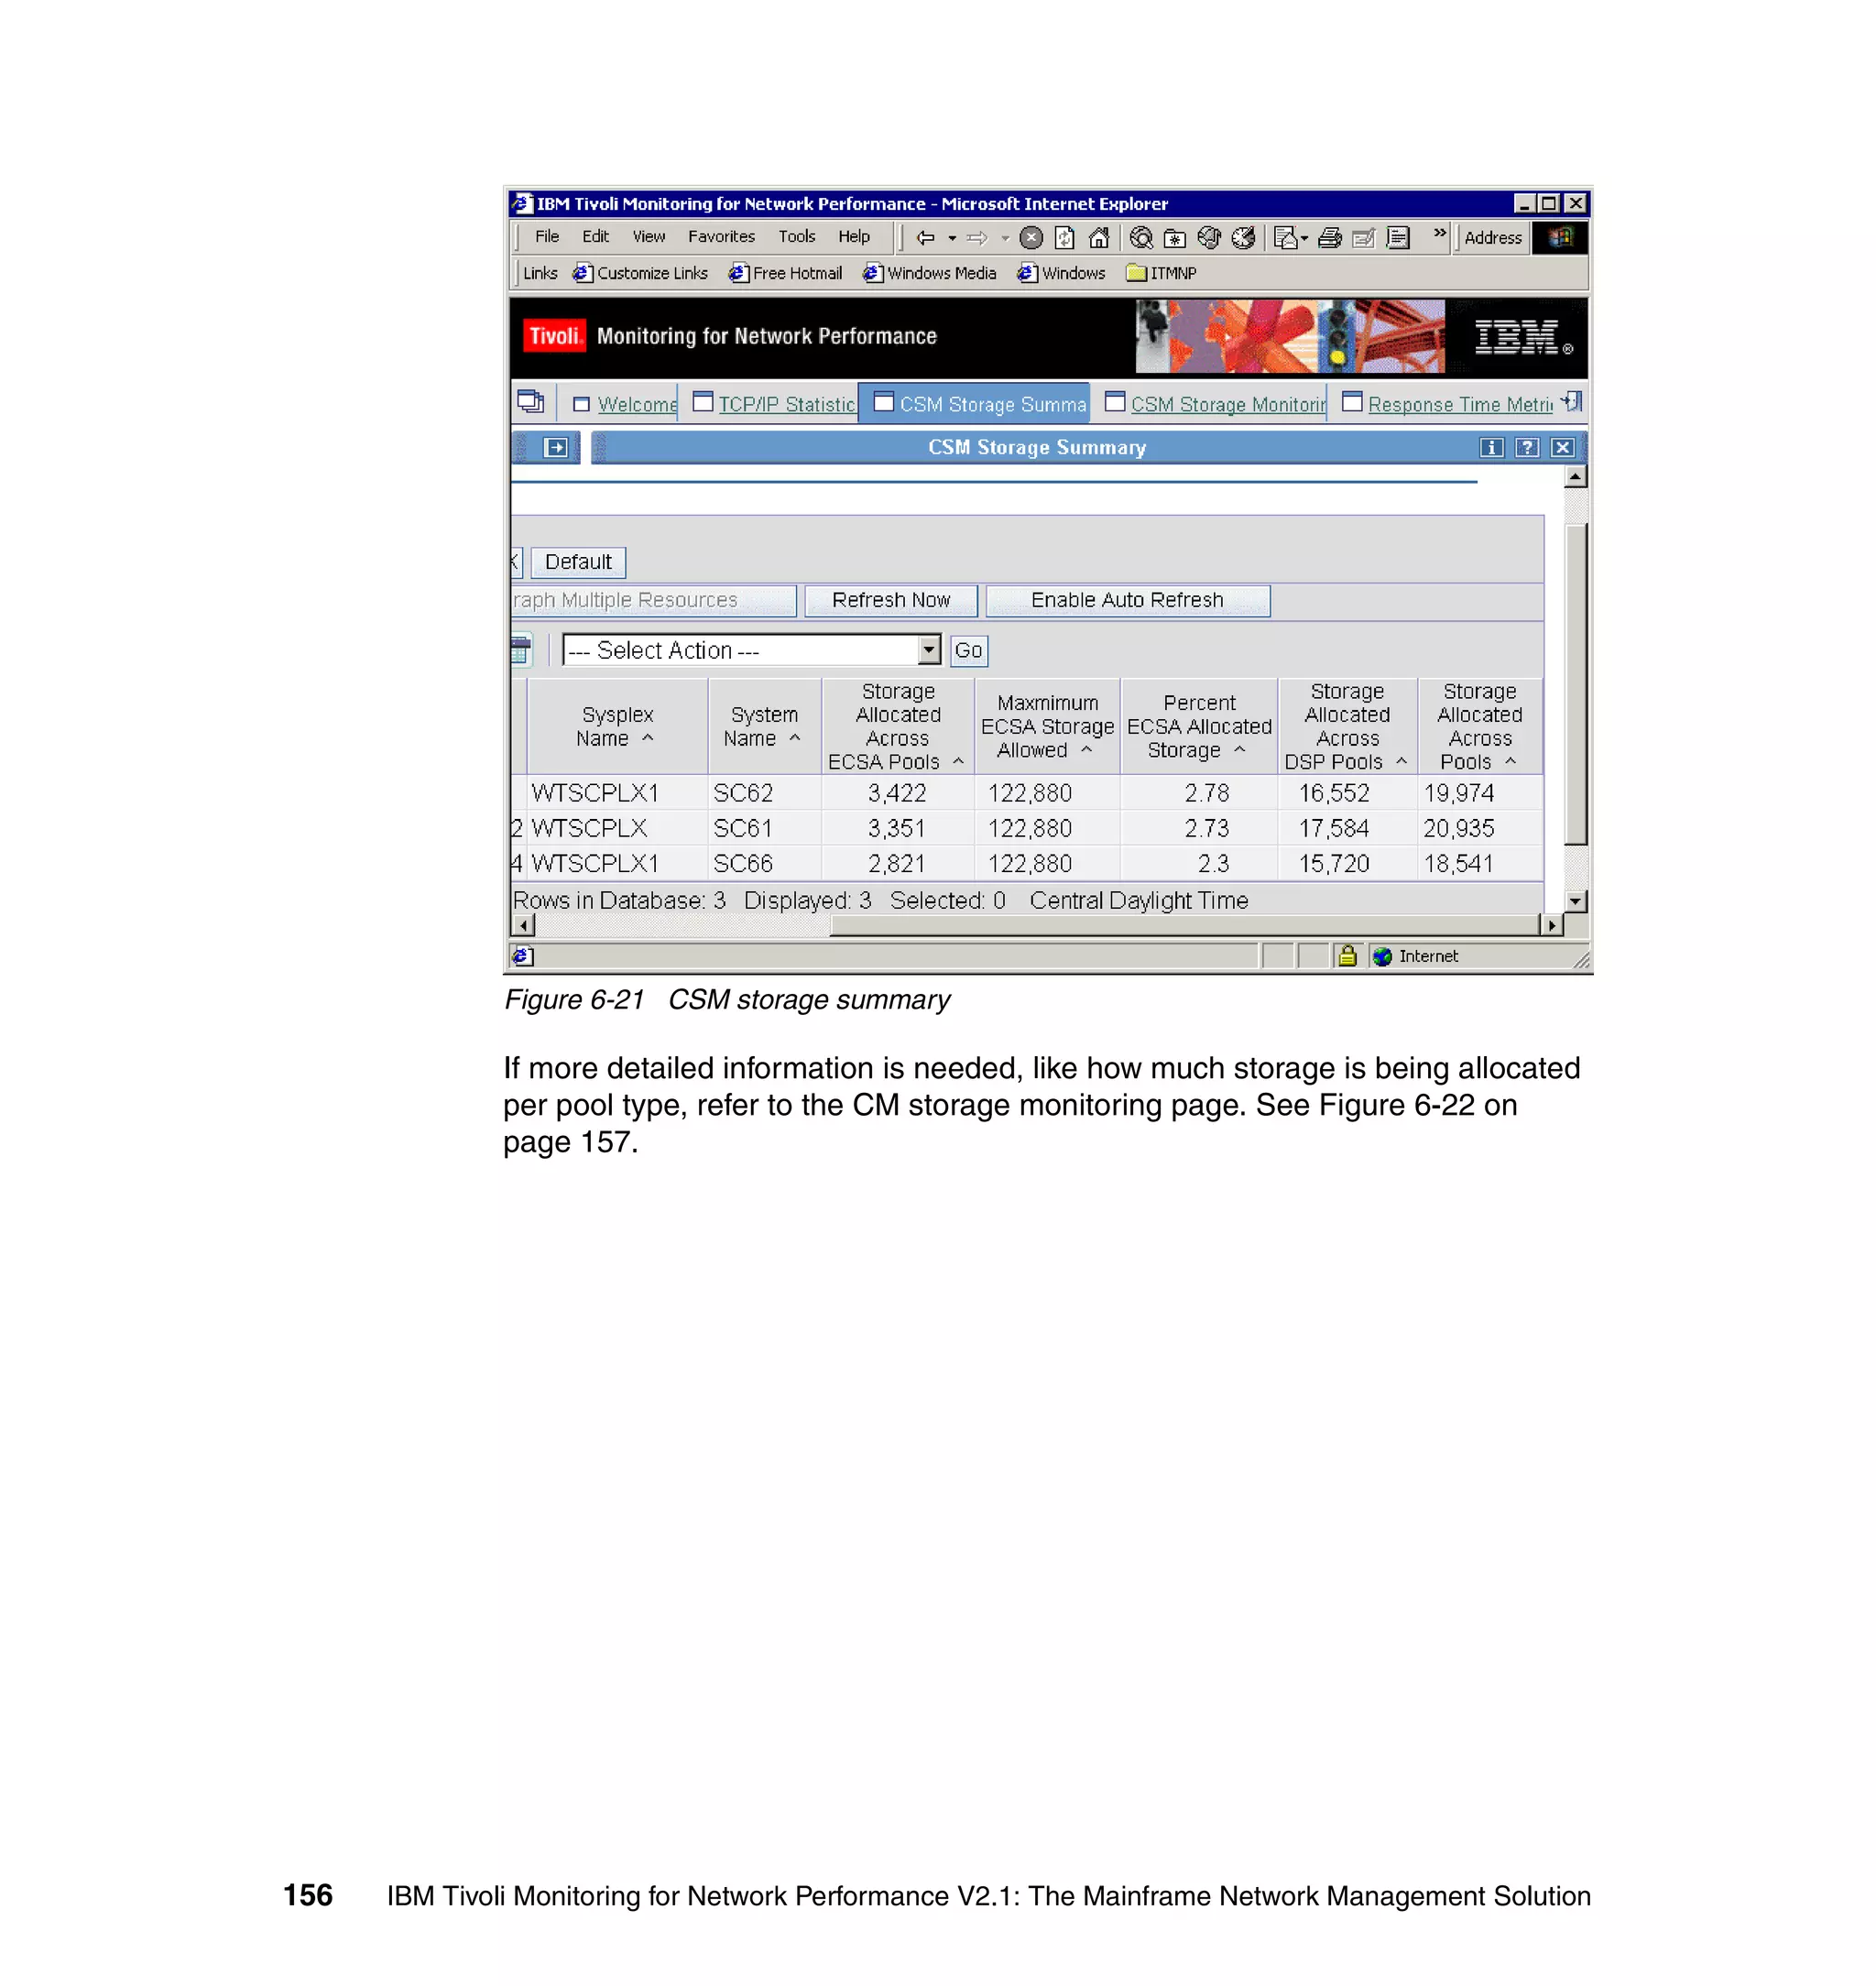
4.2.4 Enabling DB2 password encryption
DB2 password encryption level is an instance wide setting. It can be changed
using the command line by the DB2 instance owner. The command is:
db2iupdt -a authType instanceName
where:
authType Can be CLIENT, SERVER, or SERVER_ENCRYPT
instanceName The instance owner ID, typically db2inst1
We do not use this facility.
Chapter 4. AIX Web application implementation 65](https://image.slidesharecdn.com/ibmtivolimonitoringfornetworkperformancev2-1themainframenetworkmanagementsolutionsg246360-120524030008-phpapp02/75/Ibm-tivoli-monitoring-for-network-performance-v2-1-the-mainframe-network-management-solution-sg246360-81-2048.jpg)
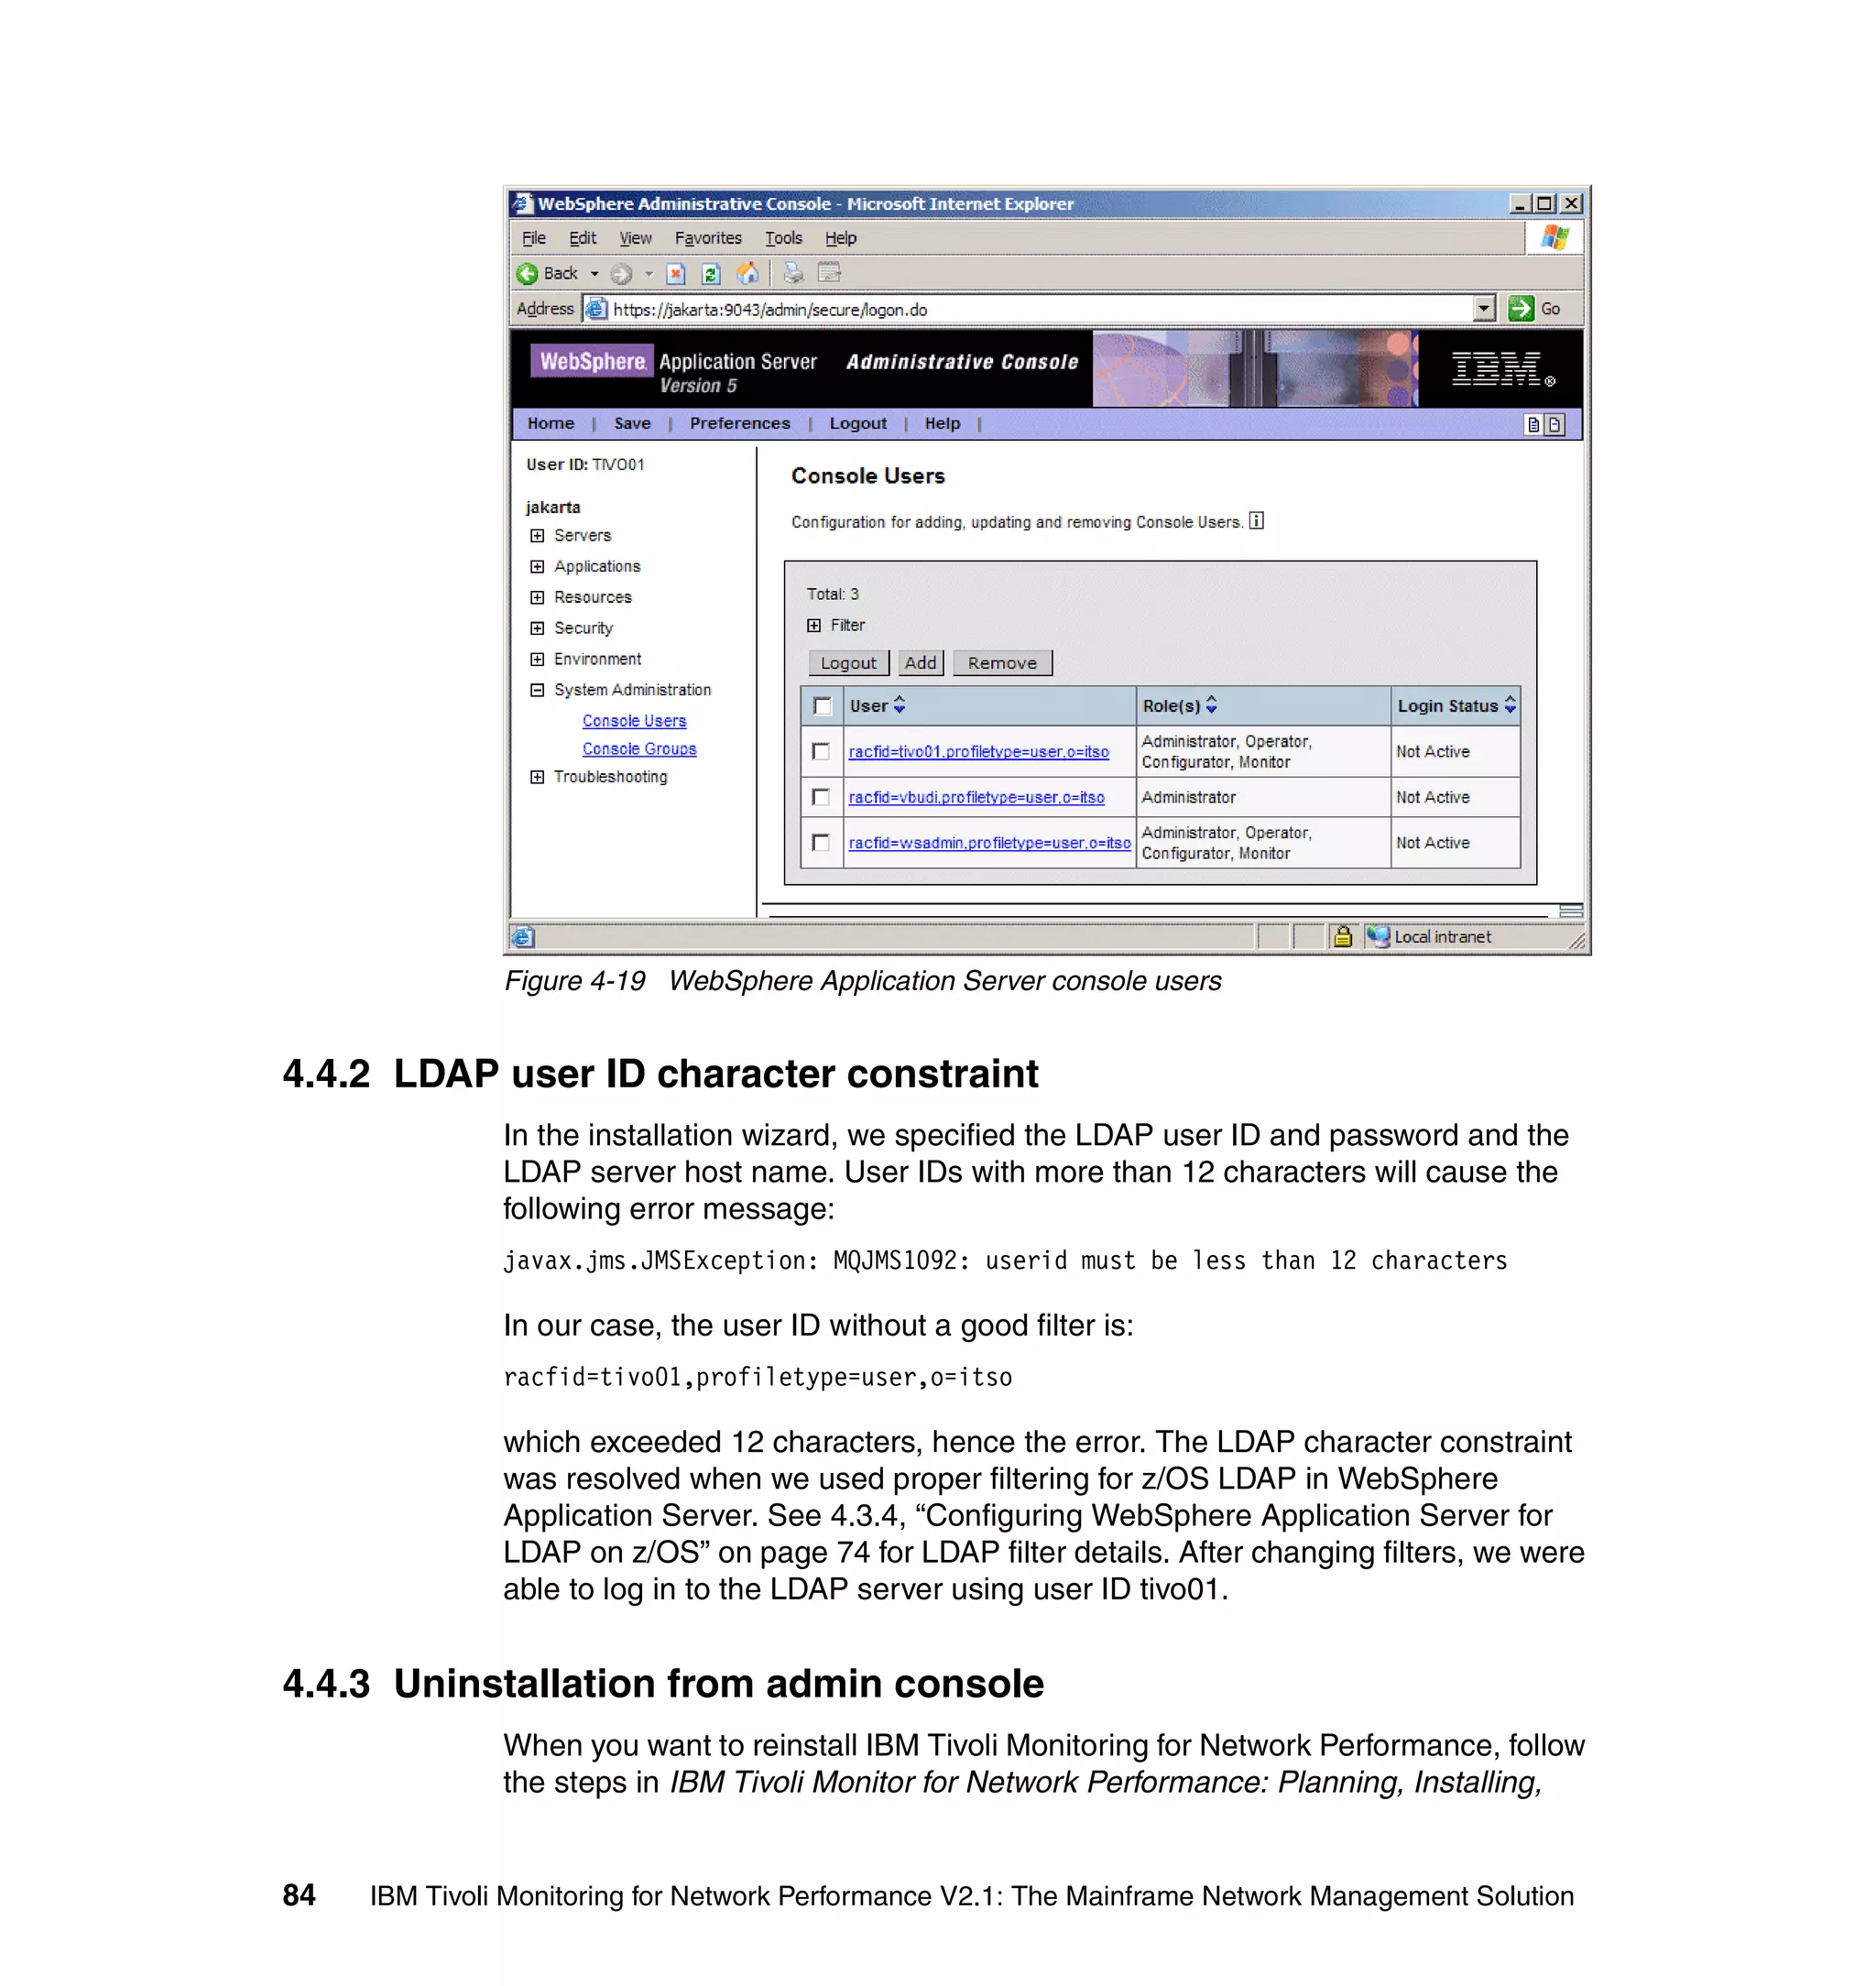
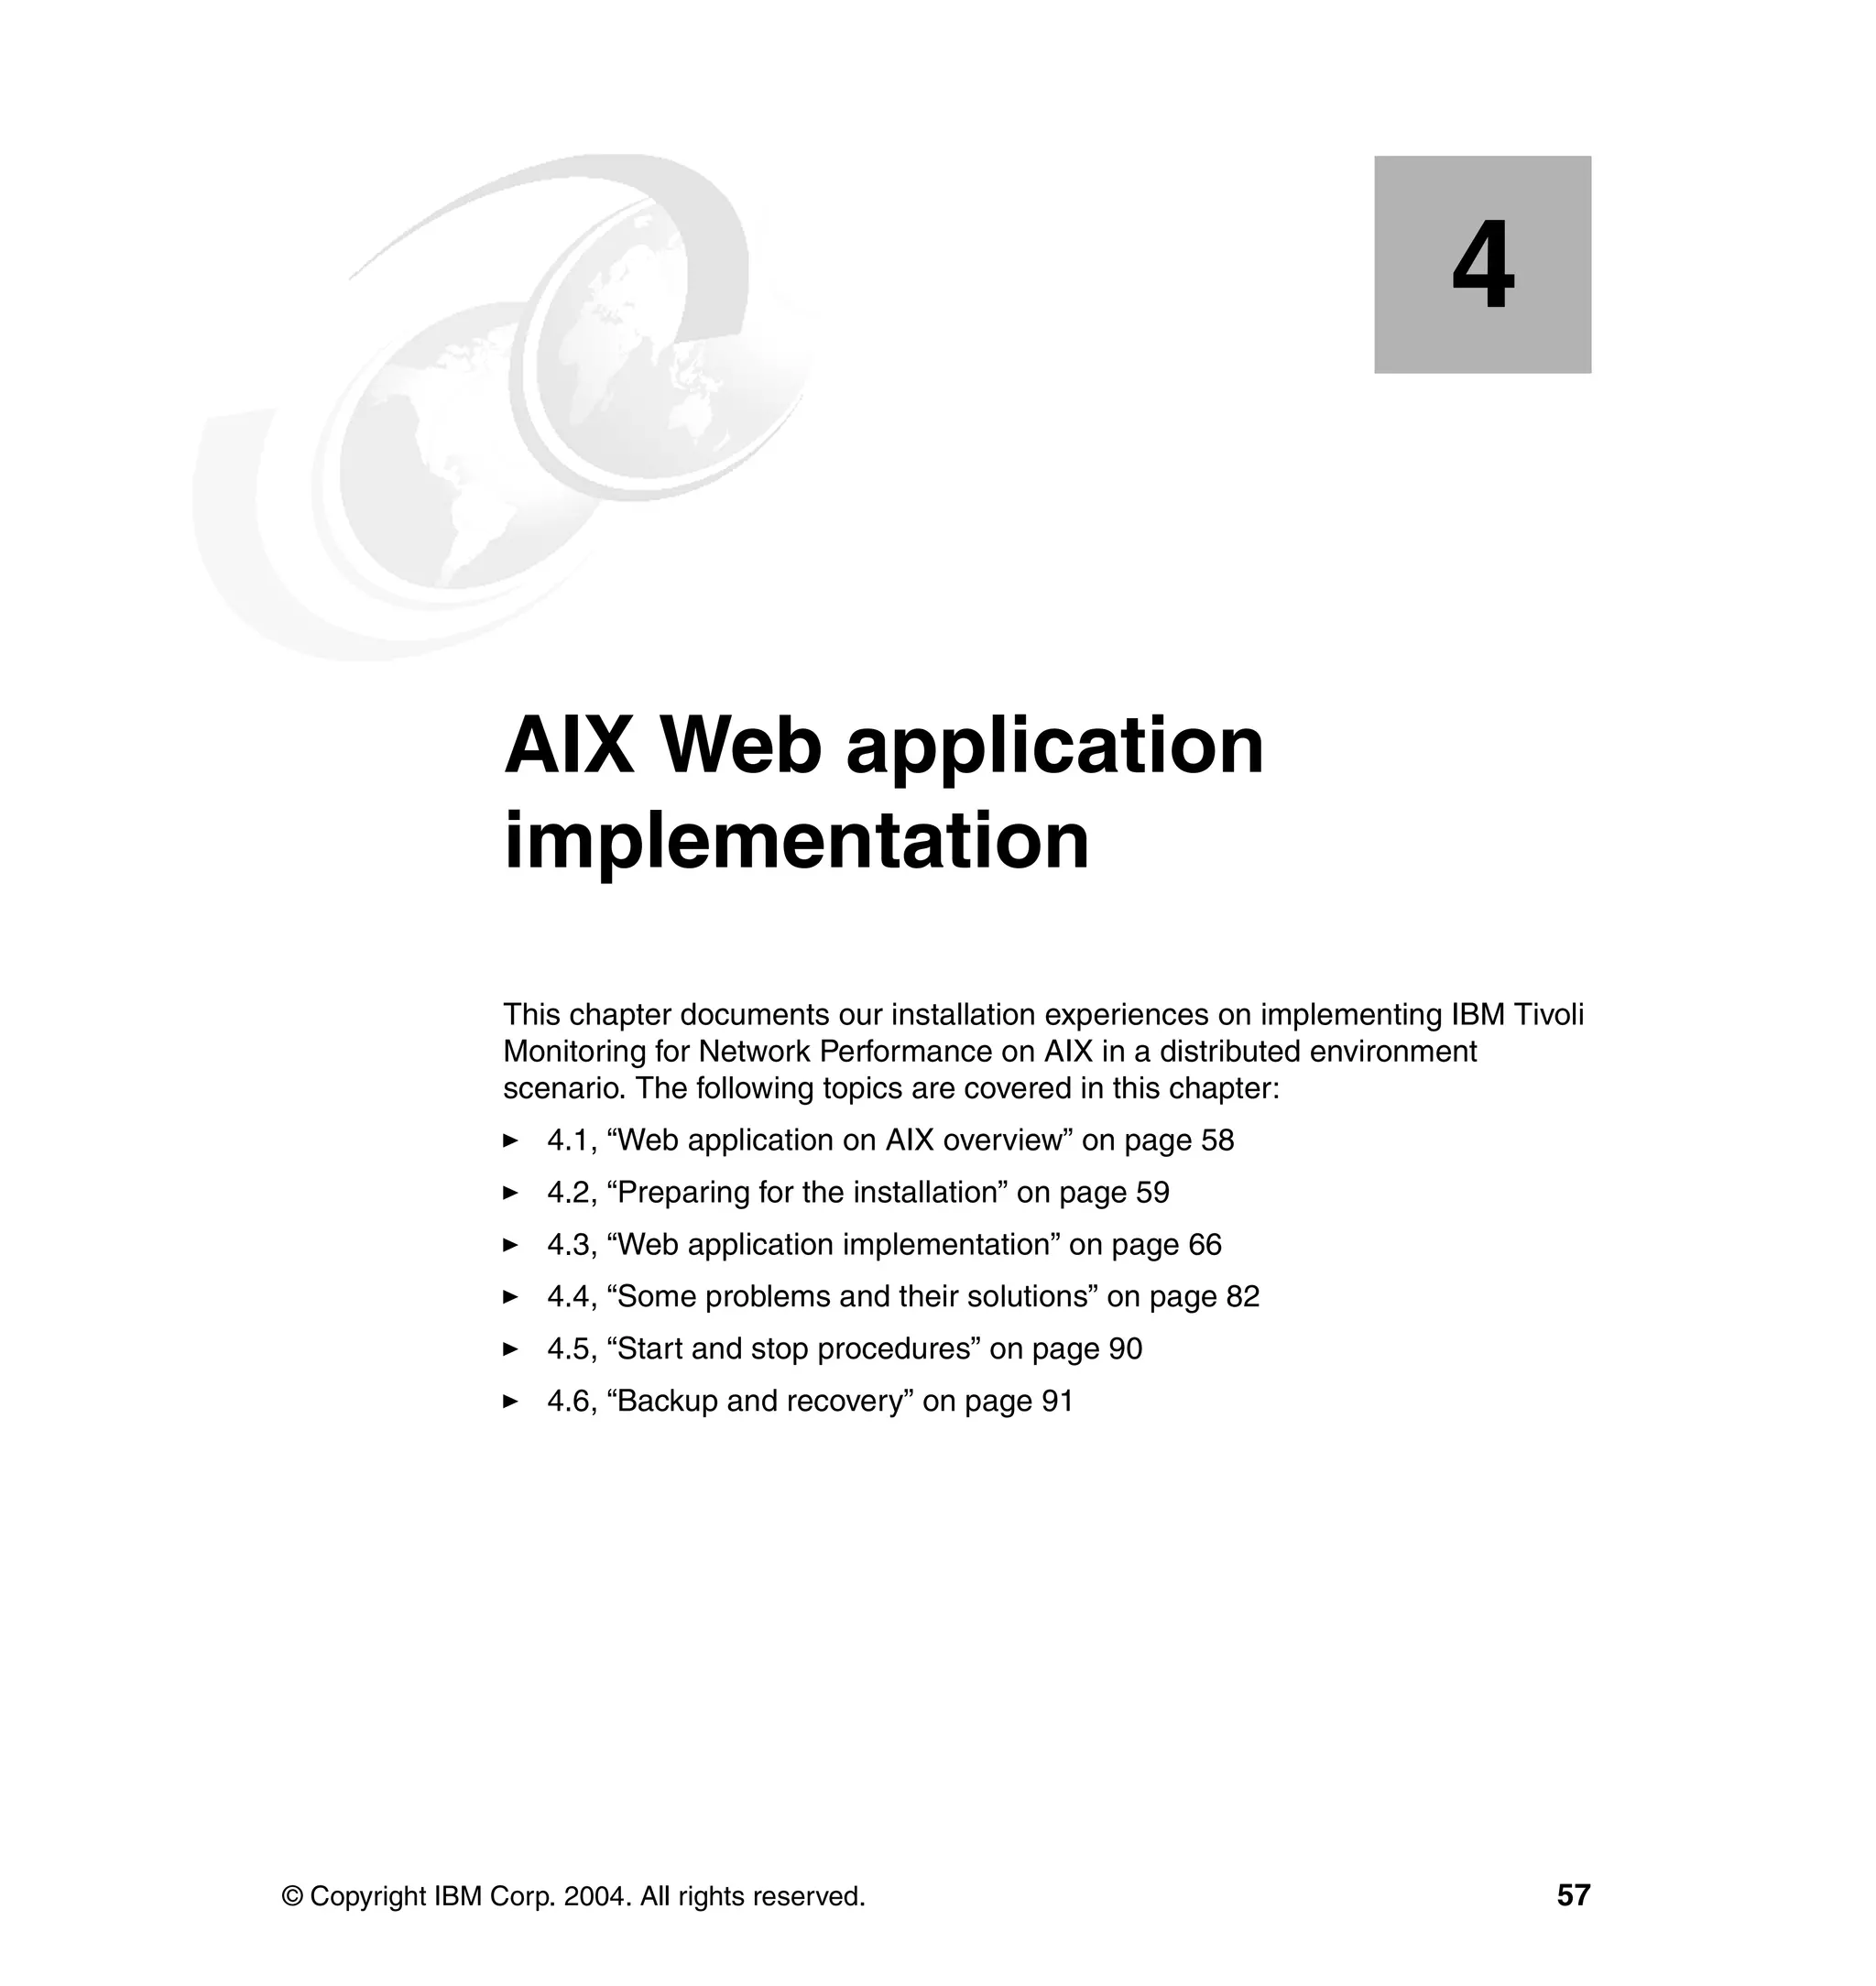
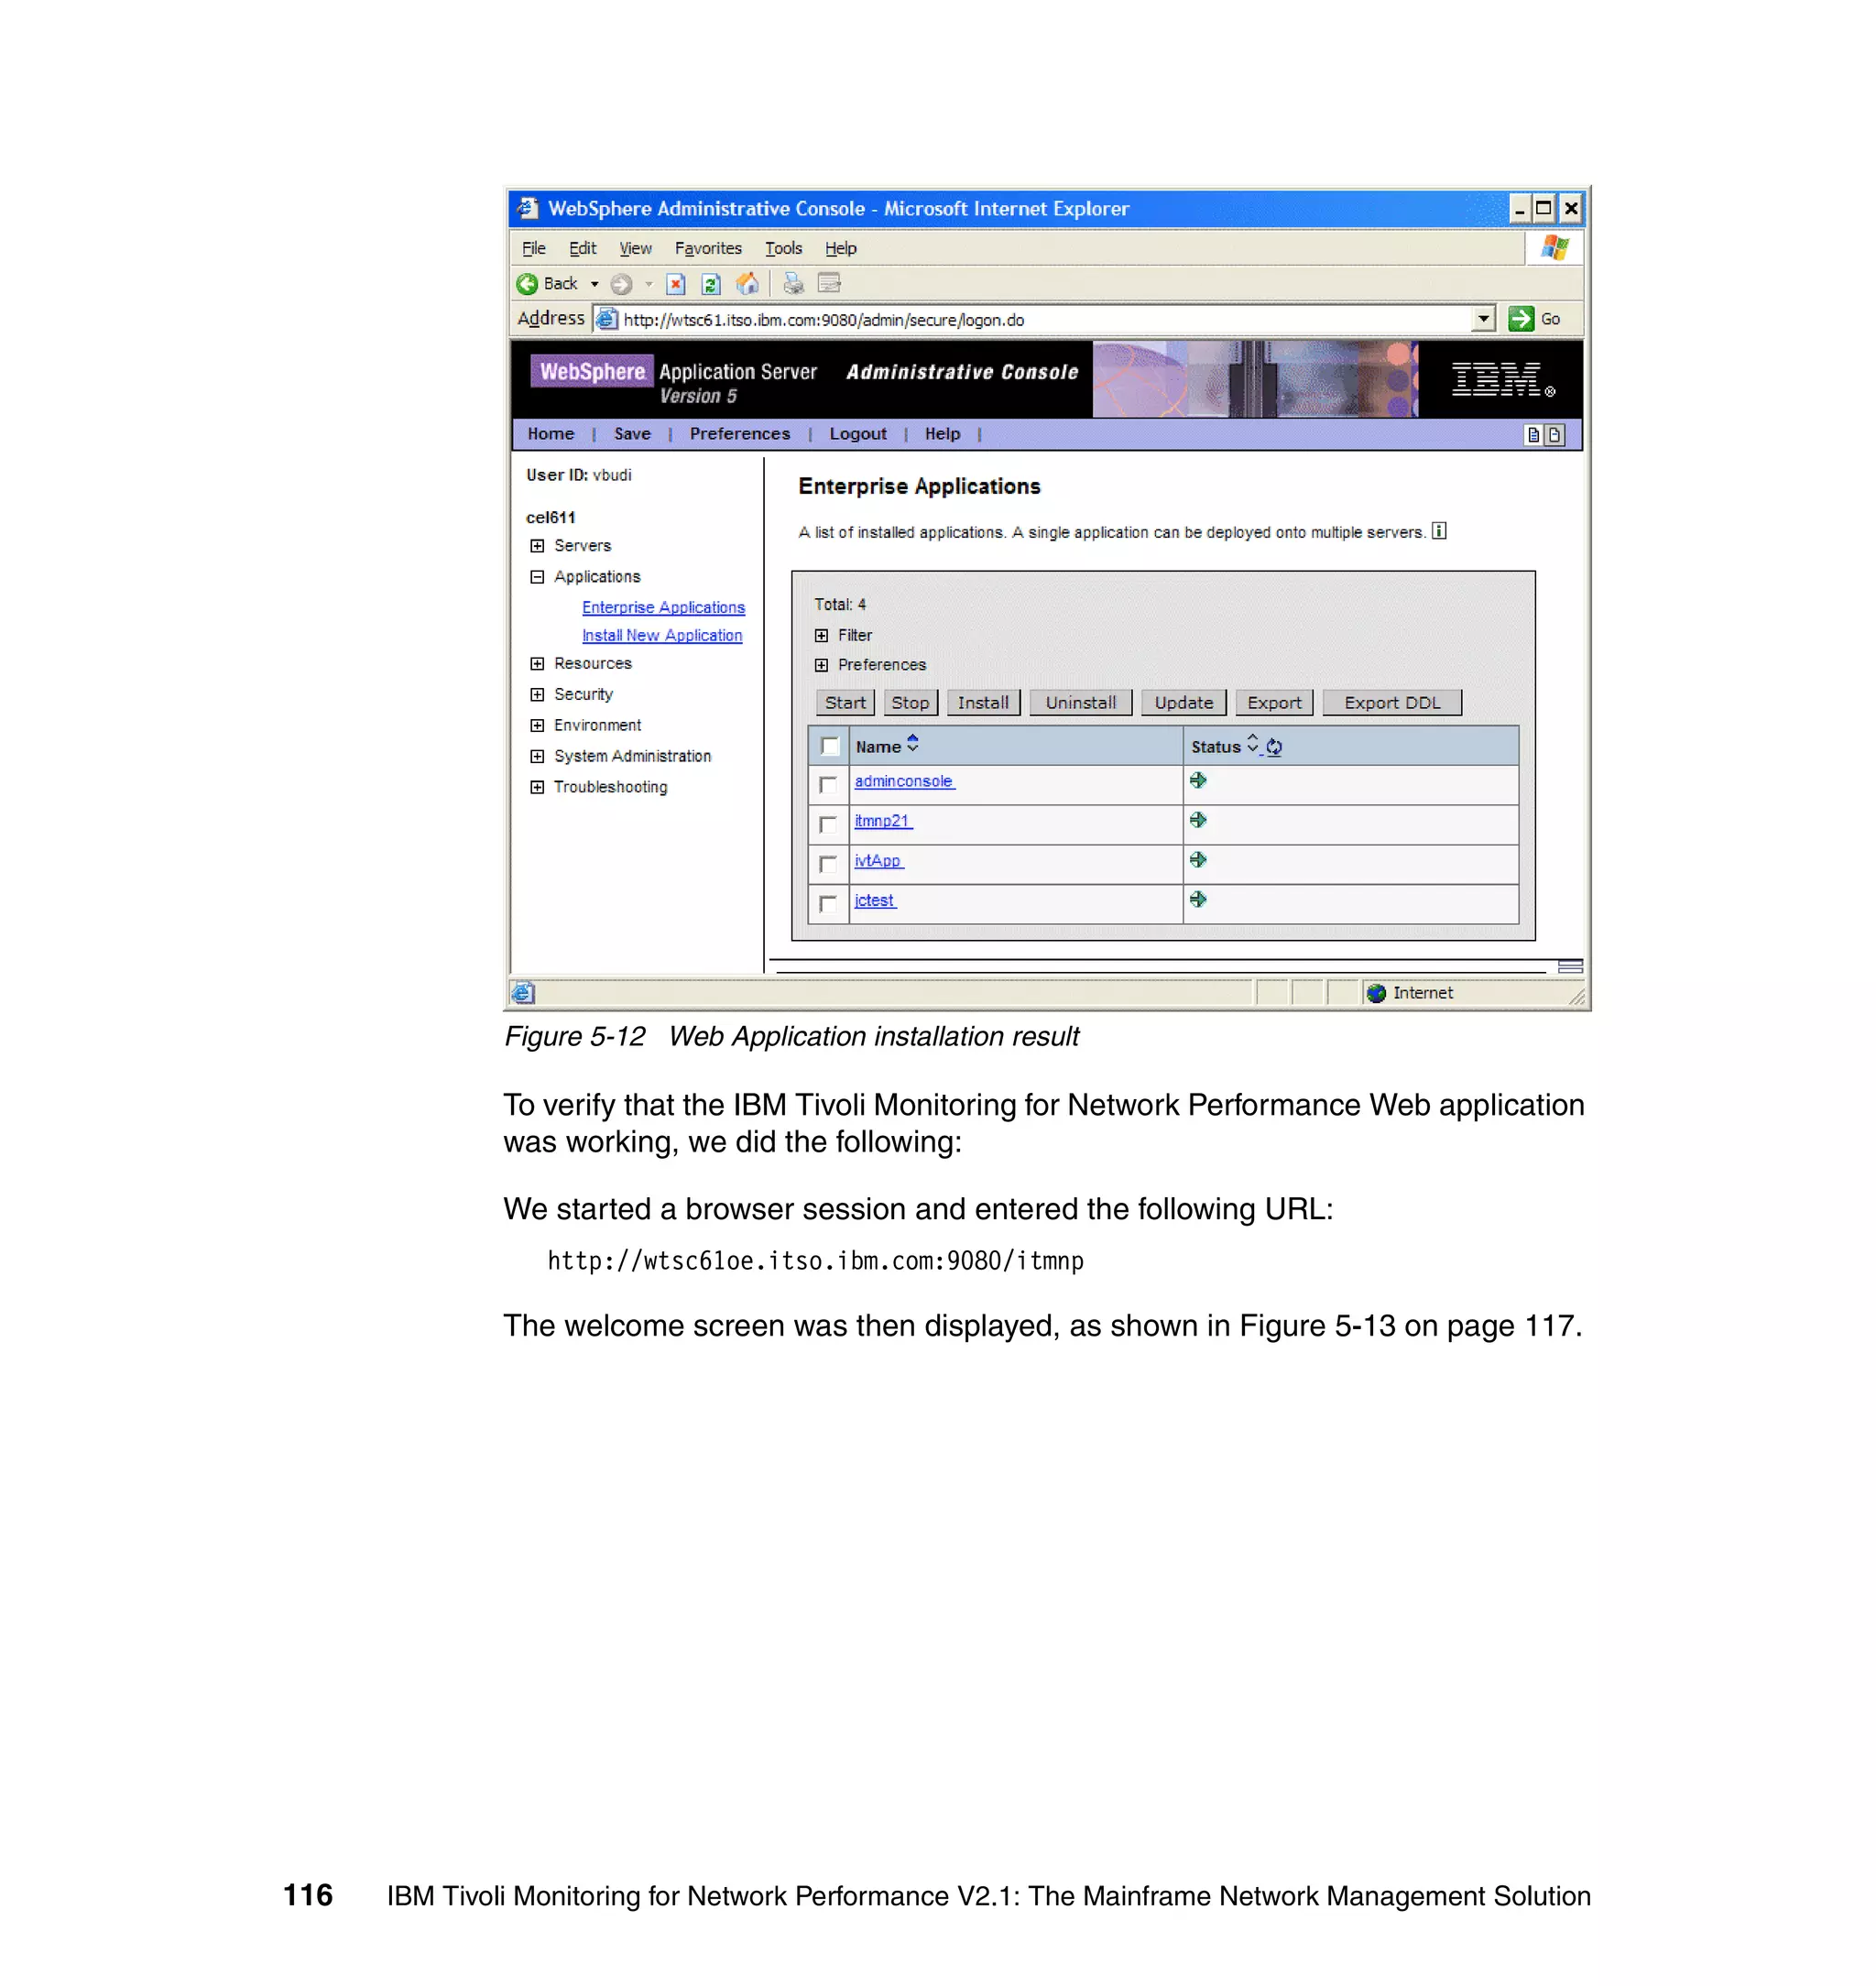
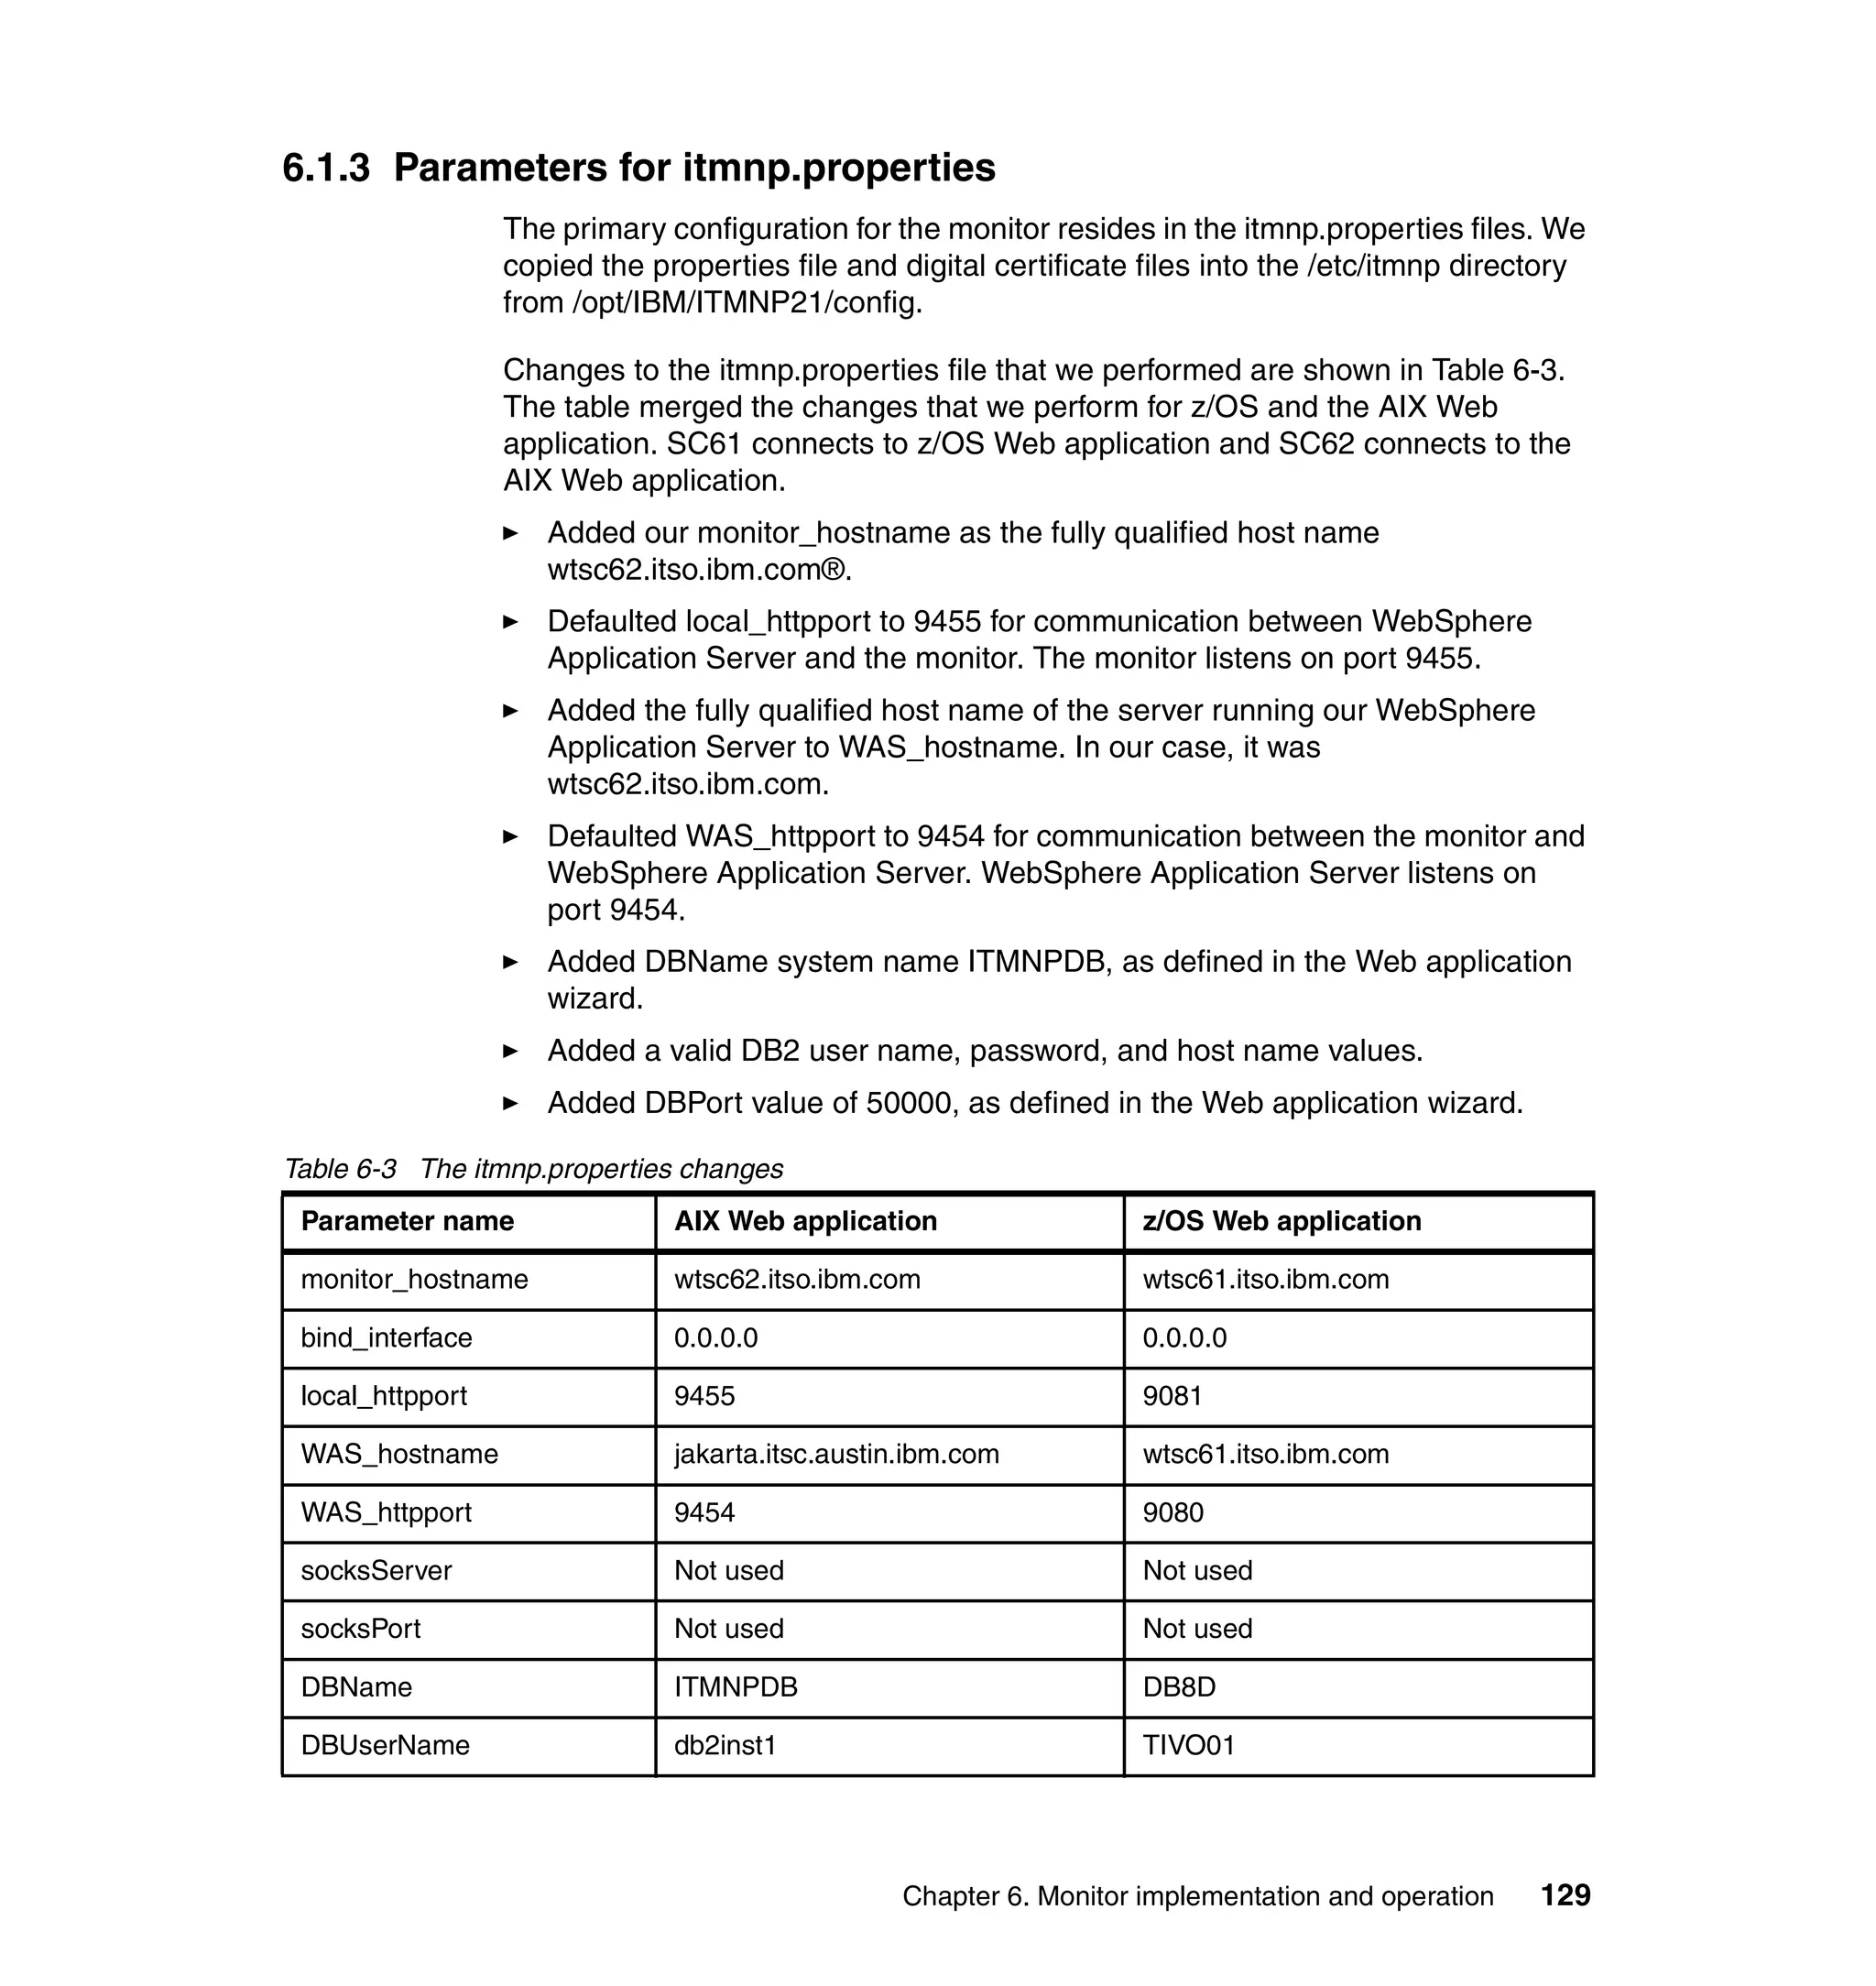
![Figure 4-21 Error 500 message
4.4.5 LTPA key generation problem
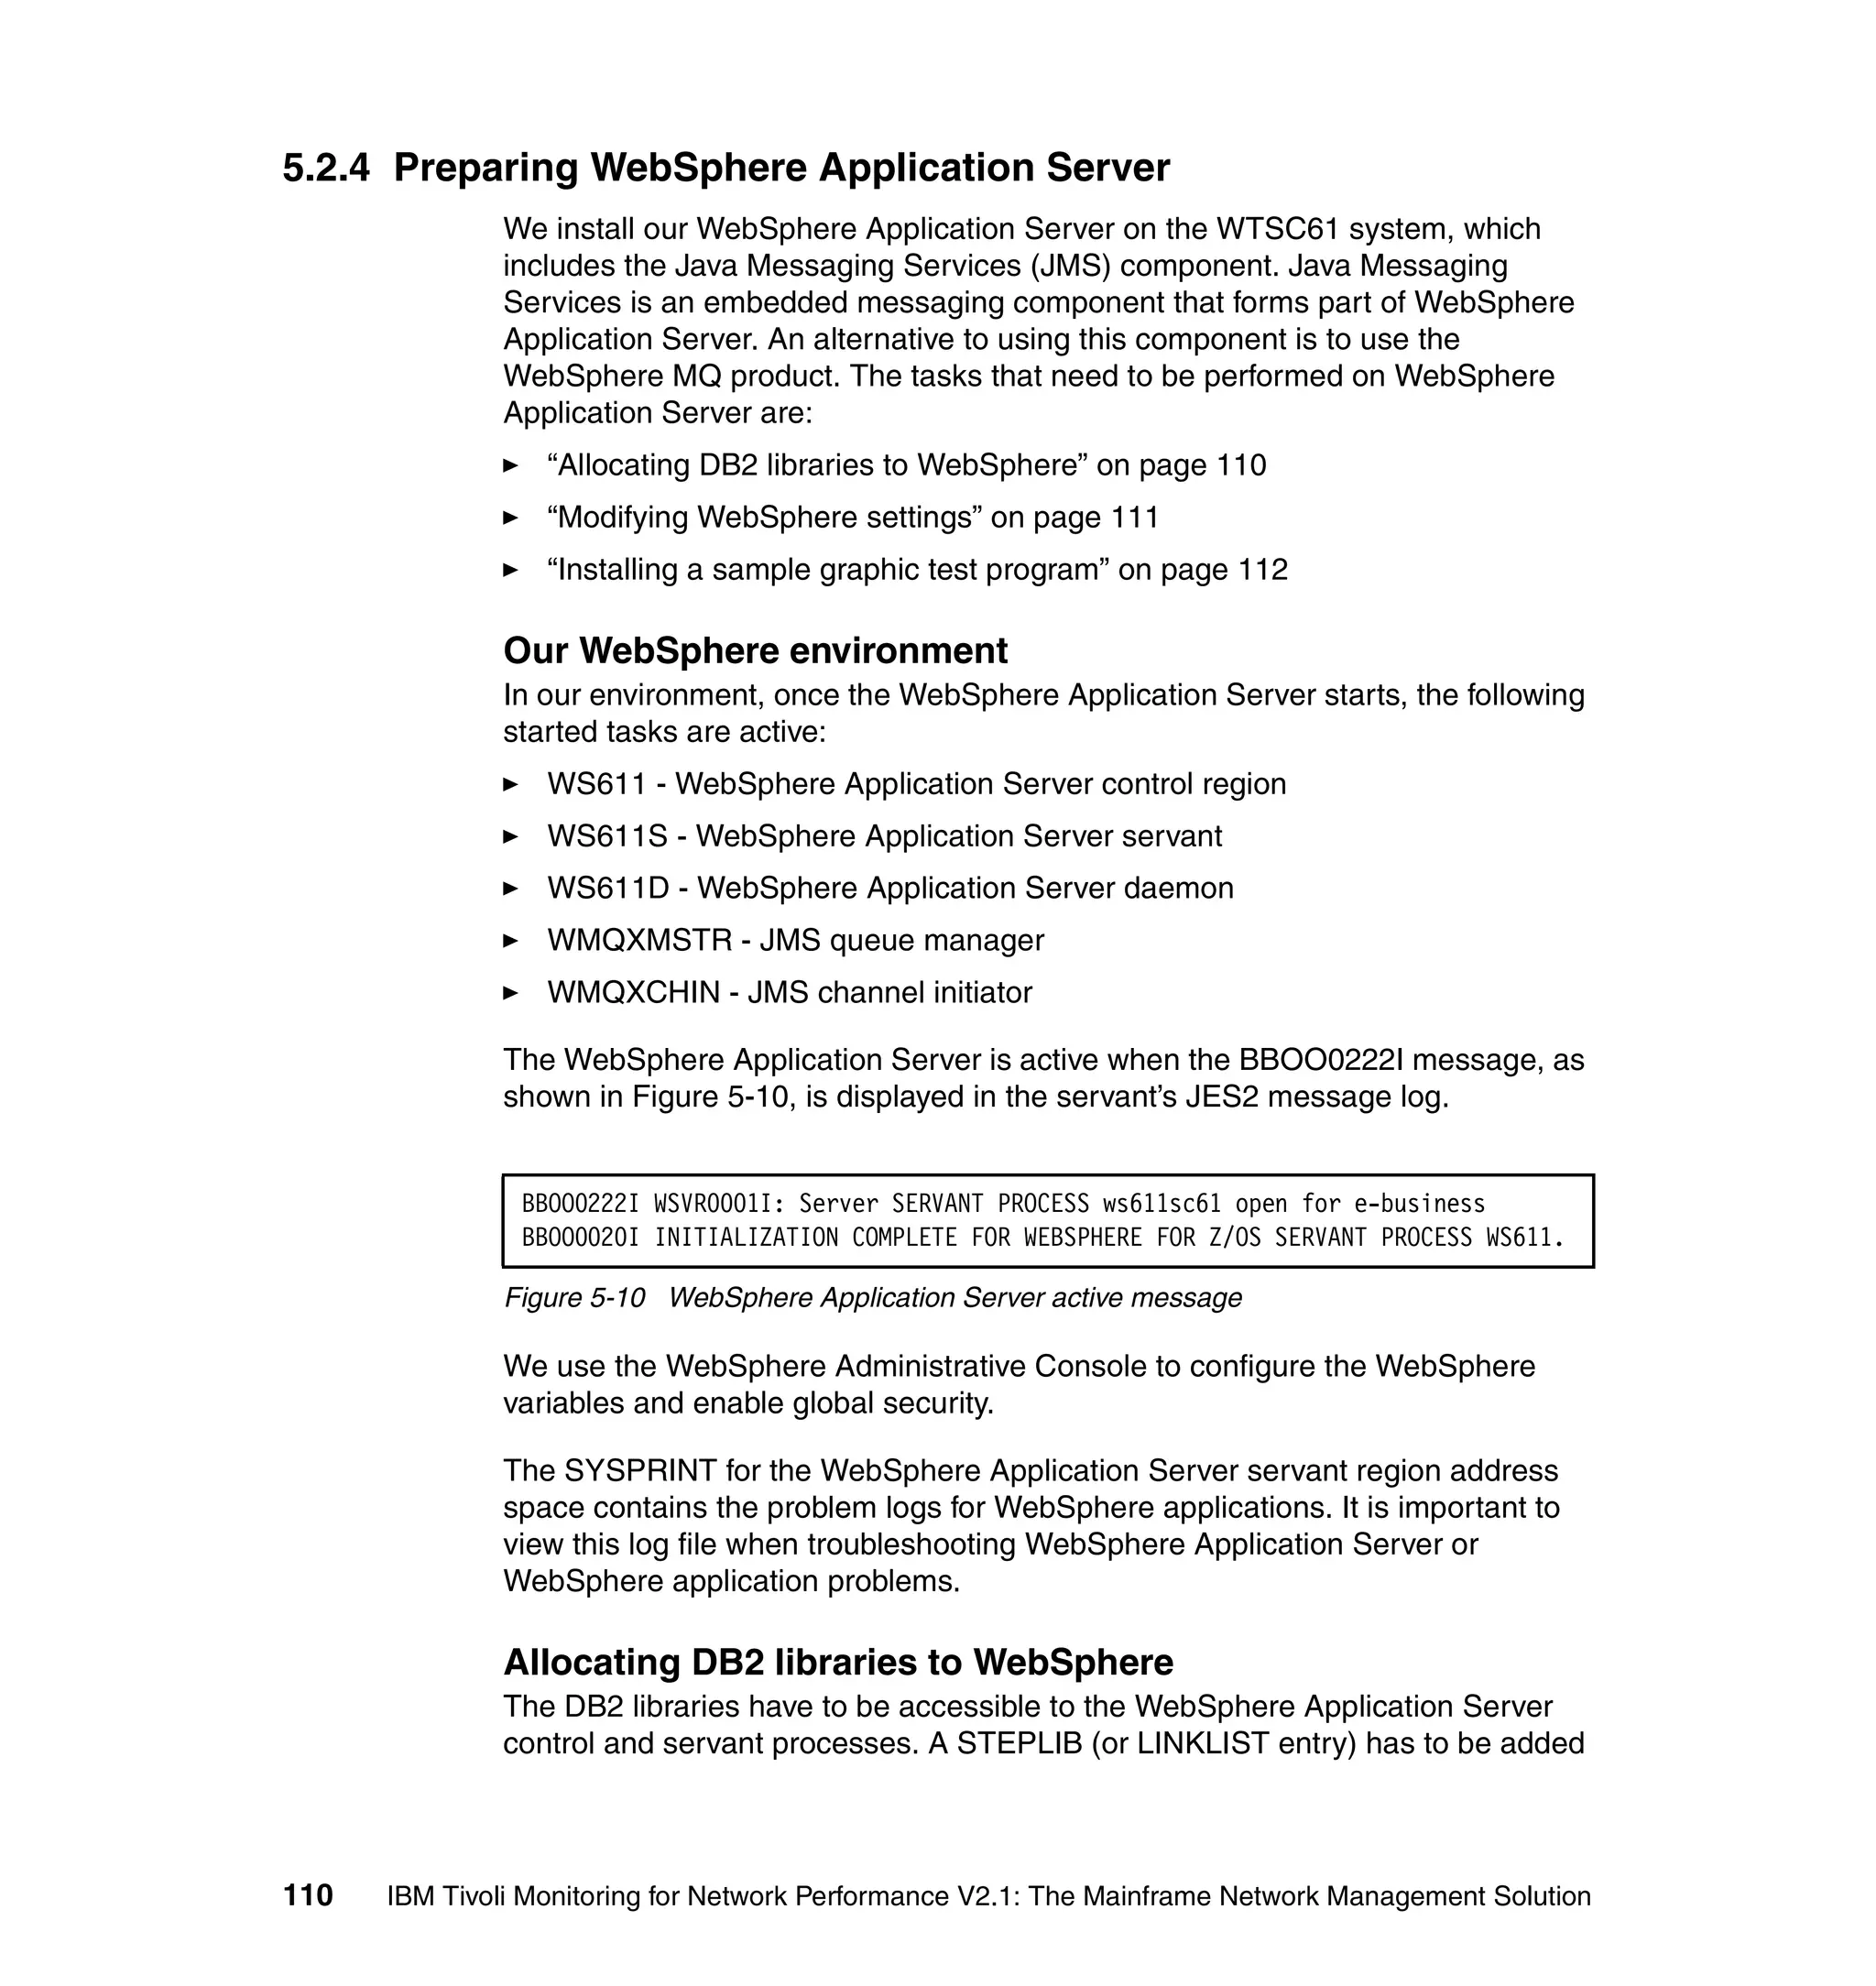
After installing the IBM Tivoli Monitoring for Network Performance Web
application, we stopped the WebSphere Application Server and started it. We get
an error in SystemOut.log, as shown in Example 4-5 on page 85.
Example 4-6 LTPA error
[5/11/04 15:31:43:636 CDT] 35be67d5 LTPAServerObj E SECJ0238E: An unexpected
exception occurred when trying to create the initial LTPAServerObject. The
exception is java.lang.NullPointerException
atcom.ibm.ws.security.ltpa.LTPAPrivateKey.decode(LTPAPrivateKey.java:57) at
com.ibm.ws.security.ltpa.LTPAPrivateKey.<init>(LTPAPrivateKey.java:47) at
com.ibm.ws.security.ltpa.LTPAServerObject.<init>(LTPAServerObject.java:252) at
com.ibm.ws.security.ltpa.LTPAServerObject.initLTPAServer(LTPAServerObject.java:
183) at
com.ibm.ws.security.ltpa.LTPAServerObject.getLTPAServer(LTPAServerObject.java:1
33) at
com.ibm.ws.security.server.lm.ltpaLoginModule.initialize(ltpaLoginModule.java:1
Chapter 4. AIX Web application implementation 87](https://image.slidesharecdn.com/ibmtivolimonitoringfornetworkperformancev2-1themainframenetworkmanagementsolutionsg246360-120524030008-phpapp02/75/Ibm-tivoli-monitoring-for-network-performance-v2-1-the-mainframe-network-management-solution-sg246360-103-2048.jpg)
![.
Figure 4-22 LTPA keys generation
4.4.6 Problem with SSL
We encountered the error SSLHandshakeException: unknown certificate in
SystemOut.log, as shown in Example 4-8.
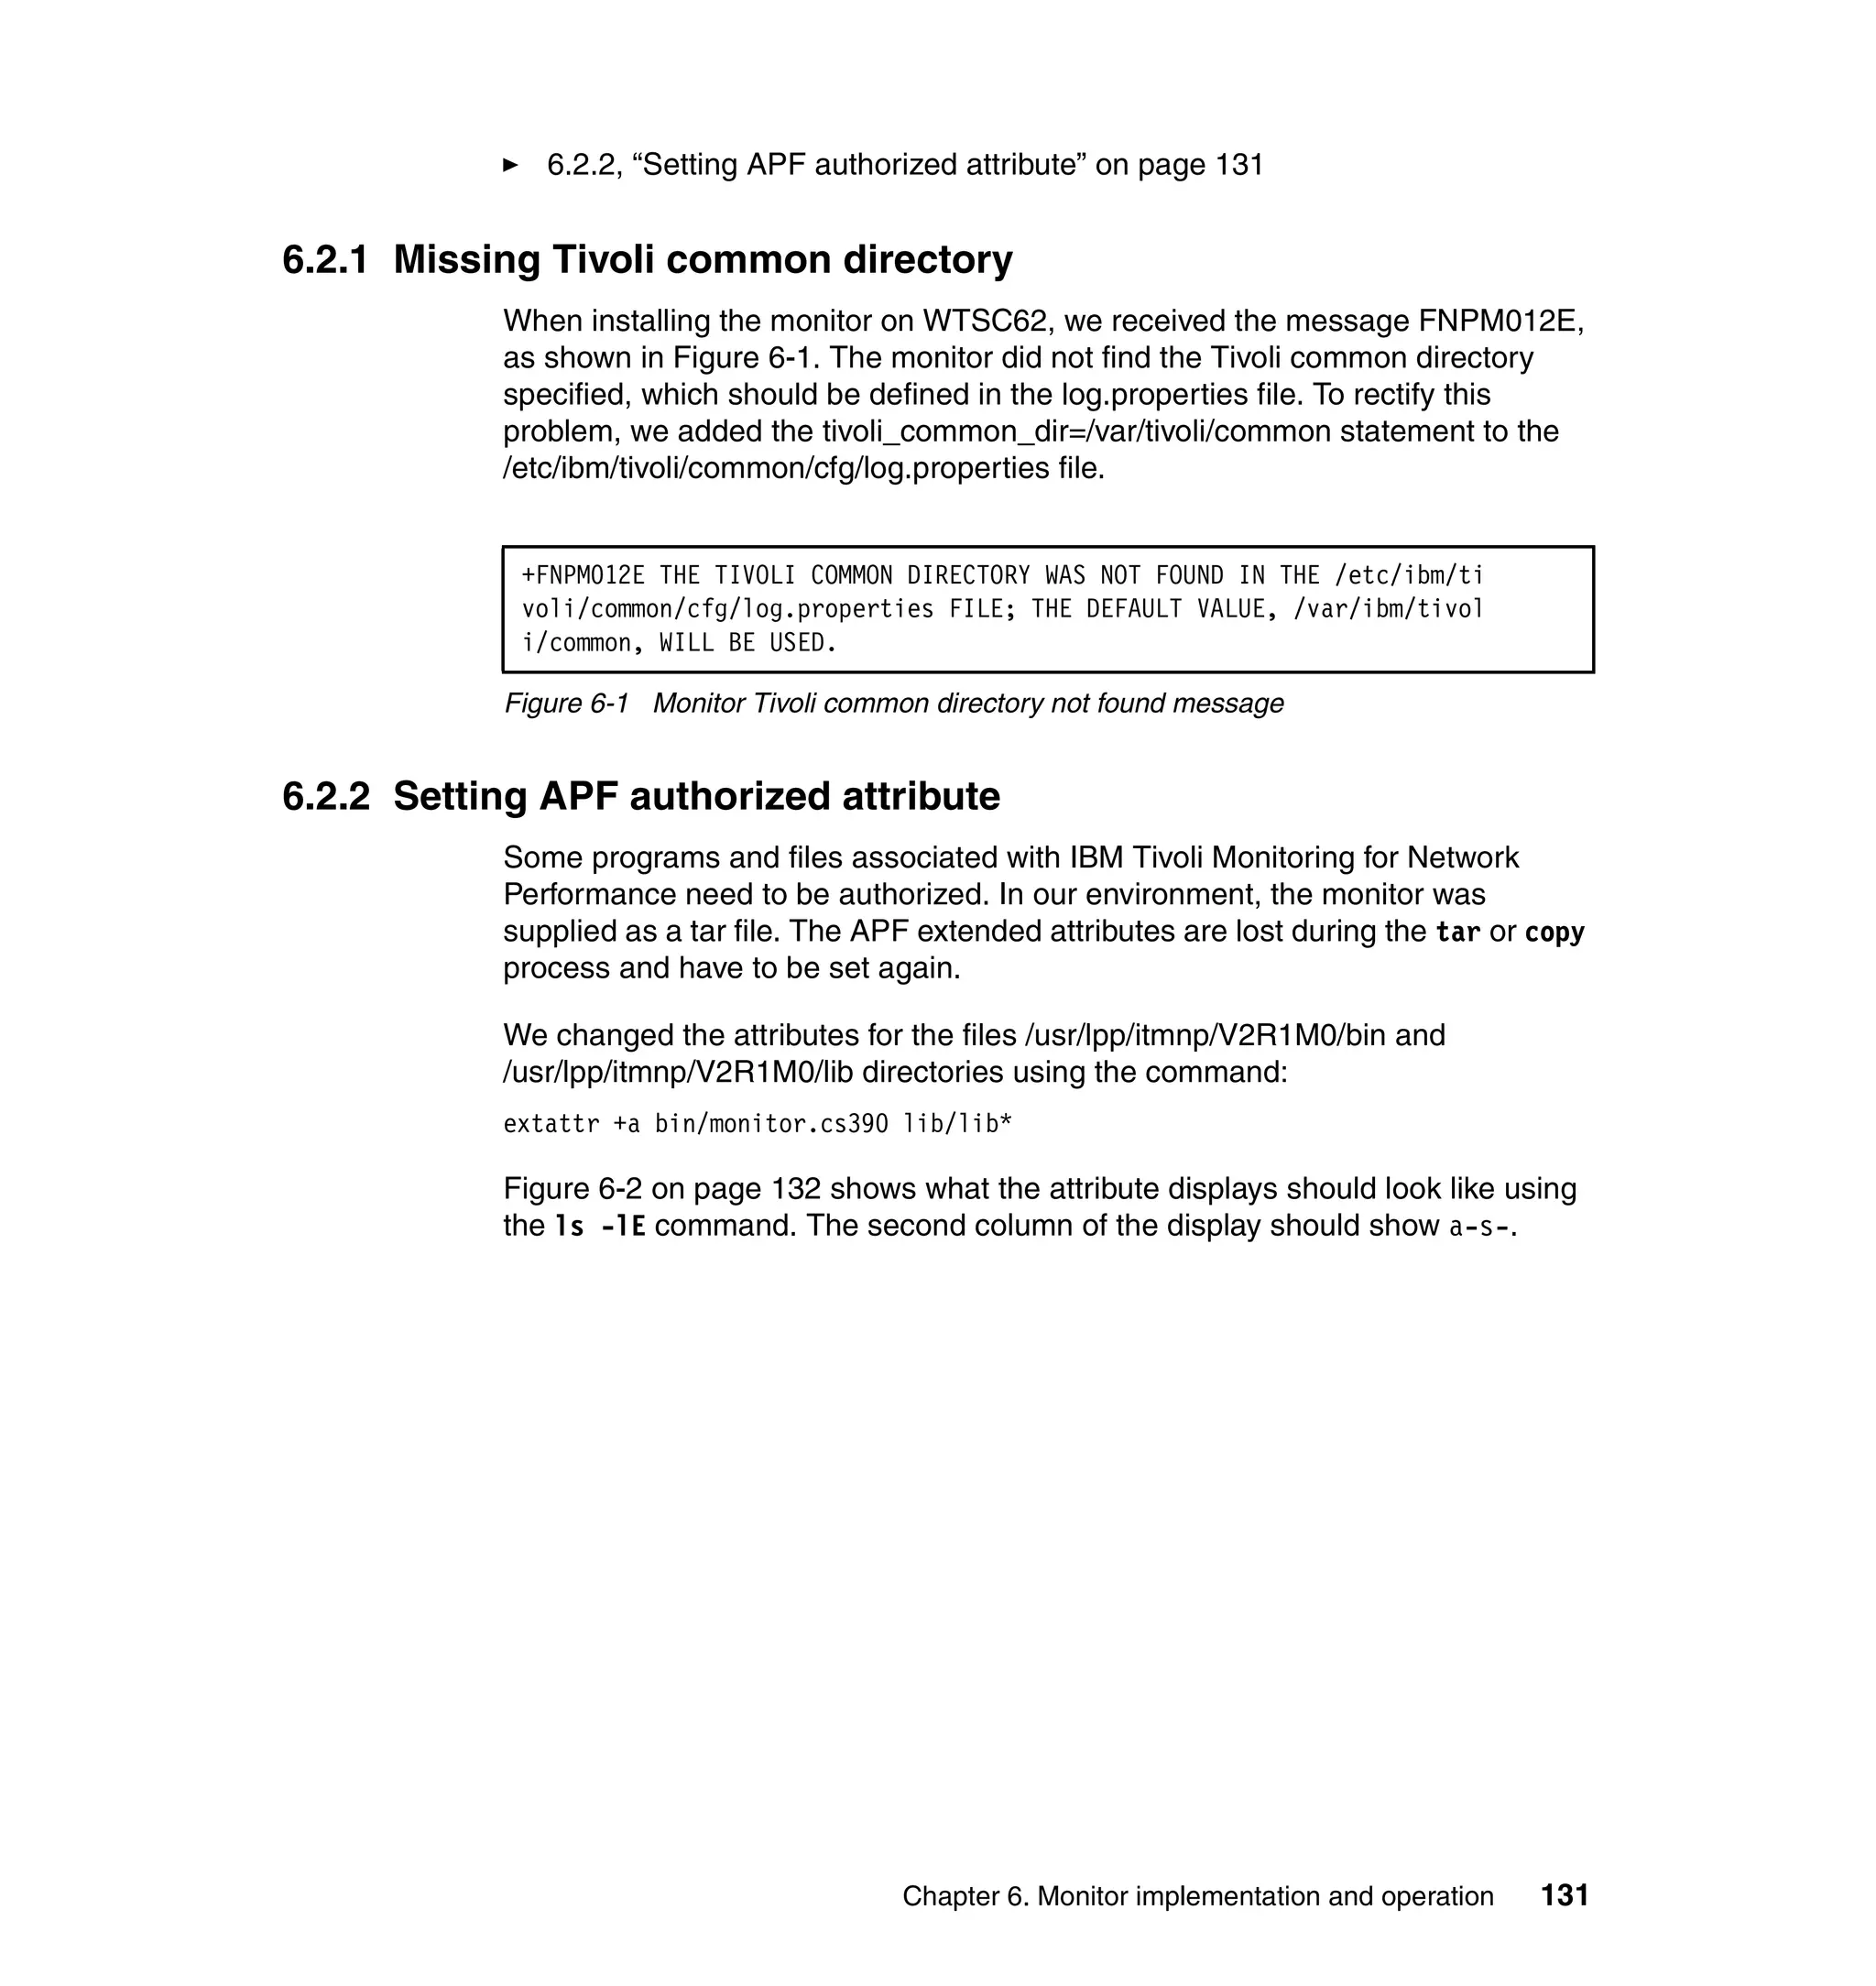
Example 4-8 SSL error
[5/12/04 14:12:10:326 CDT] 5303a99 ItmnpJmxResou A
ItmnpJmxResourceAdapterImpl. execute TRAS0014I: The following exception was
logged javax.net.ssl.SSLHandshakeException: unknown certificate
at com.ibm.jsse.bg.a(Unknown Source)
at com.ibm.jsse.bg.startHandshake(Unknown Source)
at com.ibm.net.ssl.www.protocol.https.b.n(Unknown Source)
at com.ibm.net.ssl.www.protocol.https.p.connect(Unknown Source)
at com.ibm.net.ssl.www.protocol.http.bw.getInputStream(Unknown Source)
at com.ibm.net.ssl.www.protocol.http.bw.getHeaderField(Unknown Source)
at com.ibm.net.ssl.www.protocol.http.bw.getResponseCode(Unknown Source)
at
com.ibm.net.ssl.internal.www.protocol.https.HttpsURLConnection.getResponseCode(
Unknown Source) at
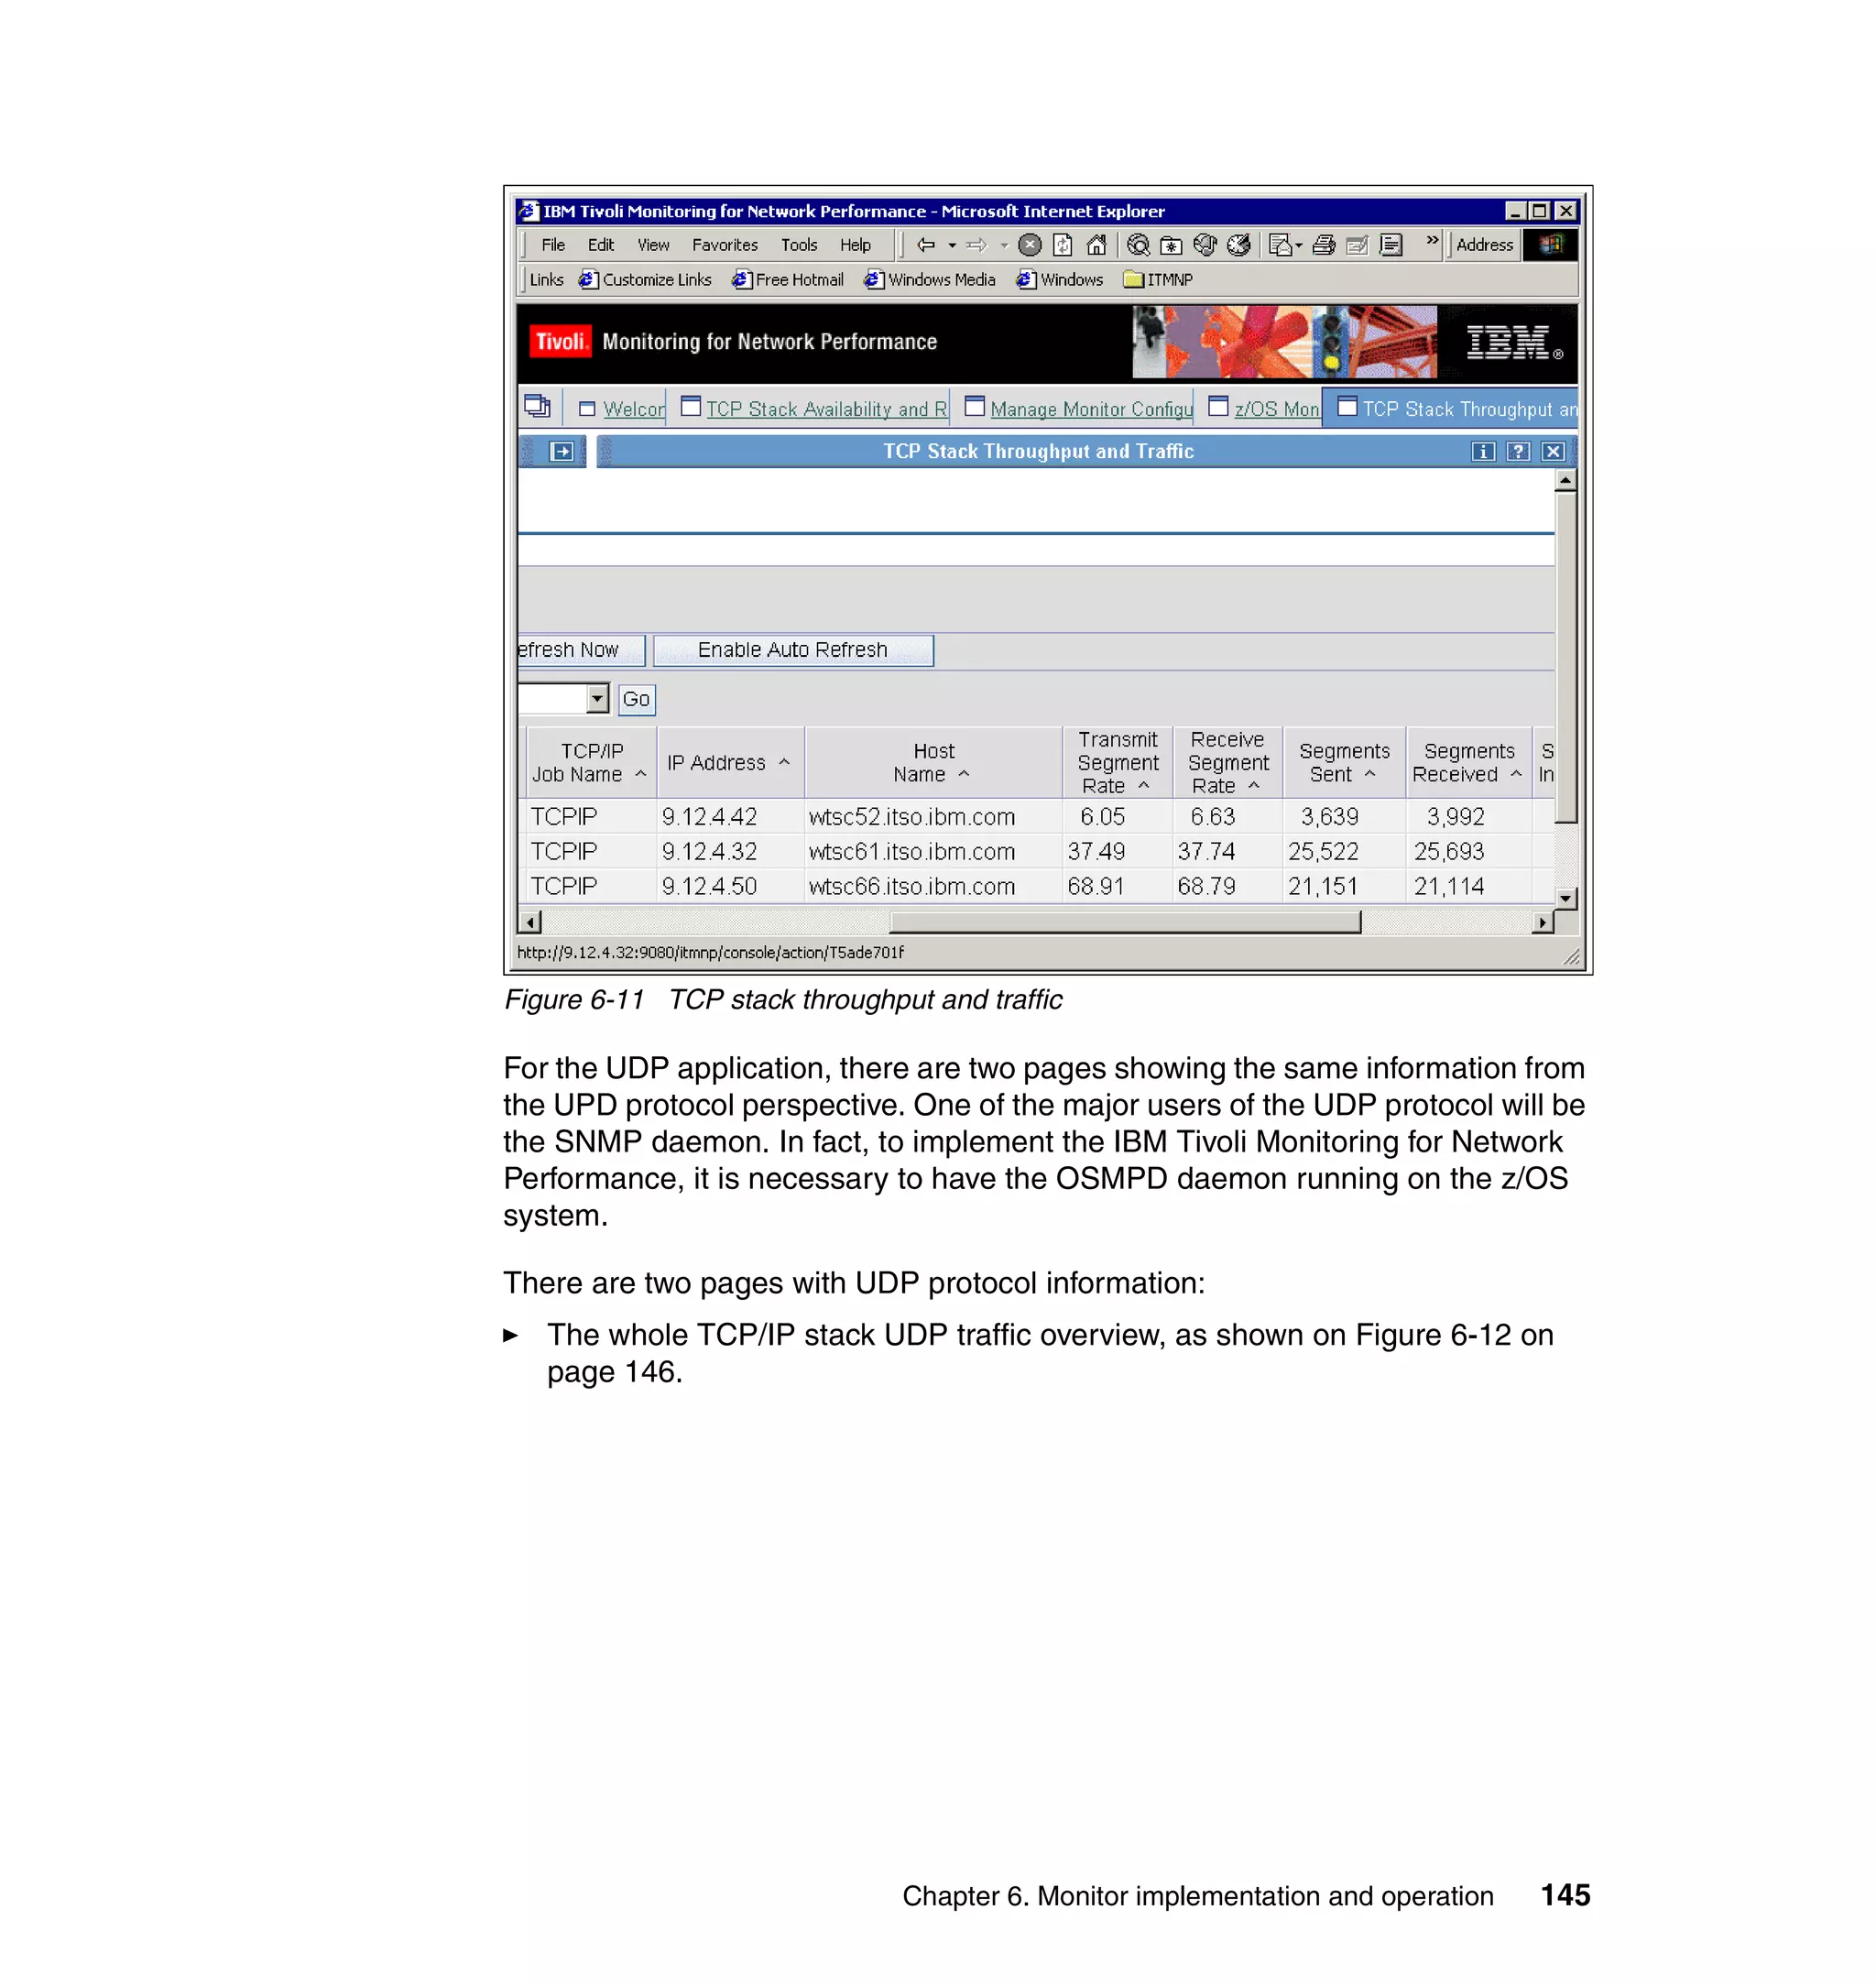
Chapter 4. AIX Web application implementation 89](https://image.slidesharecdn.com/ibmtivolimonitoringfornetworkperformancev2-1themainframenetworkmanagementsolutionsg246360-120524030008-phpapp02/75/Ibm-tivoli-monitoring-for-network-performance-v2-1-the-mainframe-network-management-solution-sg246360-105-2048.jpg)


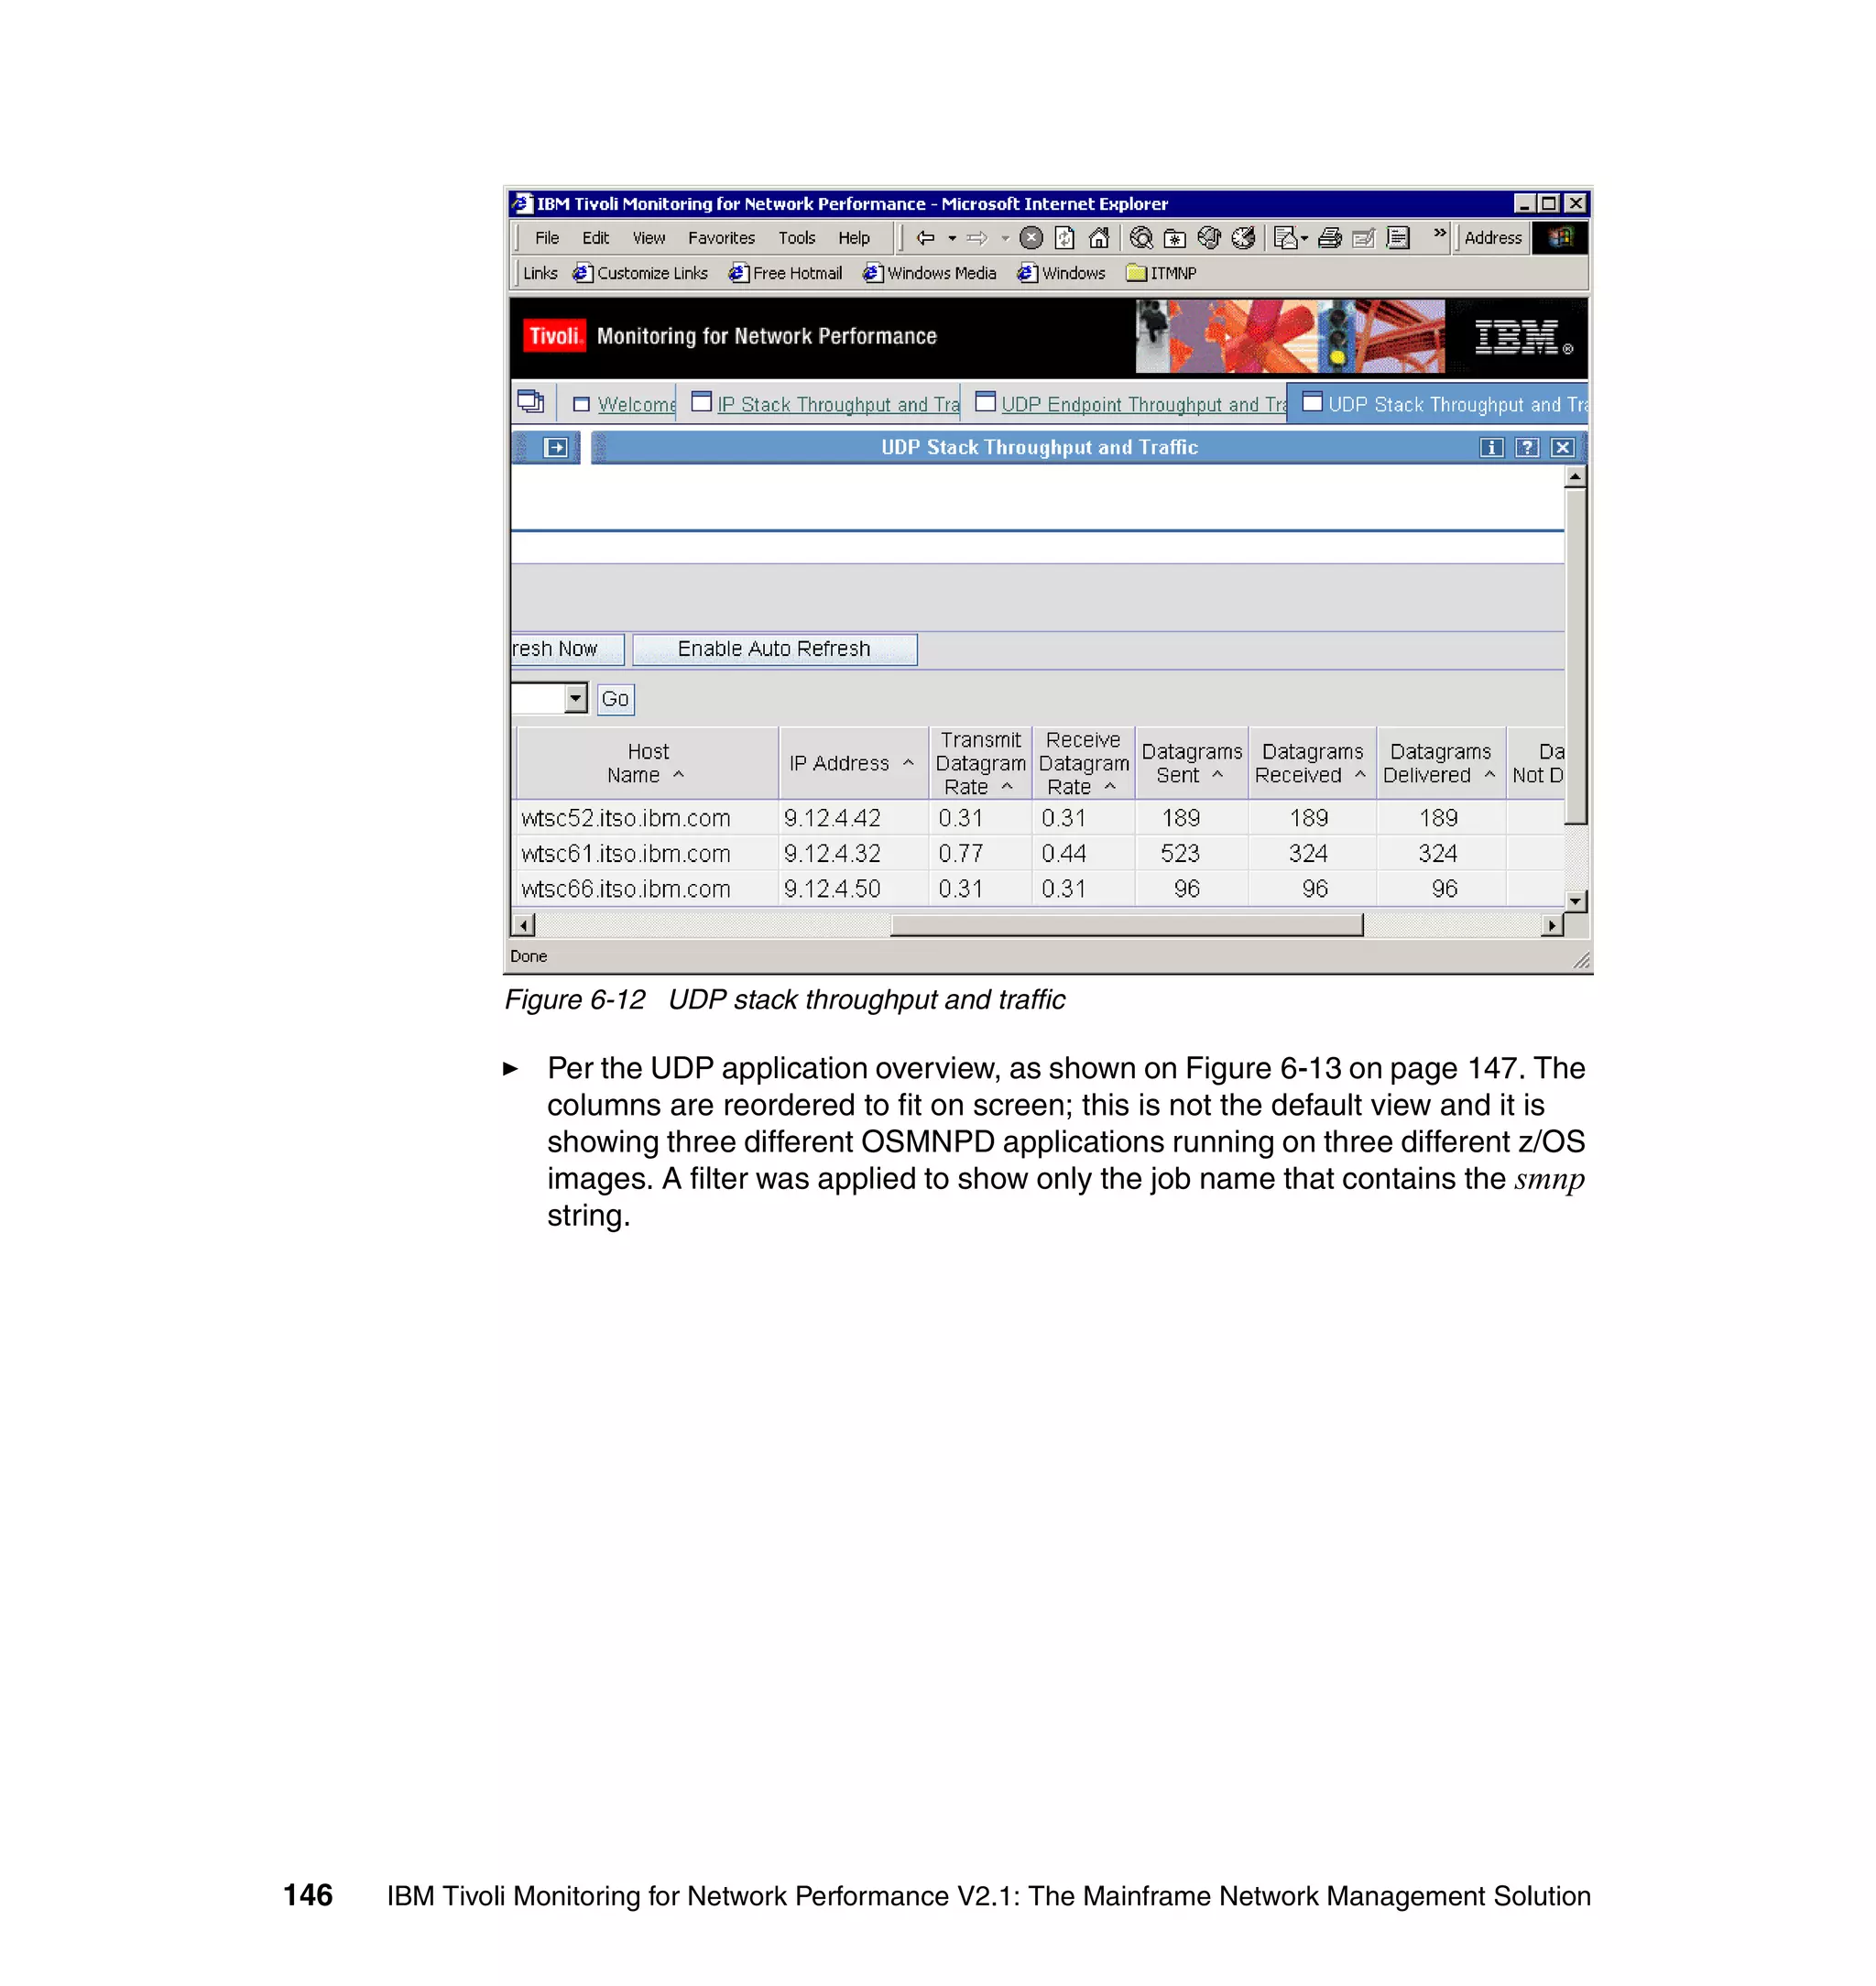
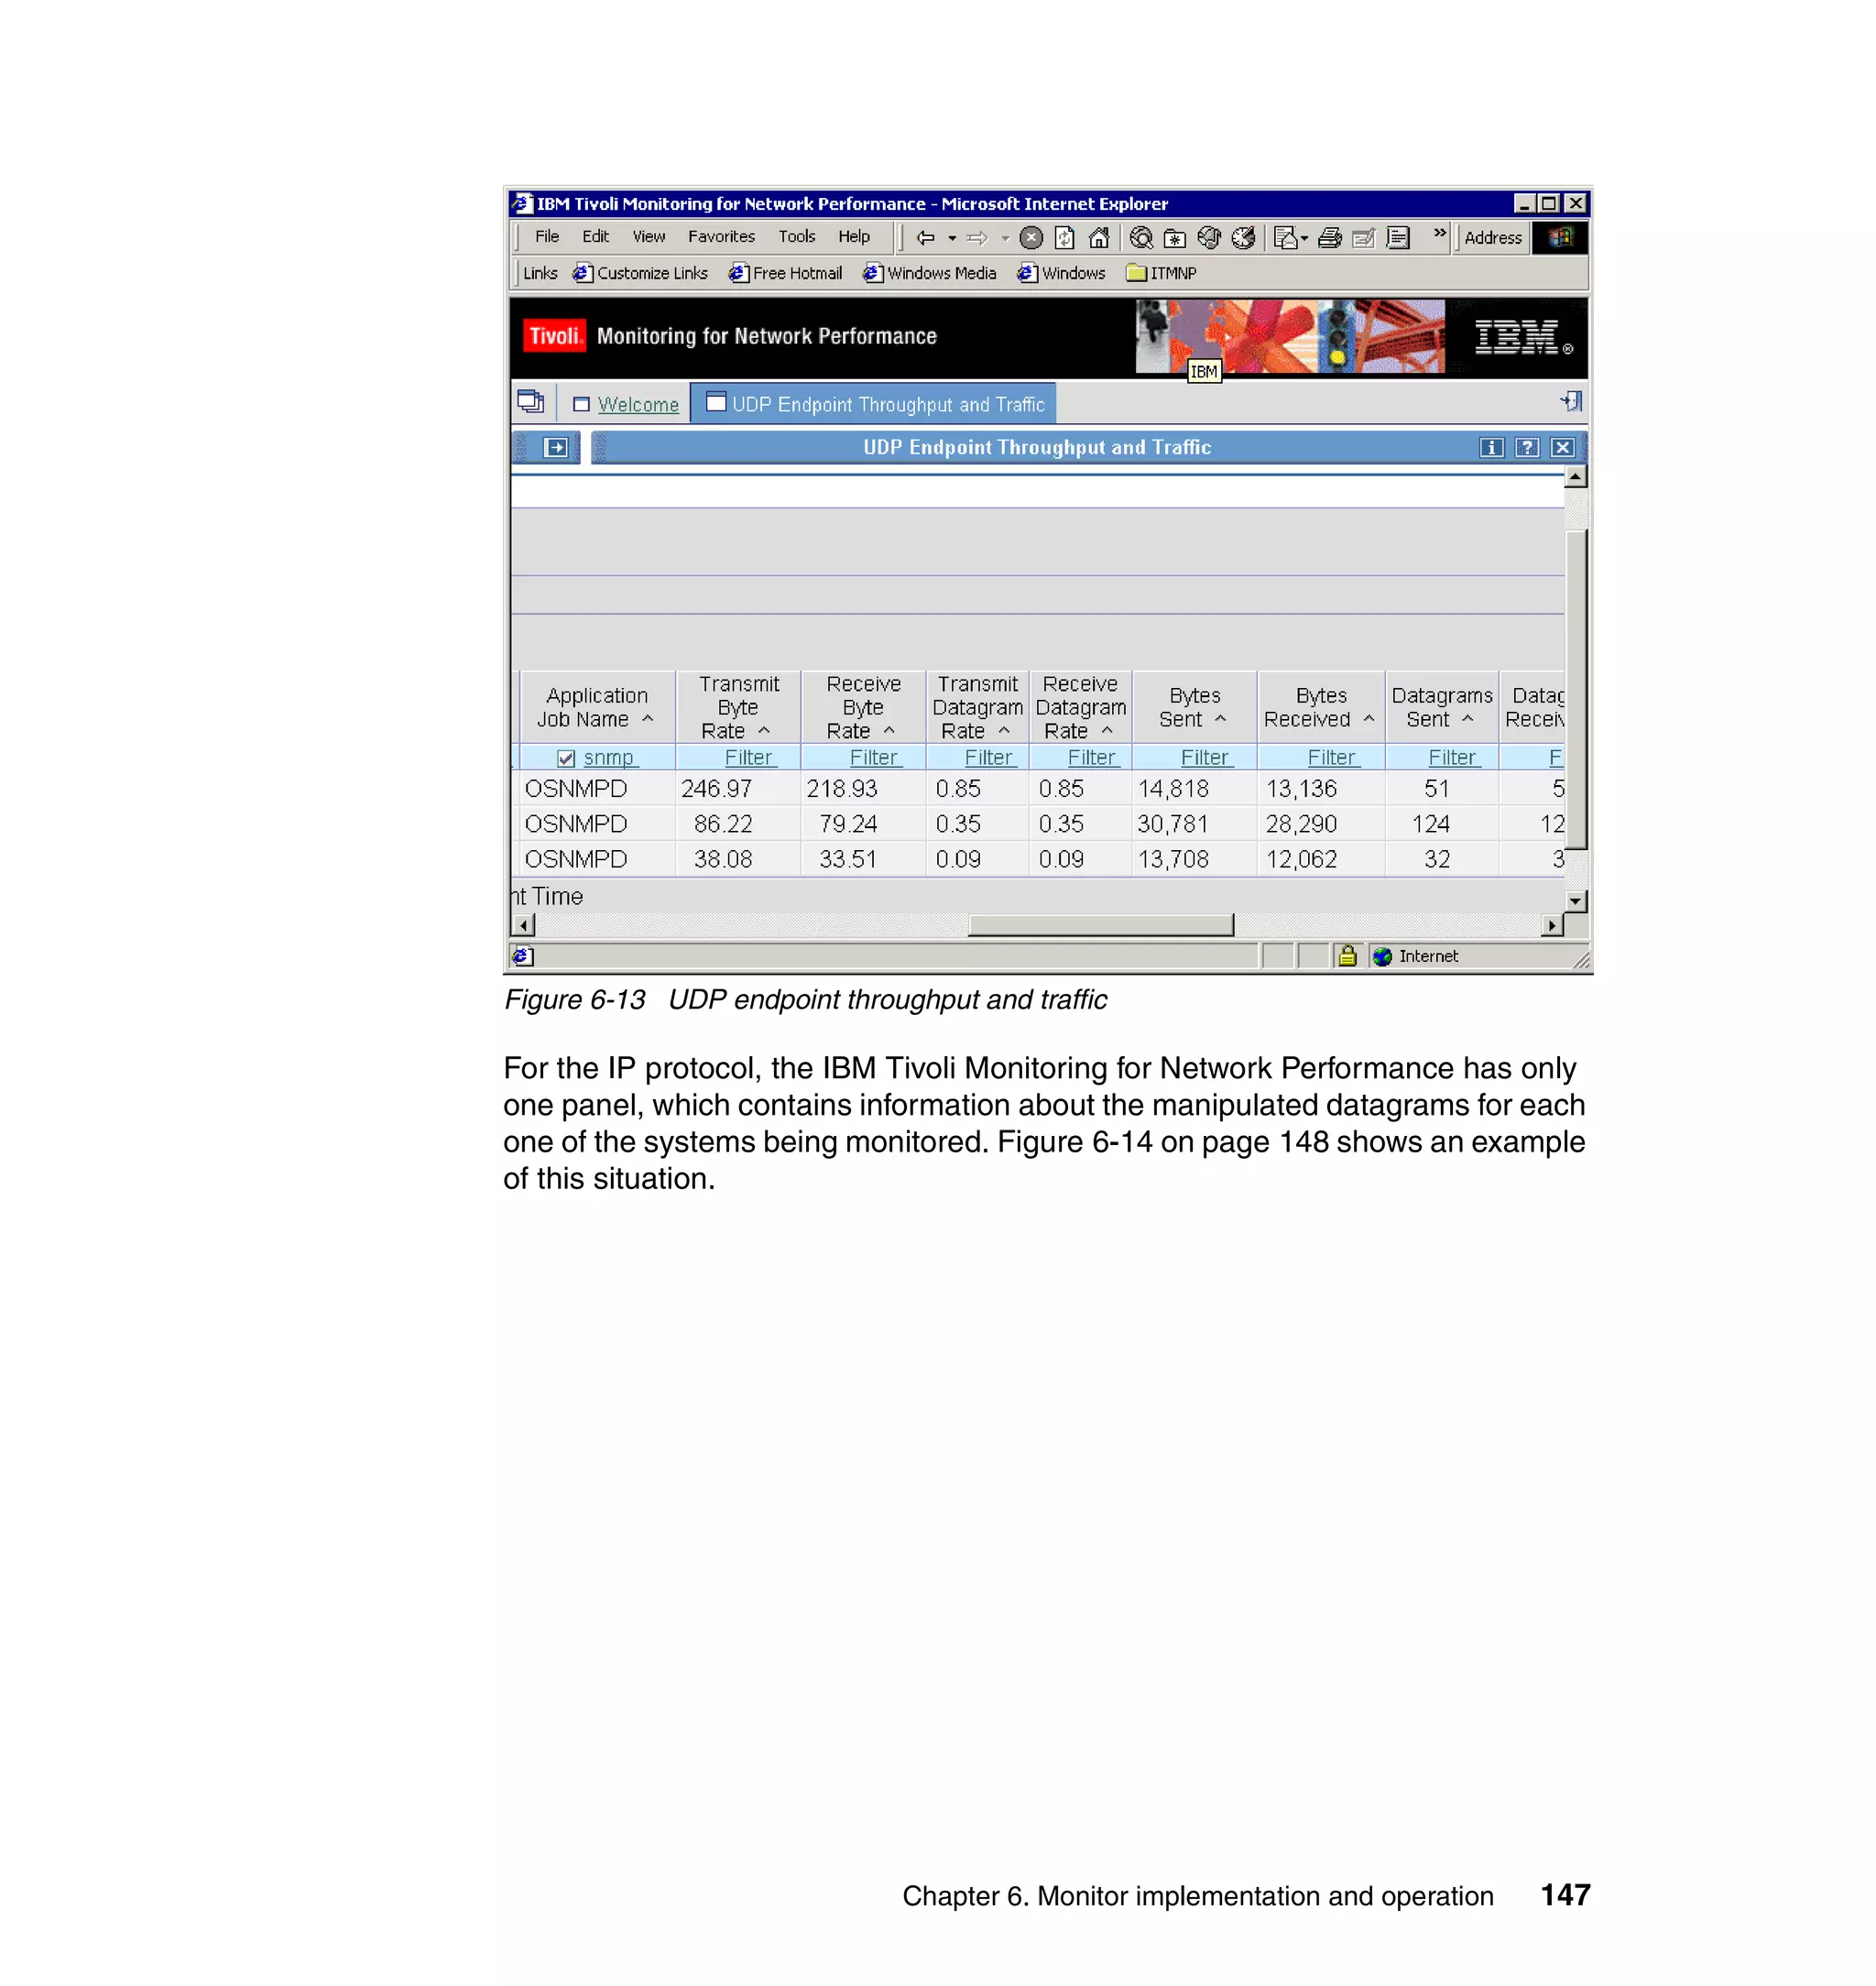
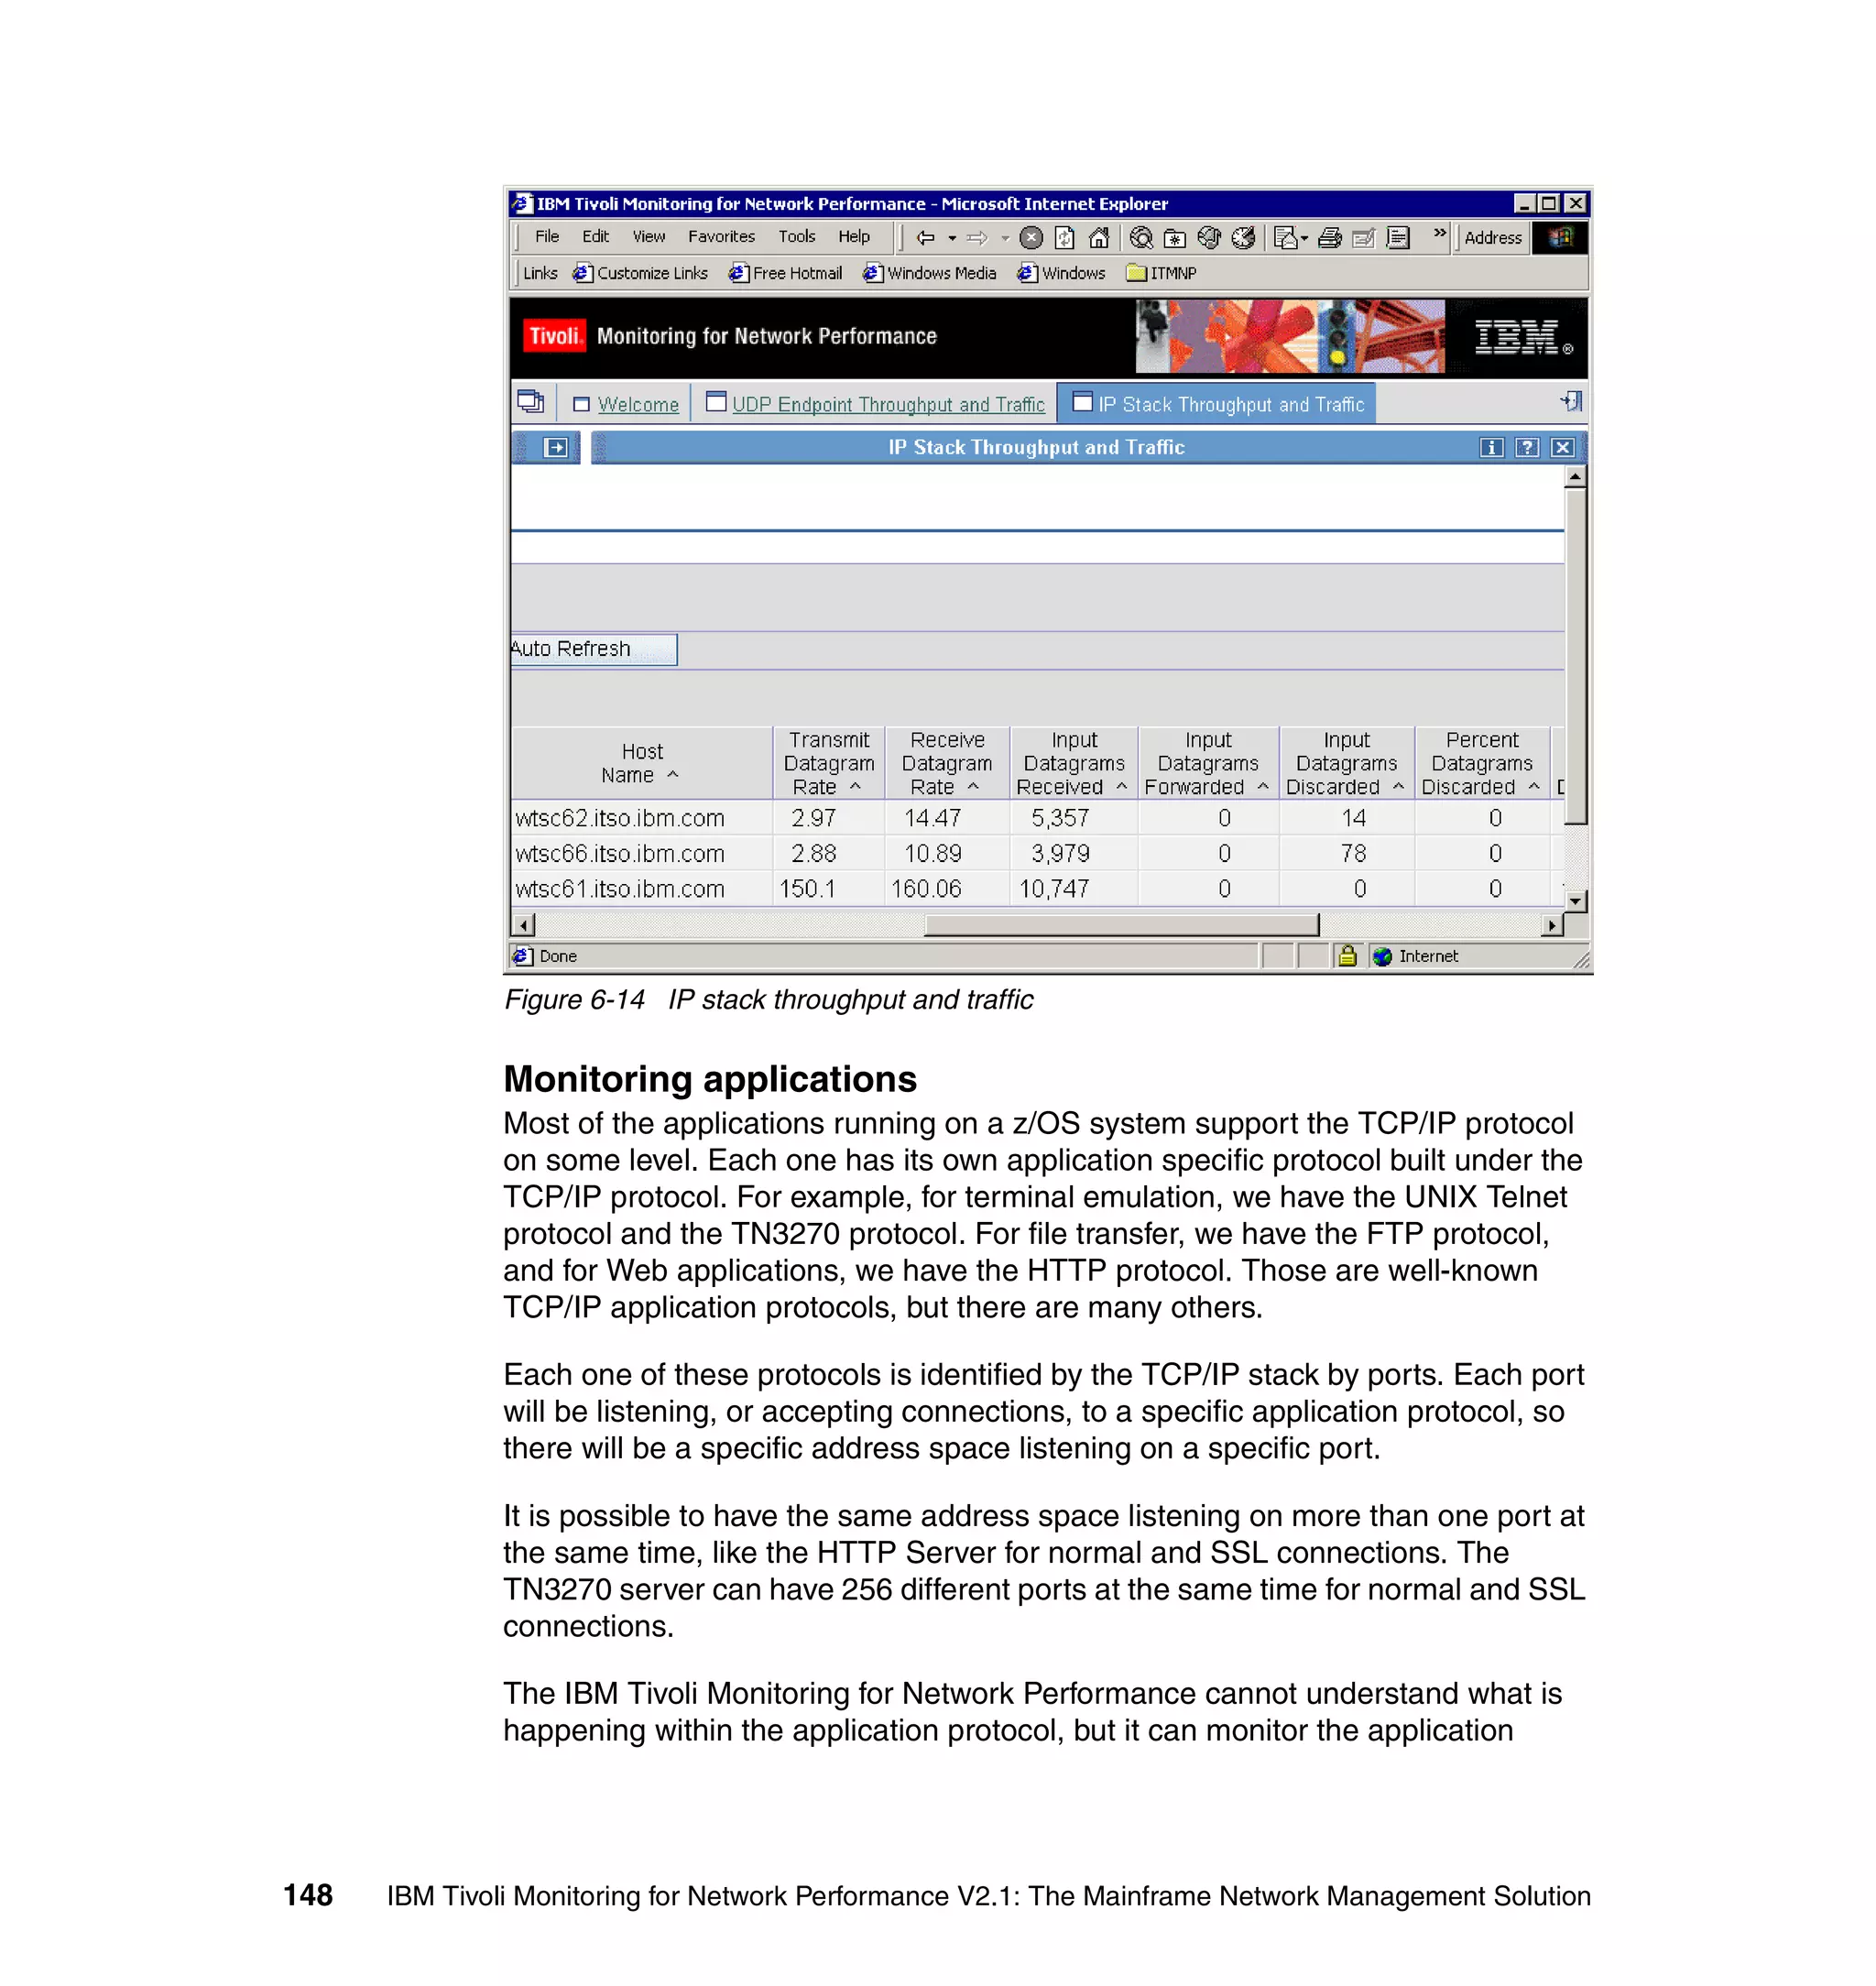
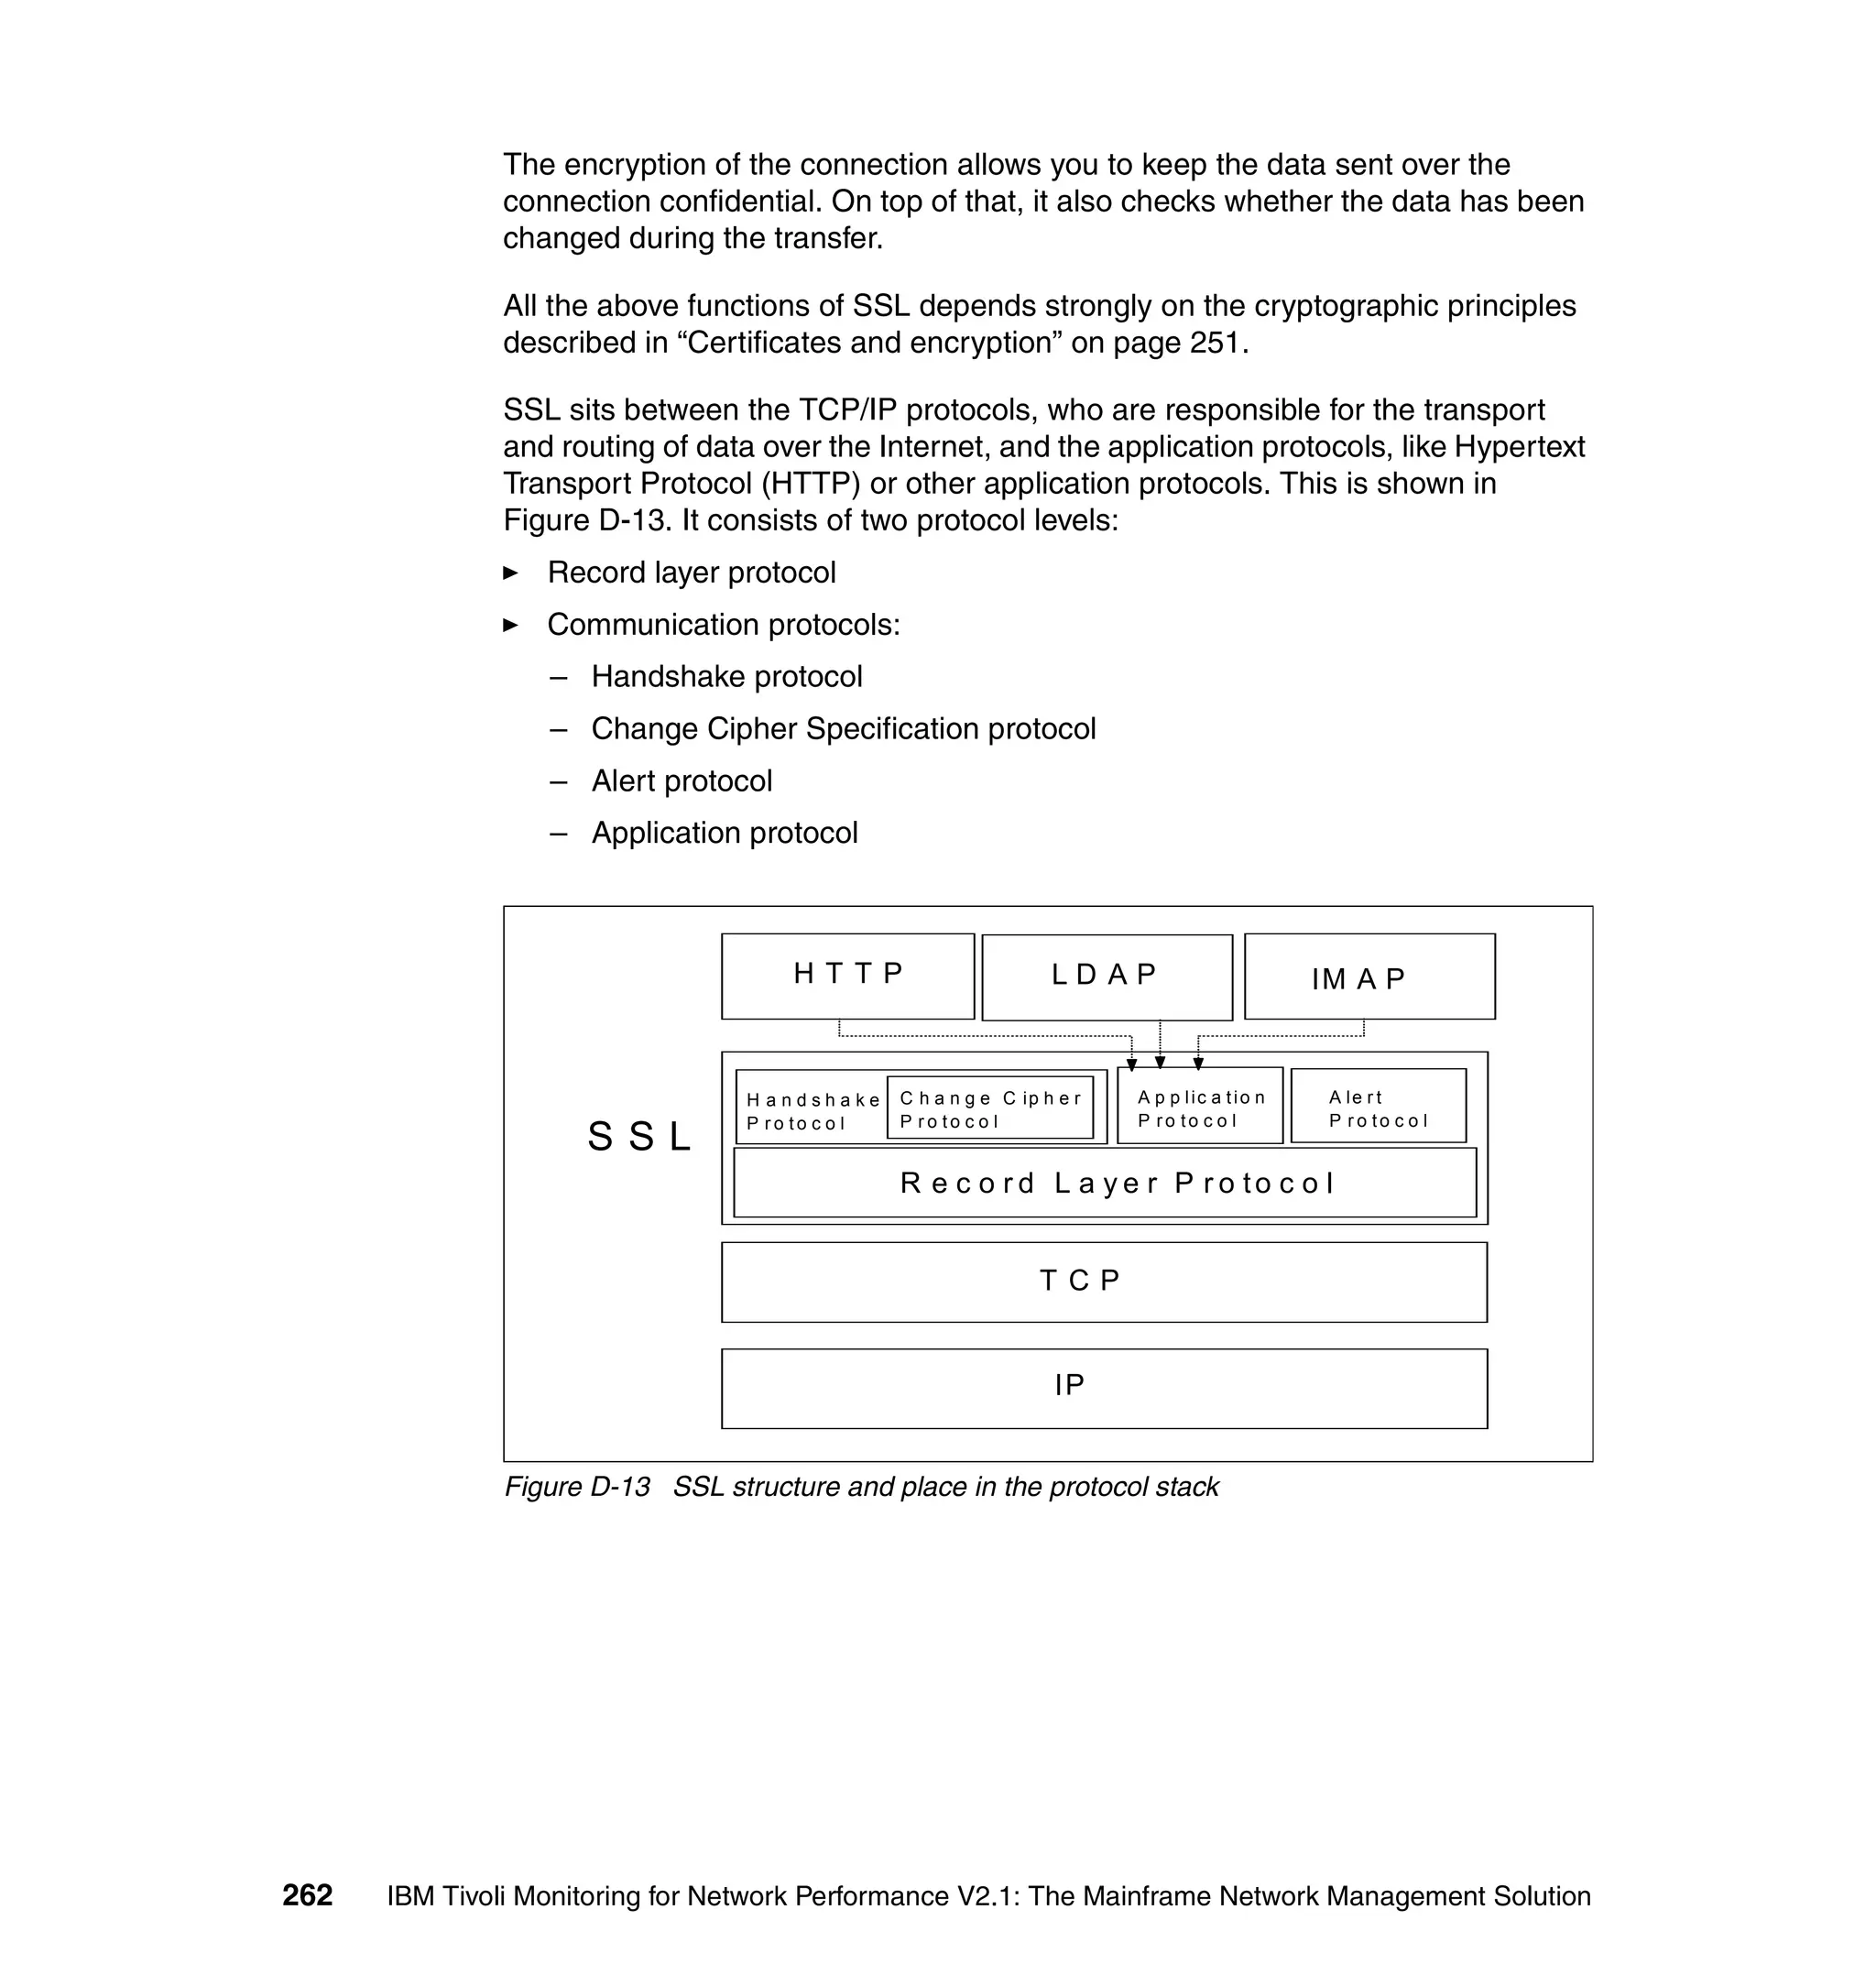
![IBM Tivoli Monitoring for Network Performance should be stopped in the
following sequence:
1. Stop the IBM Tivoli Monitoring for Network Performance monitor as follows:
Issue the following command from the USS command line:
ps -ef | grep launcher
From this output, find the process ID and use it to issue the kill command
below:
kill <process id>
where <process id> is the one belonging to the launcher.
We created a procedure to stop the monitor from the system console, as
shown in Figure 6-4.
//ITMNPSTO PROC
//ITNMPD EXEC PGM=BPXBATCH,REGION=0M,TIME=NOLIMIT,
// PARM='SH /itmnp/V2R1M0/bin/itmnpStop.sh'
//STDERR DD PATH='/var/ibm/tivoli/common/FNP/logs/itmnp.log',
// PATHOPTS=(OWRONLY,OCREAT,OAPPEND),
// PATHMODE=(SIRUSR,SIWUSR,SIRGRP,SIWGRP)
//STDOUT DD PATH='/var/ibm/tivoli/common/FNP/logs/itmnp.log',
// PATHOPTS=(OWRONLY,OCREAT,OAPPEND),
// PATHMODE=(SIRUSR,SIWUSR,SIRGRP,SIWGRP)
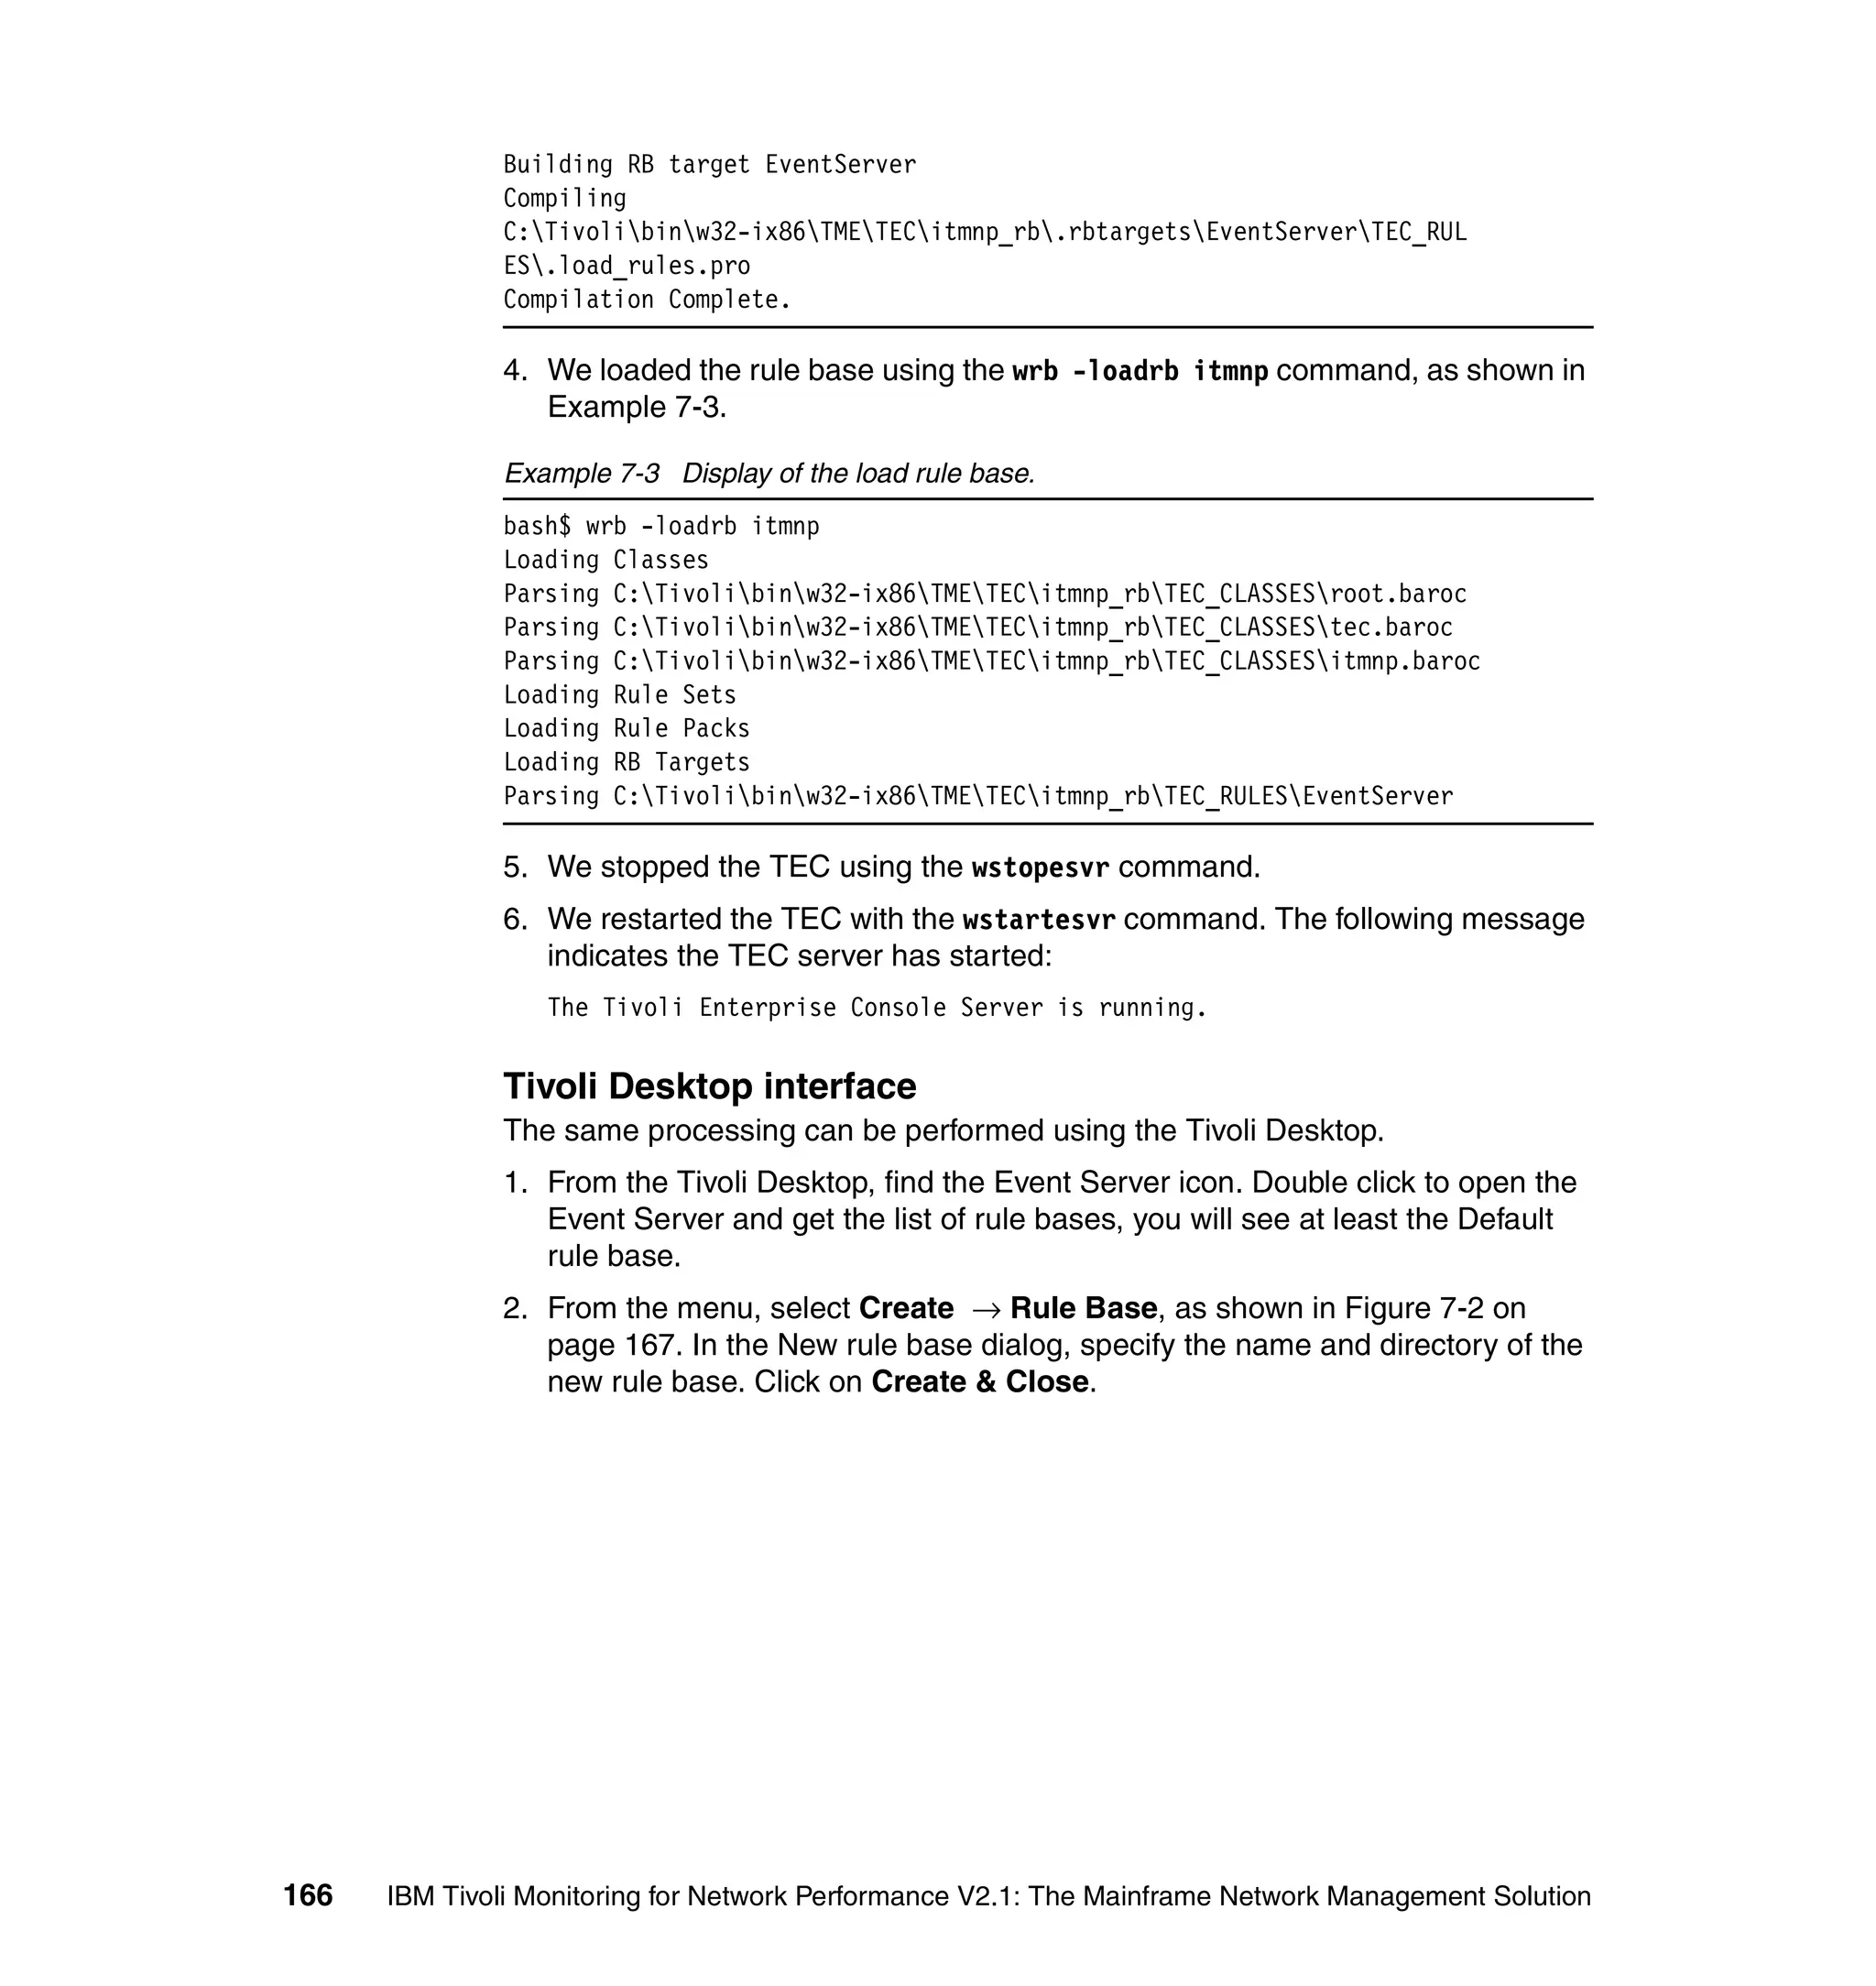
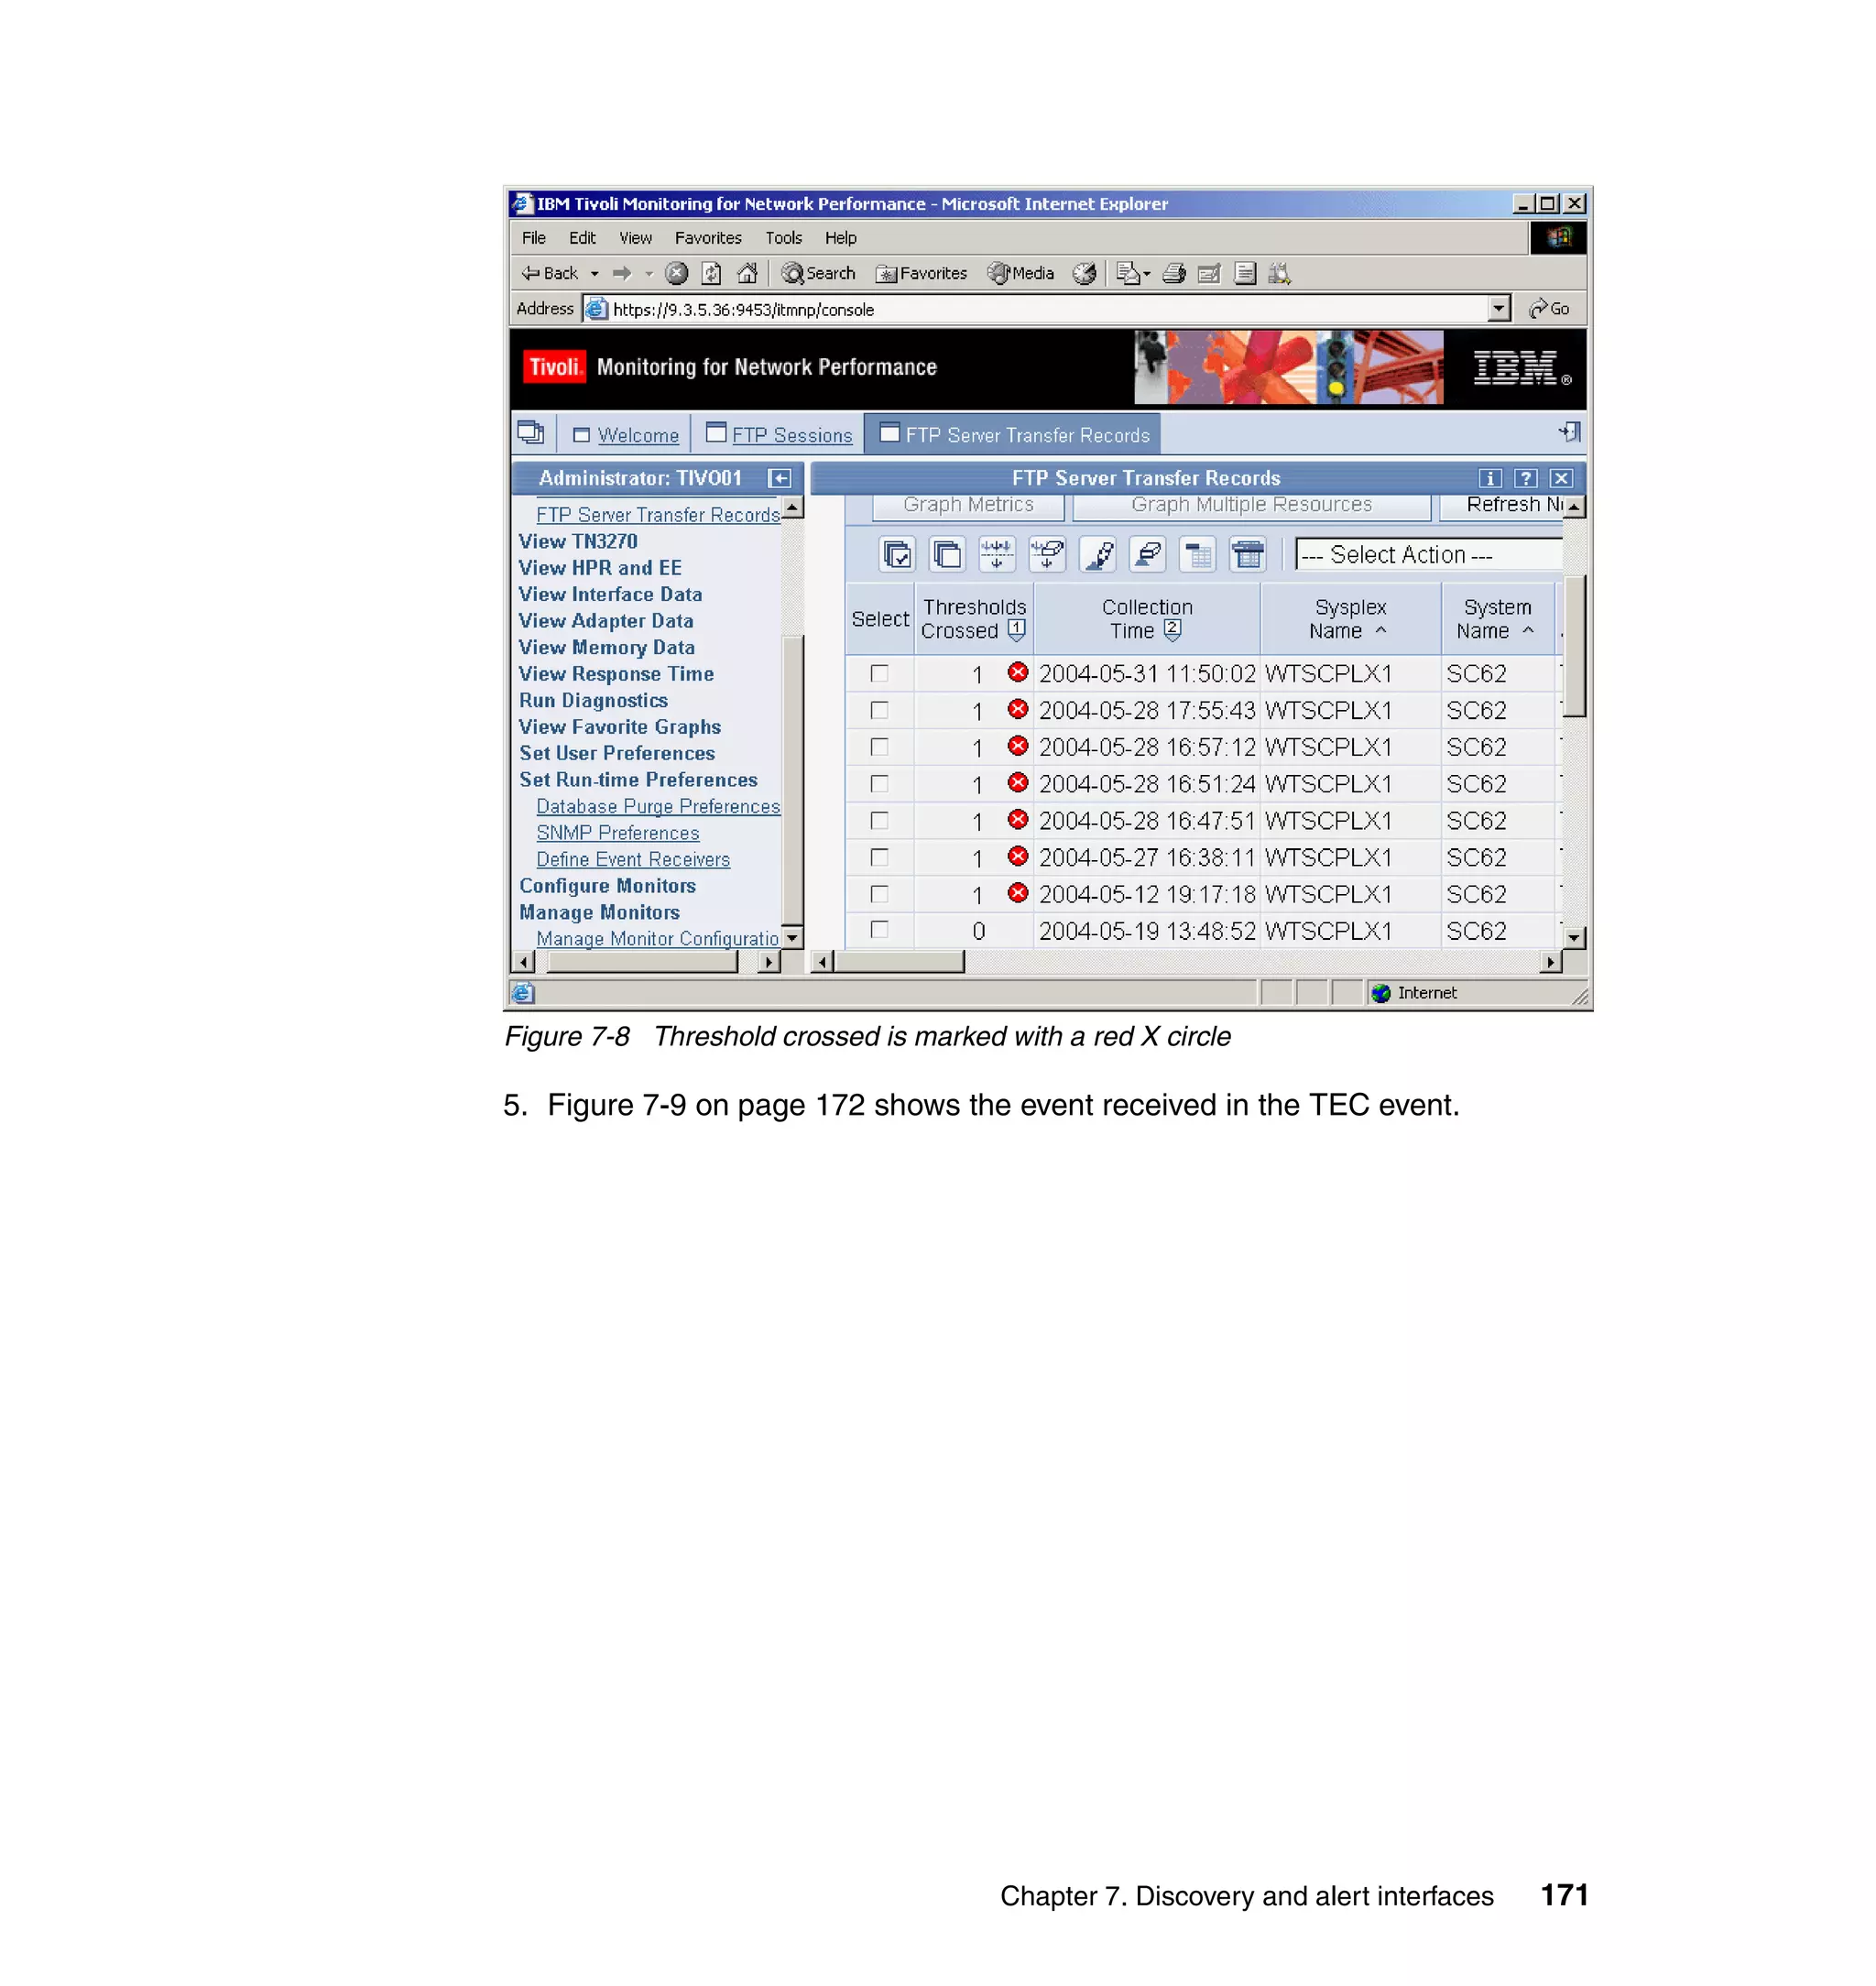
Figure 6-4 ITMNPSTO procedure to stop the monitor
The ITMNPSTO batch procedure executes the shell script, which is shown in
Example 6-2. This shell script, which we created, finds the monitor’s process
IDs and issues kill commands to stop the monitor.
Example 6-2 The itmnpsto.sh script to stop the monitor
#!/bin/sh
pid=`ps -ef | grep launcher | grep -v grep | awk '{print $2}'`
if [ $pid > 1 ]
then
kill -9 $pid
fi
pid=`ps -ef | grep monitor_cs390 | grep -v grep | awk '{print $2}'`
if [ $pid > 1 ]
then
kill -9 $pid
fi
exit 0
Chapter 6. Monitor implementation and operation 133](https://image.slidesharecdn.com/ibmtivolimonitoringfornetworkperformancev2-1themainframenetworkmanagementsolutionsg246360-120524030008-phpapp02/75/Ibm-tivoli-monitoring-for-network-performance-v2-1-the-mainframe-network-management-solution-sg246360-149-2048.jpg)


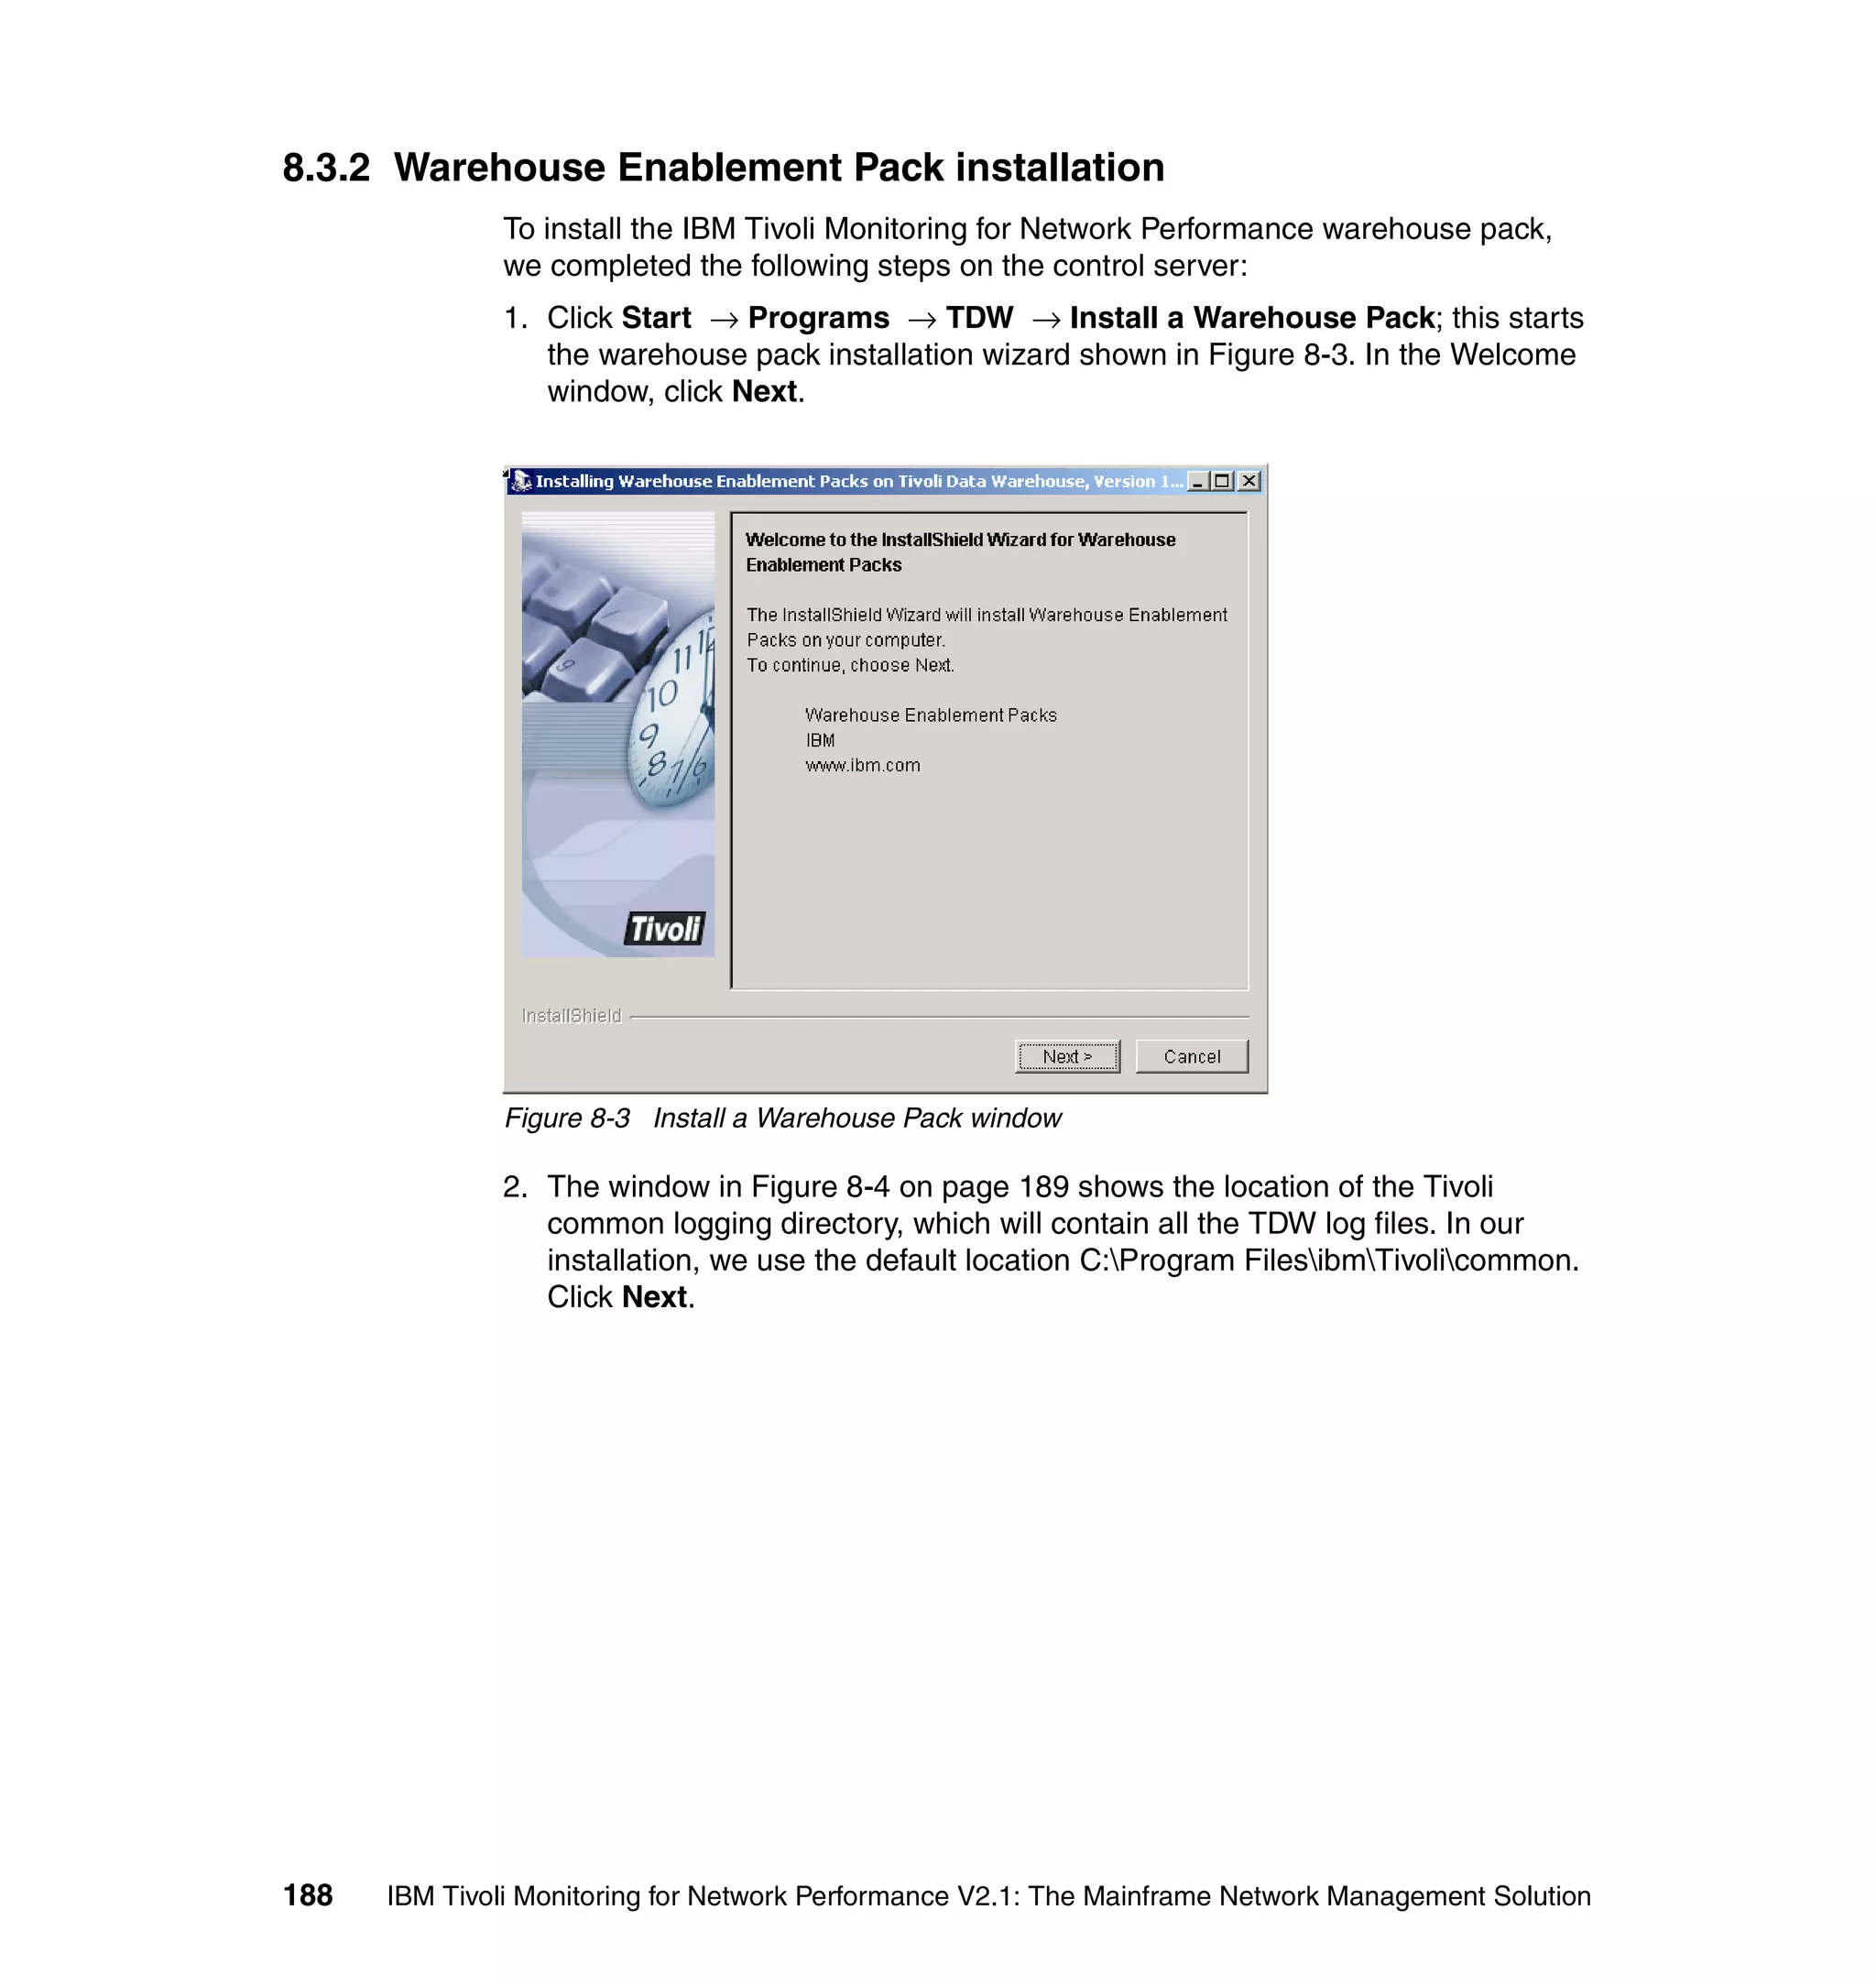
![Example 7-4 Sample itmnp.rls file
rule:
itmnp_threshold:
(
event: _event of_class within ['ITMNP_ThresholdExceeded']
where [ ],
reception_action: invoke_Automation:
(
exec_program(_event, 'scripts/itmnp_tec.sh', '', [], 'YES'),
commit_set
)
).
rule:
itmnp_rearmed:
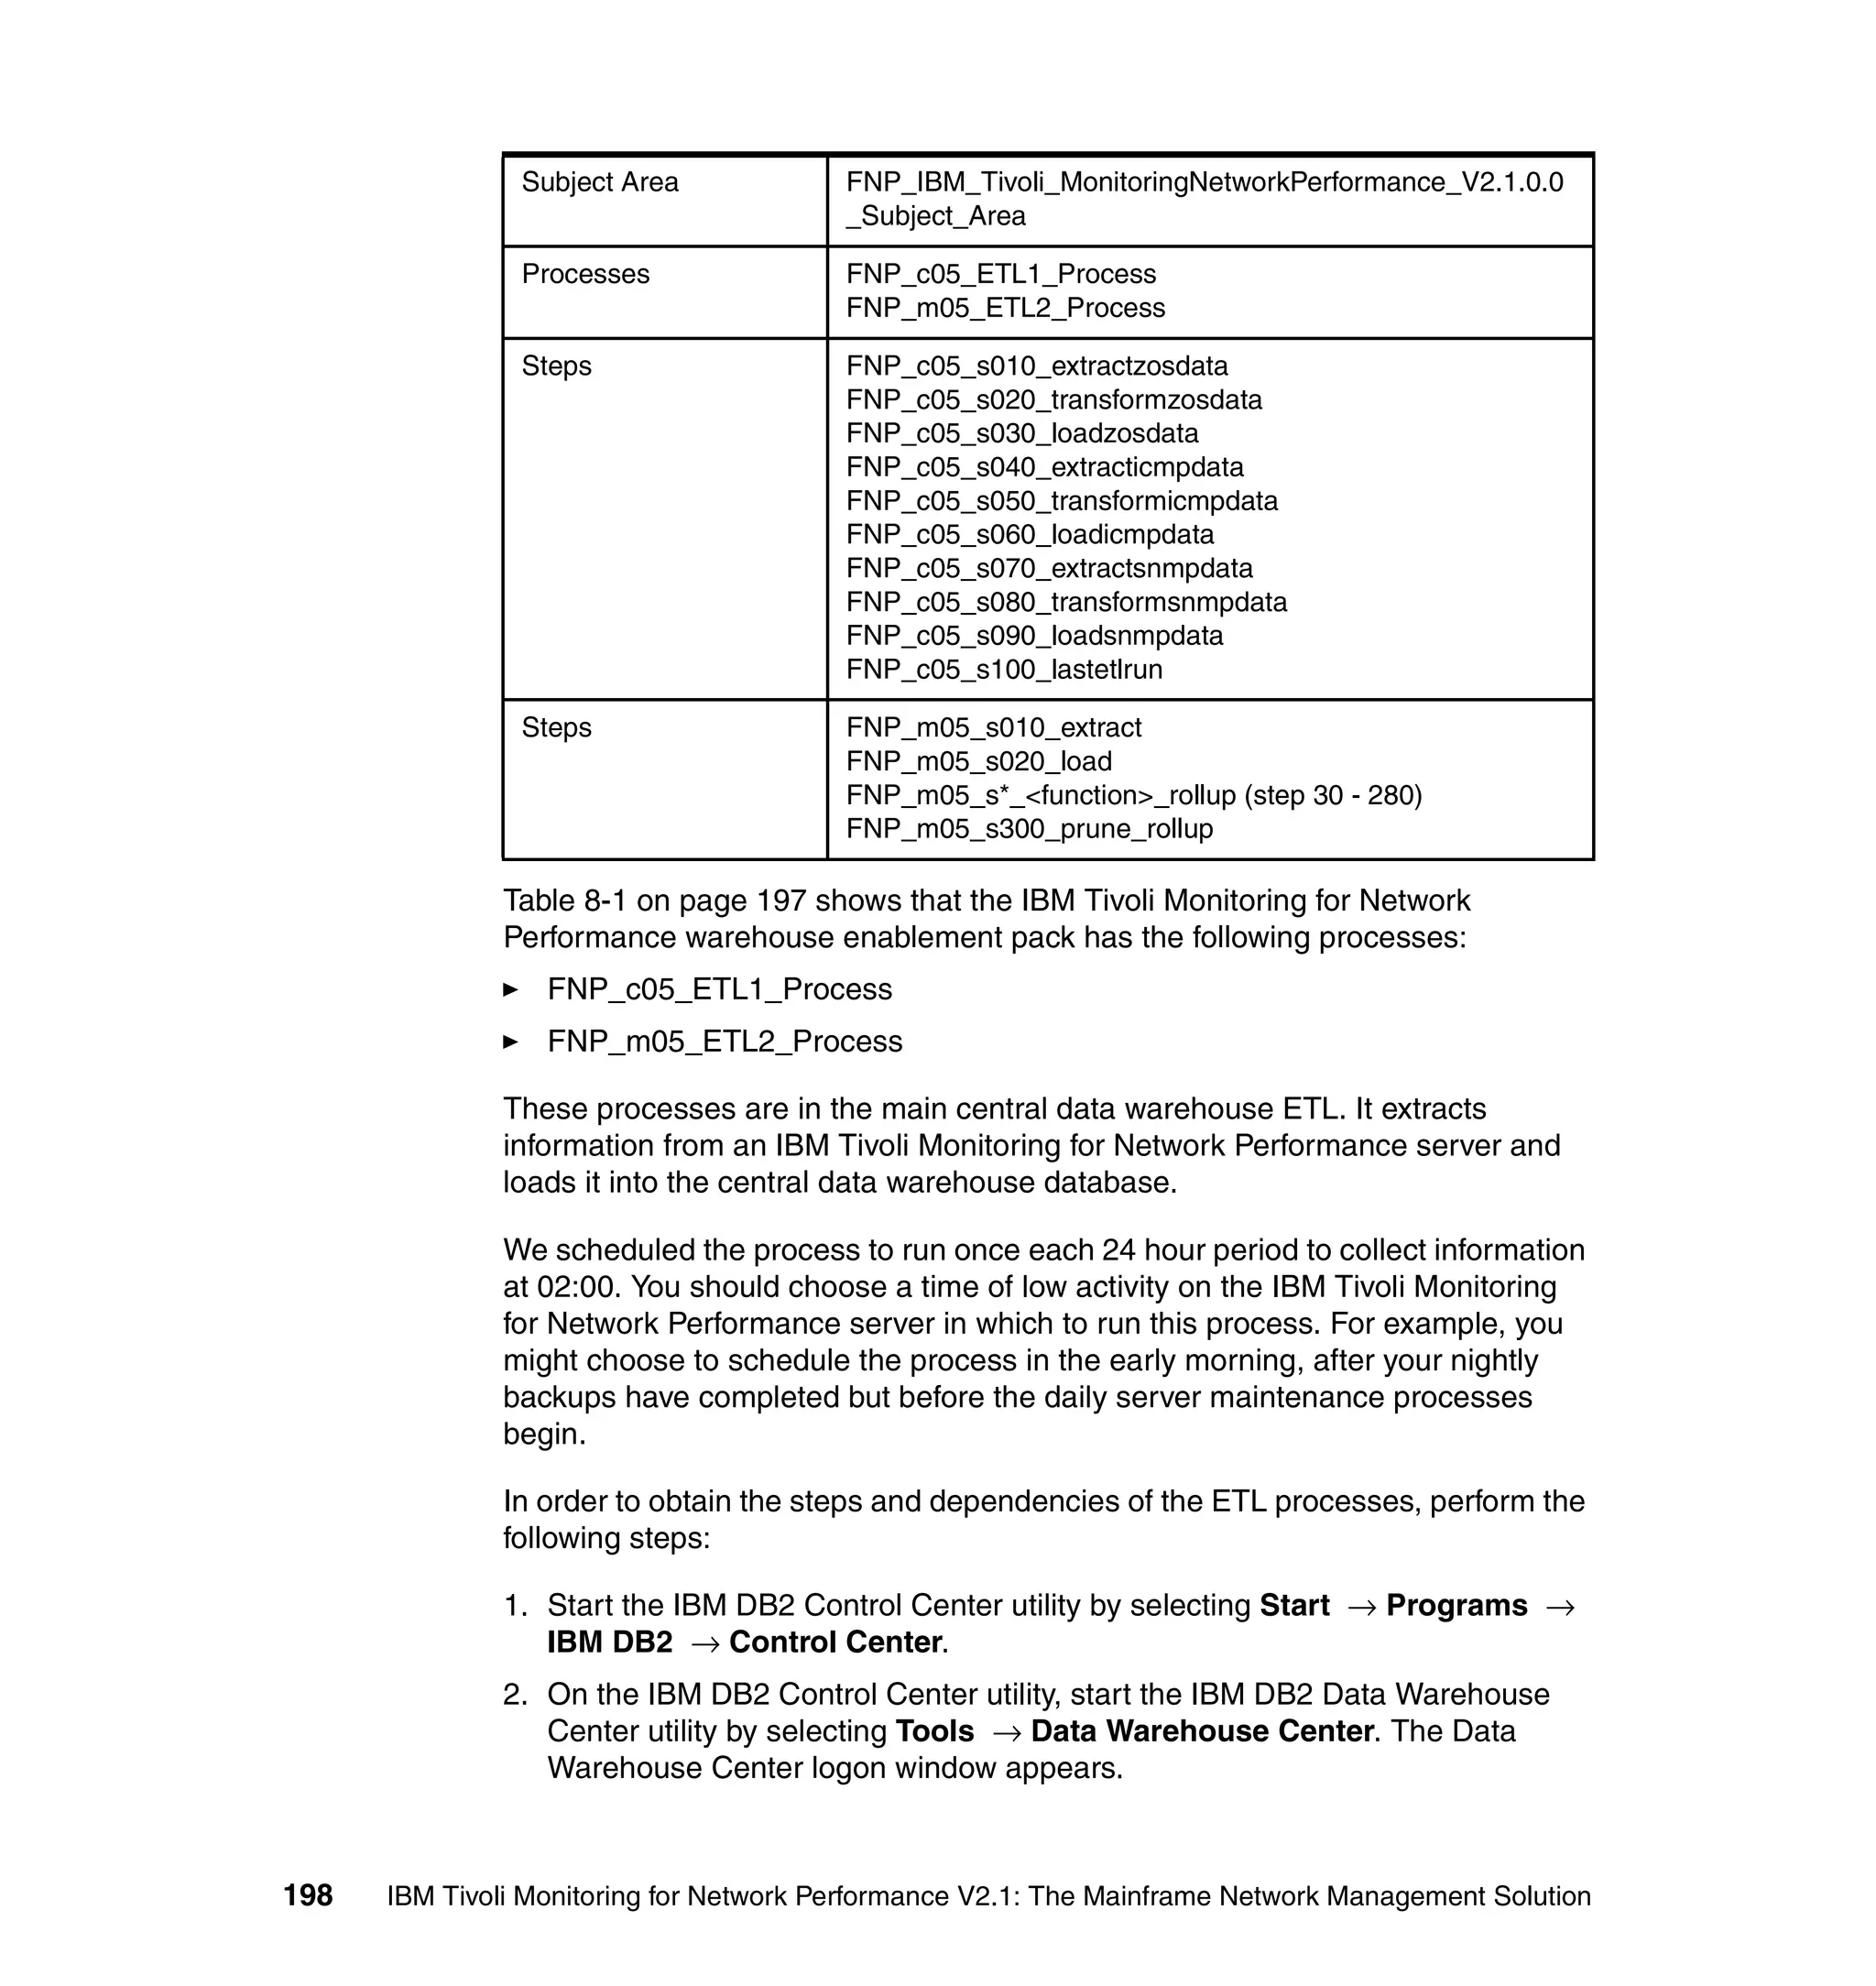
(
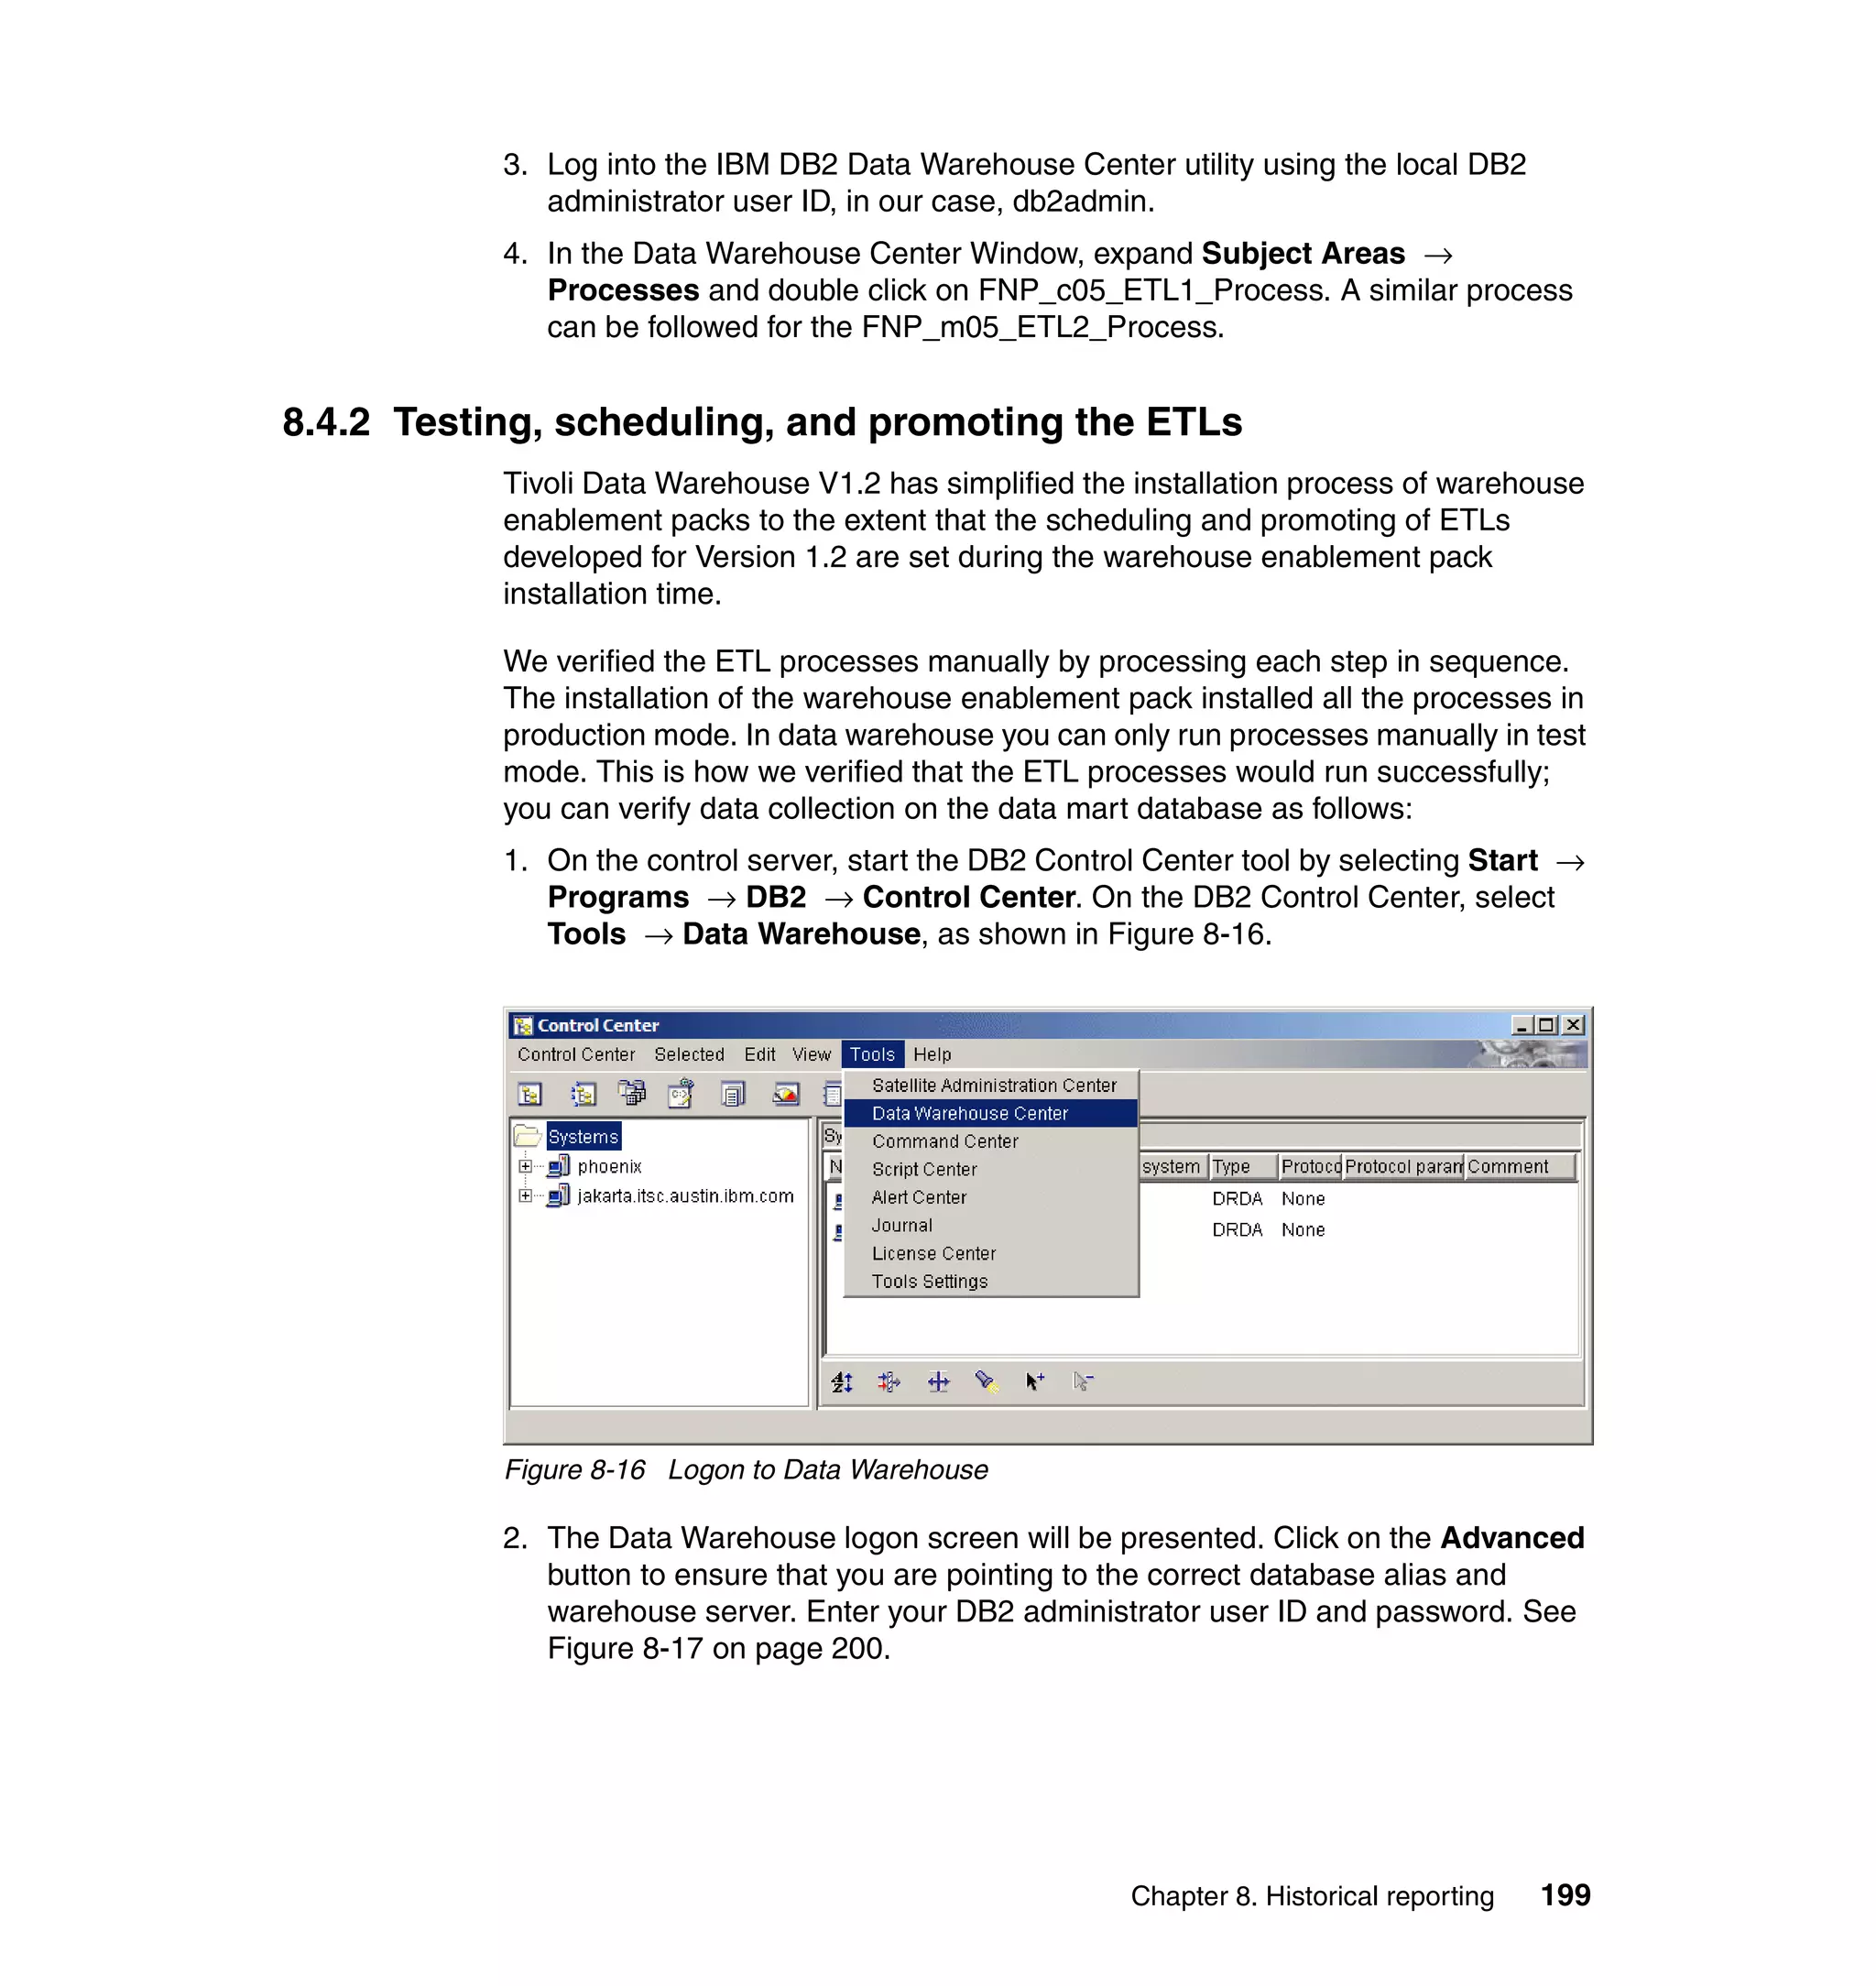
event: _event of_class within ['ITMNP_ThresholdExceeded']
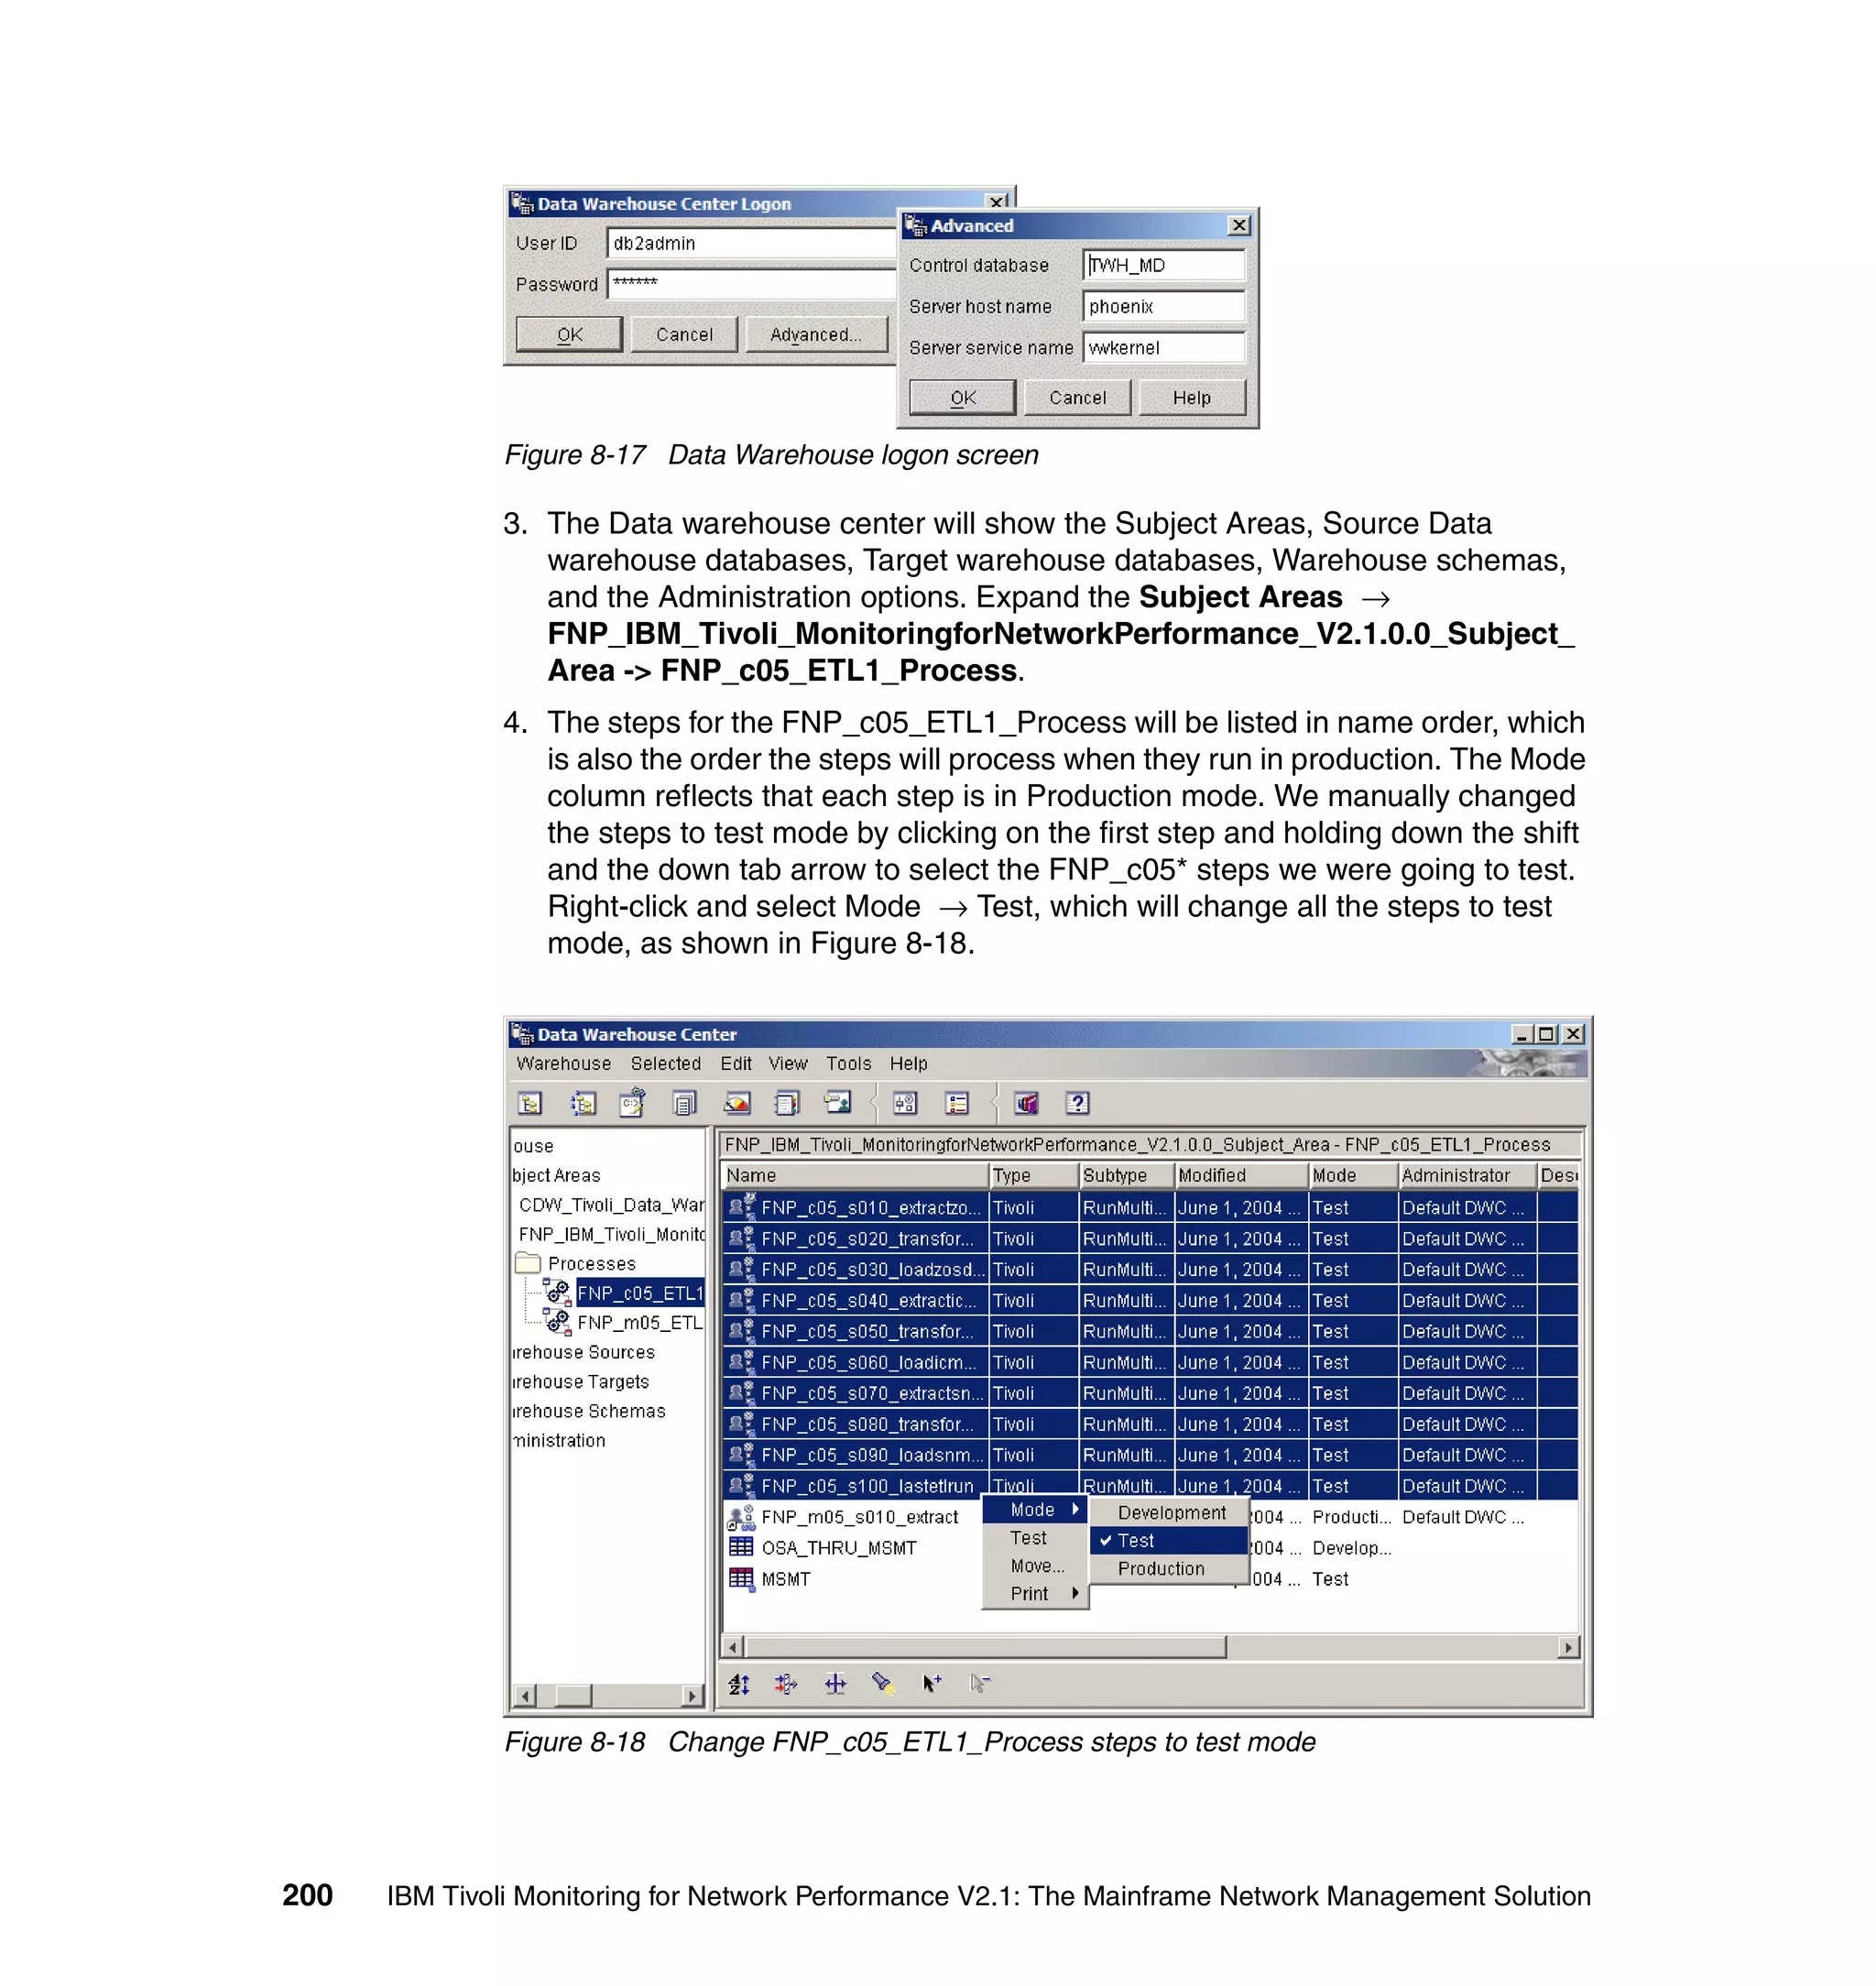
where [ field_name: _field_name,
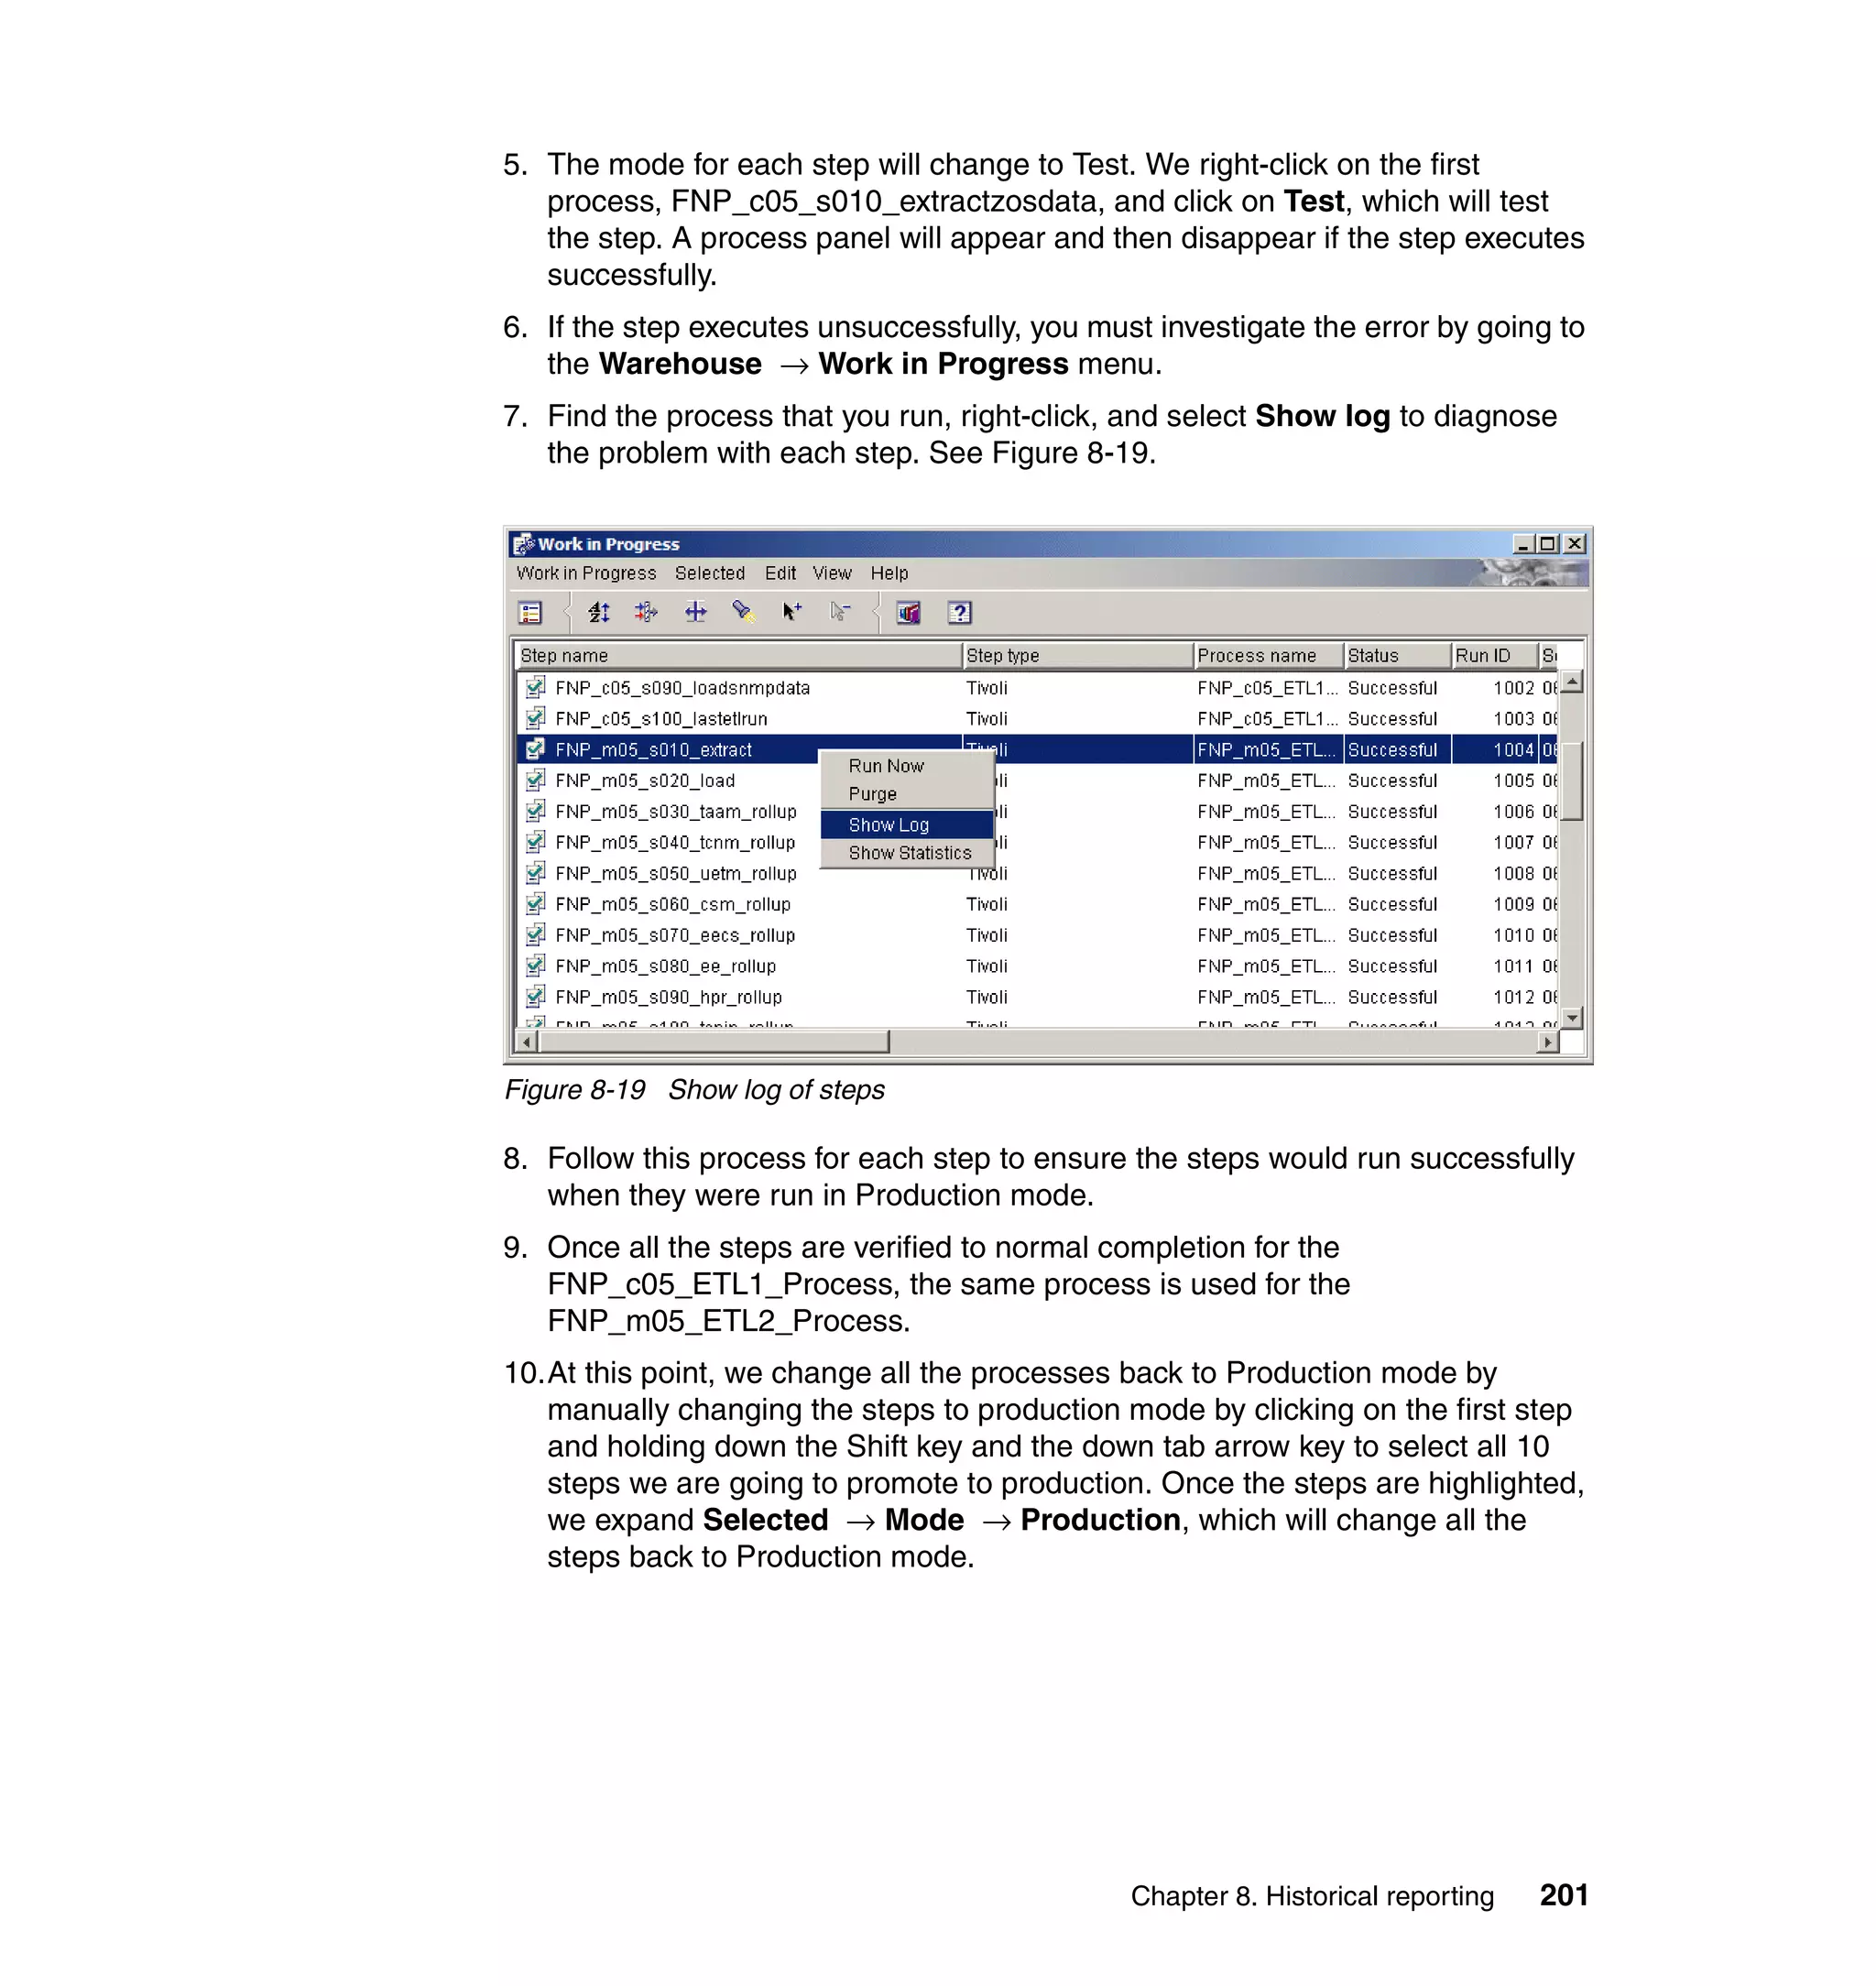
monitor_host: _monitor_host
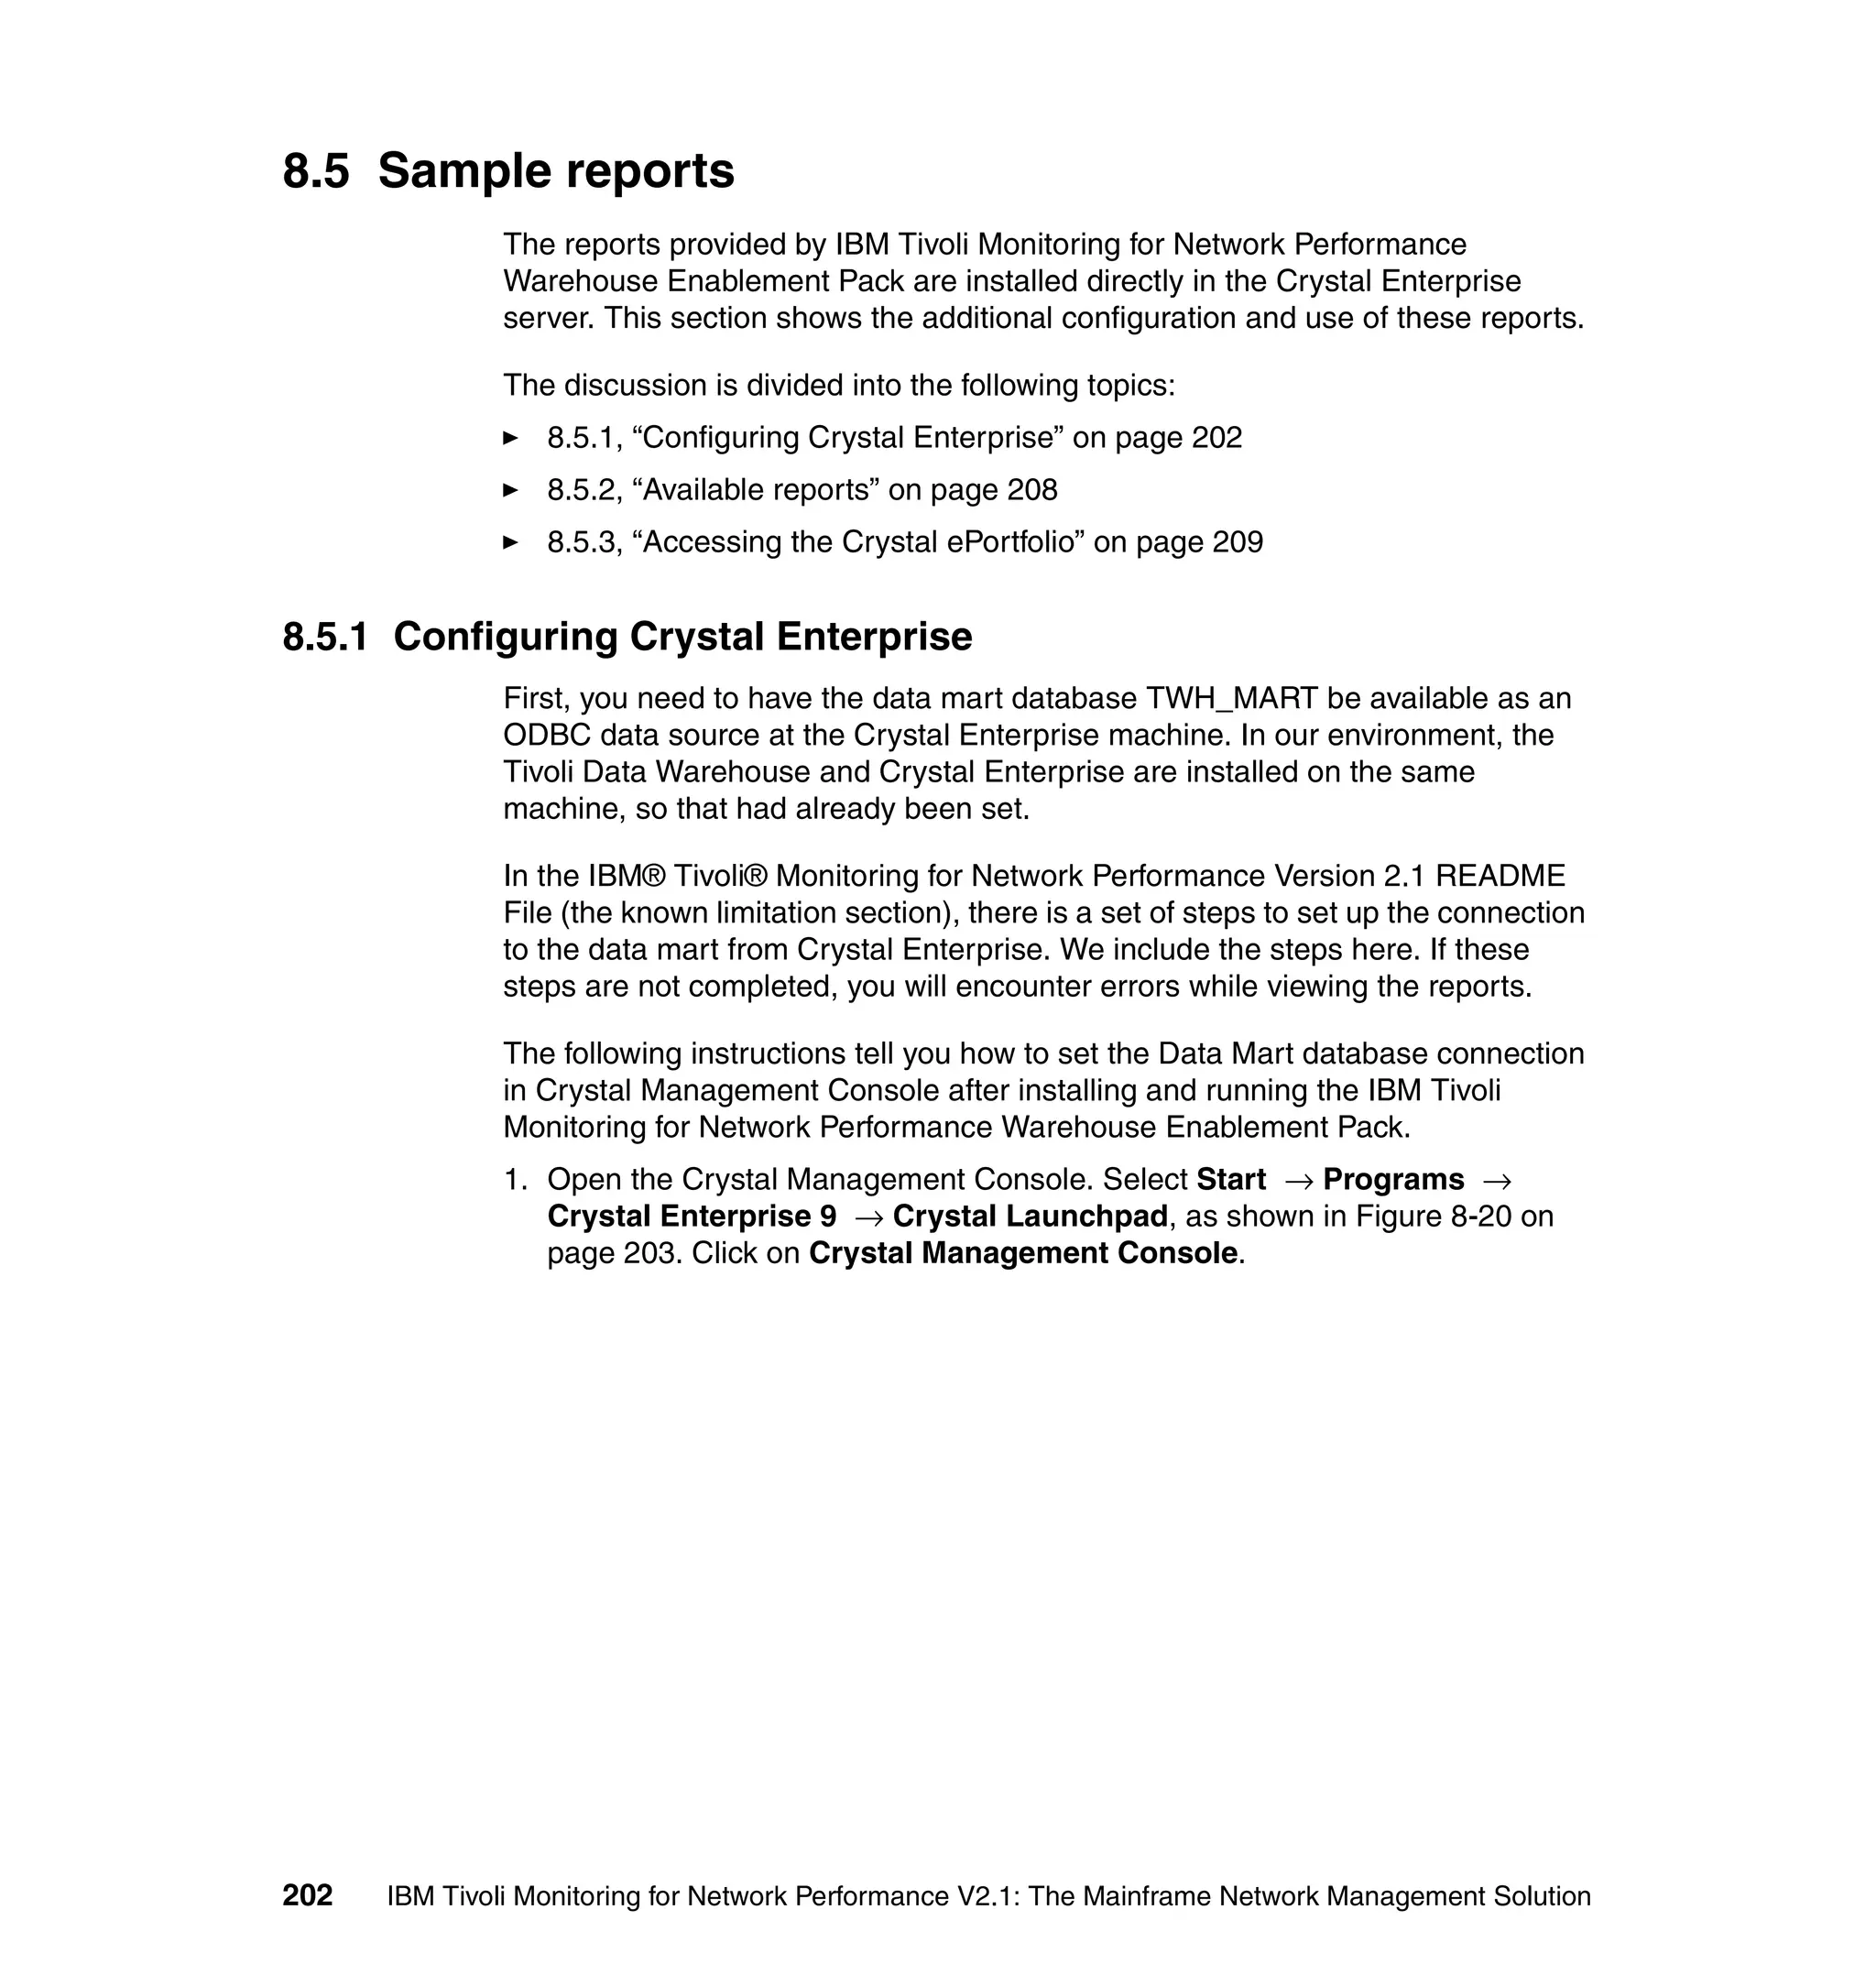
],
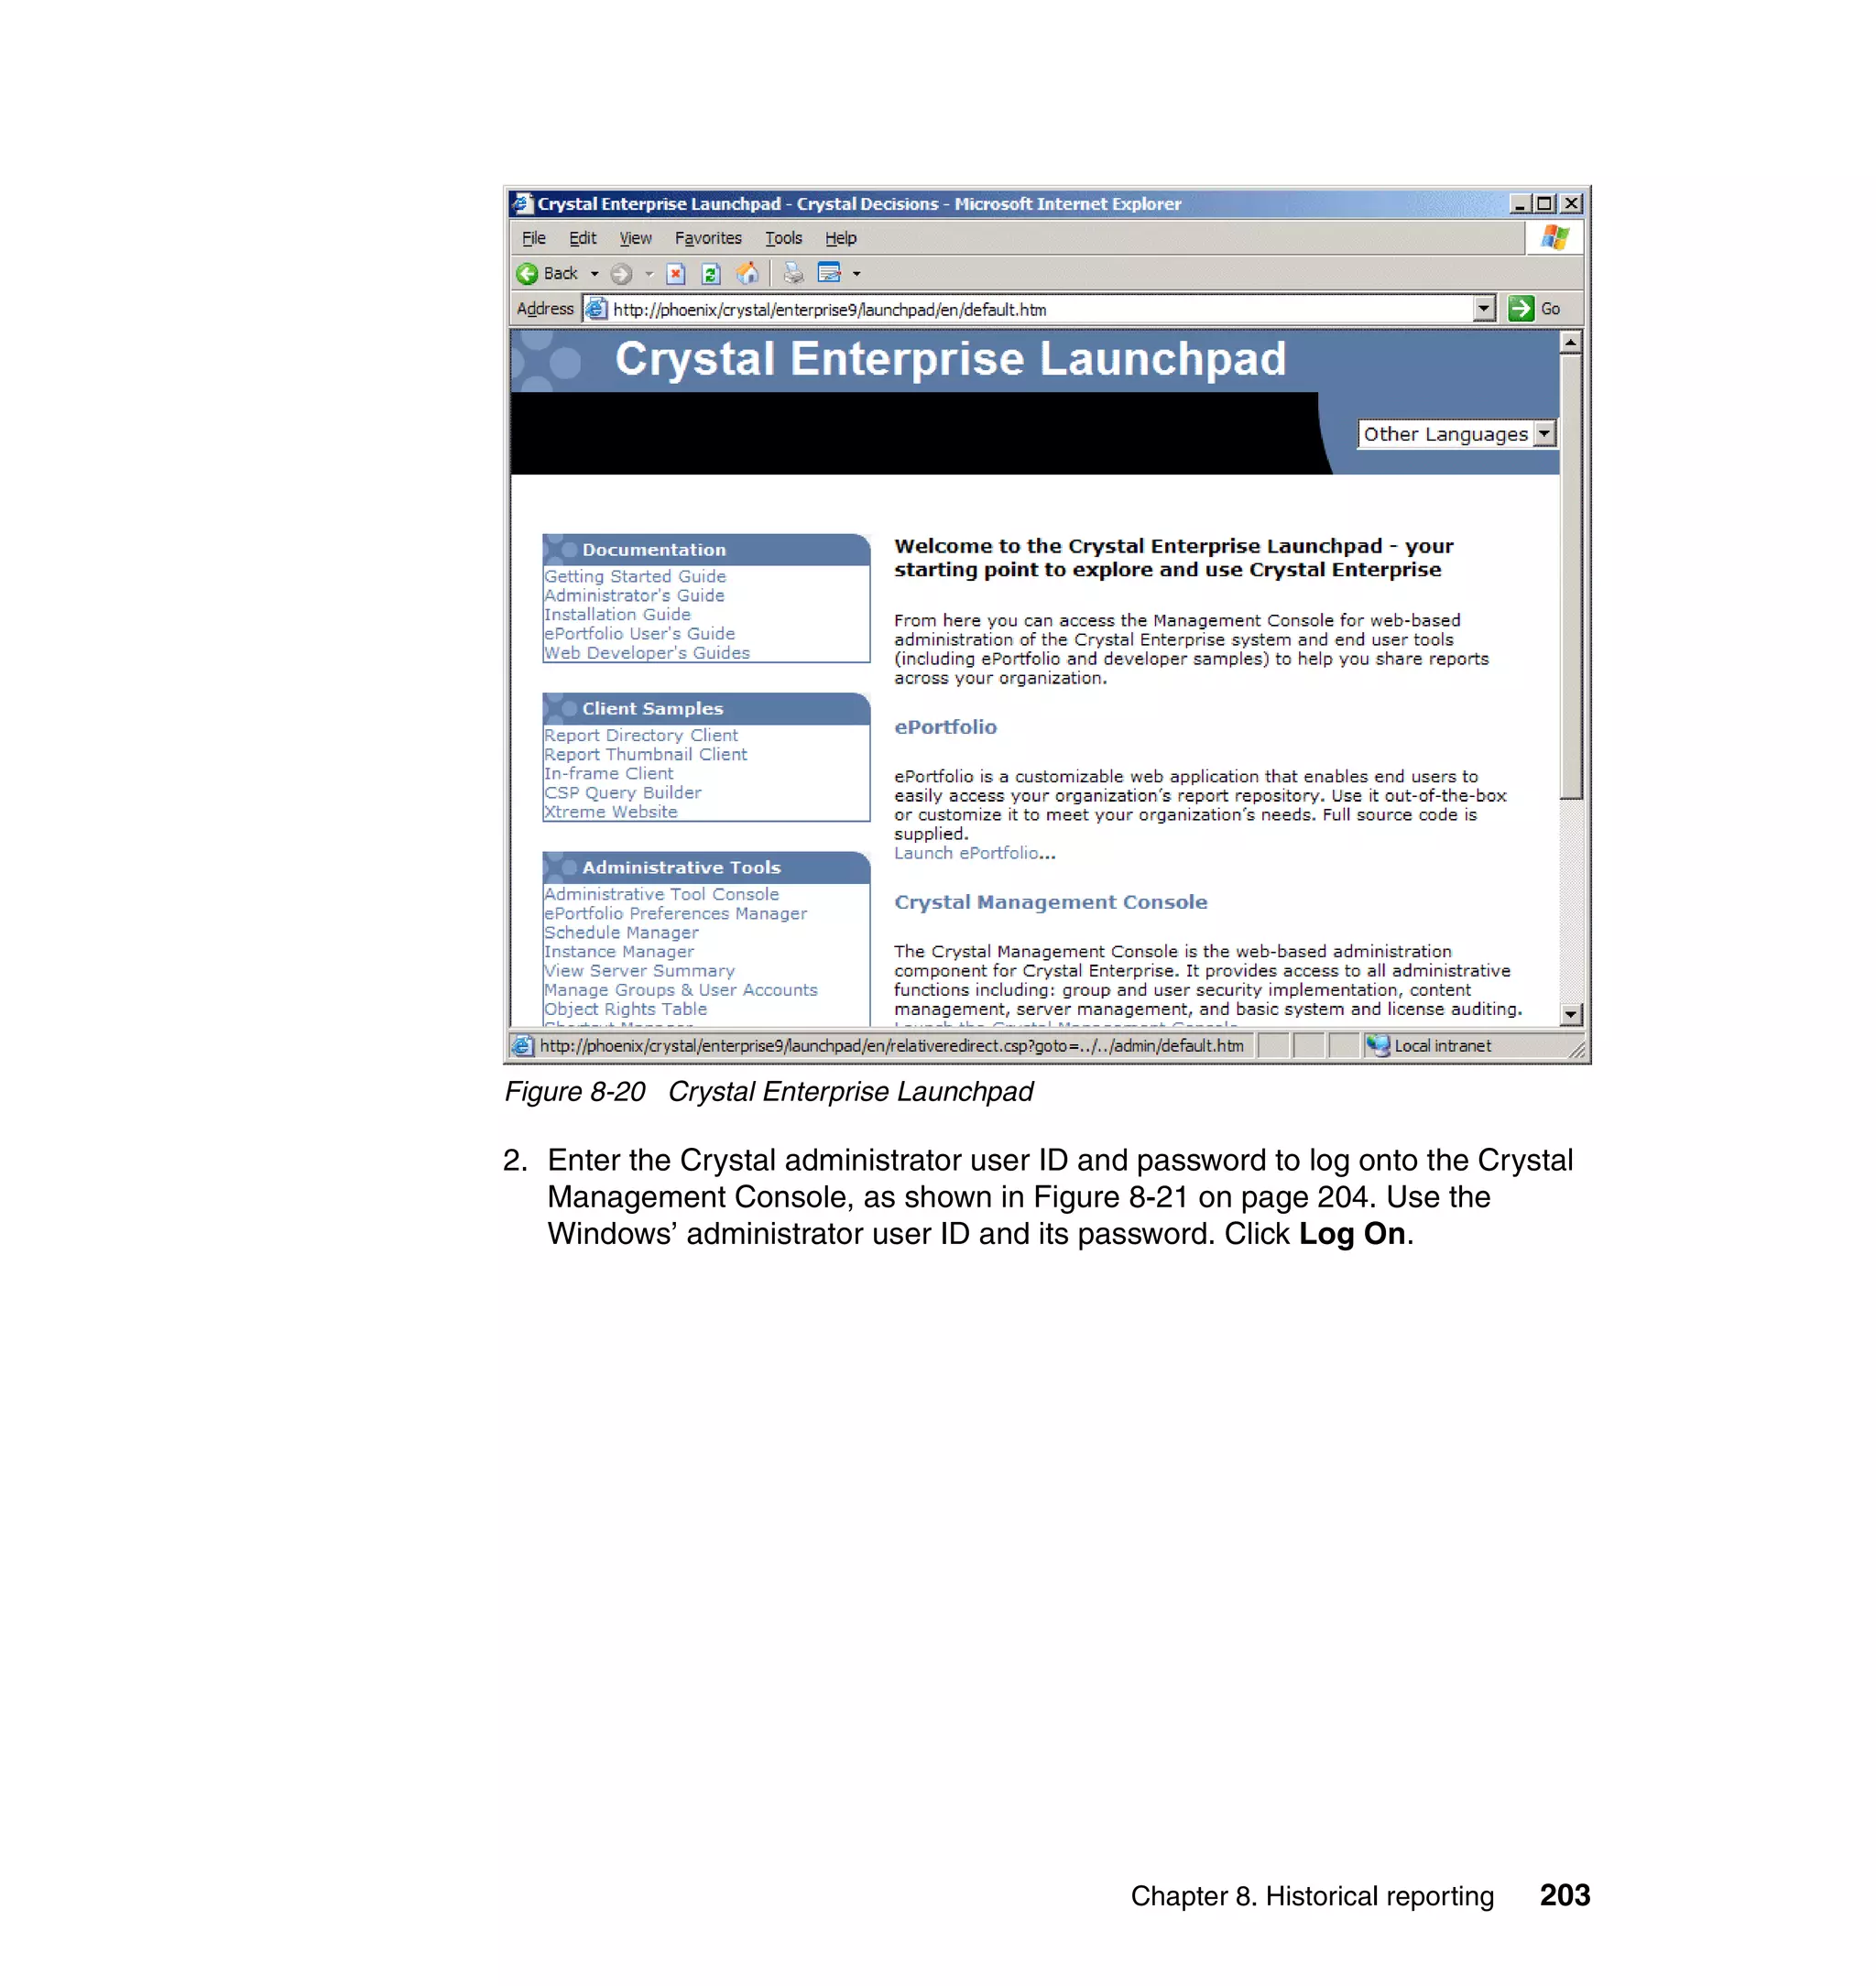
reception_action: invoke_Automation:
(
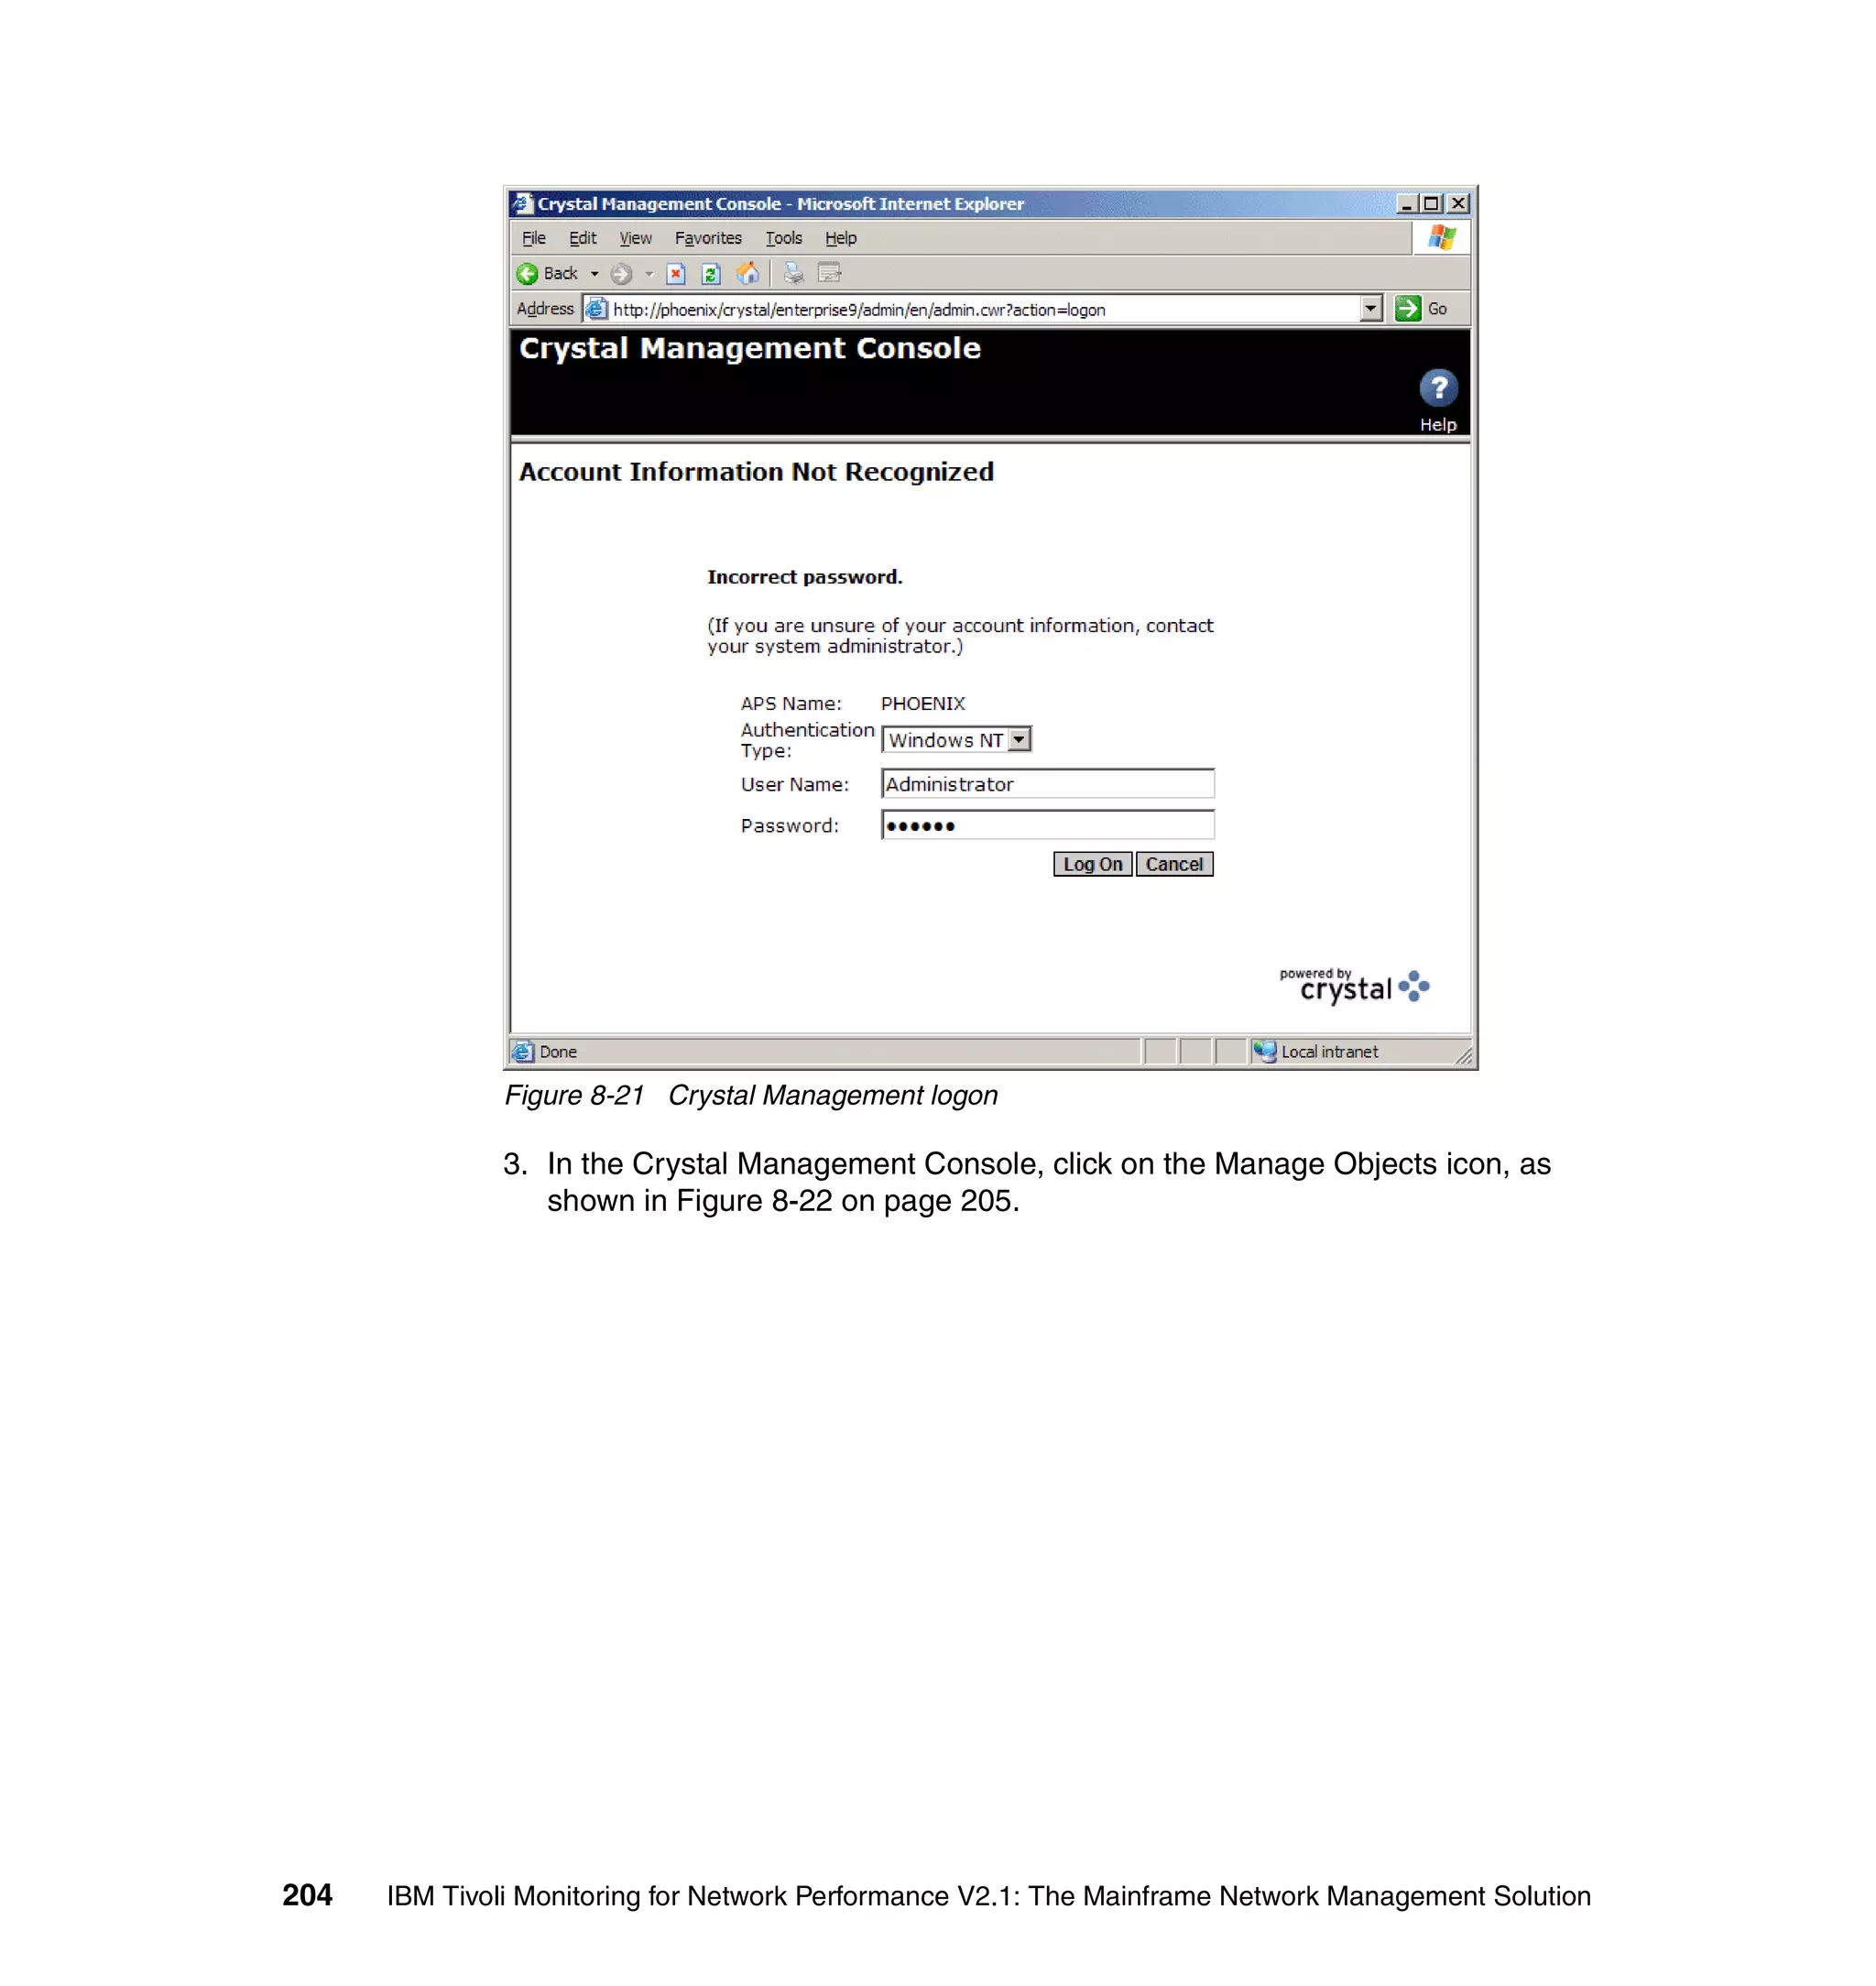
exec_program(_event, 'scripts/itmnp_tec.sh', '', [], 'YES'),
commit_set
)
reception_action: close_Threshold_event:
(
first_instance(event: _original_event of_class 'ITMNP_ThresholdExceeded'
where [ field_name: equals _field_name,
monitor_host: equals _monitor_host
] ),
set_event_status(_original_event, 'CLOSED'),
commit_set
)
).
This rule selects all IBM Tivoli Monitoring for Network Performance events and
executes the itmnp_tec.sh program.
The itmnp_tec.sh tool needs to parse and validate the event information and act
appropriately. Our sample script just parses the event and writes to an output file.
A real program needs to perform additional functions, such as sending e-mail or
a page to an operator. Our itmnp_tec.sh is shown in Example 7-5 on page 175.
174 IBM Tivoli Monitoring for Network Performance V2.1: The Mainframe Network Management Solution](https://image.slidesharecdn.com/ibmtivolimonitoringfornetworkperformancev2-1themainframenetworkmanagementsolutionsg246360-120524030008-phpapp02/75/Ibm-tivoli-monitoring-for-network-performance-v2-1-the-mainframe-network-management-solution-sg246360-190-2048.jpg)
![Example 7-5 The itmnp_tec.sh
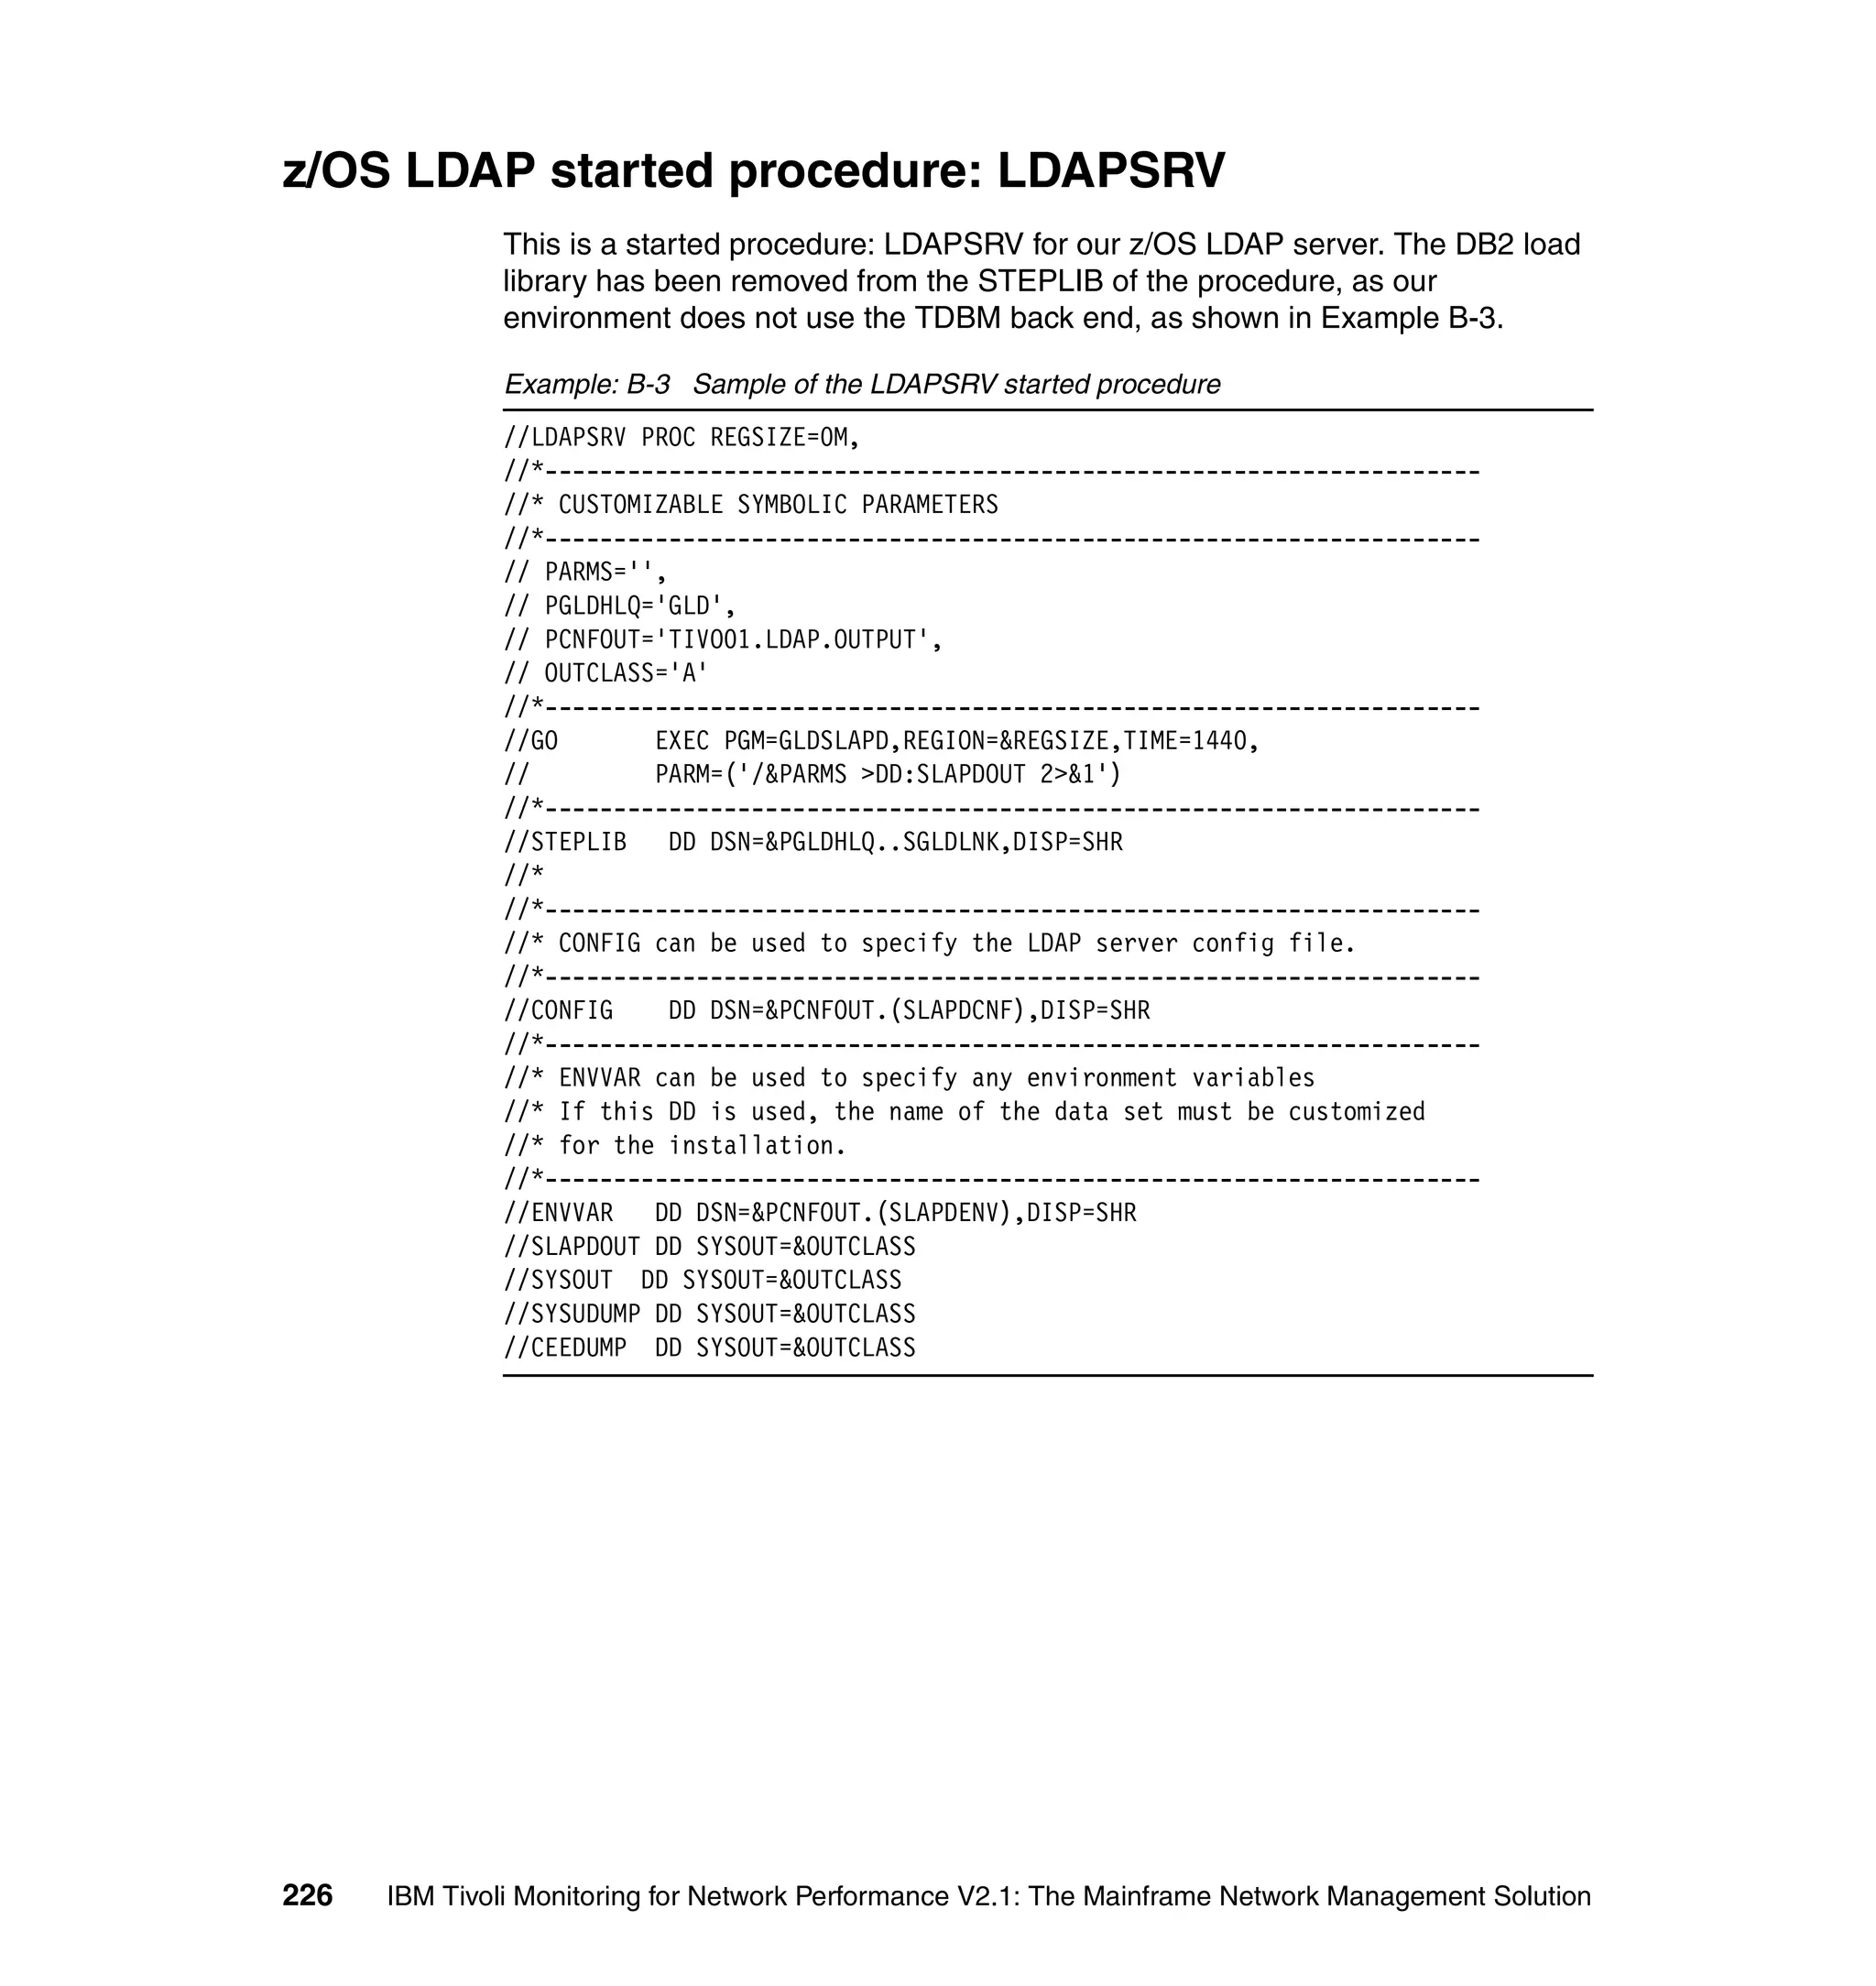
#!/bin/sh
LOGFILE=/tmp/itmnpevents.log
echo $EVENT_CLASS $date_reception $monitor_host $field_name $field_value >>
$LOGFILE
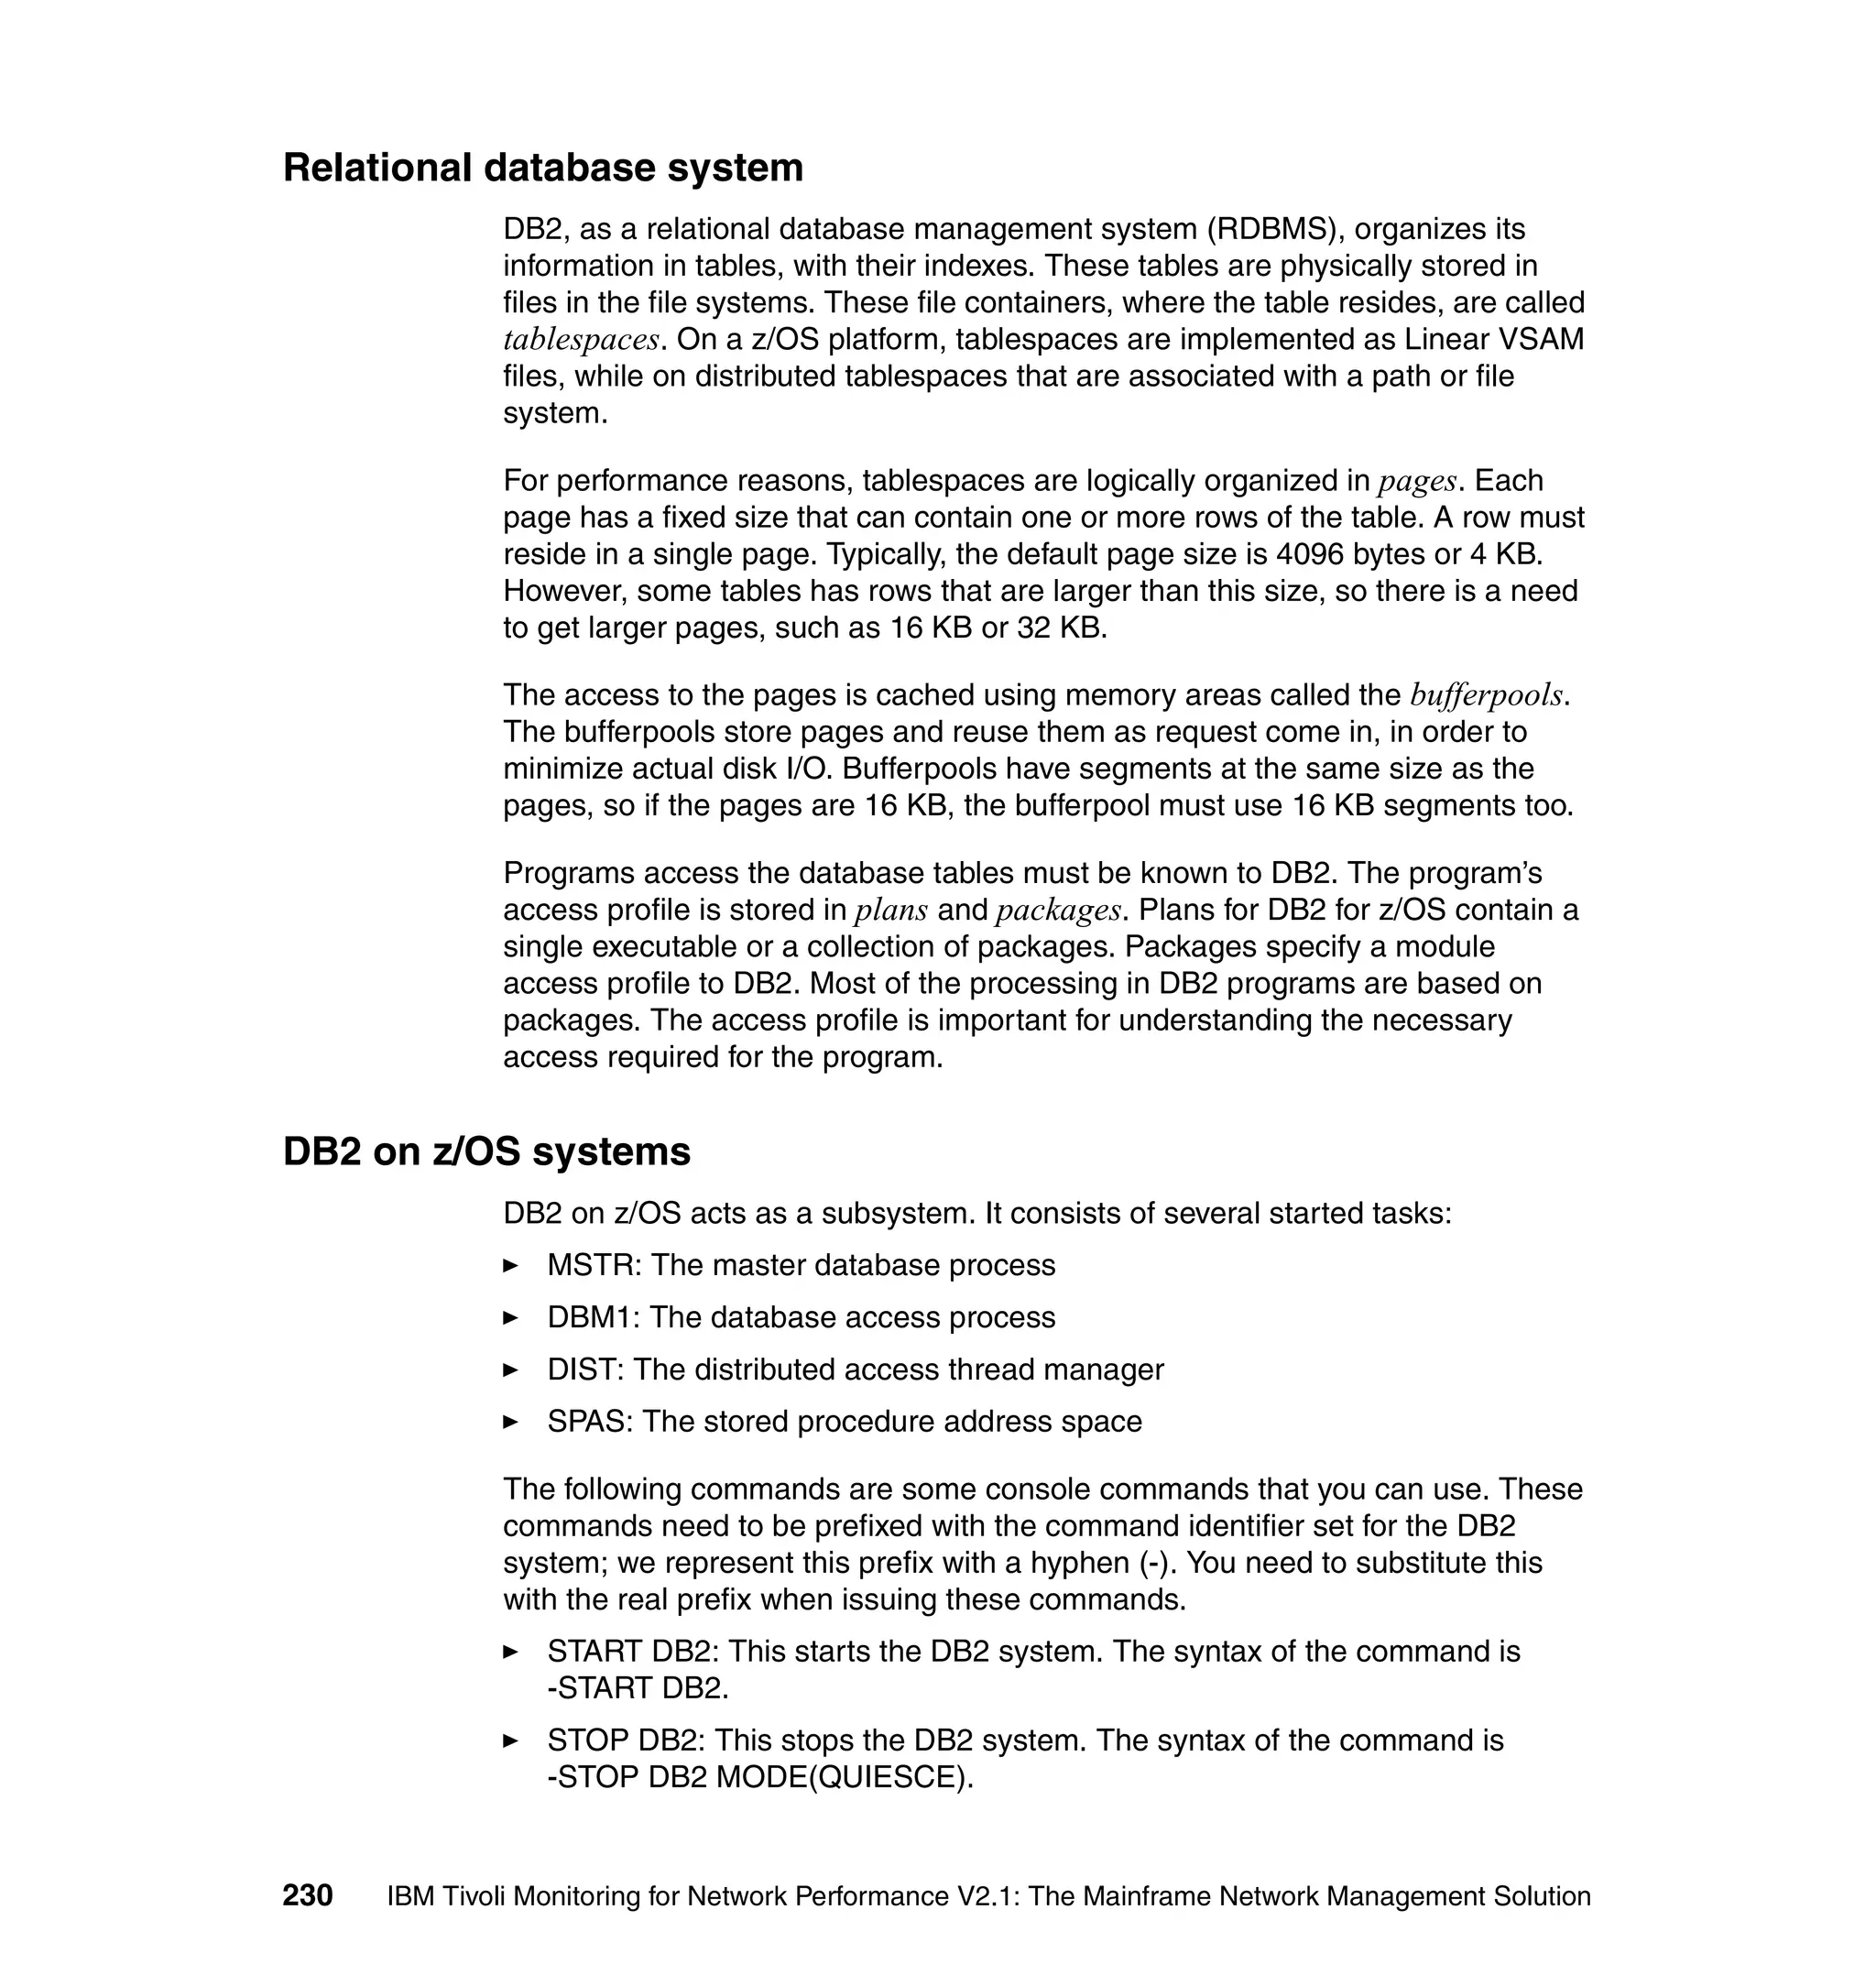
# if you want to send this to TBSM based on the measurement
# assuming all event goes to ITMNP 2.1 object class
# $TEC_BIN_DIR/../../TDS/EventService/ihstttec -b "ITMNP;2.1"
# -i "$monitor_host" -p "$field_name" -s "$severity" -o 20
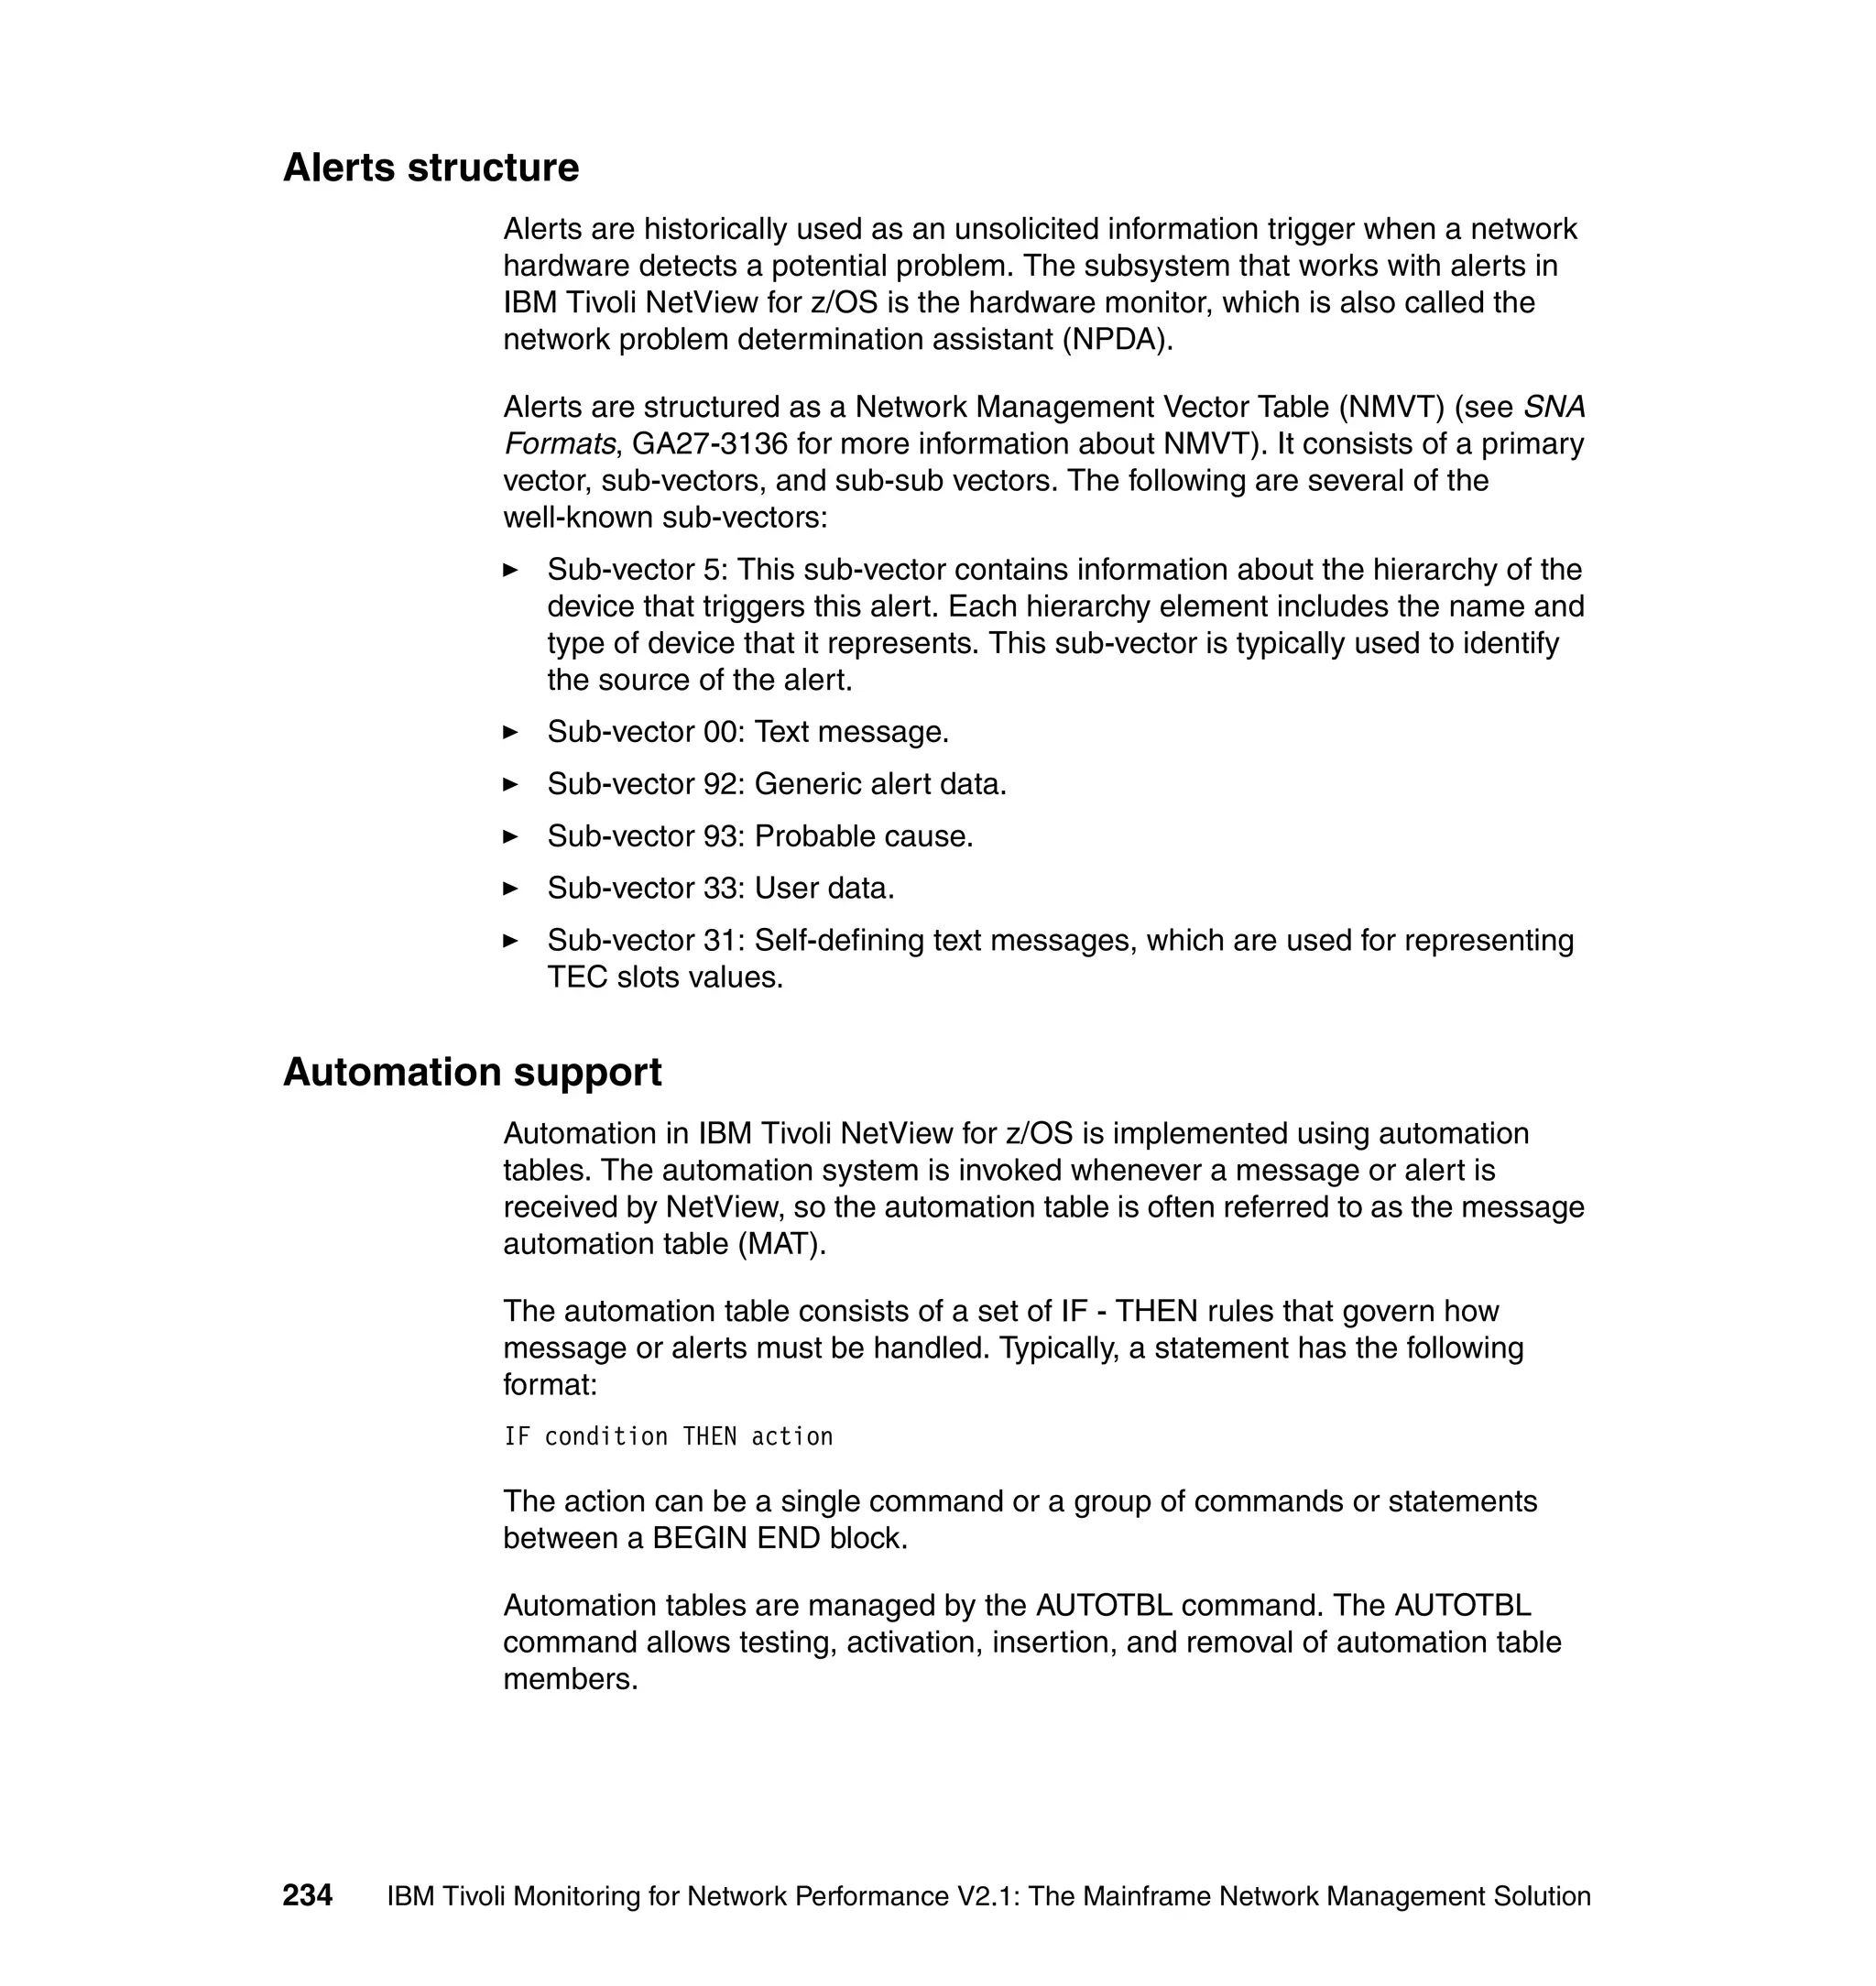
# -1 "$field_value" -t "EXCEPTION" -q "$origin" -m "$msg"
#######################################
# event specific processing goes here
if [ "$EVENT_CLASS" = "ITMNP_ThresholdExceeded" ];
then
# Here are processing specific to Threshold tripped event
$TEC_BIN_DIR/bin/TEC_Send_Mail.sh "ITMNP-TEC interface" tec_itmnp "$msg"
else
# Here are processing specific to Rearmed events
fi
7.3 Event integration with IBM Tivoli NetView for z/OS
To alert an operator about performance issues and threshold value violations,
rearm condition events have to be set in IBM Tivoli Monitoring for Network
Performance. These generated events can then be sent to IBM Tivoli NetView
for z/OS. IBM Tivoli NetView for z/OS must be configured to receive these events
using the event-to-alert conversion facility of the Event Automation Service
(EAS).
This discussion is similar to 7.2, “Event integration with IBM Tivoli Enterprise
Console” on page 164. It consists of the following topics:
7.3.1, “Setting up Event Automation Service” on page 176
7.3.2, “Defining threshold and event generation” on page 177
7.3.3, “Automating NetView alert” on page 181
Chapter 7. Discovery and alert interfaces 175](https://image.slidesharecdn.com/ibmtivolimonitoringfornetworkperformancev2-1themainframenetworkmanagementsolutionsg246360-120524030008-phpapp02/75/Ibm-tivoli-monitoring-for-network-performance-v2-1-the-mainframe-network-management-solution-sg246360-191-2048.jpg)
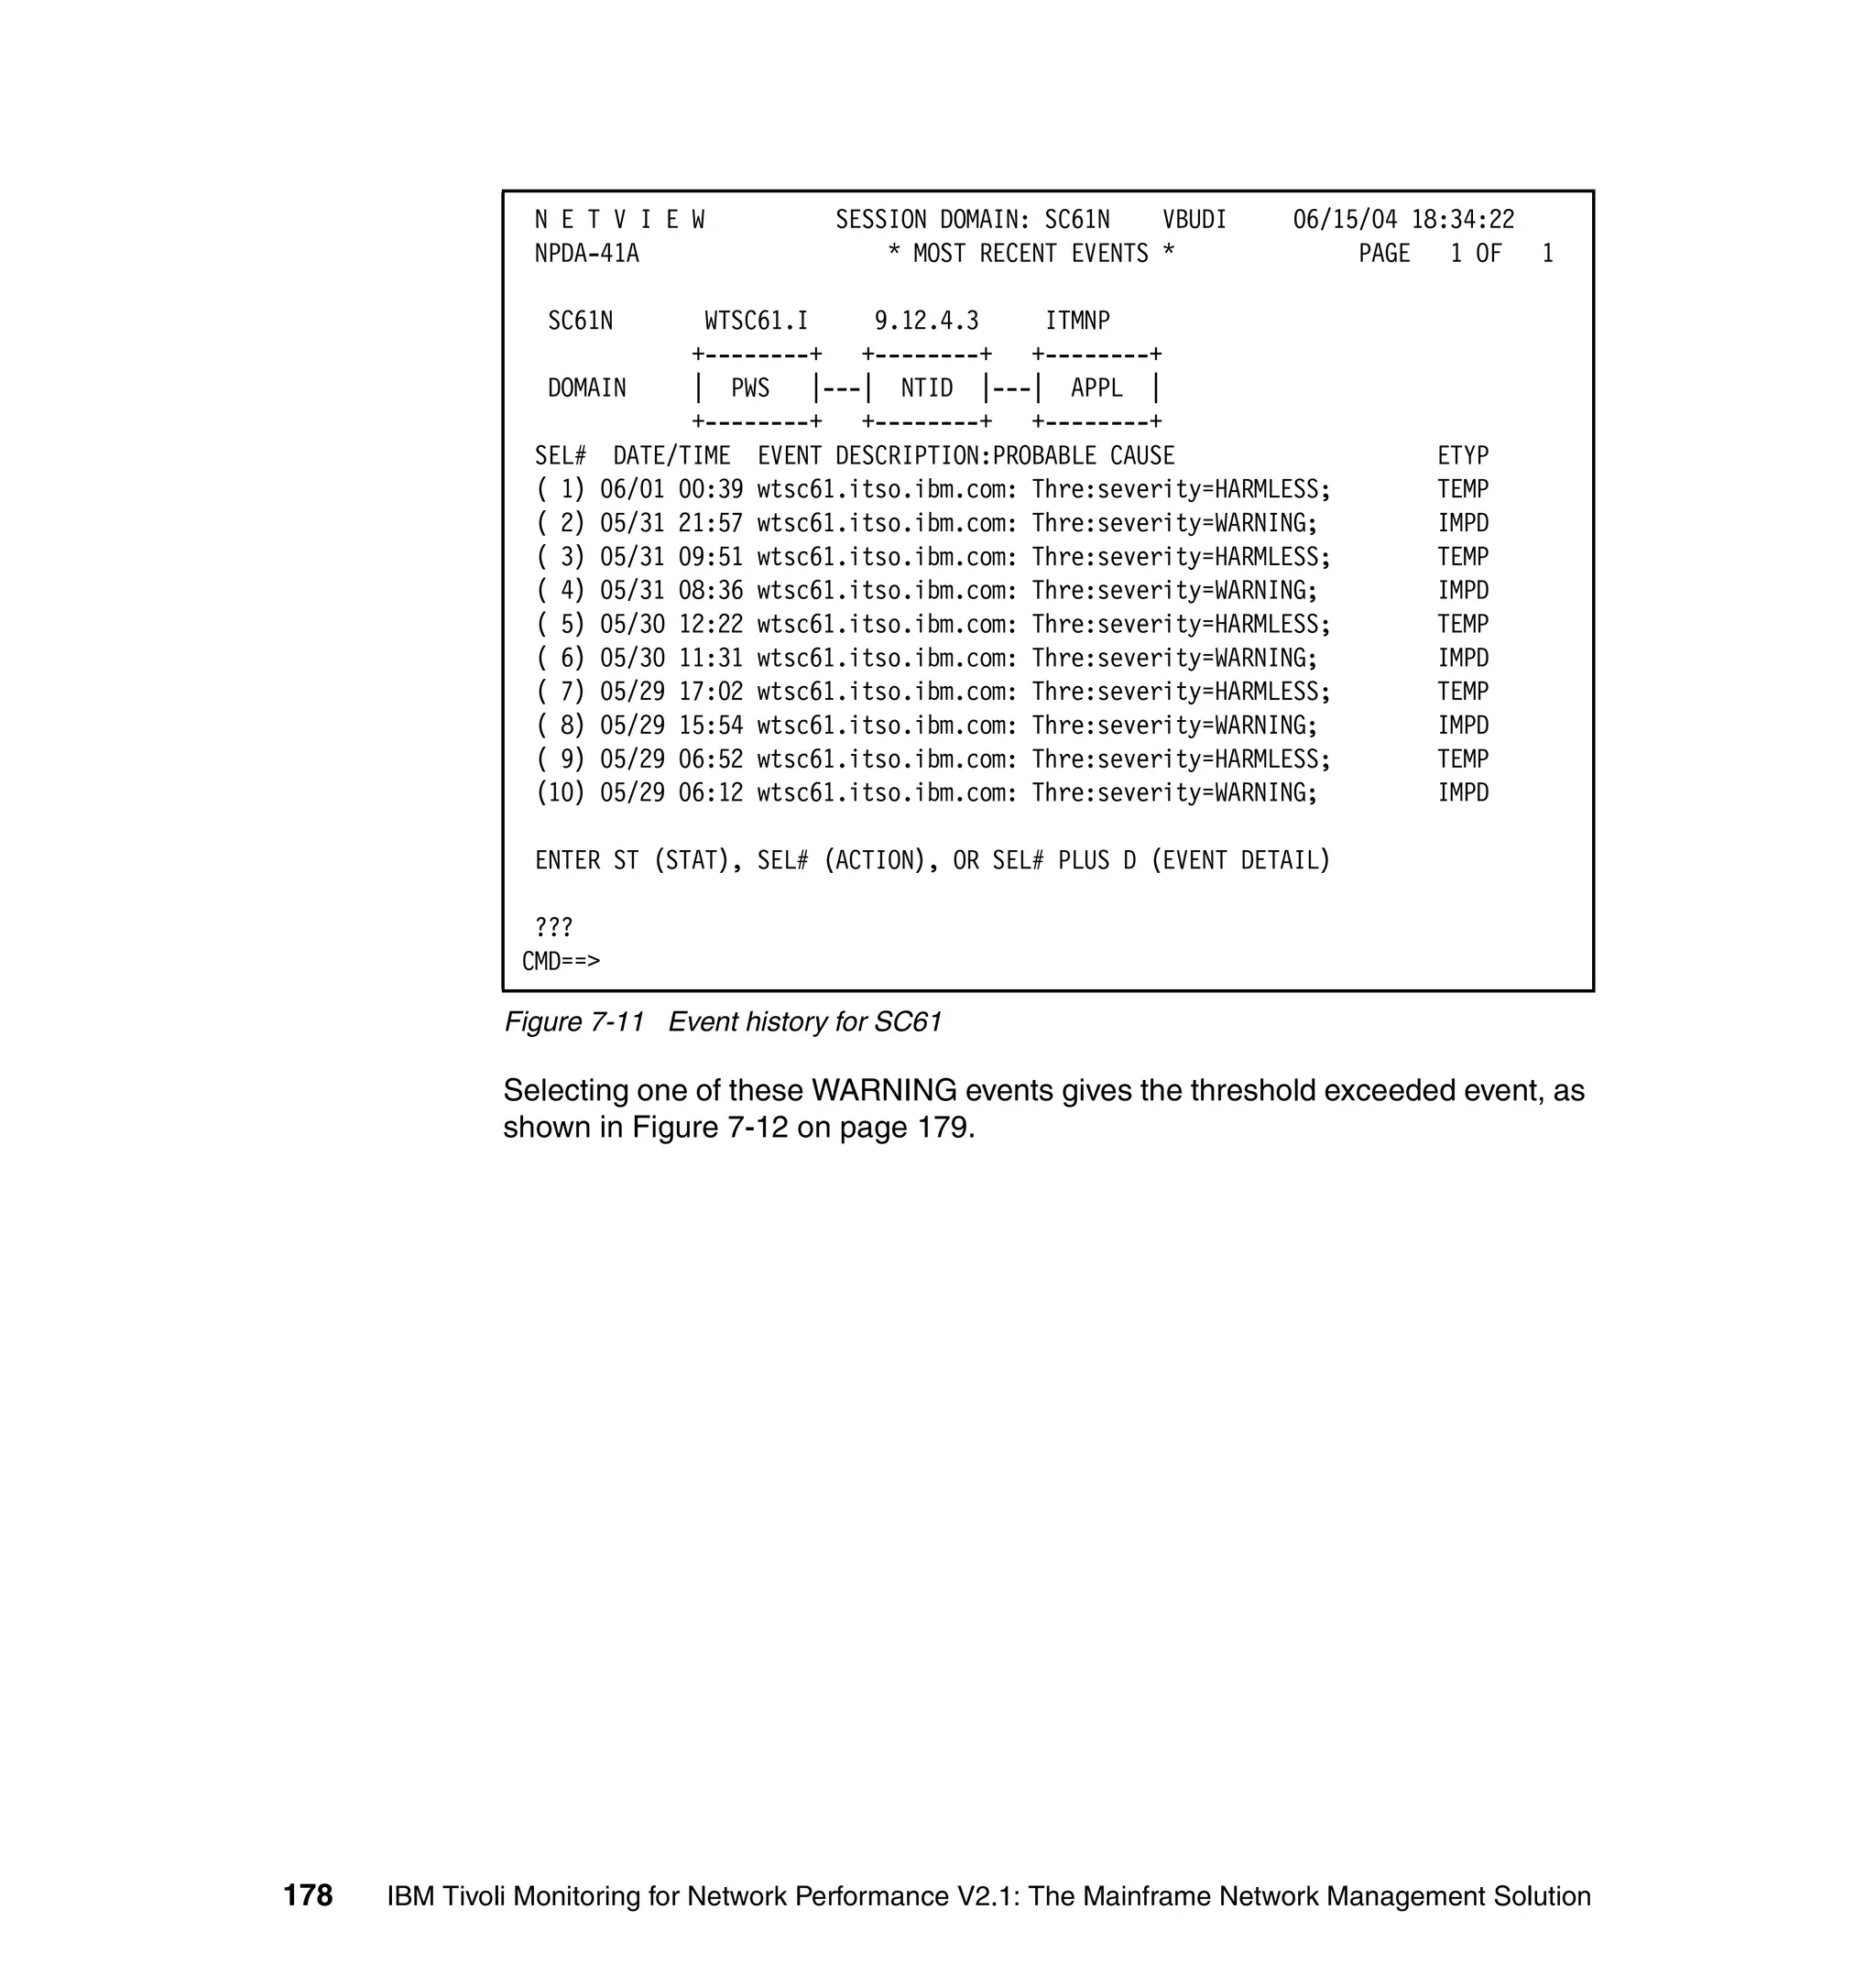
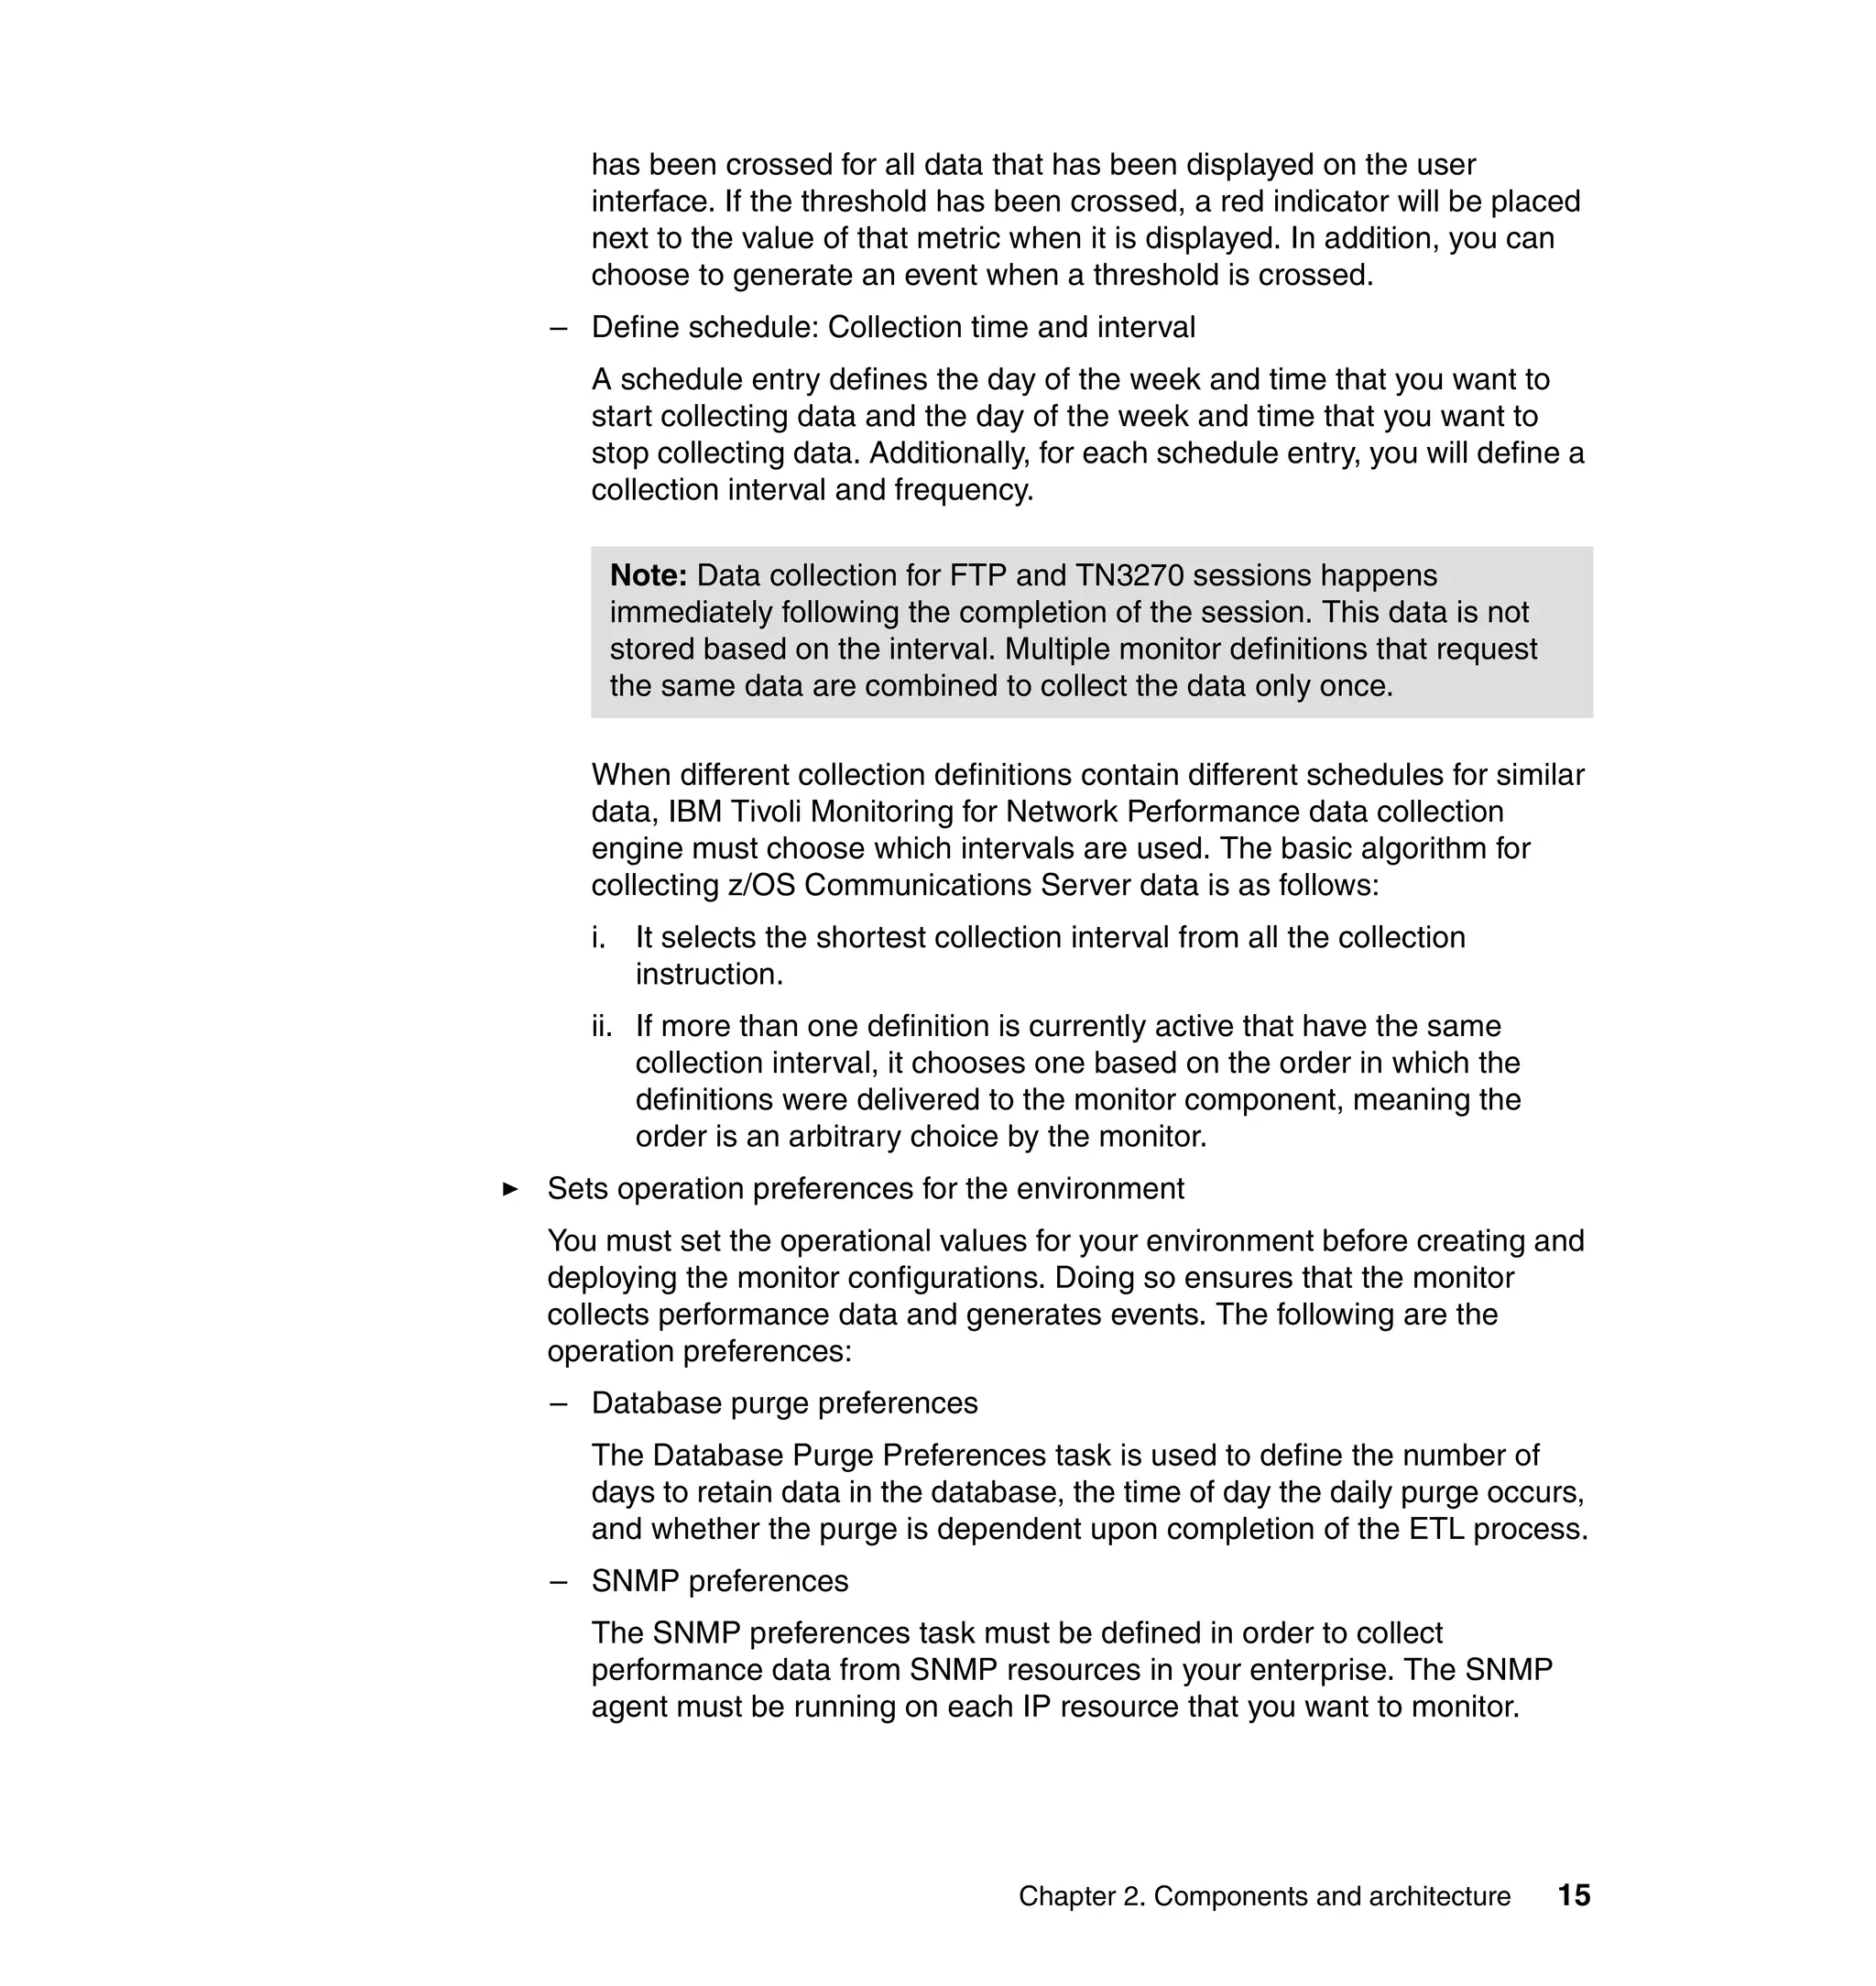
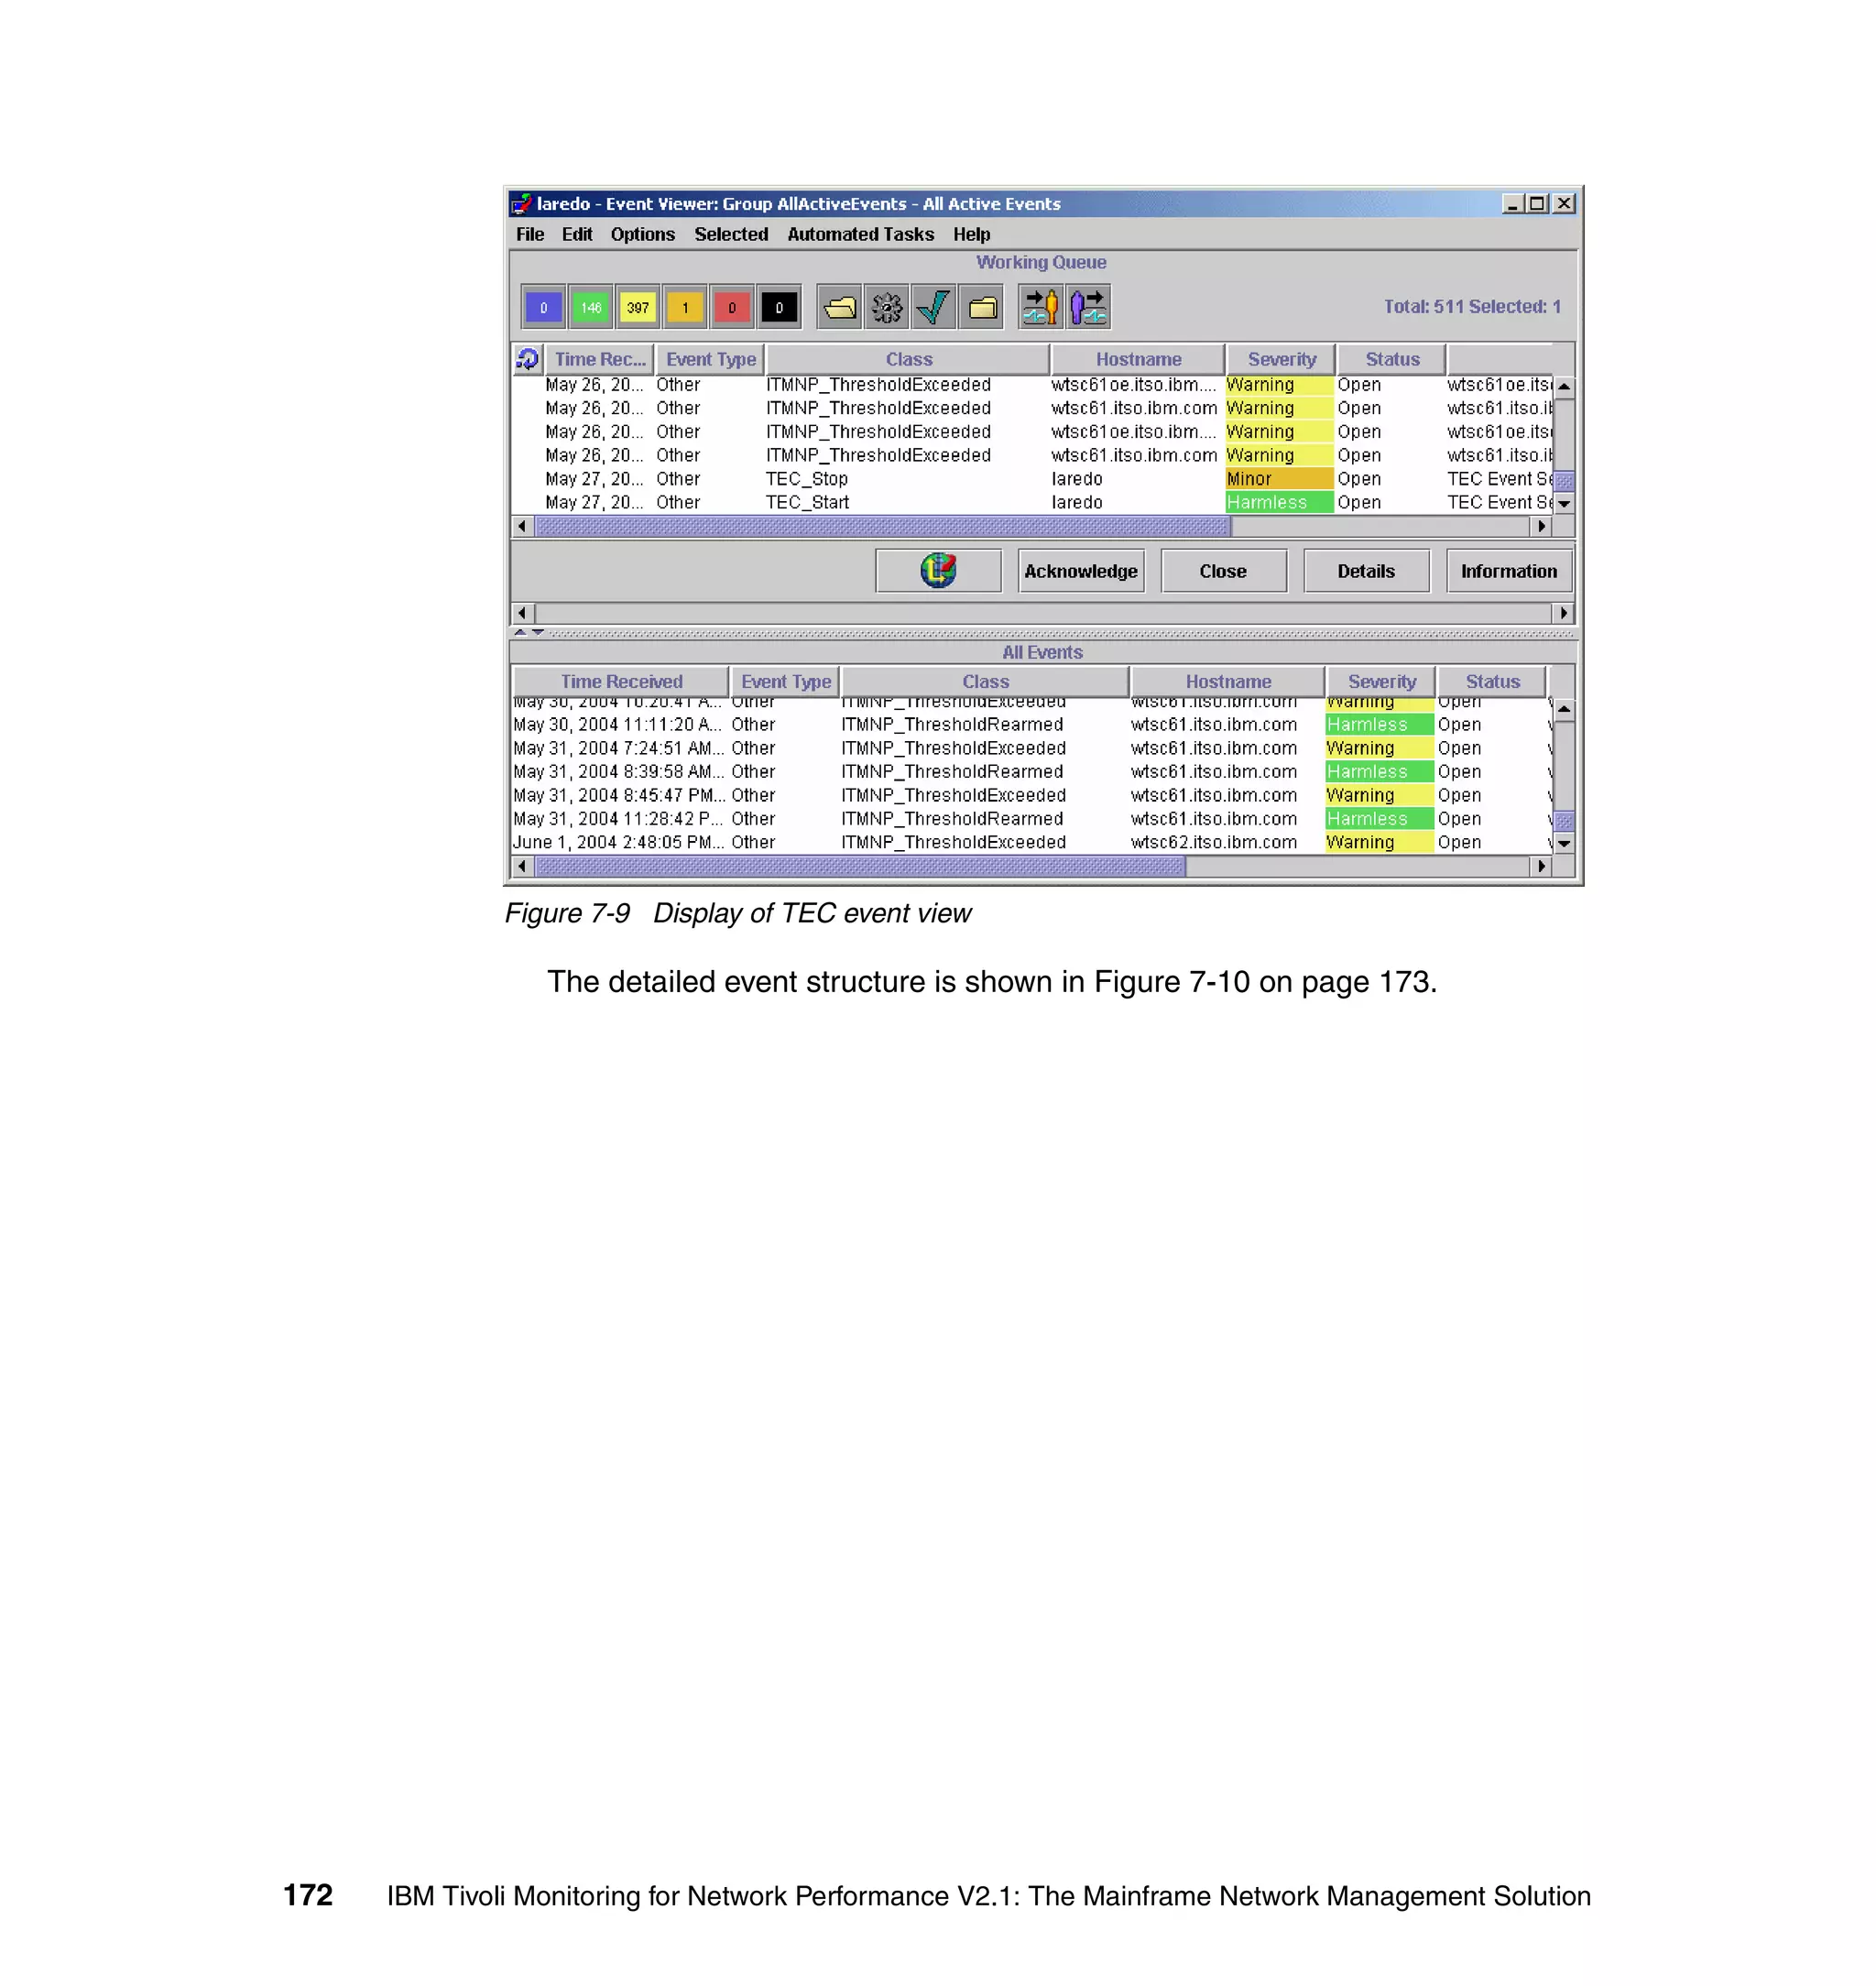
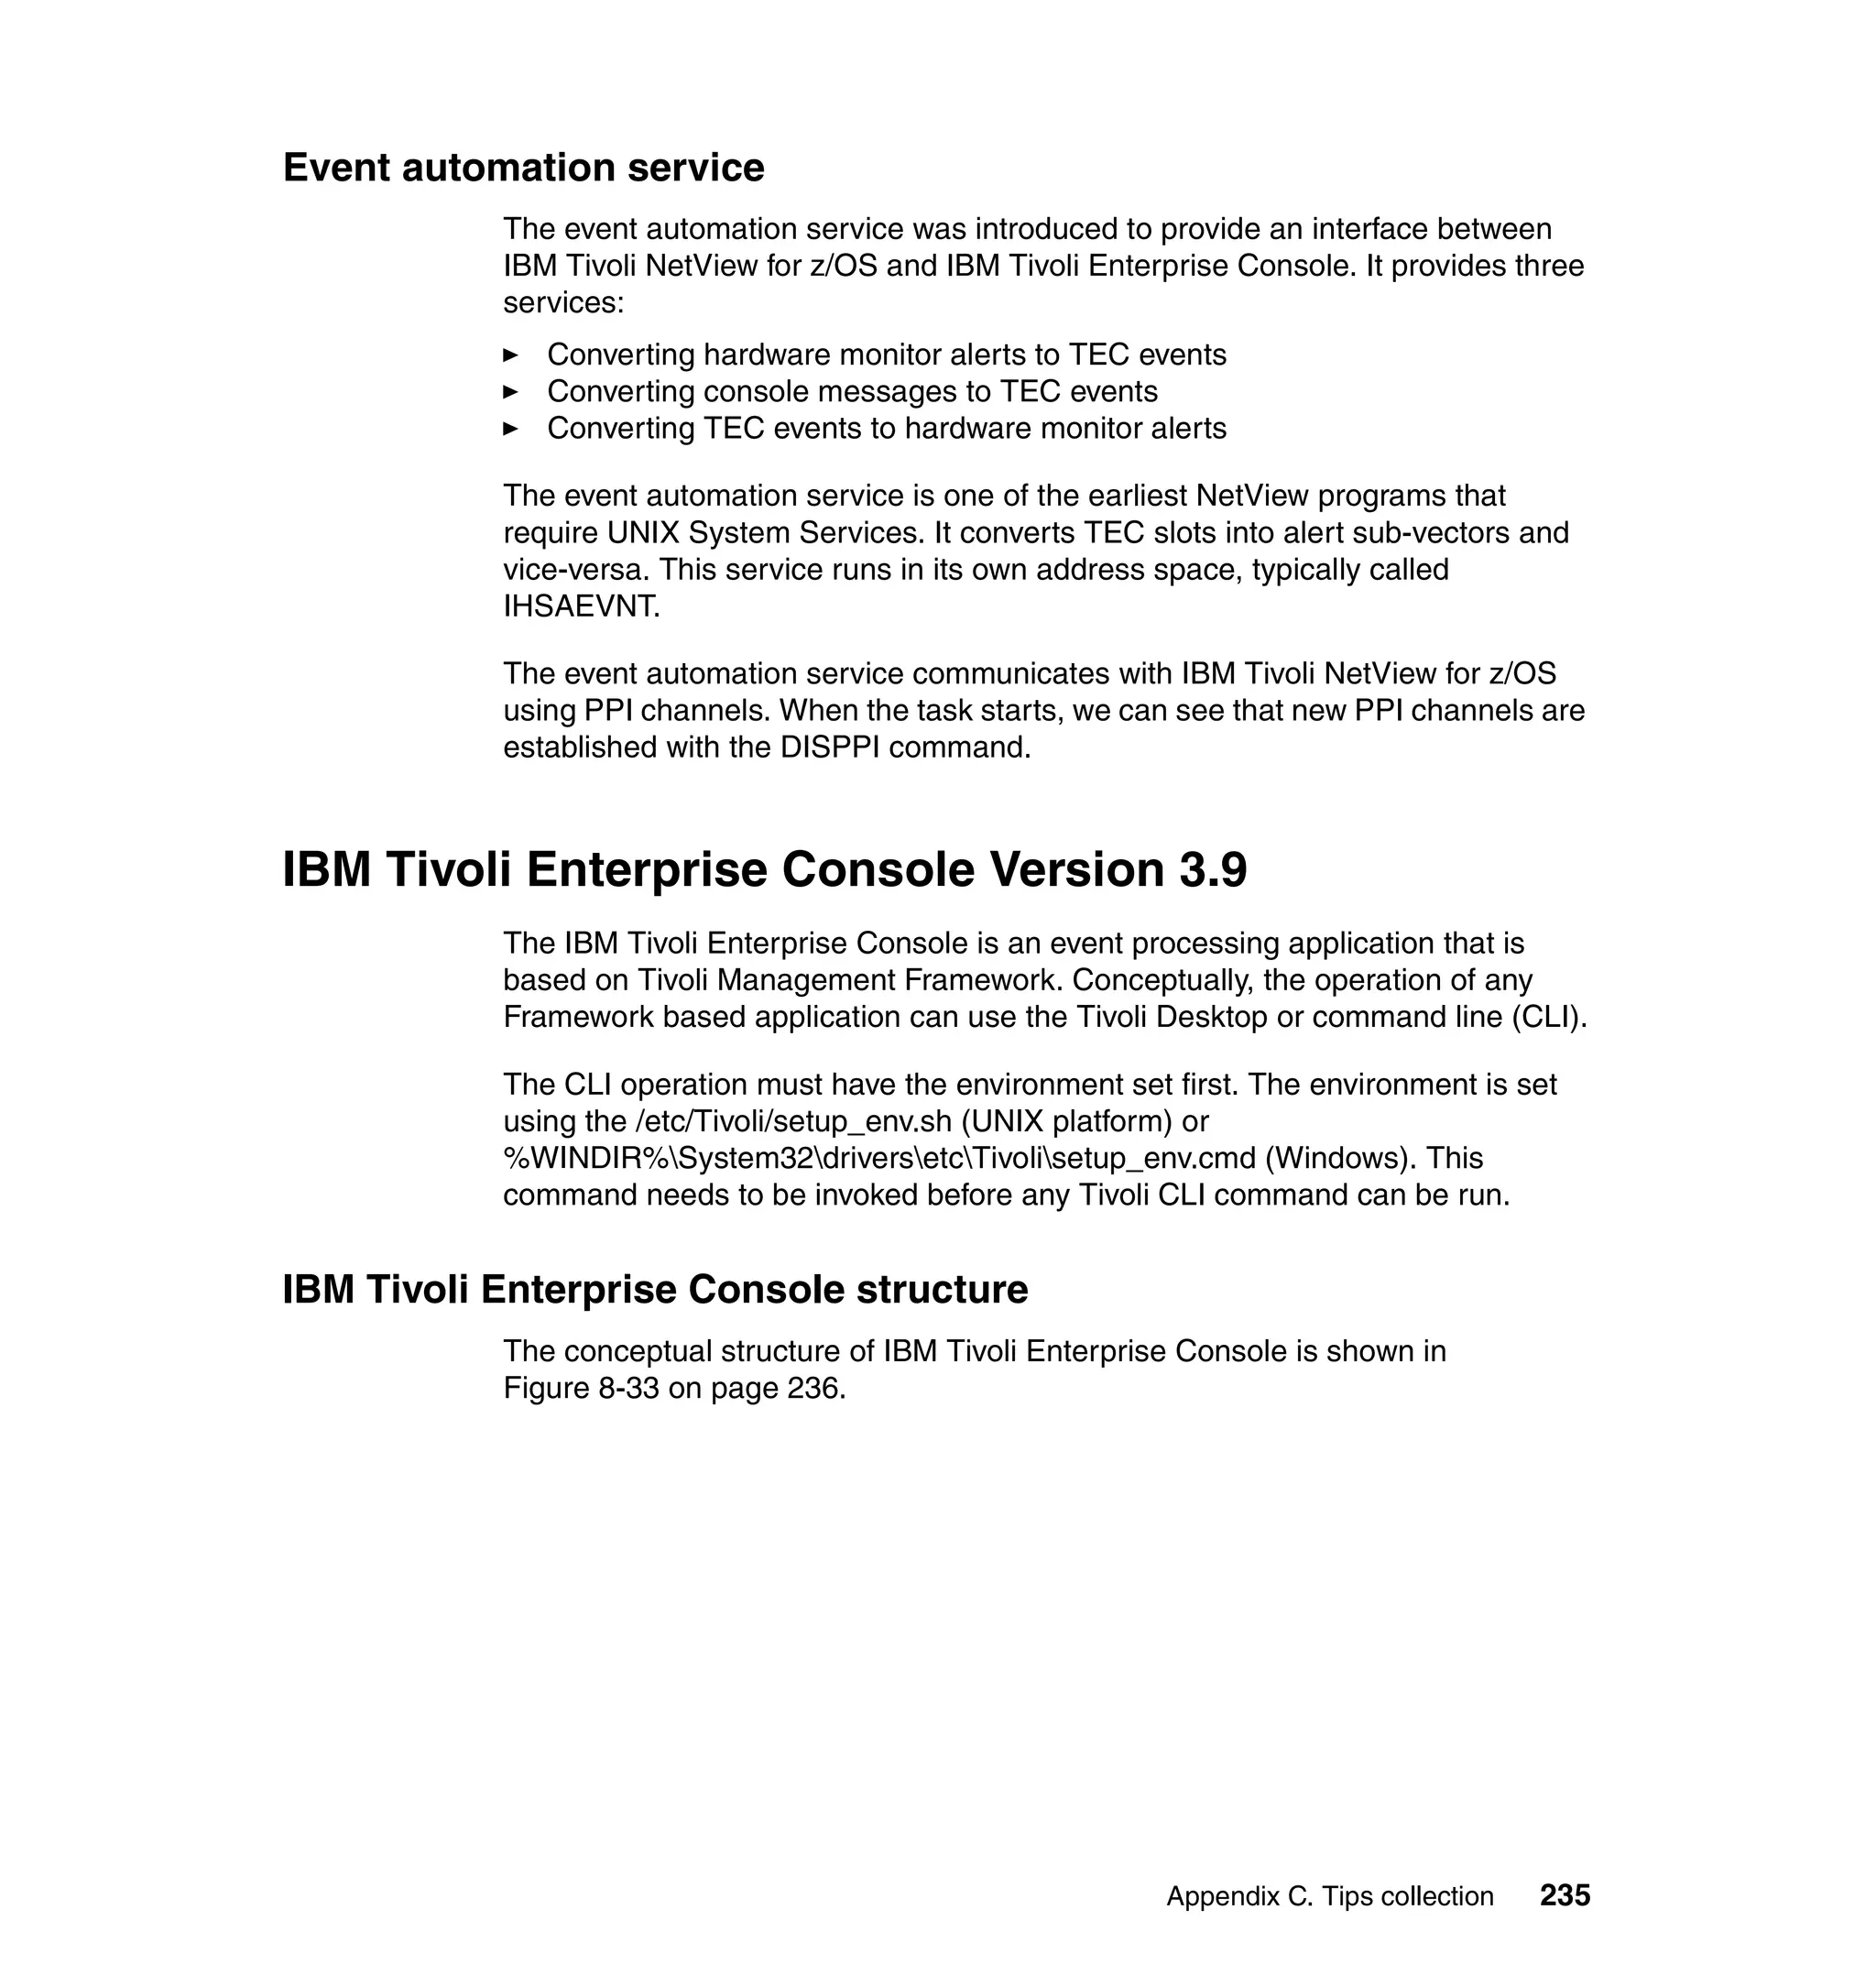
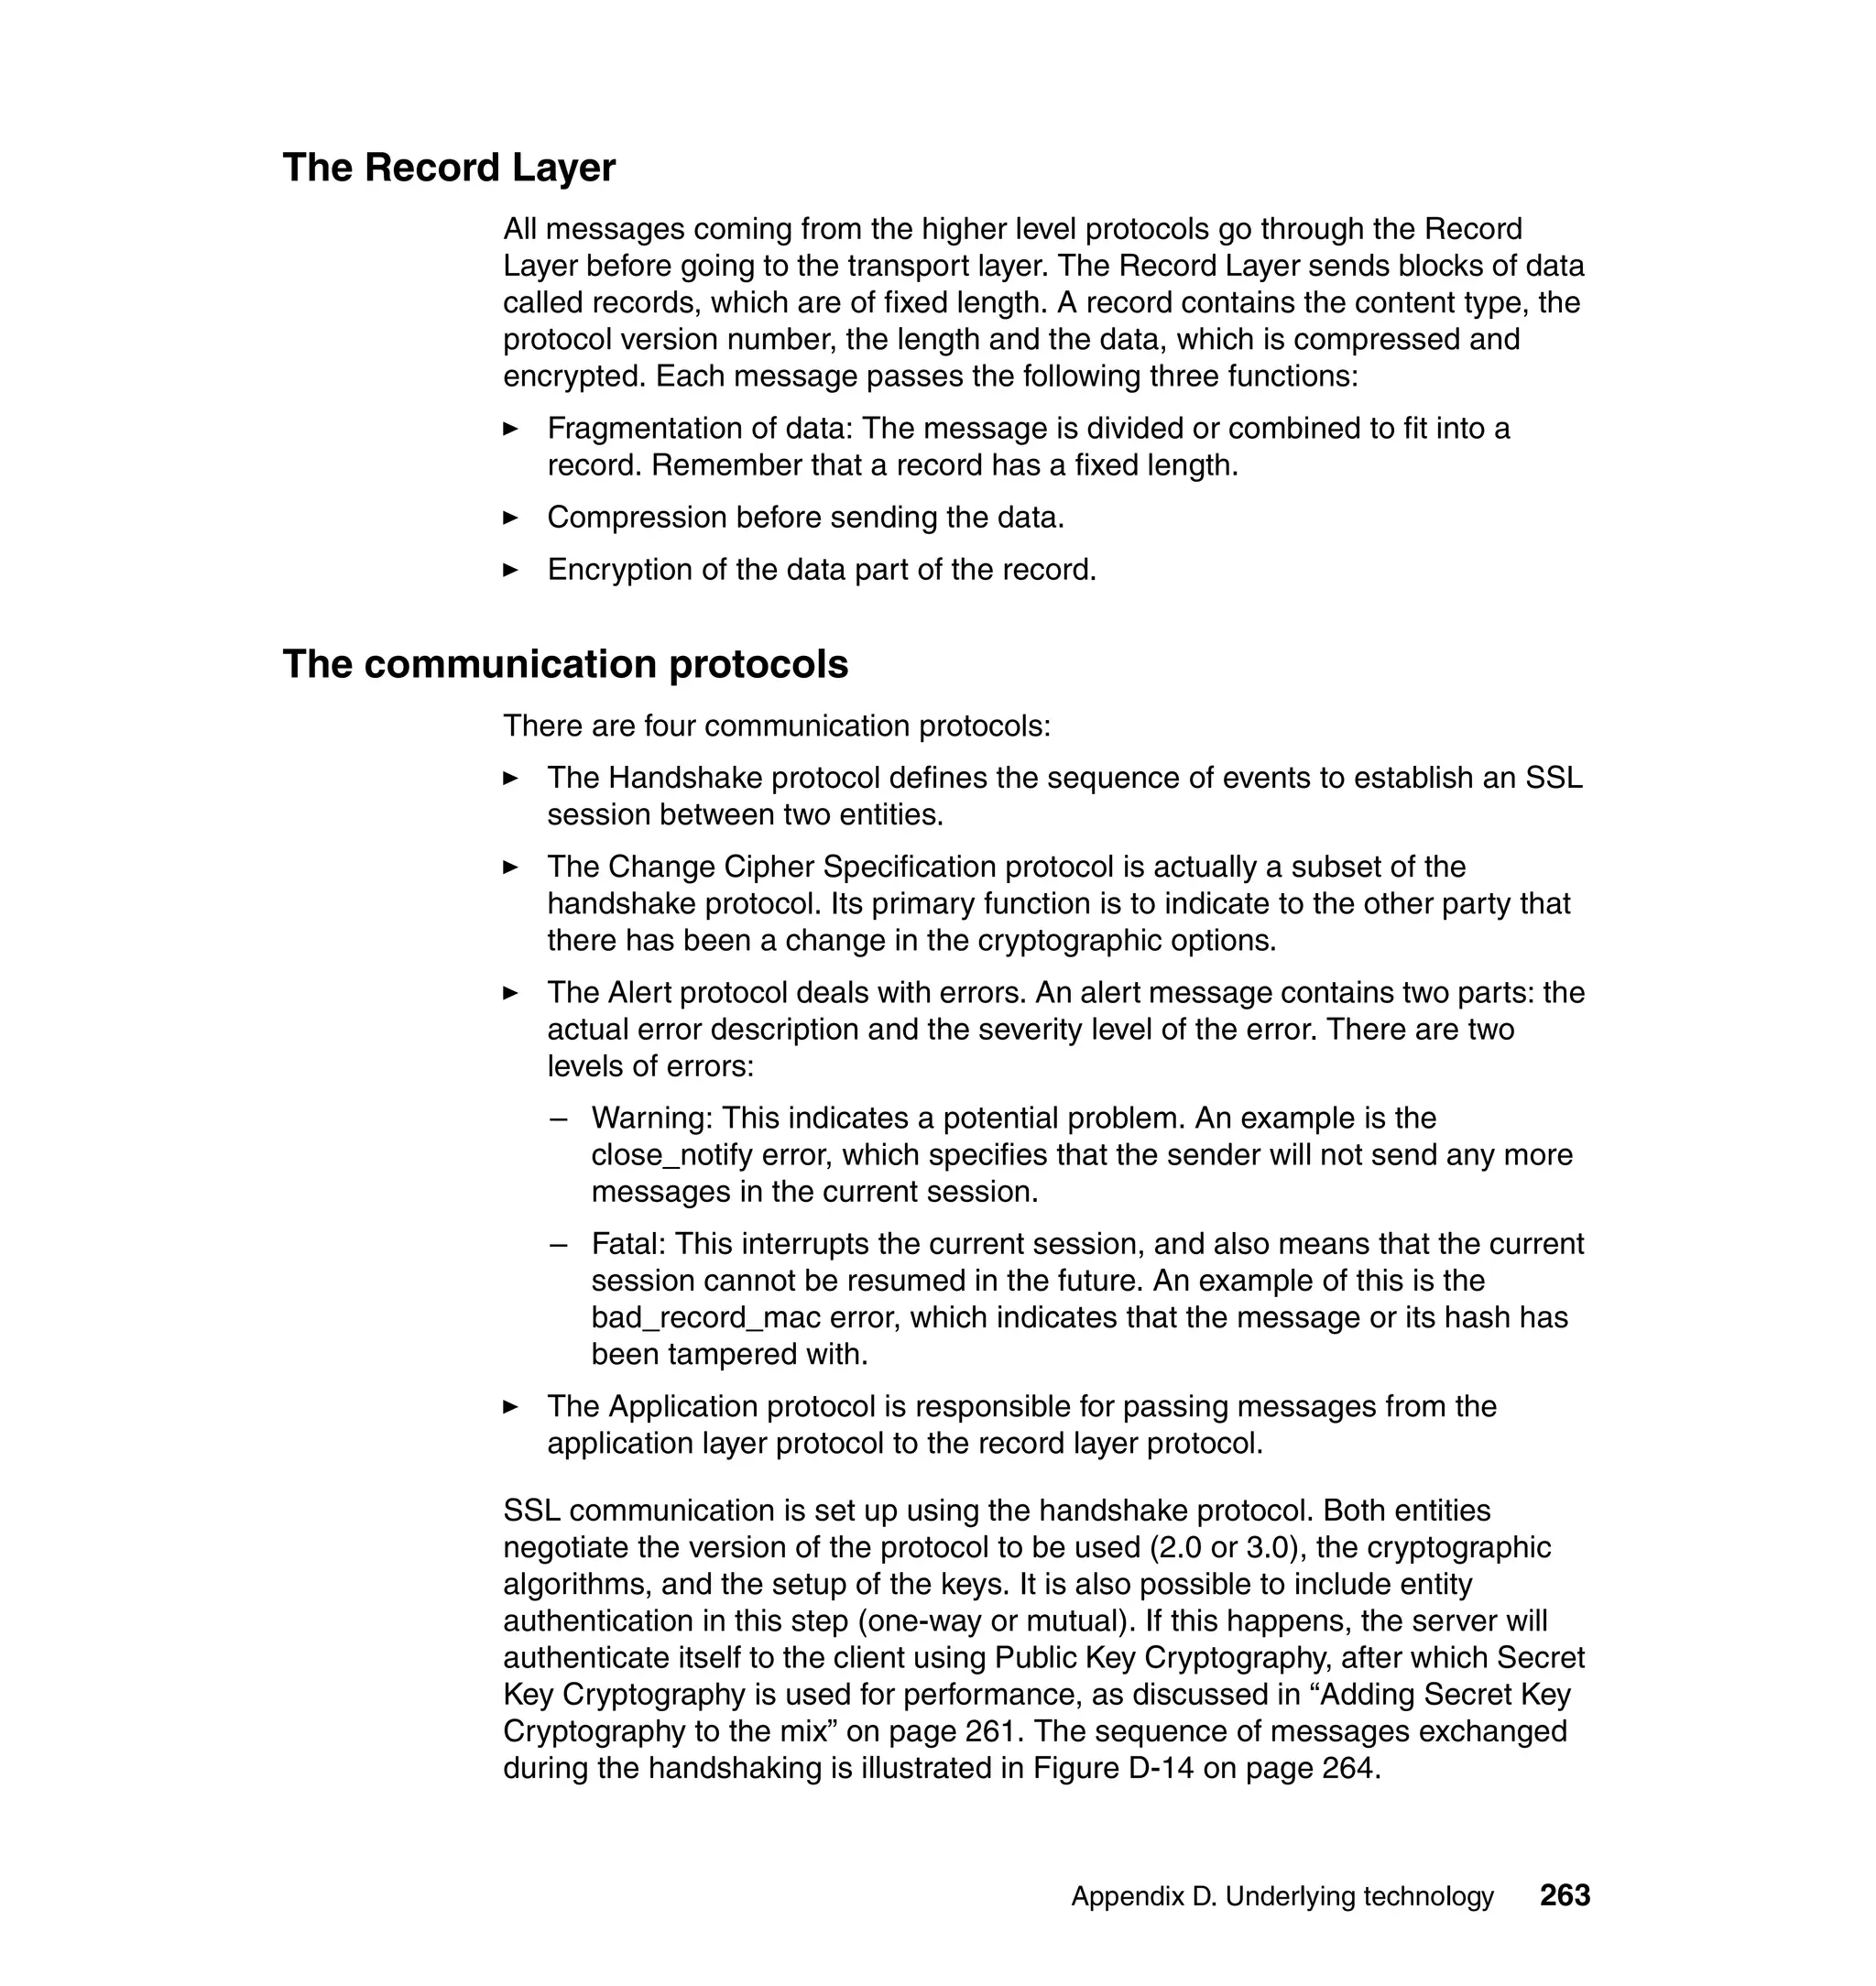
![N E T V I E W SESSION DOMAIN: SC61N VBUDI 06/15/04 18:37:56
NPDA-43S * EVENT DETAIL * PAGE 1 OF 2
SC61N WTSC61.I 9.12.4.3 ITMNP
+--------+ +--------+ +--------+
DOMAIN | PWS |---| NTID |---| APPL |
+--------+ +--------+ +--------+
HIERARCHY NAMES LIST:
PWS wtsc61.itso.ibm.com
NTID 9.12.4.32
APPL ITMNP
DATE/TIME: RECORDED - 05/31 21:57
EVENT TYPE: IMPENDING PROBLEM
DESCRIPTION: wtsc61.itso.ibm.com: Threshold tripped [
PROBABLE CAUSES:
severity=WARNING;
ORIGINAL T/EC EVENT:
ITMNP_ThresholdExceeded;
monitor_host=wtsc61.itso.ibm.com;
source=ITMNP;
msg=wtsc61.itso.ibm.com: Threshold tripped
[TCP_CONN_AVL_MSMT.PERC_SEG_RETRANS = 3.252033 (> 3)];
field_name=TCP_CONN_AVL_MSMT.PERC_SEG_RETRANS;
msmt_details=Category=null;LOCAL_NODE_IP='9.12.4.33';REMOTE_PORT=3628;RETRA
NS_RT=0.001674;RESP_TM_VAR=38;RETRANS_SEGS=4;START_TM='2004-05-27-03.29.46.
000000';REMOTE_NODE_IP='9.155.177.145';REM_WINDOW_CNT=0;APP_JOB_NM='DFSKERN
';LAST_ACTIV
msmt_id=c8b49449090c0420000000fcd9417732;
timestamp=2004-05-30 23:43:42.0;
adapter_host=wtsc61;
hostname=wtsc61.itso.ibm.com;
ENTER A (ACTION) OR DM (DETAIL MENU)
???
CMD==>
Figure 7-12 Threshold exceeded event
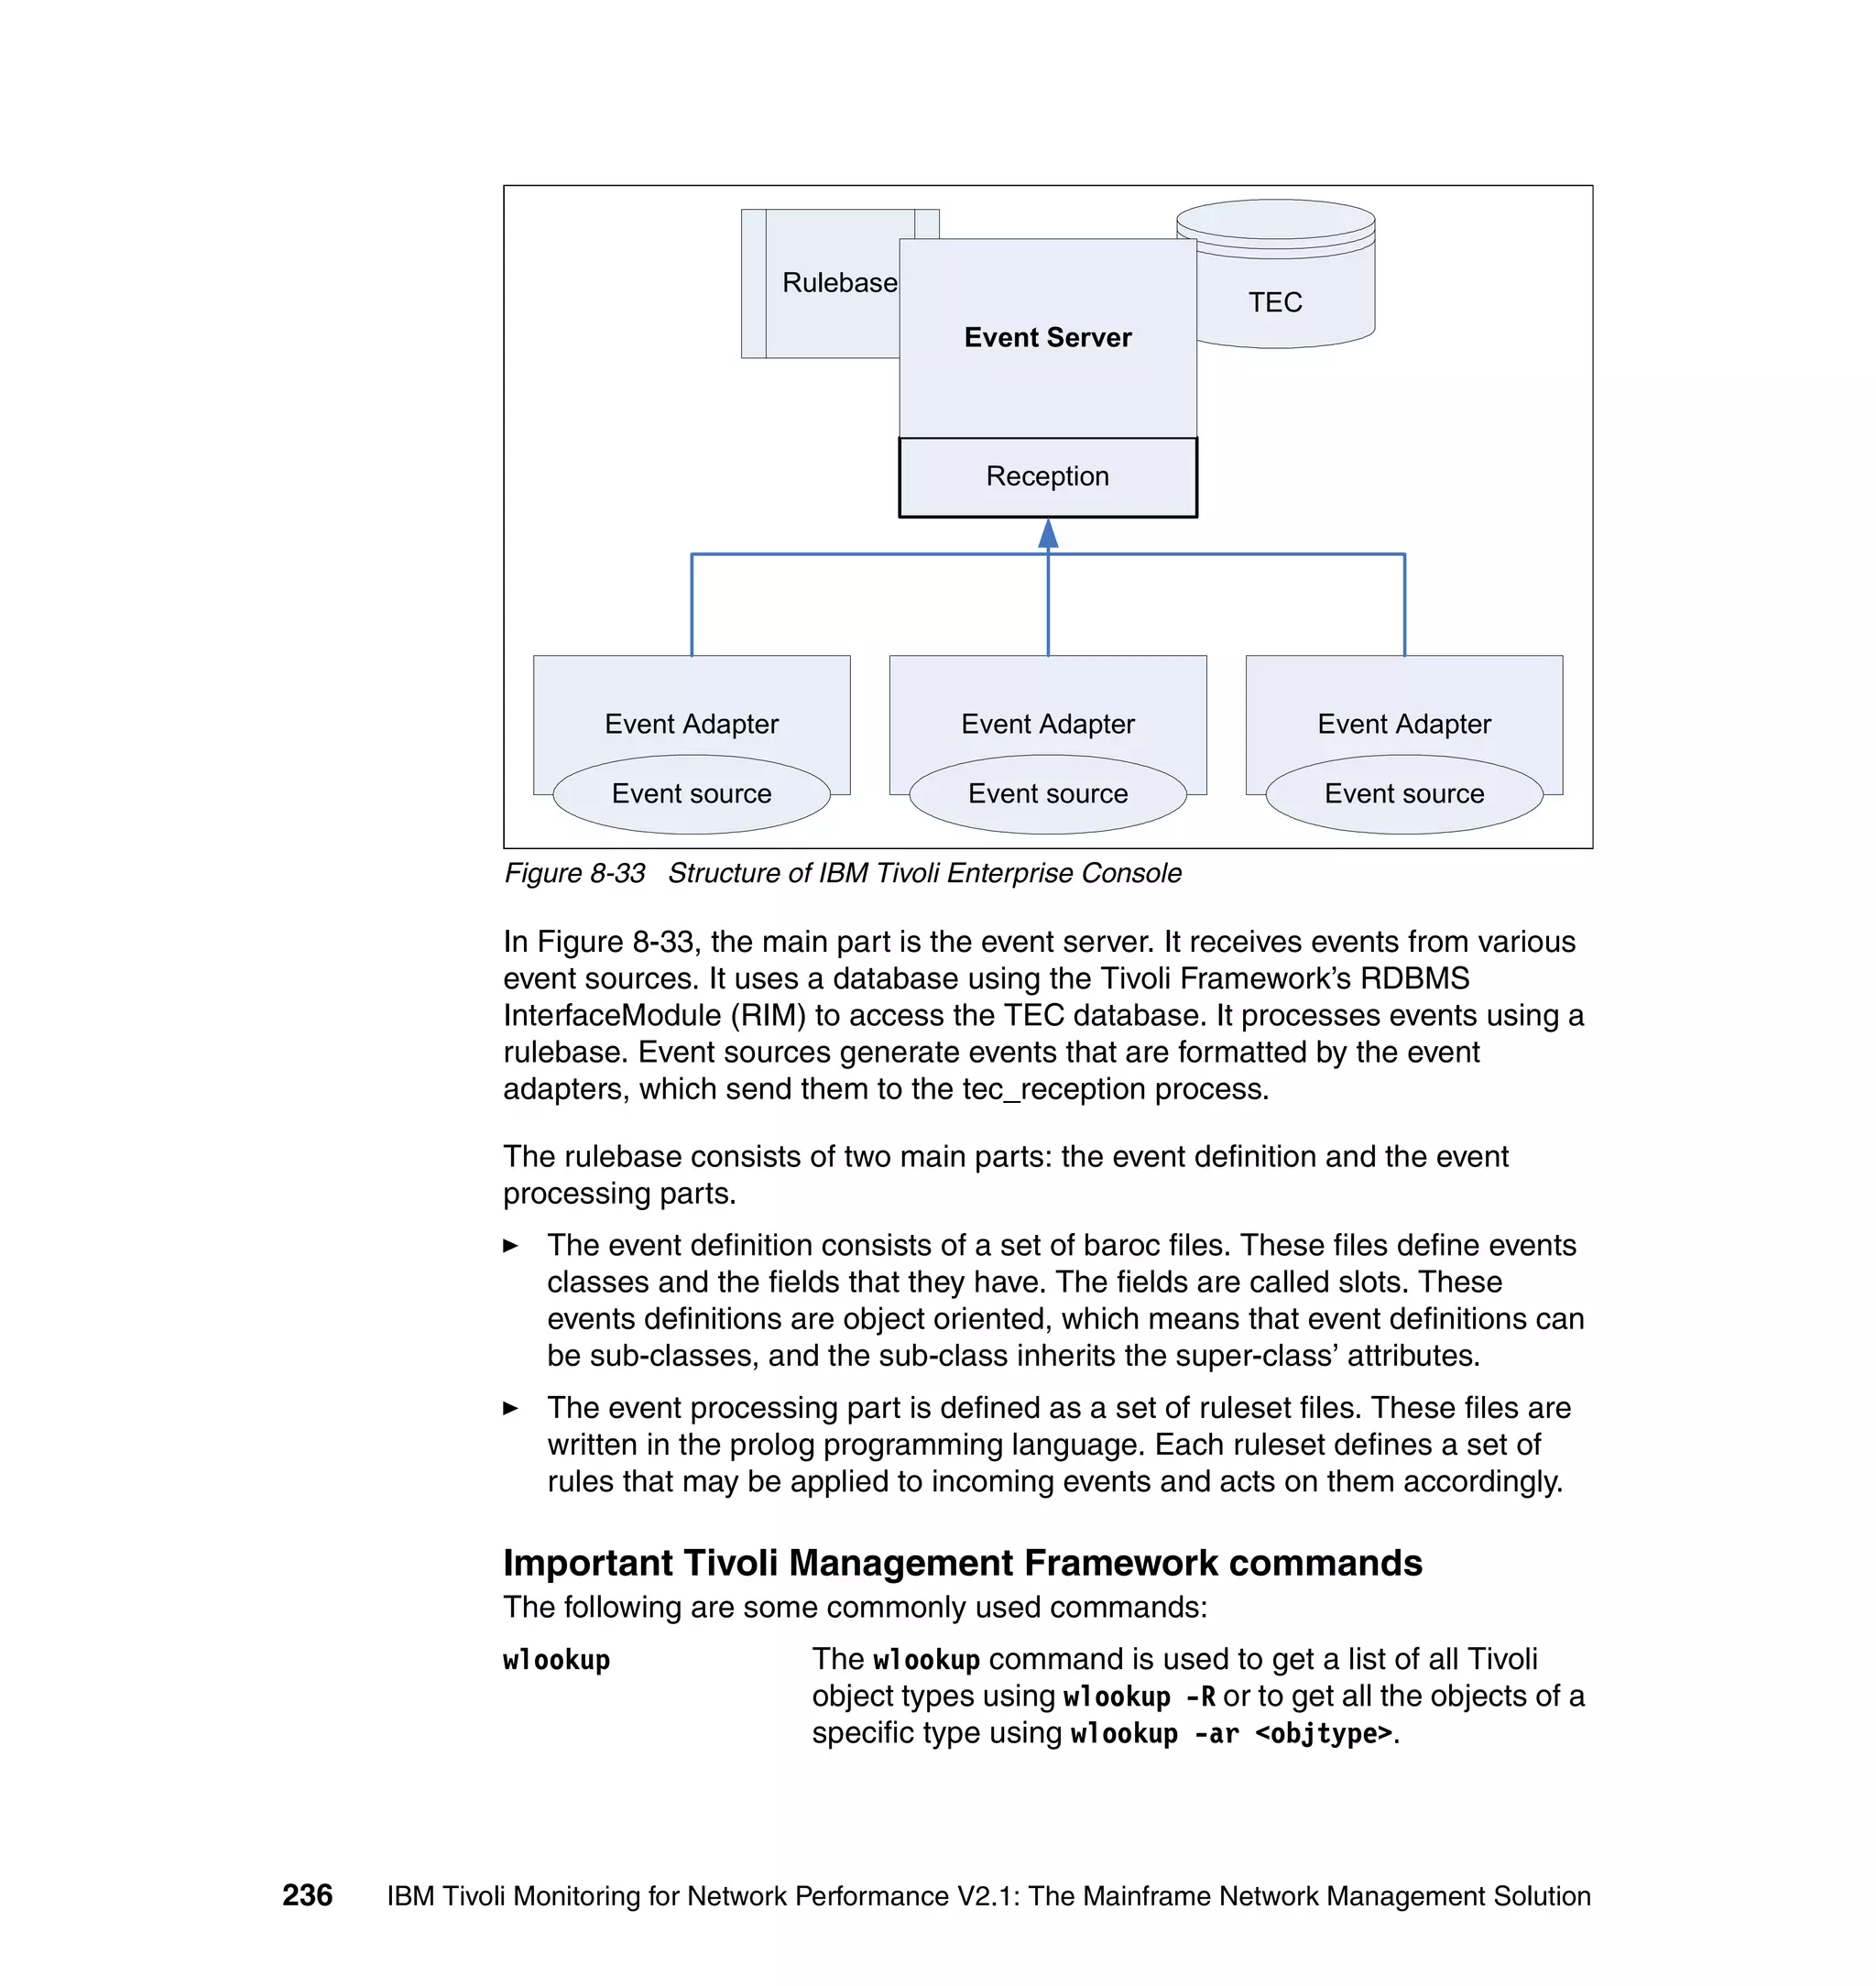
The corresponding rearm event is shown in Figure 7-13 on page 180.
Chapter 7. Discovery and alert interfaces 179](https://image.slidesharecdn.com/ibmtivolimonitoringfornetworkperformancev2-1themainframenetworkmanagementsolutionsg246360-120524030008-phpapp02/75/Ibm-tivoli-monitoring-for-network-performance-v2-1-the-mainframe-network-management-solution-sg246360-195-2048.jpg)
![N E T V I E W SESSION DOMAIN: SC61N VBUDI 06/15/04 18:39:53
NPDA-43S * EVENT DETAIL * PAGE 1 OF 2
SC61N WTSC61.I 9.12.4.3 ITMNP
+--------+ +--------+ +--------+
DOMAIN | PWS |---| NTID |---| APPL |
+--------+ +--------+ +--------+
HIERARCHY NAMES LIST:
PWS wtsc61.itso.ibm.com
NTID 9.12.4.32
APPL ITMNP
DATE/TIME: RECORDED - 06/01 00:39
EVENT TYPE: TEMPORARY
DESCRIPTION: wtsc61.itso.ibm.com: Threshold rearmed [
PROBABLE CAUSES:
severity=HARMLESS;
ORIGINAL T/EC EVENT:
ITMNP_ThresholdRearmed;
monitor_host=wtsc61.itso.ibm.com;
source=ITMNP;
msg=wtsc61.itso.ibm.com: Threshold rearmed
[TCP_CONN_AVL_MSMT.PERC_SEG_RETRANS = 0.000000 (<= 1)];
field_name=TCP_CONN_AVL_MSMT.PERC_SEG_RETRANS;
msmt_details=Category=null;LOCAL_NODE_IP='9.12.4.33';REMOTE_PORT=3628;RETRA
NS_RT=0.000000;RESP_TM_VAR=49;RETRANS_SEGS=0;START_TM='2004-05-27-03.29.46.
000000';REMOTE_NODE_IP='9.155.177.145';REM_WINDOW_CNT=1;APP_JOB_NM='DFSKERN
';LAST_ACTIV
msmt_id=c1c710dc090c0420000000fcda6eae44;
timestamp=2004-05-31 05:09:48.0;
adapter_host=wtsc61;
hostname=wtsc61.itso.ibm.com;
ENTER A (ACTION) OR DM (DETAIL MENU)
???
CMD==>
Figure 7-13 Threshold rearmed event
180 IBM Tivoli Monitoring for Network Performance V2.1: The Mainframe Network Management Solution](https://image.slidesharecdn.com/ibmtivolimonitoringfornetworkperformancev2-1themainframenetworkmanagementsolutionsg246360-120524030008-phpapp02/75/Ibm-tivoli-monitoring-for-network-performance-v2-1-the-mainframe-network-management-solution-sg246360-196-2048.jpg)


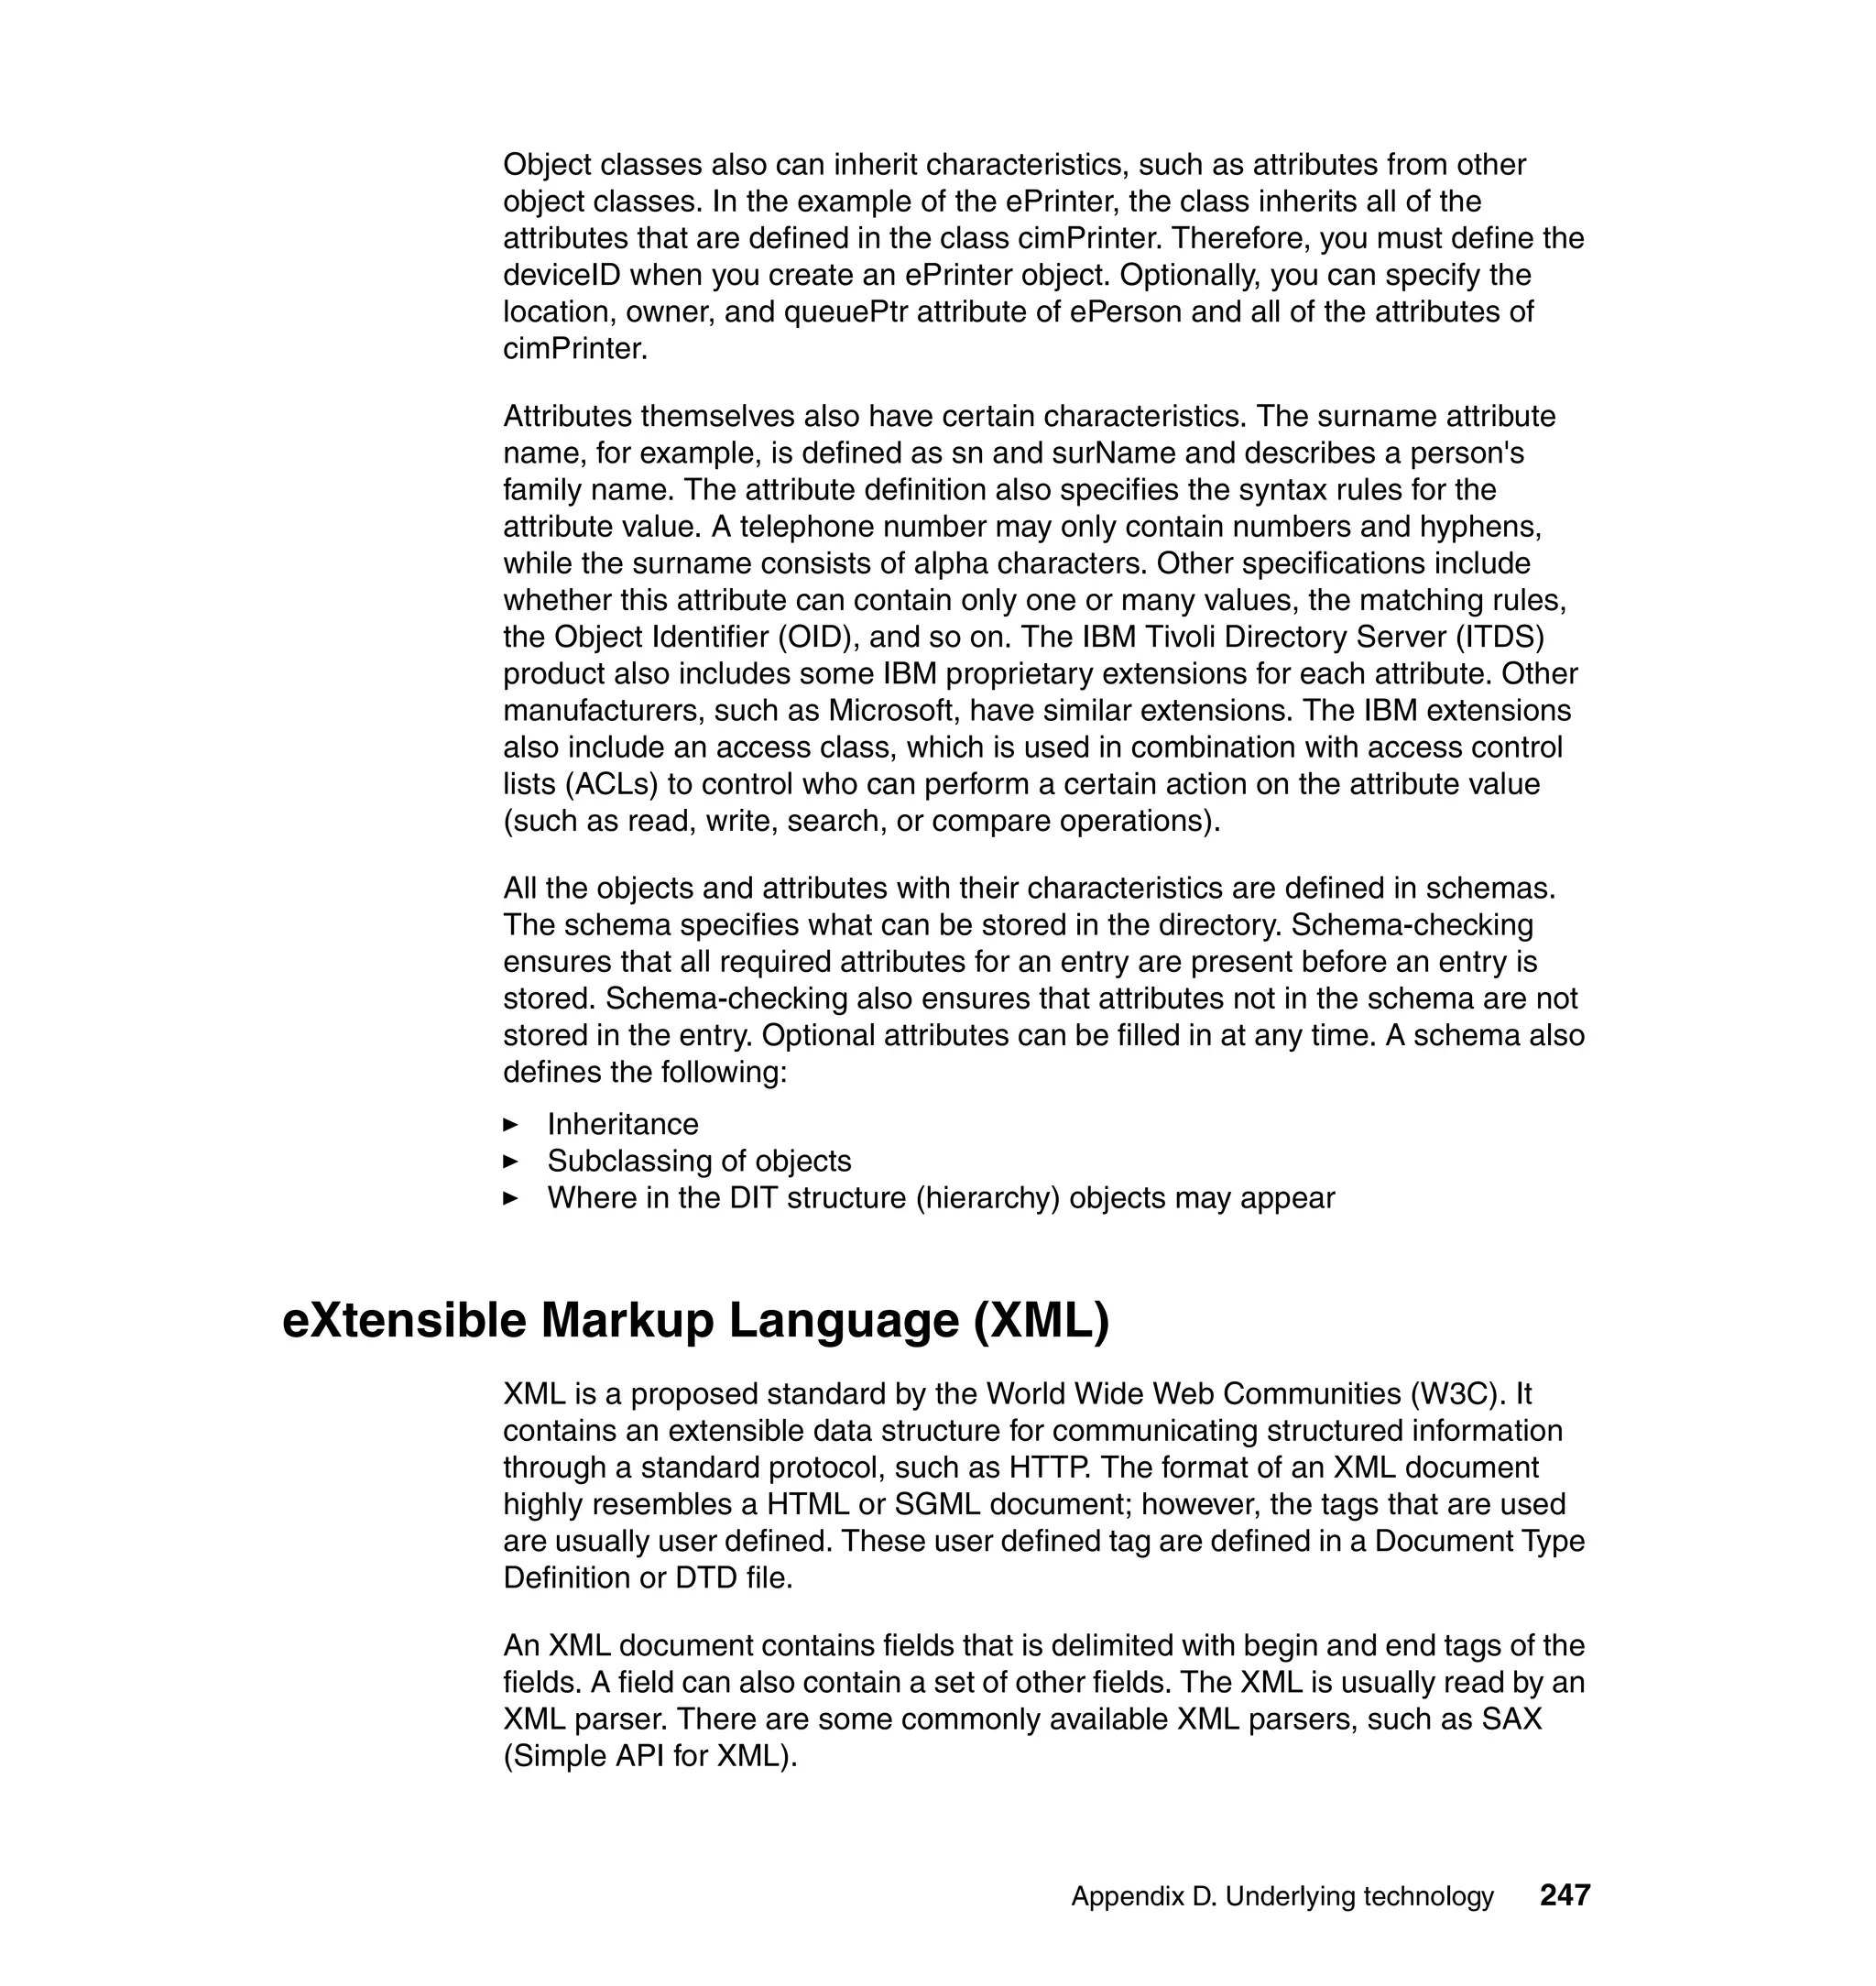
![Figure D-3 shows an example of an XML document.
<?xml version="1.0" standalone="no"?>
<HTTP-TRANSACTION>
<REQUEST>
<REQUEST-LINE NAME="STATIC">
<METHOD>GET</METHOD>
<URI>/</URI>
<PROT-VER>HTTP/1.0</PROT-VER>
</REQUEST-LINE>
<HEADERS>
<HL>Accept: image/gif, image/x-xbitmap, image/jpeg, image/pjpeg, image/png,
*/*</HL>
<HL>Accept-Charset: iso-8859-1,*,utf-8</HL>
<HL>Accept-Language: en</HL>
<COOKIE>
<INVOCATION>
<FUNCTION NAME="retrieve_cookie"></FUNCTION>
</INVOCATION>
</COOKIE>
<HL>Host: tokyo.itsc.austin.ibm.com</HL>
<HL>User-Agent: Mozilla/4.73 [en] (WinNT; U)</HL>
<HL>Referer: https://tokyo.itsc.austin.ibm.com:443/</HL>
</HEADERS>
</REQUEST>
</HTTP-TRANSACTION>
Figure D-3 Sample XML document
In today’s technology, XML is starting to becoming a key piece of software
infrastructure. The main idea is extremely simple. It is a language like HTML and
is text based, but is rigidly enforced, and therefore can be built upon easily. XML
documents may use a Document Type Definition (DTD) or an XML Schema.
XML was designed to describe data and to focus on the data, unlike HTML,
which was designed to display data. It was created to structure and store data.
XML has these main applications:
Sharing of information: The main problem integrating data between any two
business organizations is the interface between them. If they can at least
agree upon the standard of their common meeting point and its usage, they
can build upon this to start building their applications. If there is already an
existing interface or infrastructure provided by industry or government
standard or infrastructure, the business cost of developing it is extinguished.
Storage, transmission and interpretation of data: If the storage of
information is adaptable to many mediums, its cost will be driven to the lowest
248 IBM Tivoli Monitoring for Network Performance V2.1: The Mainframe Network Management Solution](https://image.slidesharecdn.com/ibmtivolimonitoringfornetworkperformancev2-1themainframenetworkmanagementsolutionsg246360-120524030008-phpapp02/75/Ibm-tivoli-monitoring-for-network-performance-v2-1-the-mainframe-network-management-solution-sg246360-264-2048.jpg)


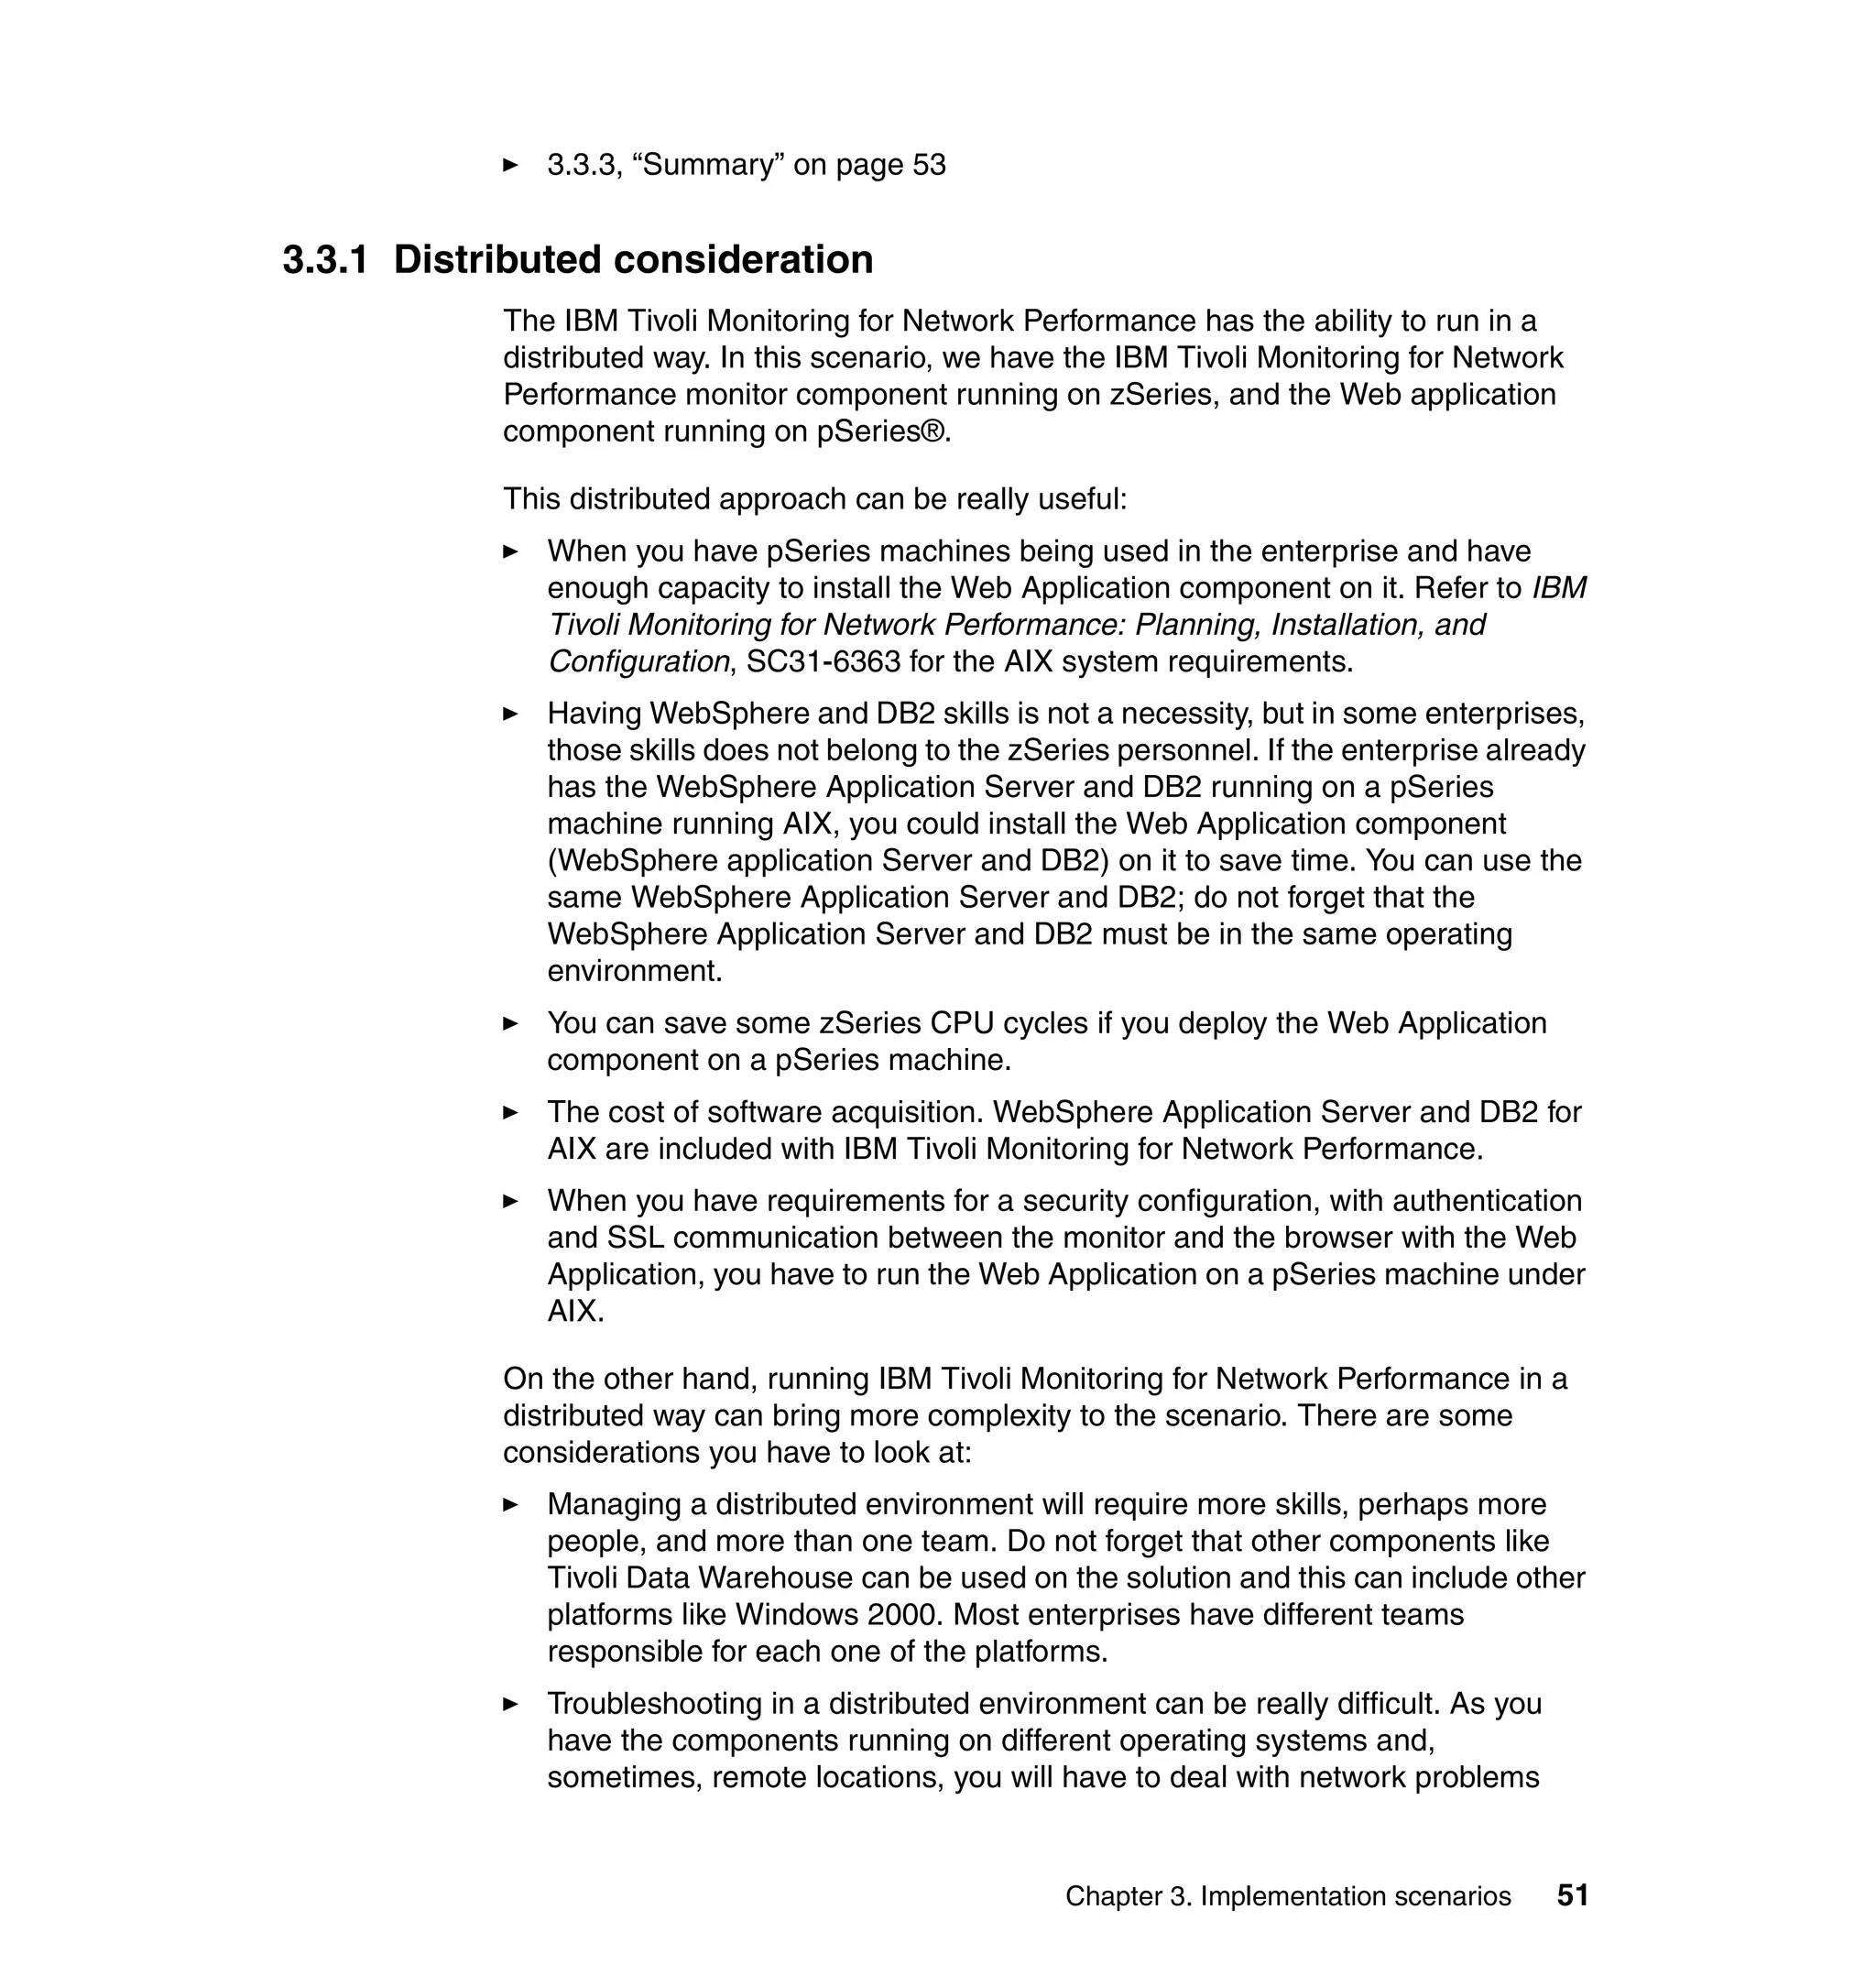
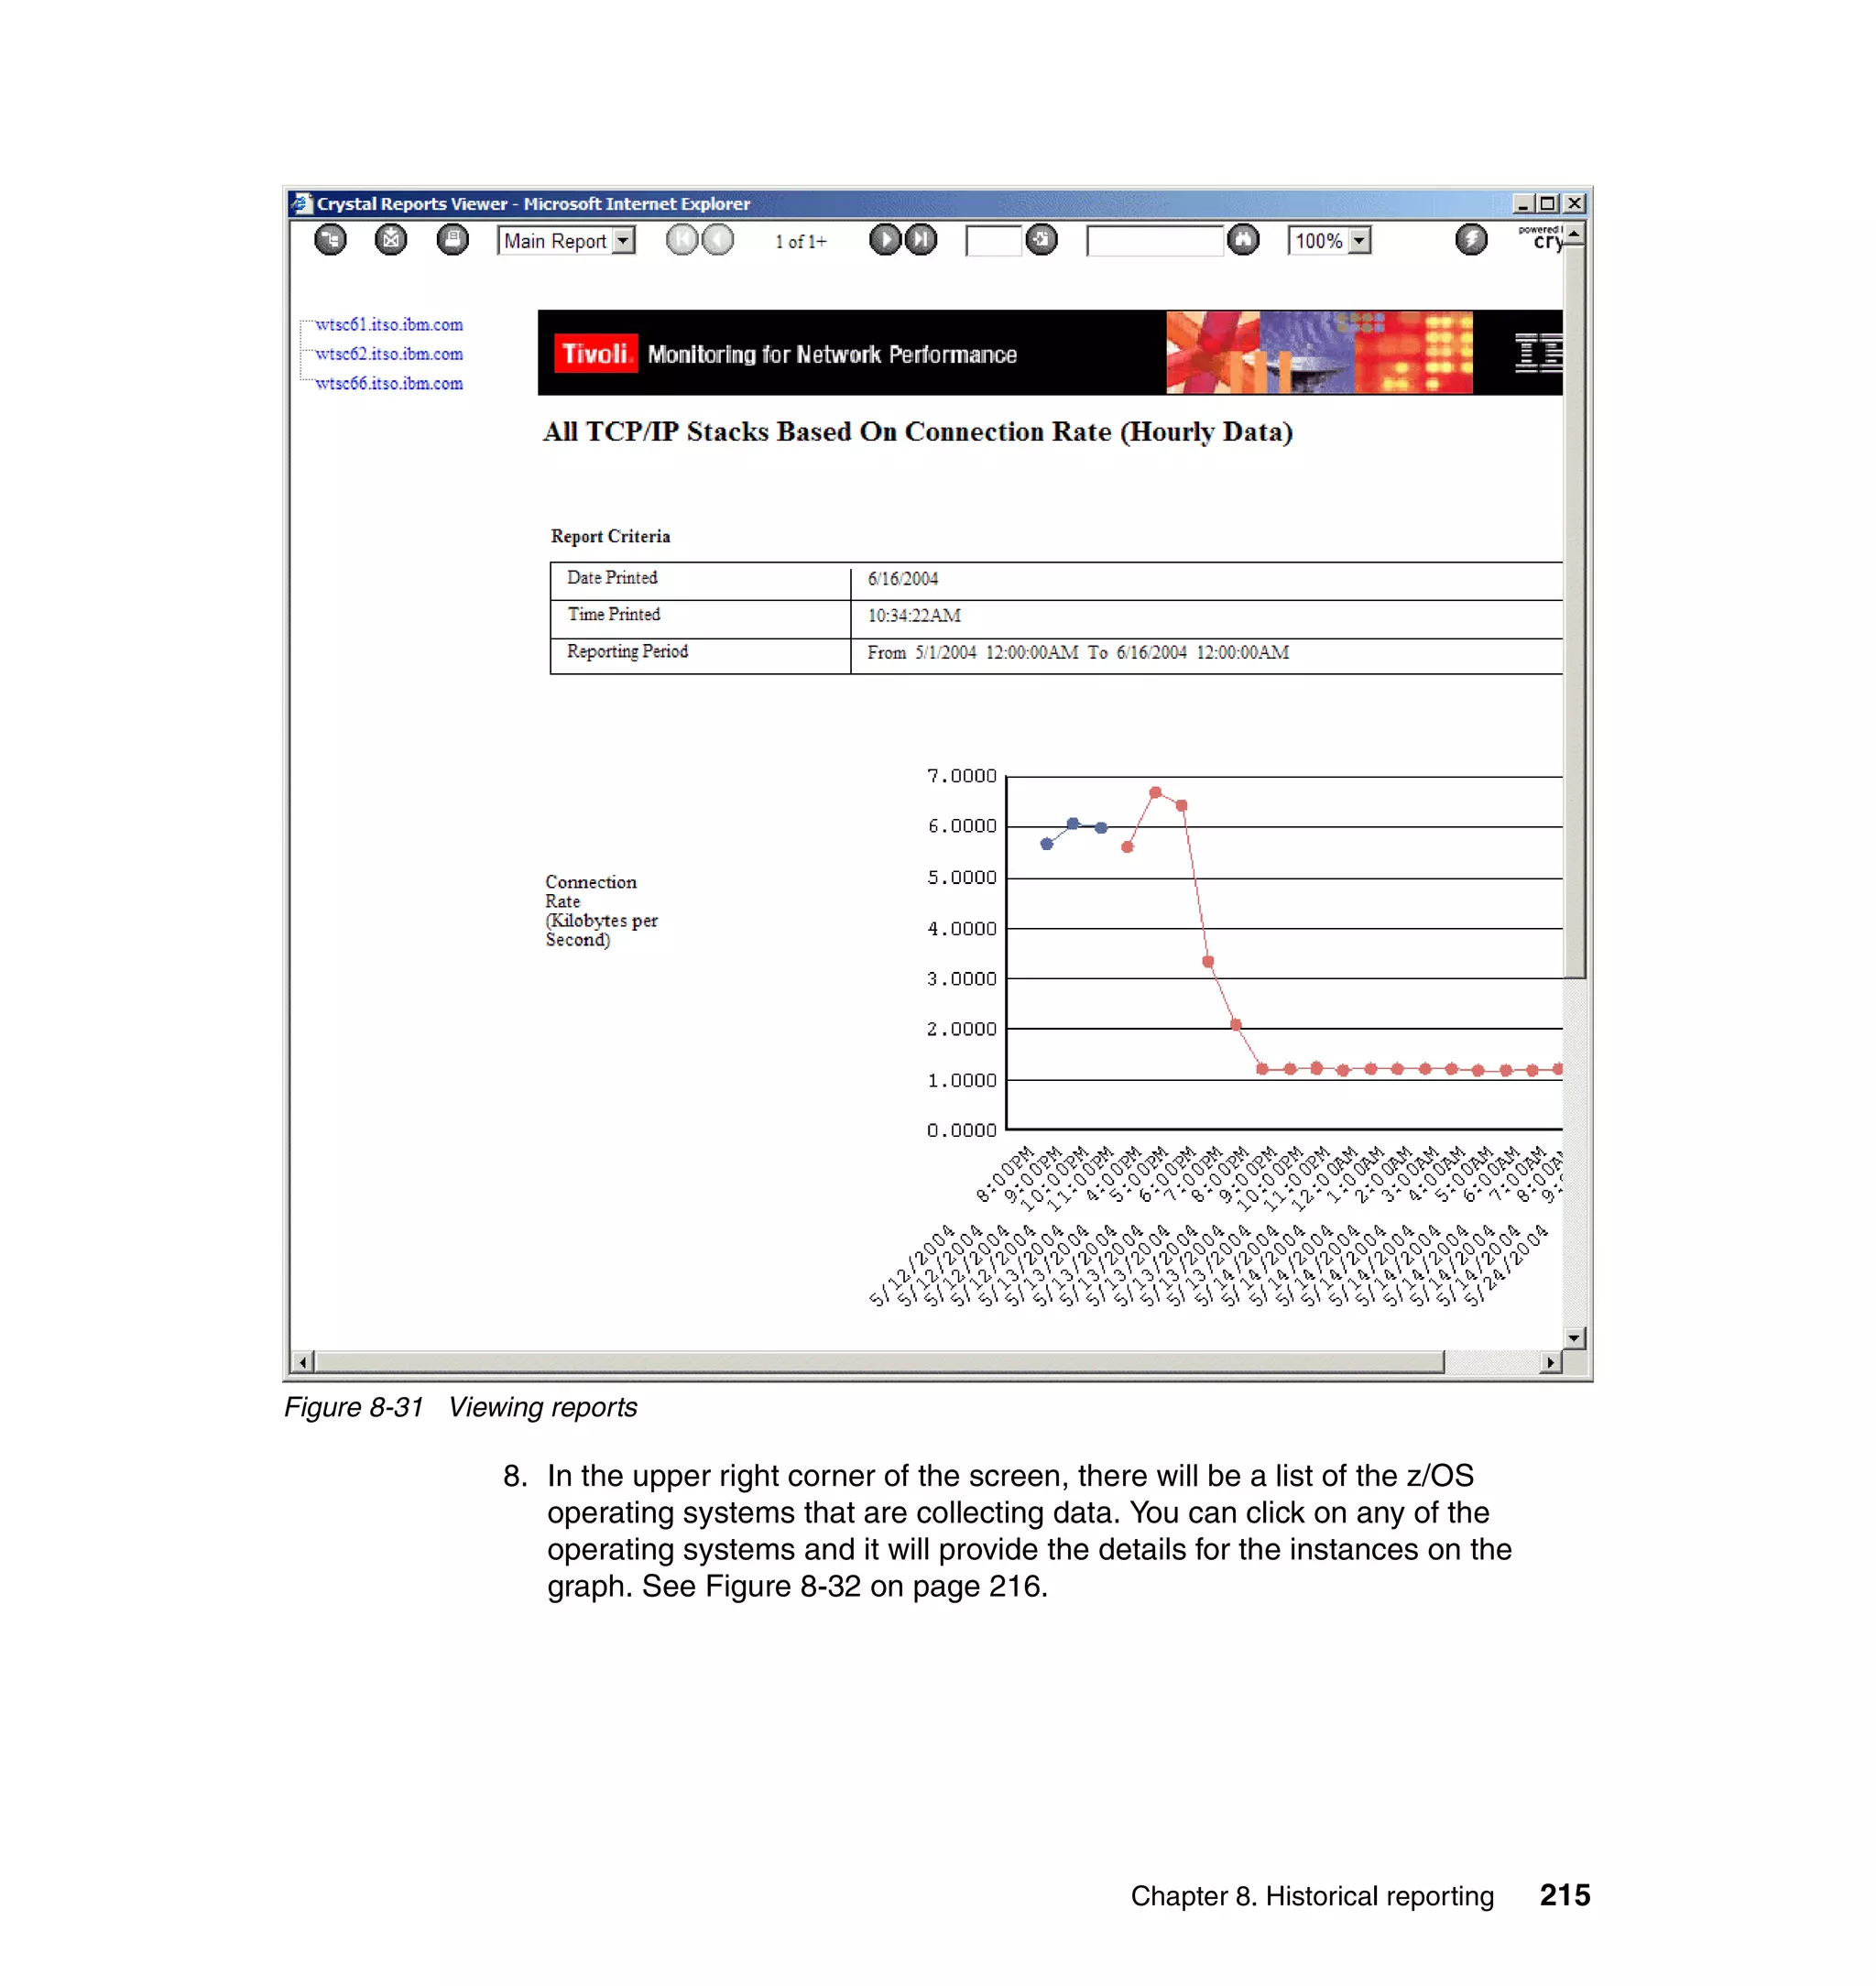
This document provides an overview and implementation details for IBM Tivoli Monitoring for Network Performance V2.1. It describes the product's architecture including components like the web application, monitor functions, communication methods, and database structure. It then discusses two implementation scenarios: a distributed servers environment and a pure z/OS environment. Finally, it covers steps for installing and configuring the web application on AIX and z/OS mainframes.


![[old] Network Performance Monitoring for DevOps and IT](https://cdn.slidesharecdn.com/ss_thumbnails/site24x7-networkmonitoringwebinar7cdec16th-151229132512-thumbnail.jpg?width=640&height=640&fit=bounds)