Download as PDF, PPTX
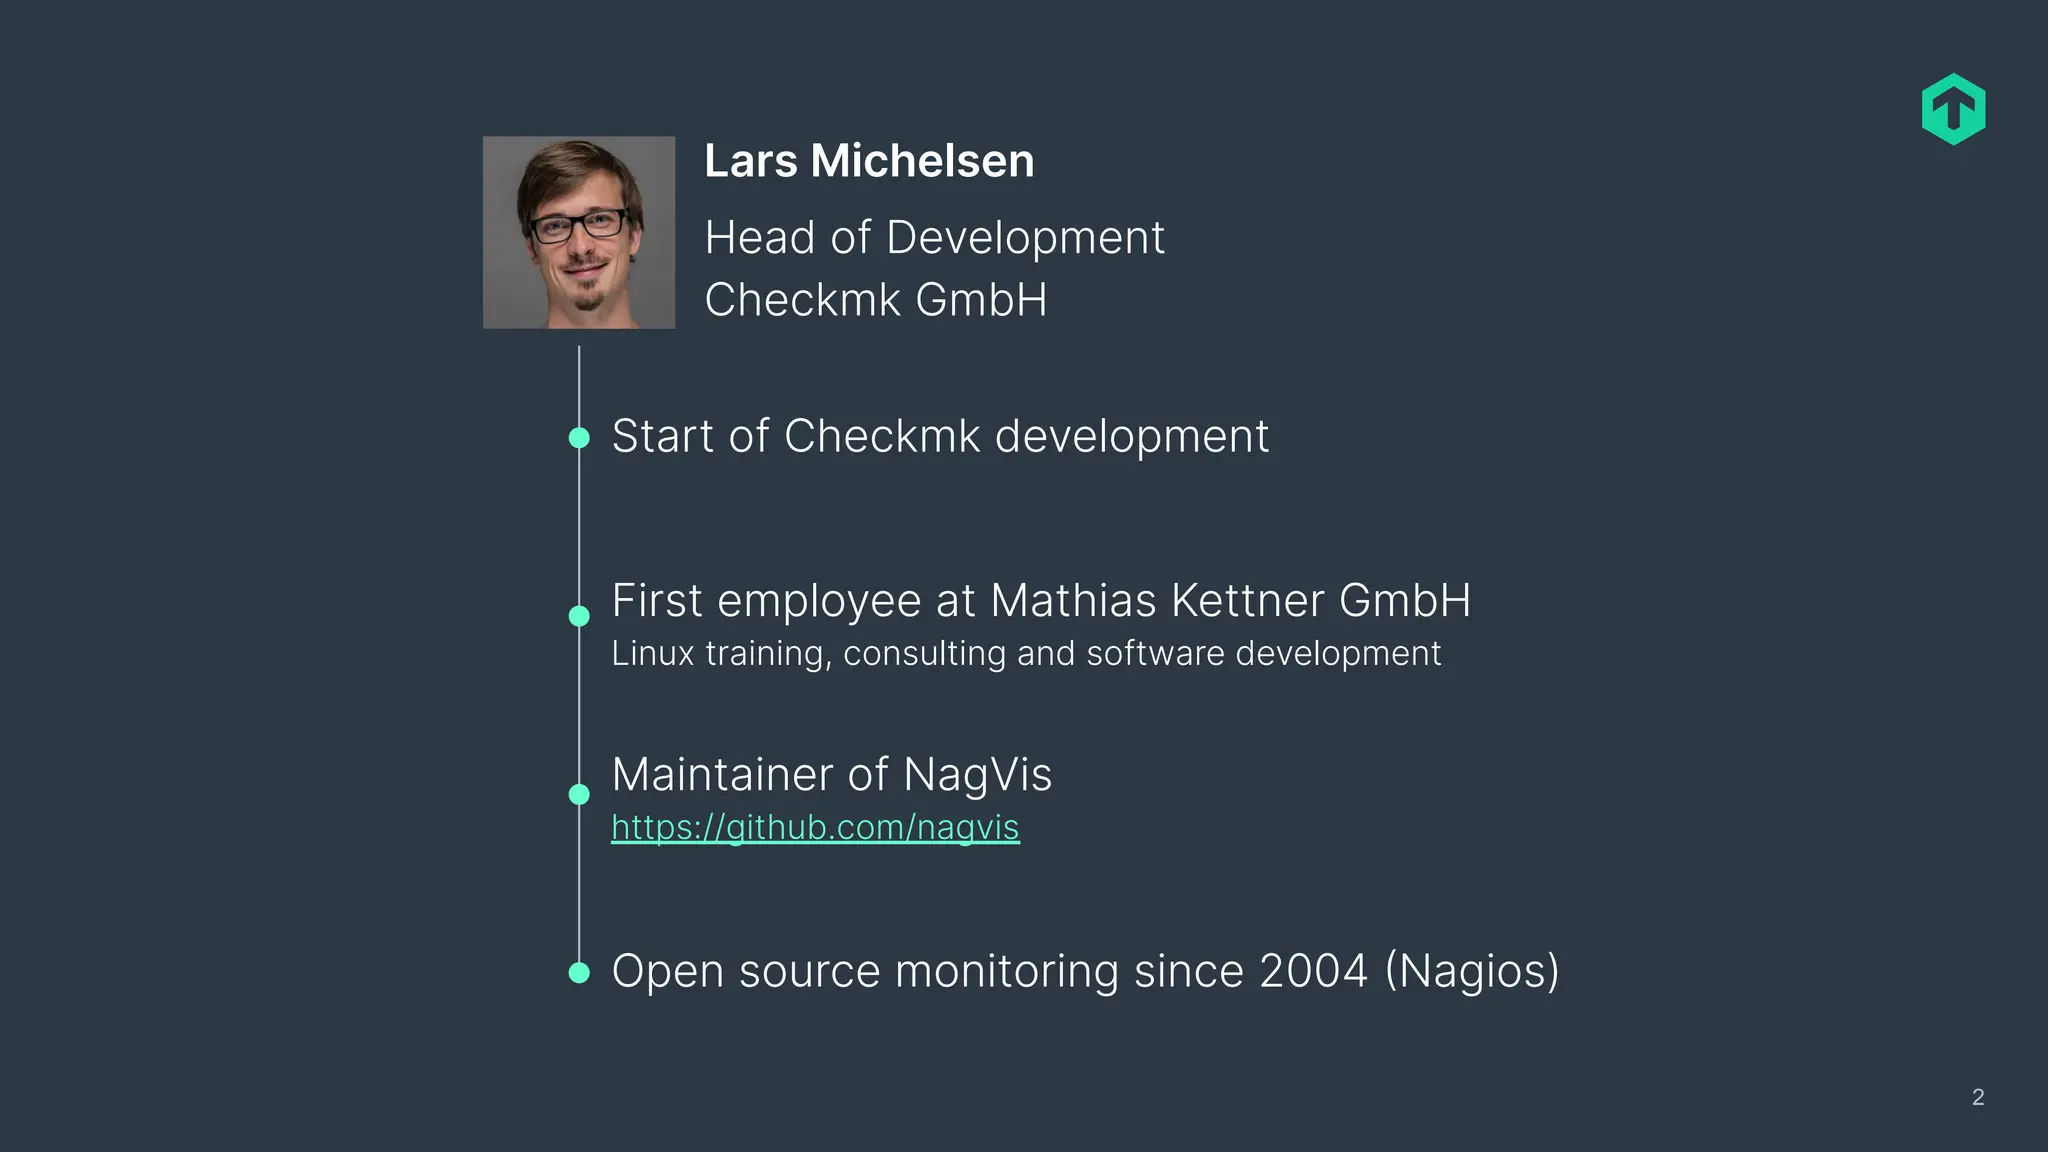
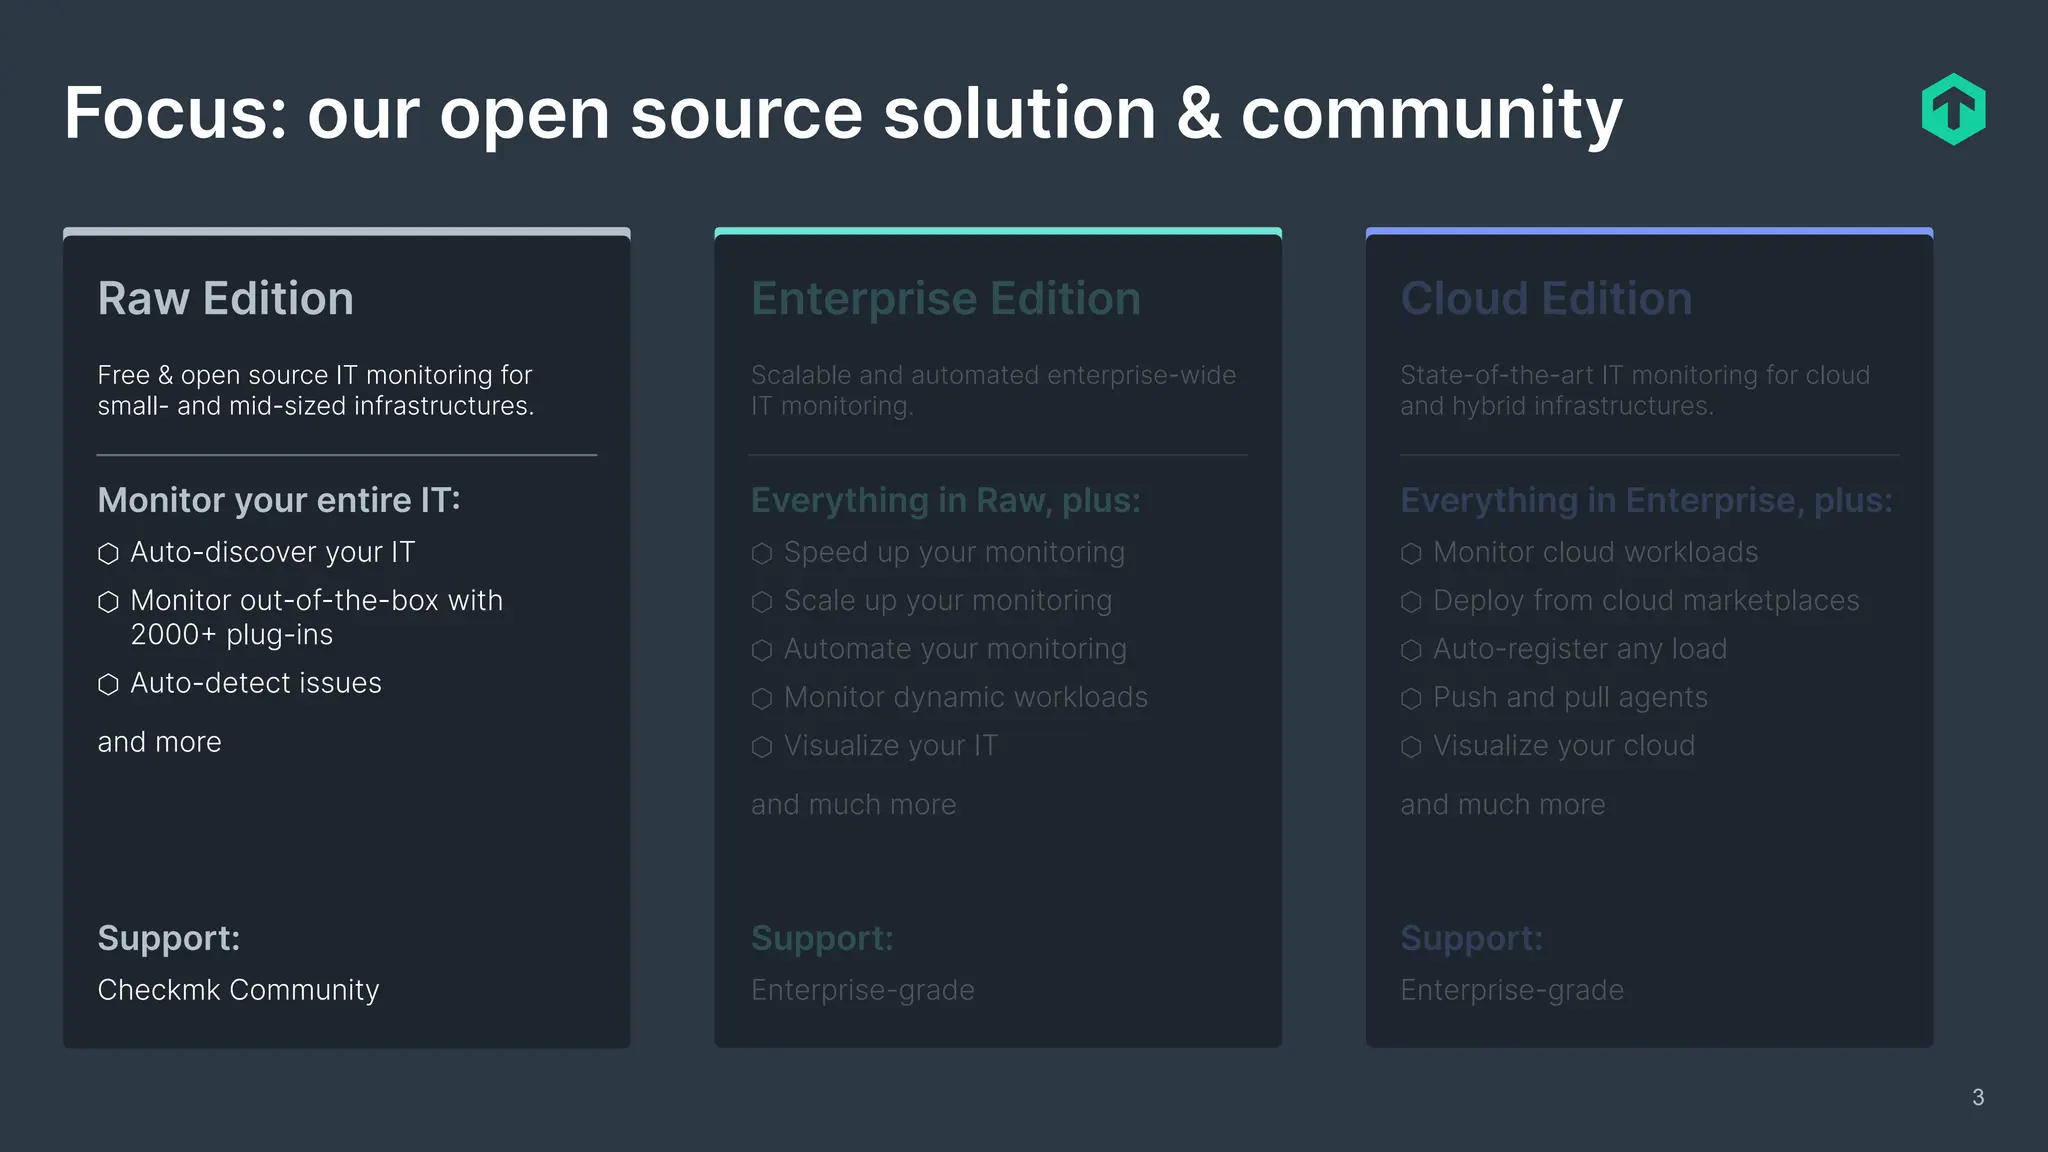
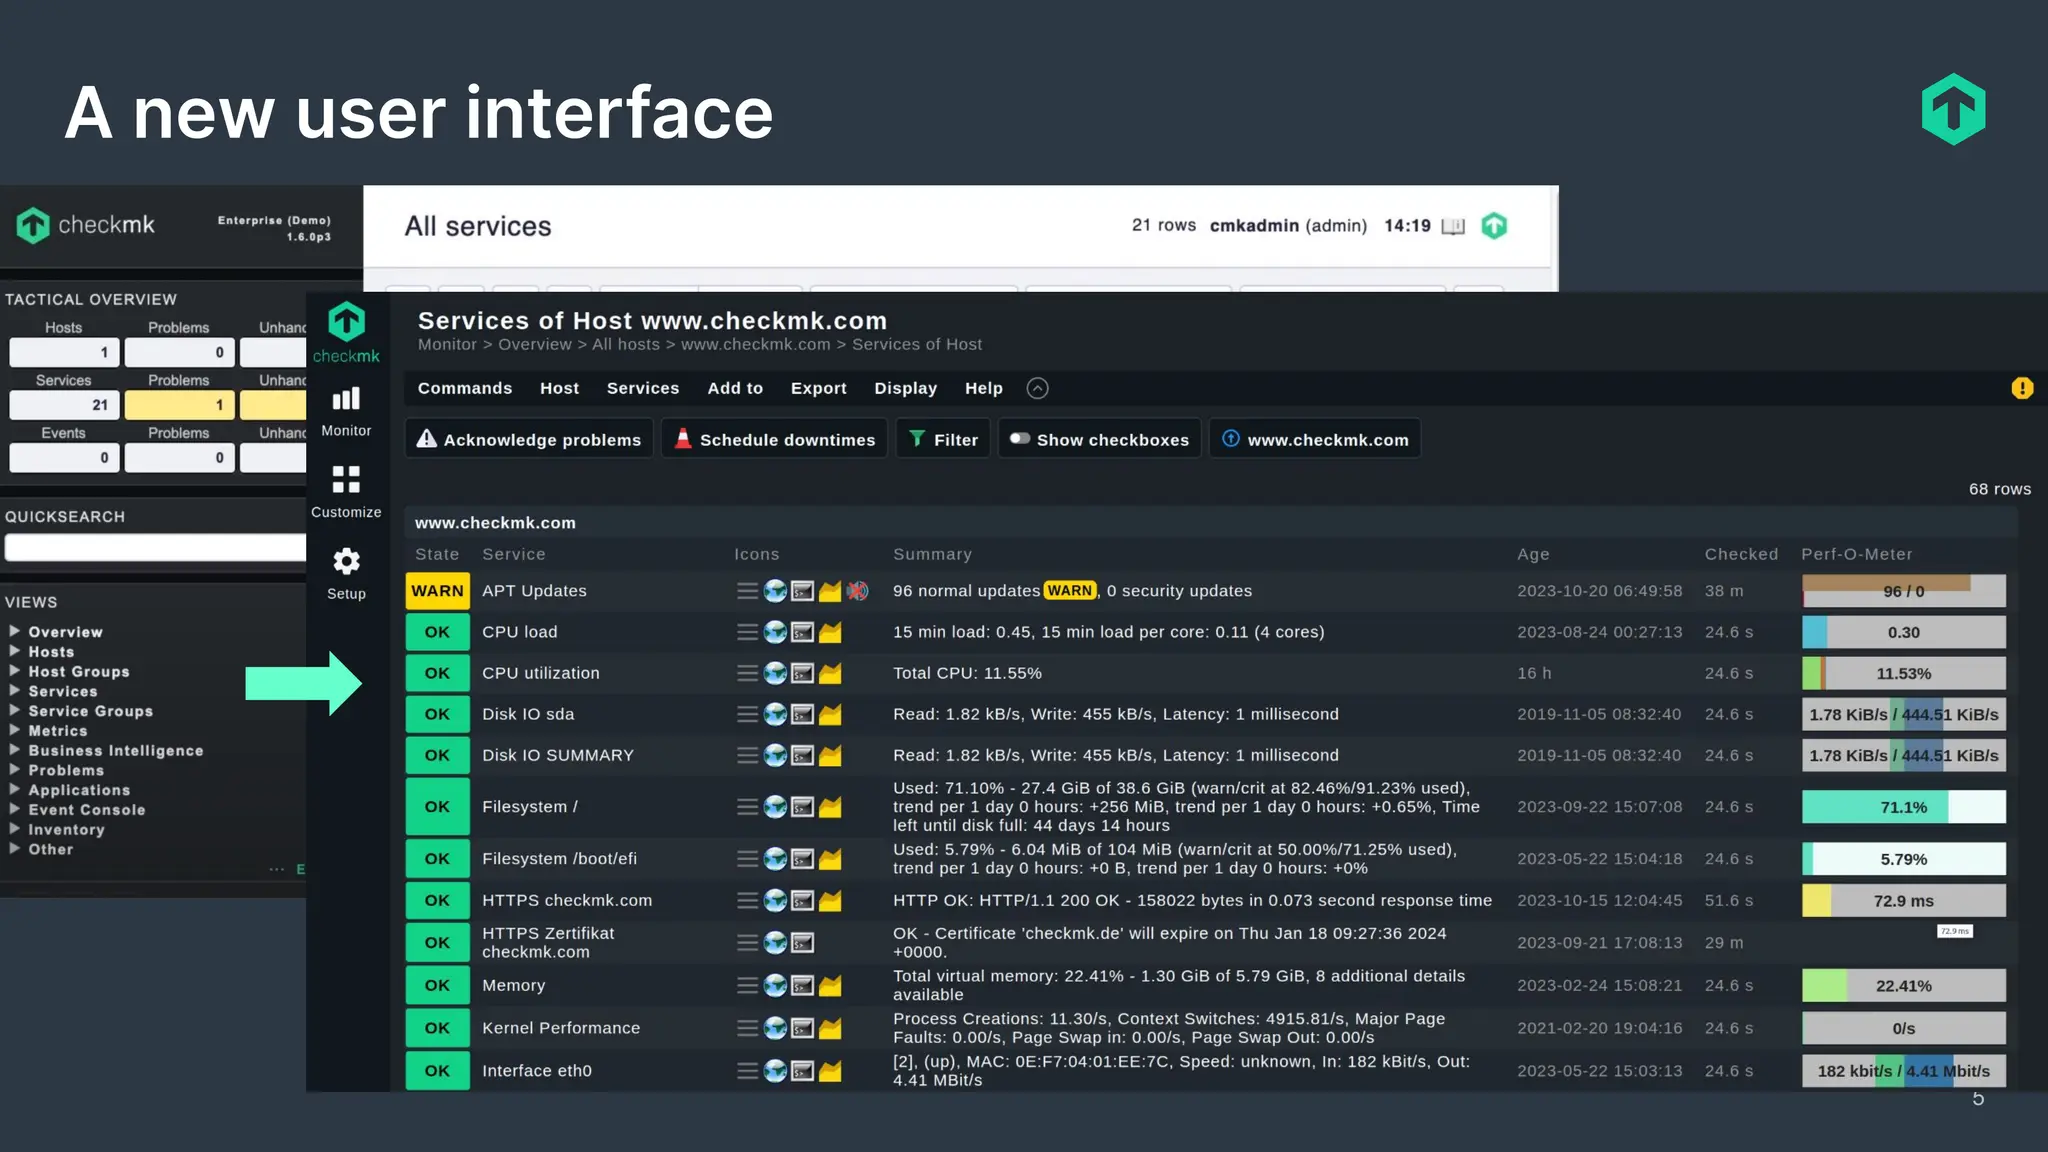
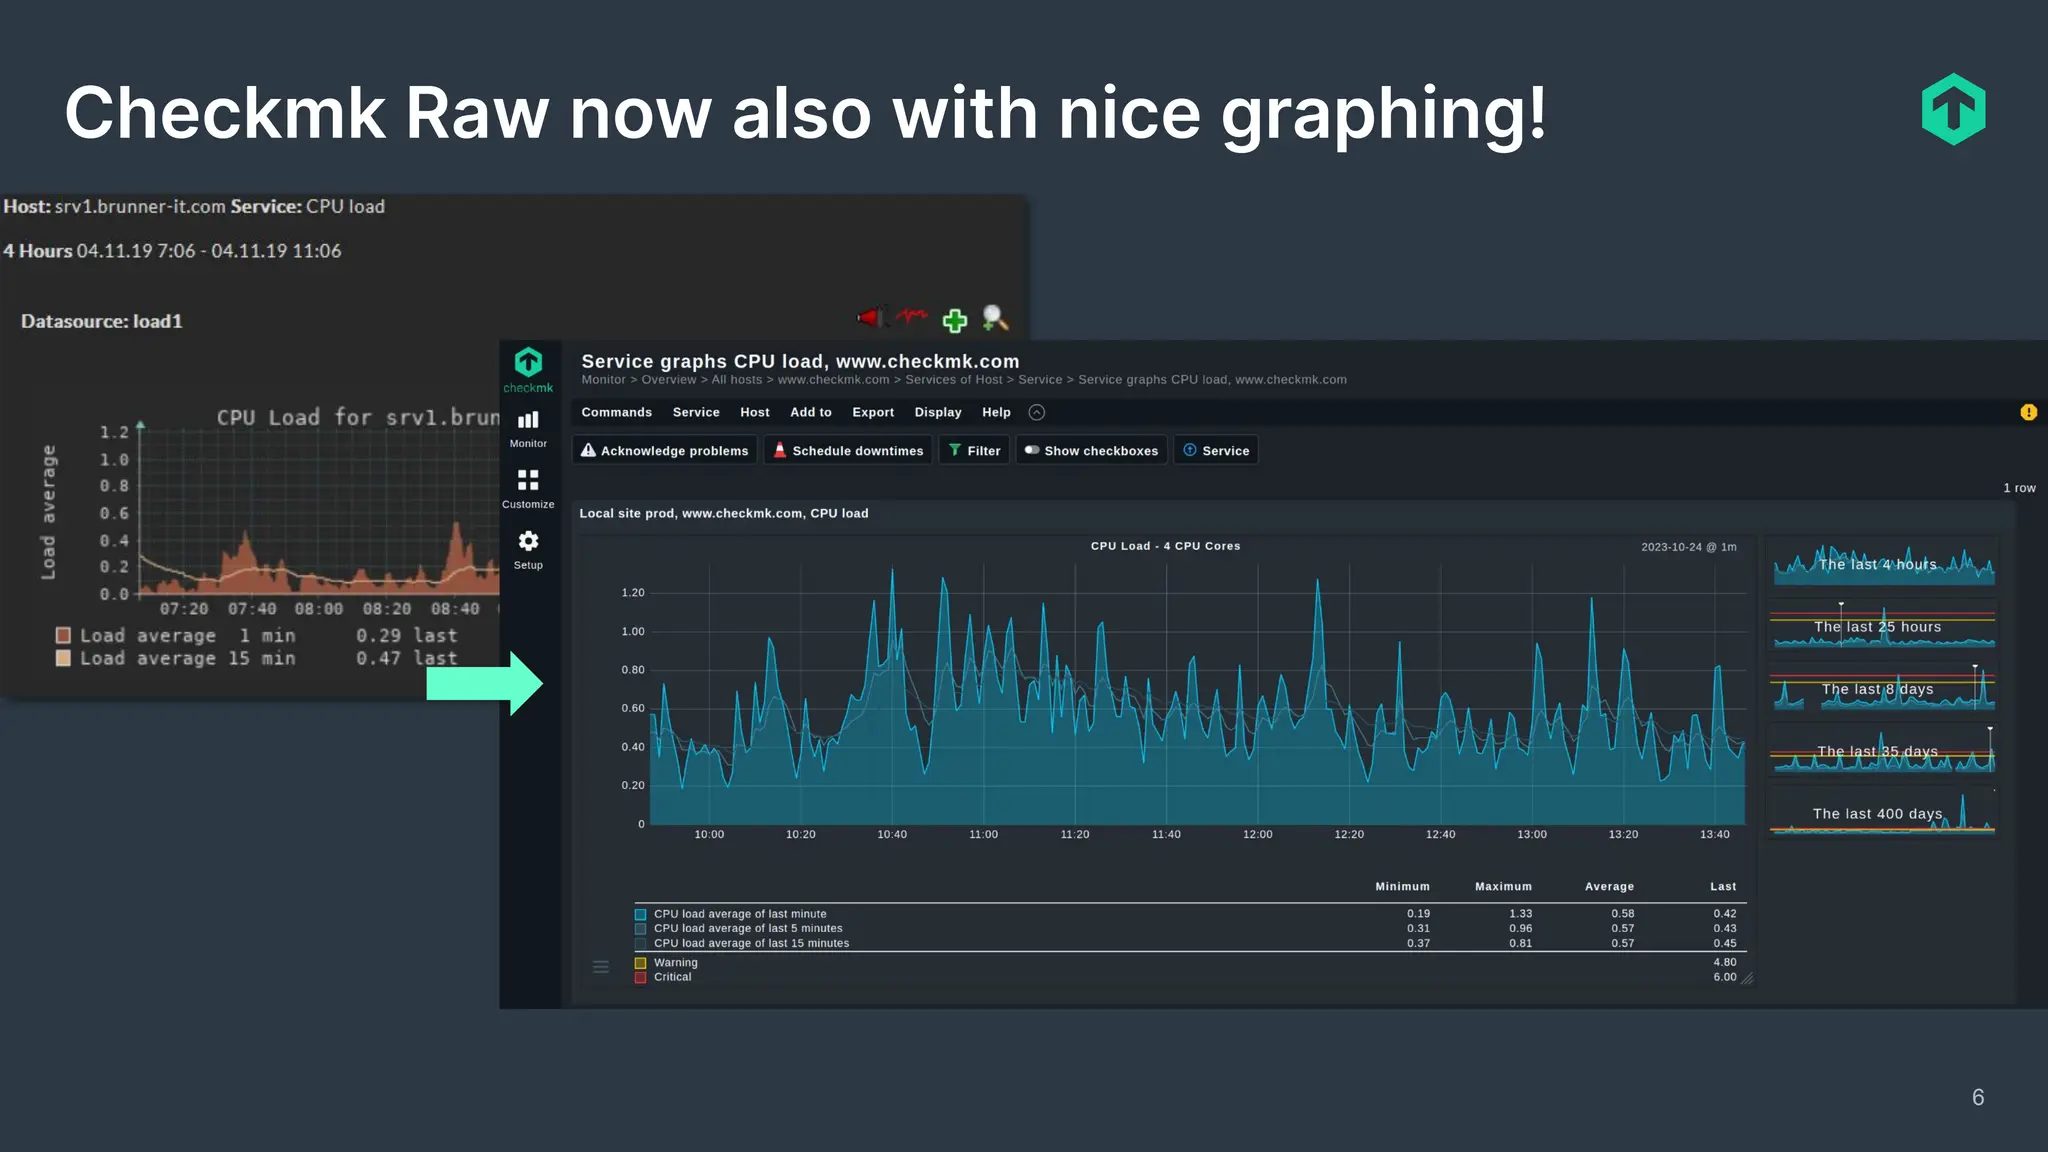
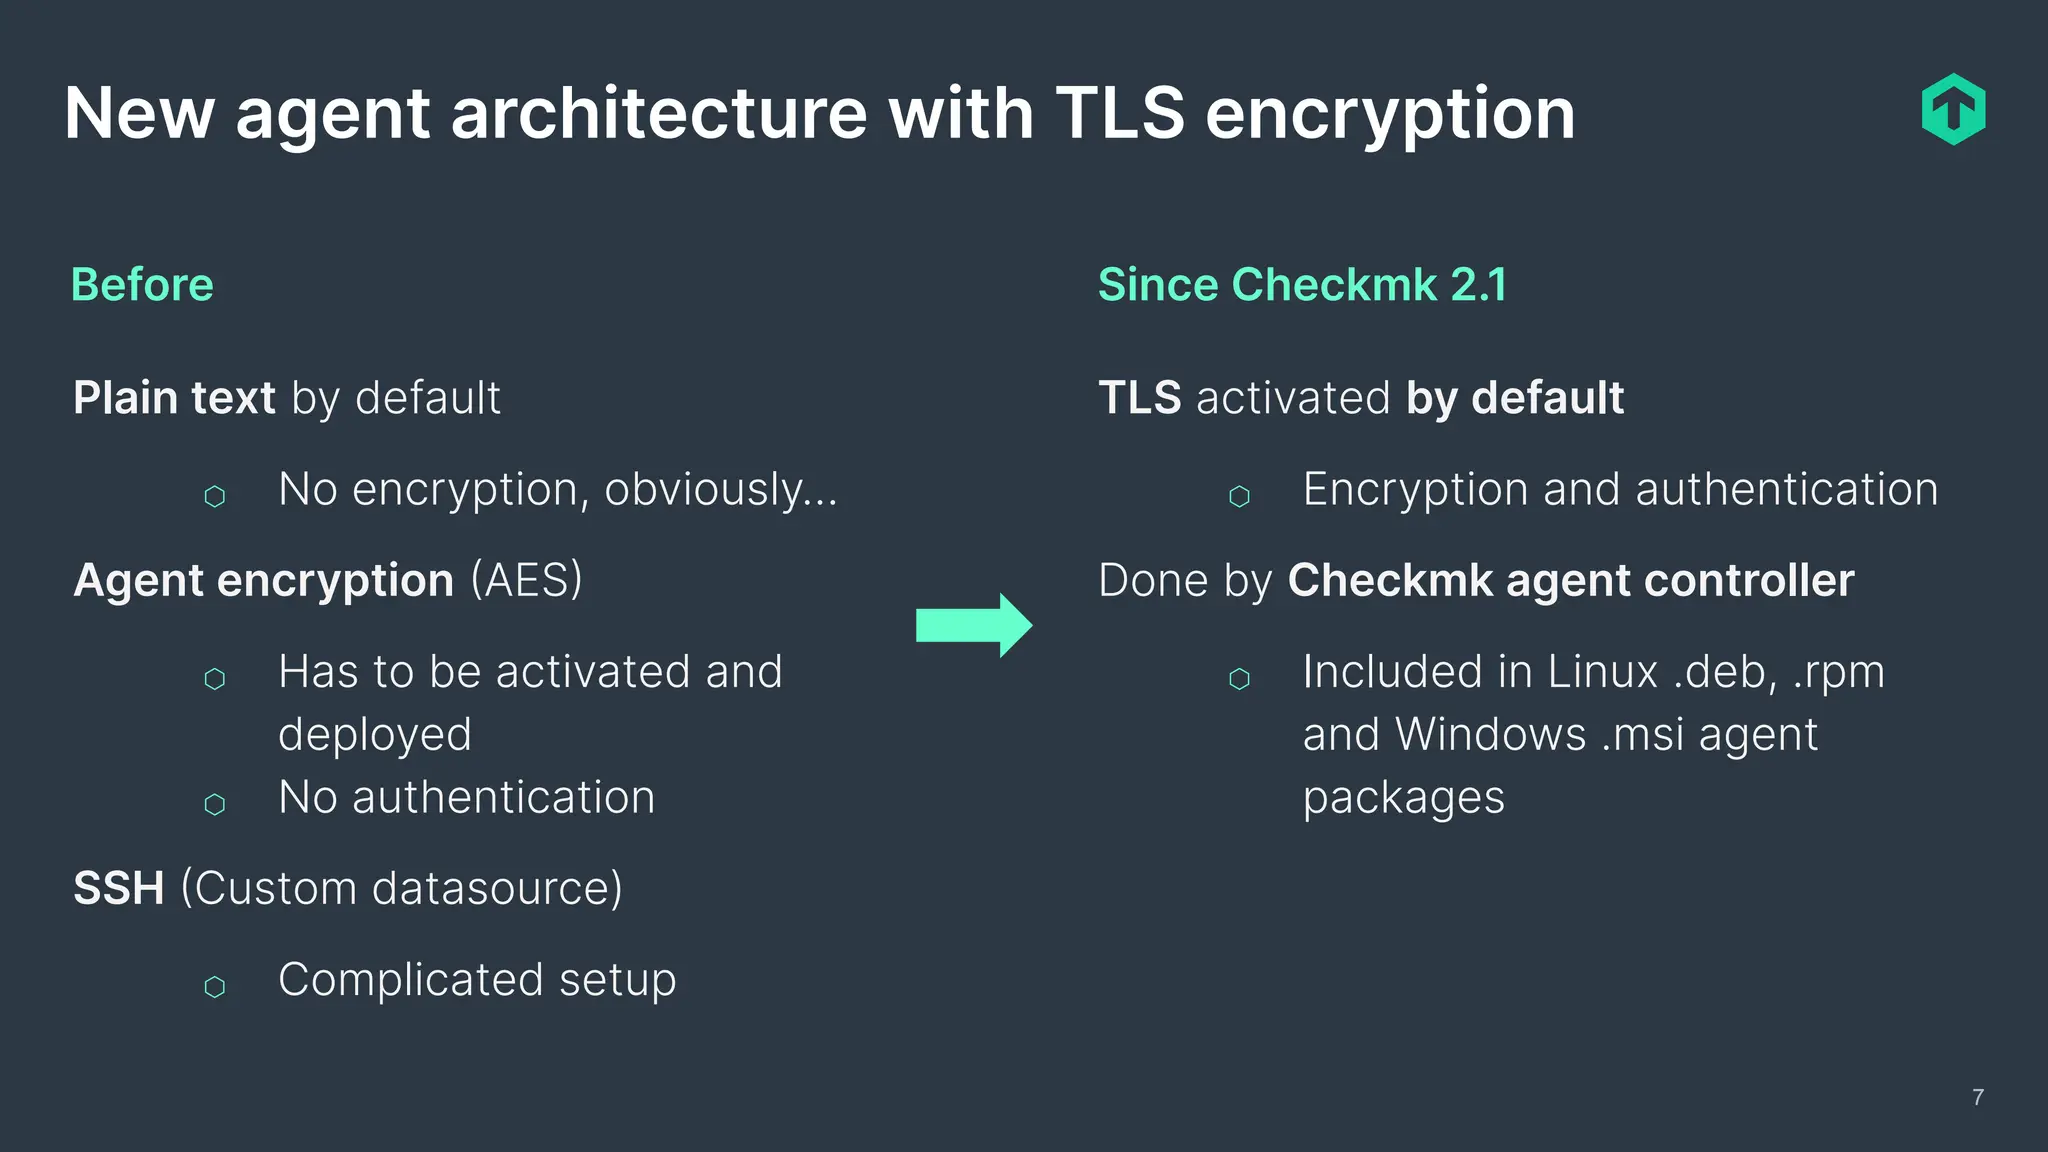
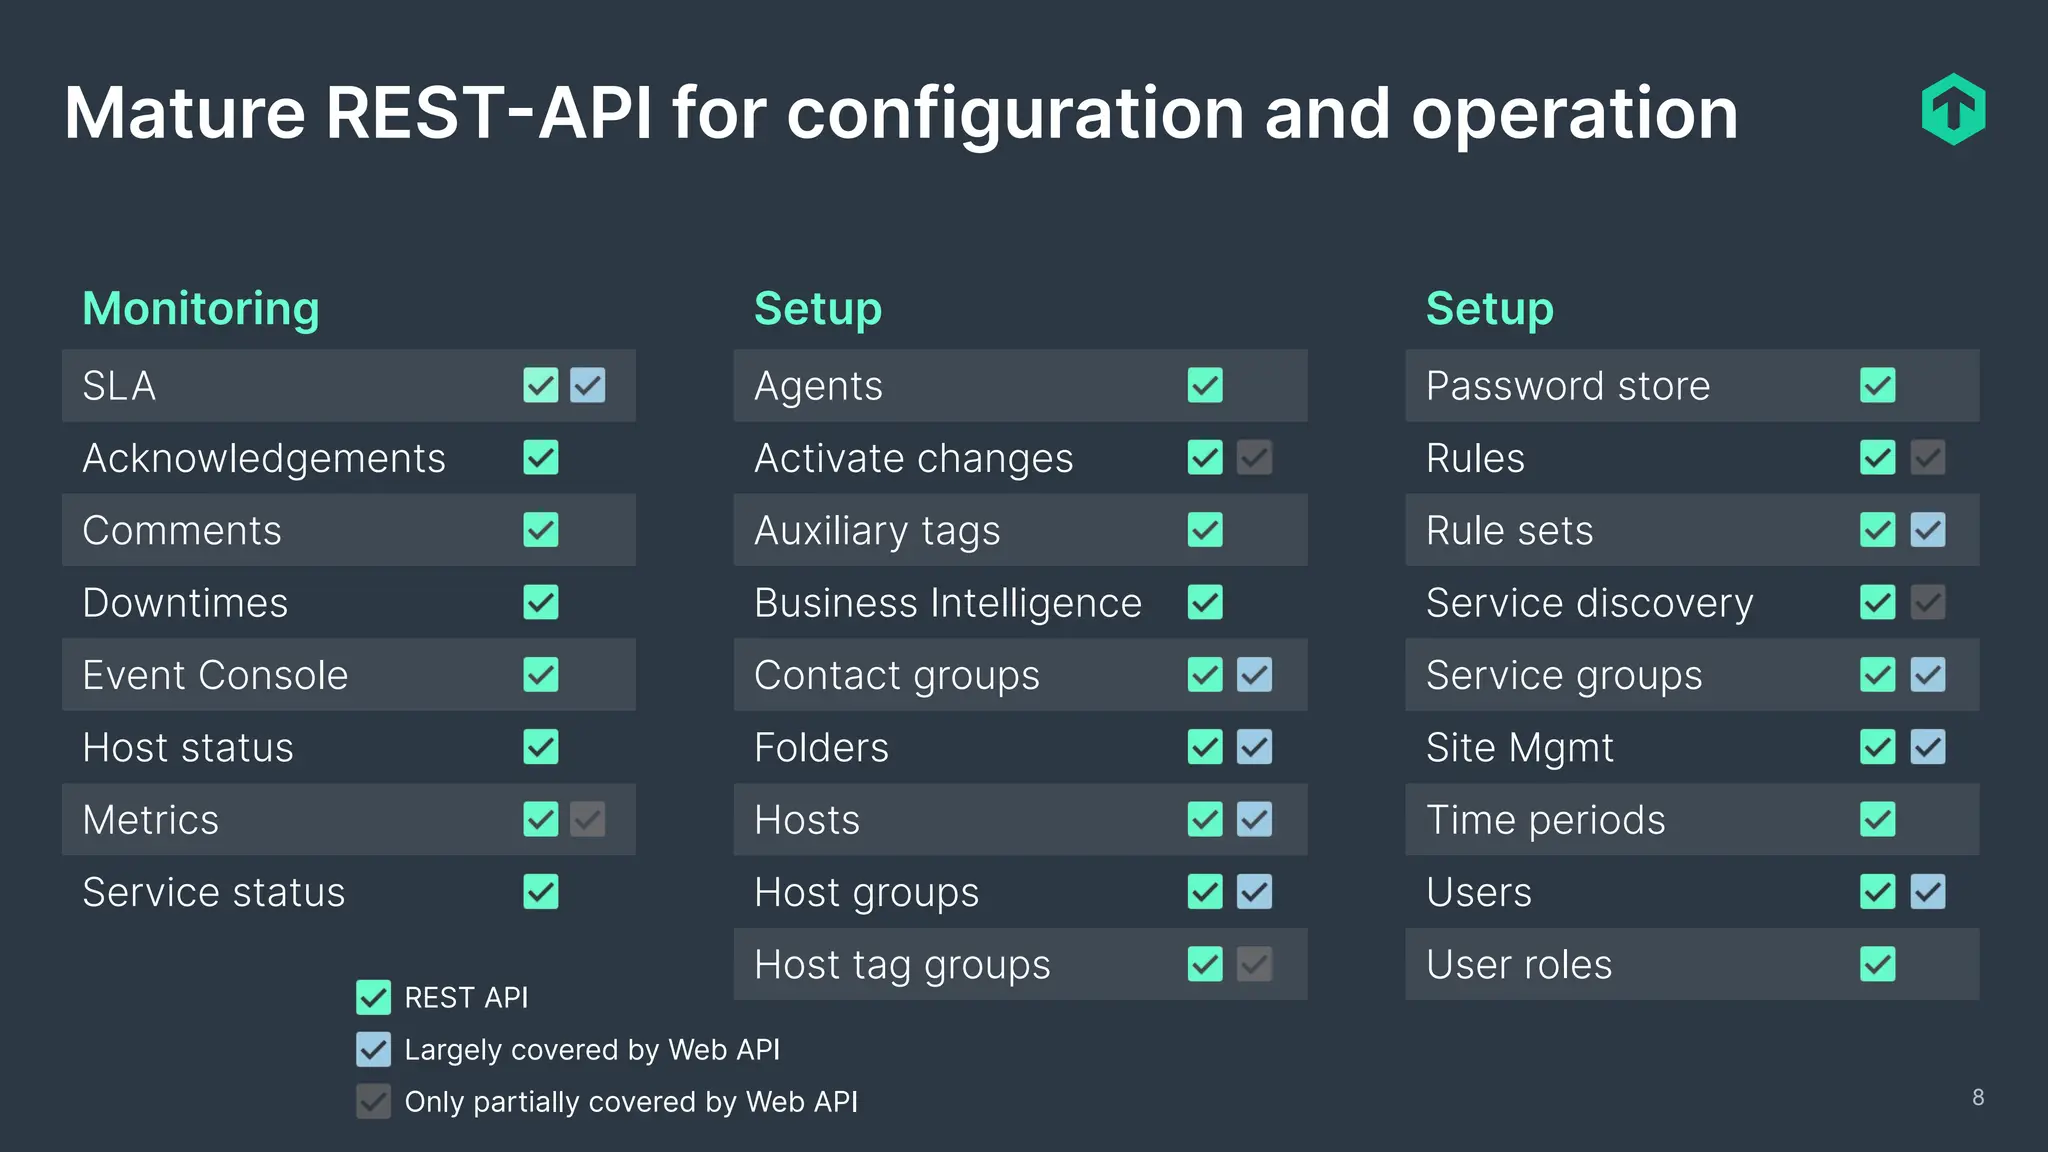

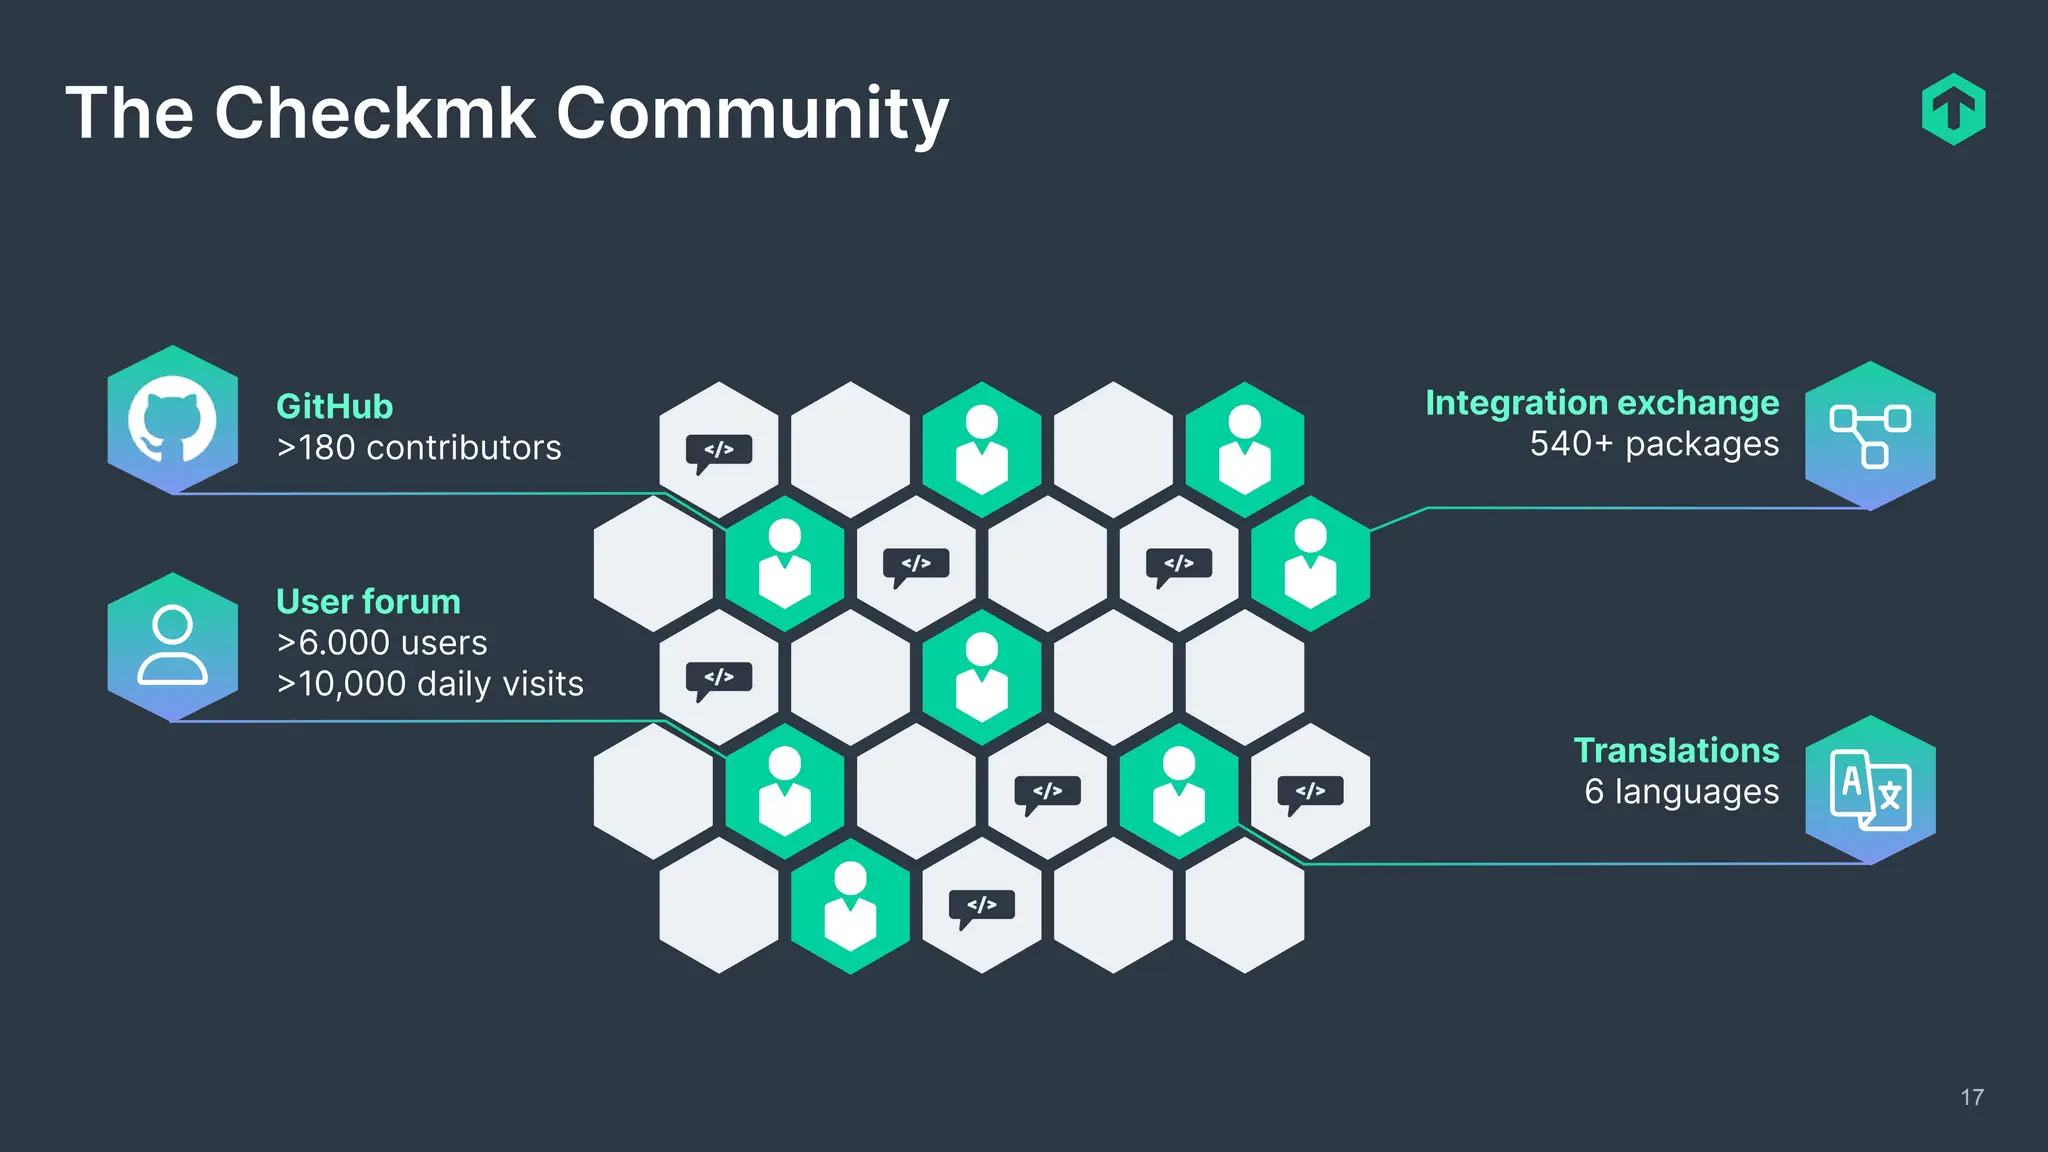

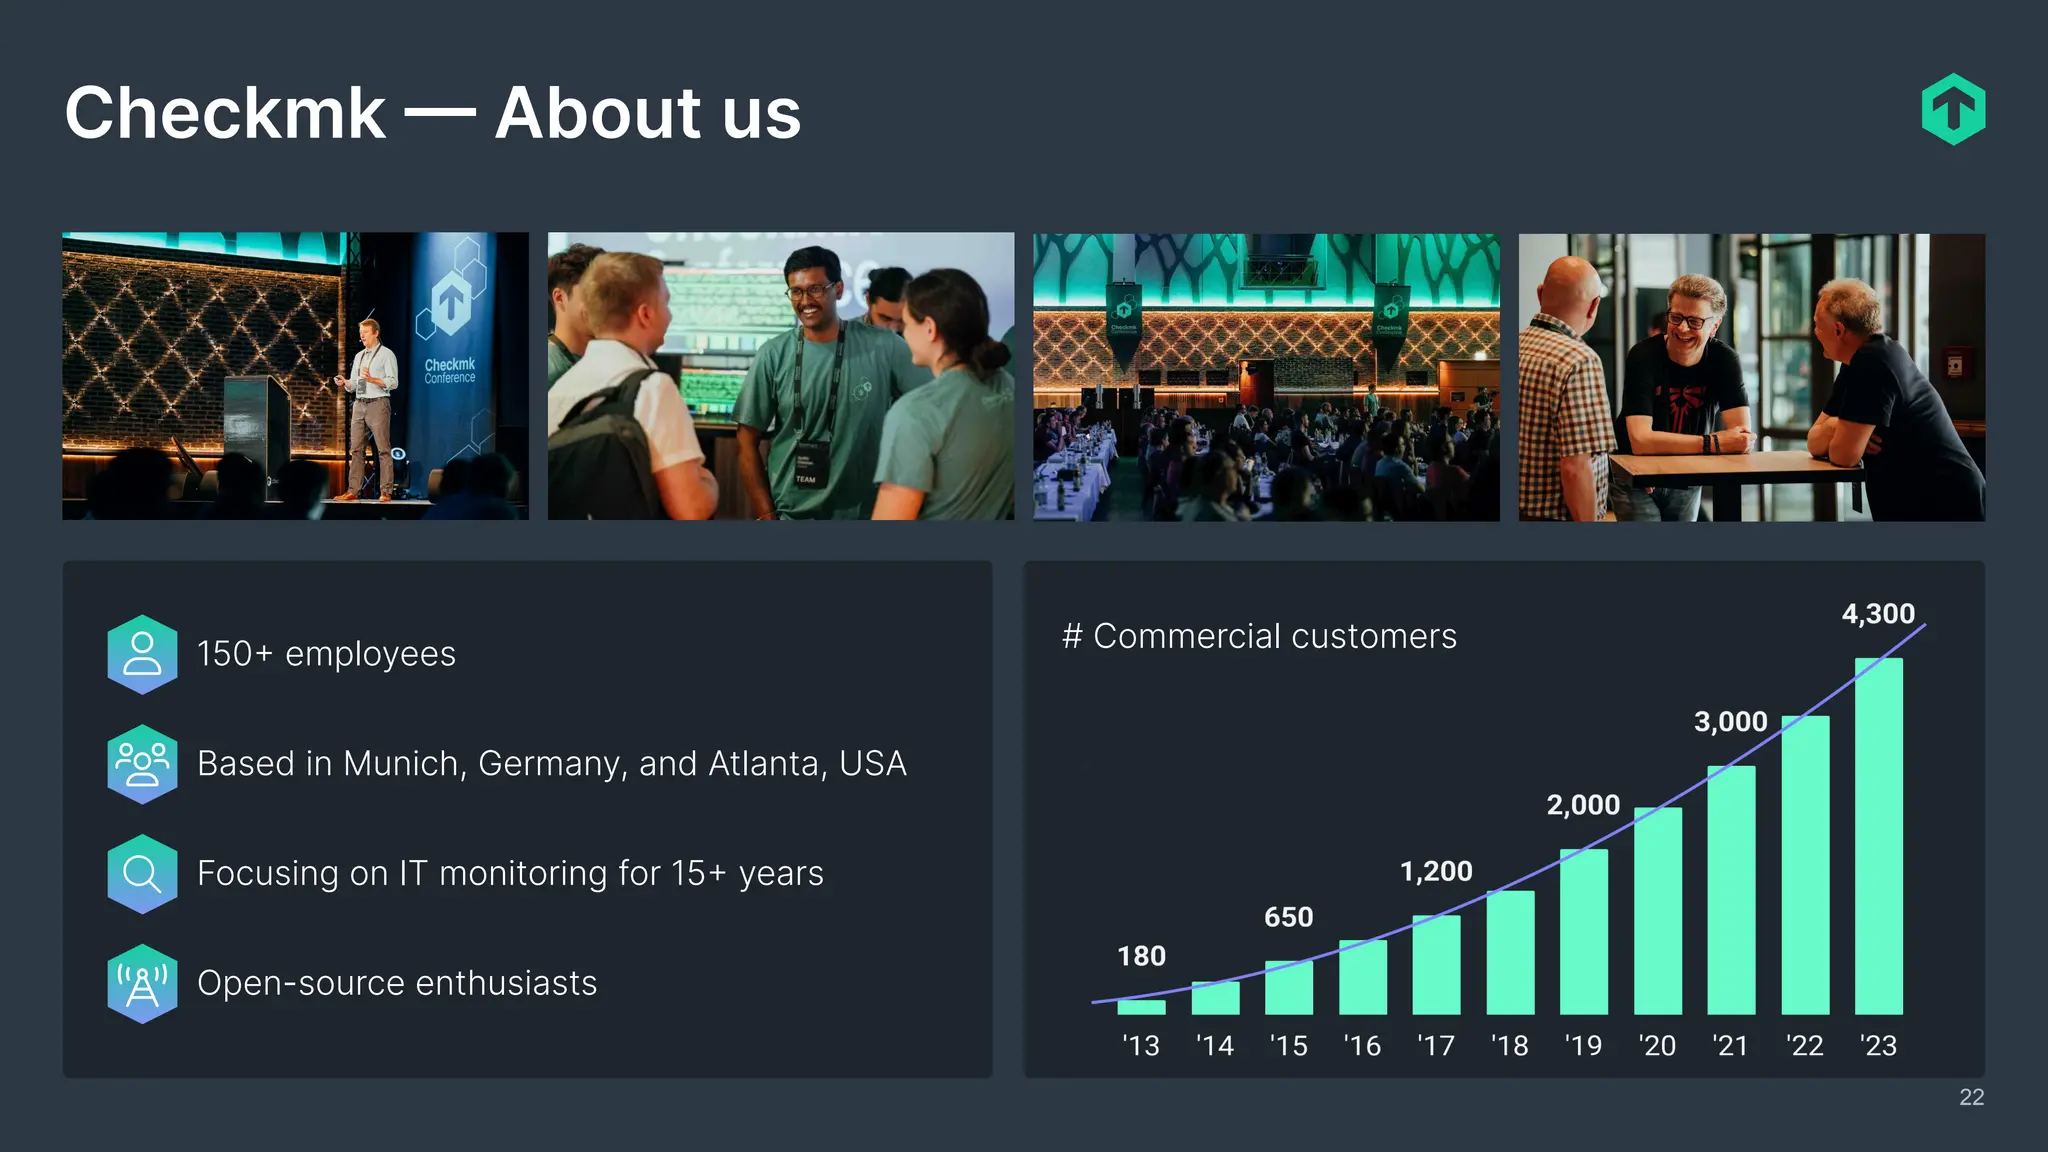
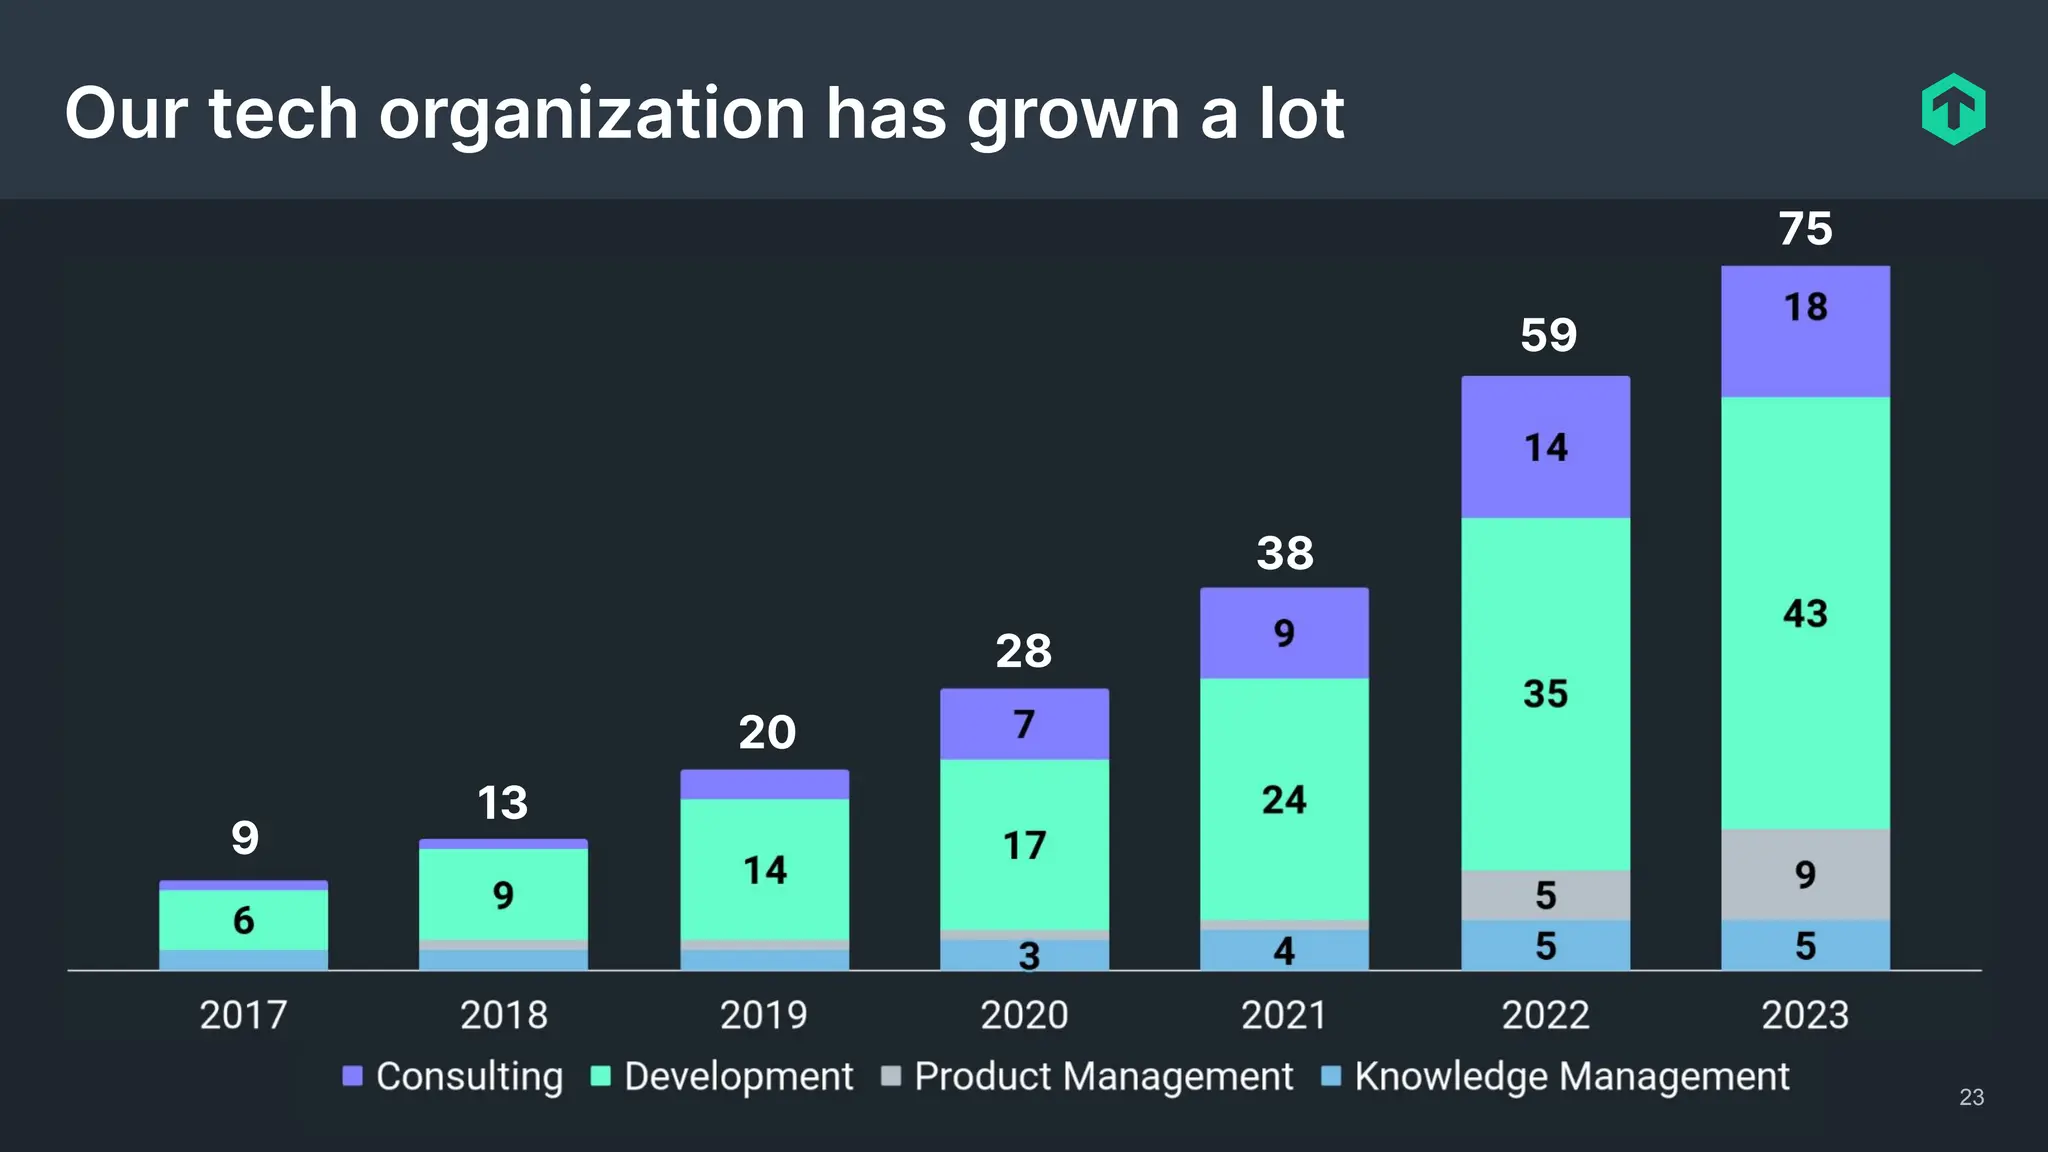

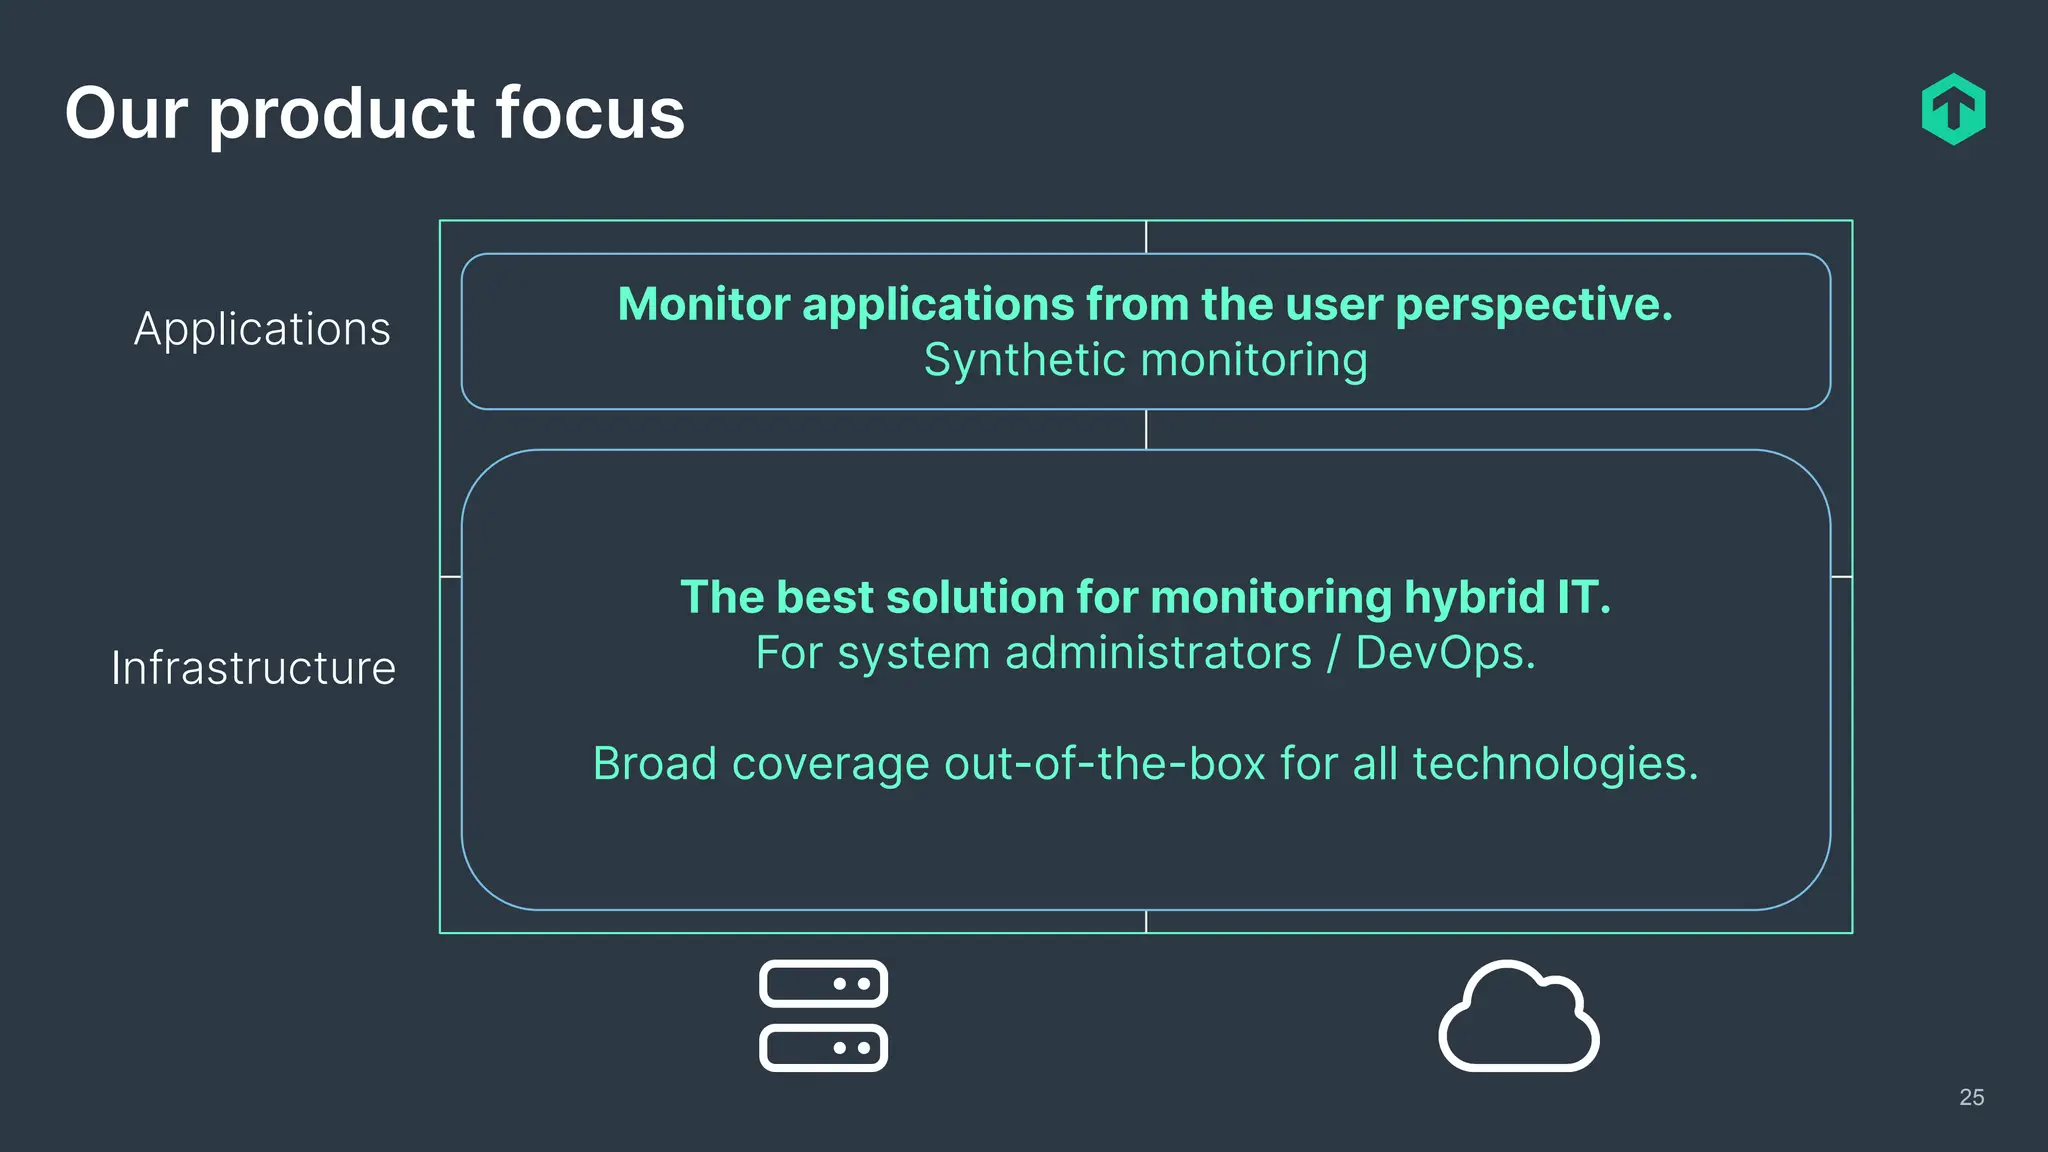
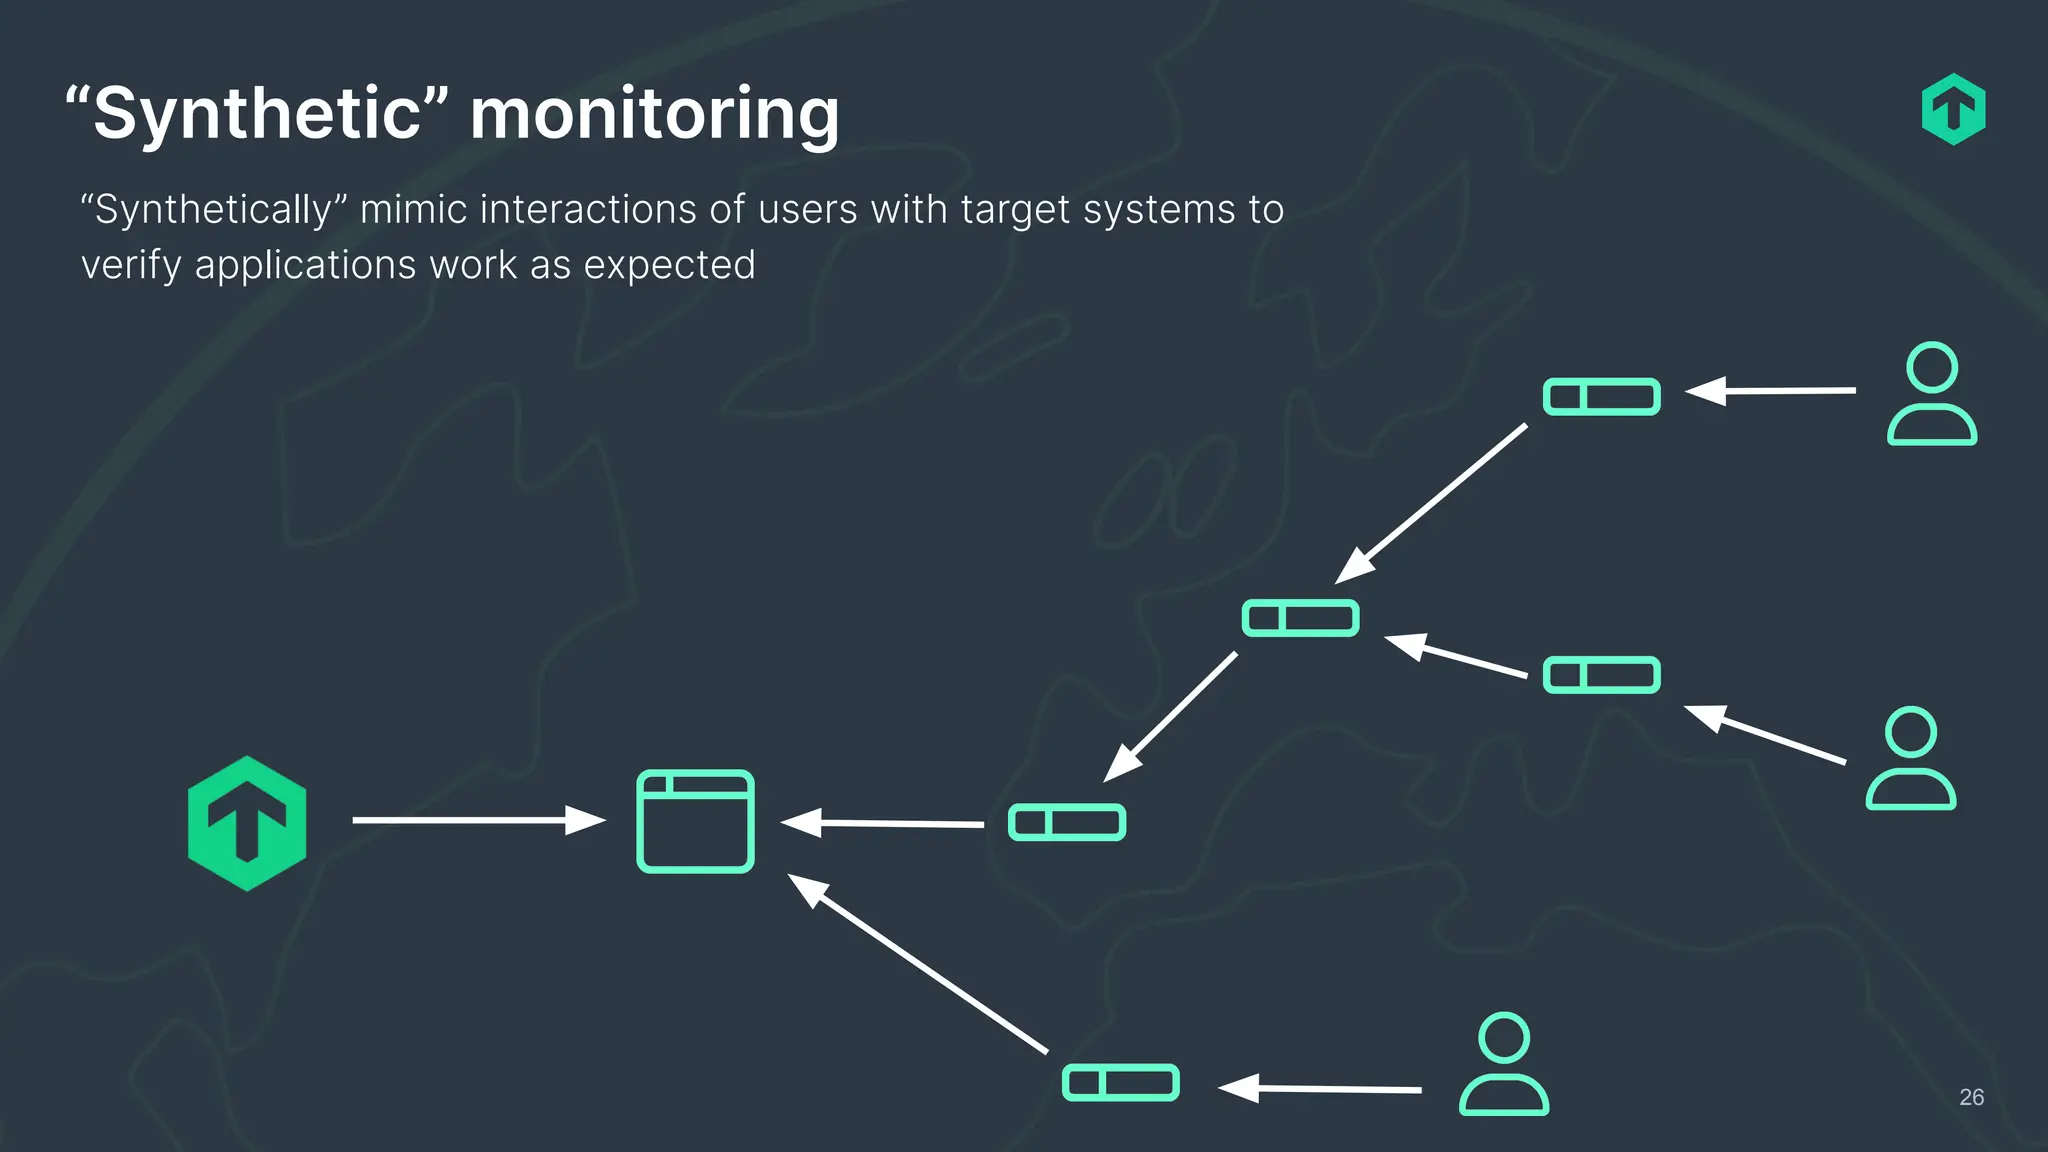
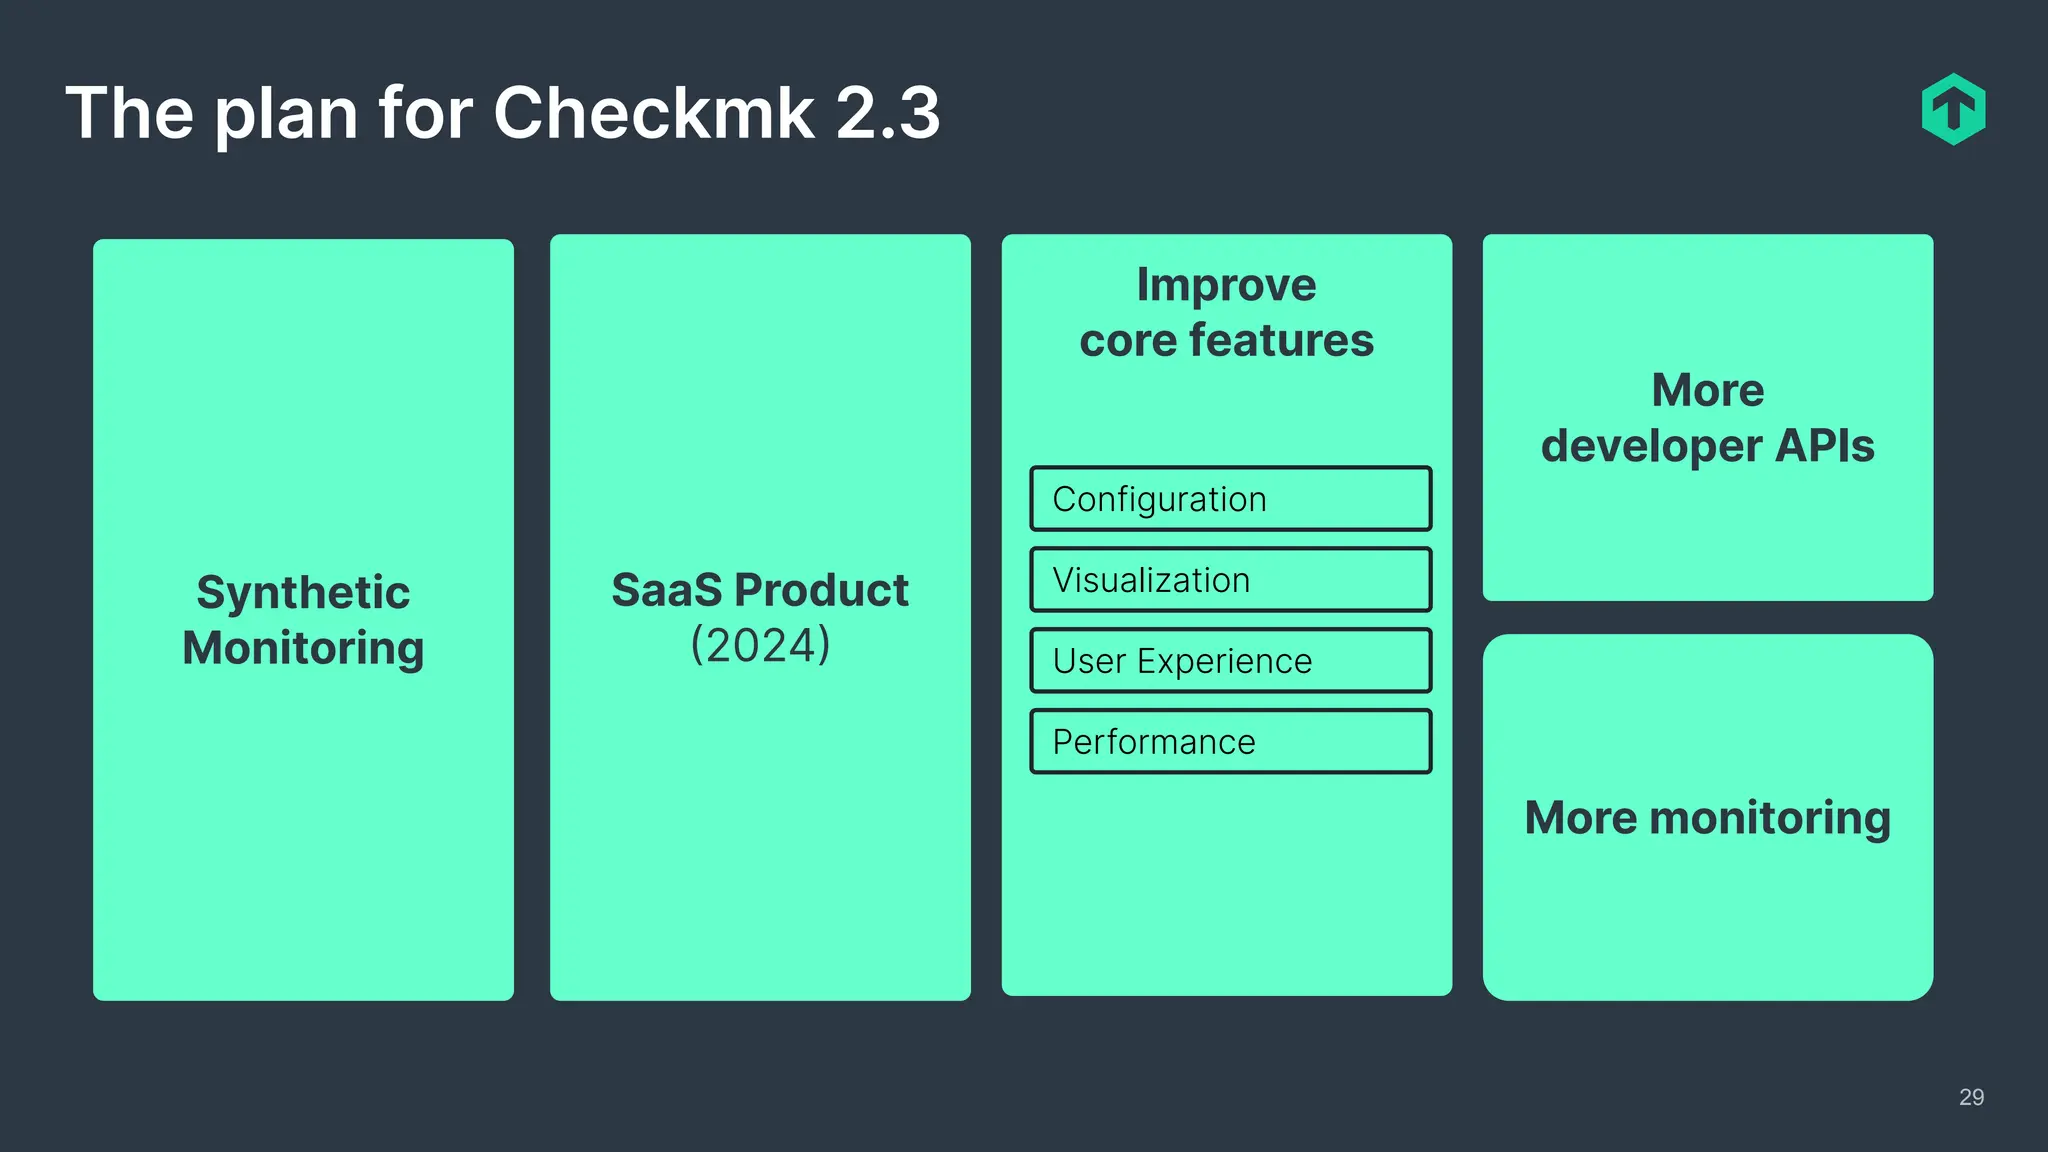


The document outlines the latest developments in Checkmk, an open-source IT monitoring solution since 2004, focusing on advancements in version 2.2 and enhancements like a new user interface, improved agent architecture, and new features for cloud and hybrid infrastructures. It emphasizes the Checkmk community's growth, with over 6,000 users and significant contributions from developers, including new plugins and integrations. Future directions for Checkmk include expanding monitoring capabilities and synthetic monitoring to improve application performance verification.


