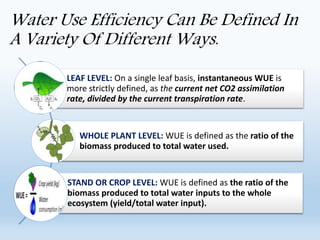
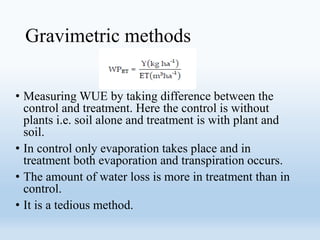
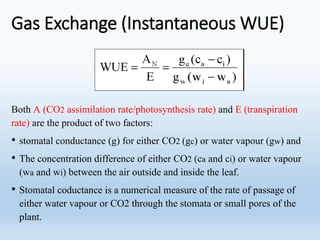
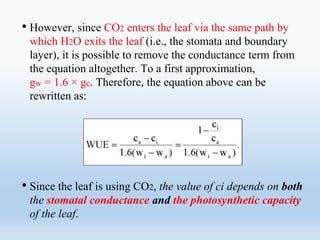
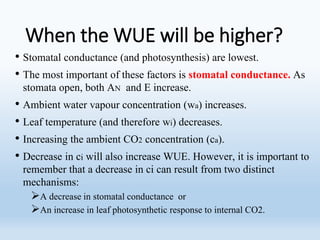
Water use efficiency (WUE) refers to the amount of plant material produced per unit of water used and can be measured at the leaf, plant, or ecosystem level. There are several approaches to measuring WUE including gravimetric methods, gas exchange measurements, carbon isotope discrimination analysis, and considerations of irrigation aspects. Higher WUE occurs when stomatal conductance and photosynthesis are lowest, ambient water vapor concentration is higher, leaf temperature is lower, or ambient CO2 concentration is increased. Studies have used relationships between WUE and carbon isotope discrimination to identify genotypes in crops like groundnuts and understand genetic control of WUE in plants like sunflower under drought conditions.
Management Practices for Improving Water Use Efficiency.pptxanju bala
Water use efficiency
Production (of crops) per unit of water applied.
Expressed in kg/ha-mm.
Two distinct terms are used in expressing water use efficiency:
Crop water use efficiency: It is the ratio of crop yield (Y) to the amount of water depleted by the crop in the process of evapotranspiration (ET).
Crop WUE = Y/ET
Field water use efficiency: It is the ratio of crop yield (Y) to the total amount of water used in the field (WR), which include ET, deep percolation and that used in plant metabolic processes.
Field WUE = Y/WR
describes the irrigation and irrigation requirements of different crops. this ppt also describes about different methods to measure the soil moisture availability.
Conservation tillage, Practices used in Conservation Tillagescience book
This is presentation on topic of Conservation Tillage, it gives You information about conservation tillage, types of conservation tillage, Practices used in conservation tillage. It enhanced Your knowledge about conservation tillage.
Foliar feeding is a technique of feeding plants by applying liquid fertilizer directly to their leaves. Plants are able to absorb essential elements through their leaves. The absorption takes place through their stomata and also through their epidermis.
Allelopathy is the chemical inhibition of one plant (or other organism) by another, due to the release into the environment of substances acting as germination or growth inhibitors.
Life Cycle Assessment of Wastewater Treatment Plant.pptxAbdulSameeu3
Life cycle assessment (LCA) has been proved to act as a desirable tool to evaluate the environmental
impacts of wastewater treatment plants (WWTPs). However, the application of LCA methodology in the
field of wastewater treatment is still in progress. This ppt has made a review of the LCA studies dealing
with biological (activated sludge) WWTPs, with the aim to provide qualitative interpretation of the
associated environmental impact categories: eutrophication potential, global warming potential,
toxicity-related impacts, energy balance, water use, land use and other impact categories.
Irrigation of Controlled Environment Crops for Increased Quality and Yield—Pa...METER Group, Inc. USA
Grow your crop steering expertise
Crop steering can optimize crop production and production costs, but to crop steer successfully, you need to do it right. You have to understand how to obtain the right soil water contents and soil electrical conductivities to either stress the crop or avoid stressing the crop in a controlled way. To do this, you’ll need to perform crop steering calculations.
Steer your way to higher quality, productivity, and profit
In part 3 of our greenhouse webinar series, Dr. Gaylon Campbell, internationally recognized soil physics and environmental measurement expert, teaches how to perform crop steering calculations that give you the information you need to stress or de-stress your crop at the right time and in the right way to achieve your goals. In this 30-minute webinar you’ll learn:
The water balance equation
- How to calculate the irrigation amount
- How to calculate the transpiration variables that affect recharge drainage, and changes in stored water
- How to determine the field capacity of the substrate
- Environmental factors that influence the water balance
- How to determine the leaching fraction
- How to manage substrate electrical conductivity
crop steering, environment, field capacity, gaylon campbell, indoor cultivation, irrigation, leaching fraction, substrate electrical conductivity, transpiration, water balance, webinar
Influence of Climatic Factors on the Δ13c Values of the C3, C4 And CAM Dicot ...QUESTJOURNAL
ABSTRACT: Species of the Centrospermeae occurring at different altitudes were analyzed for δ13C values and assigned for graphical representation. The aridity of the study area was evident as defined using the Klimadiagramm. Climatic data was studied and represented on graphs for interpretation. The frequency ofδ 13C values of the species at different altitudes, namely 500m a.s.l., 1000m a.s.l., 1500m a.s.l., 2000m a.s.l., 2500m a.s.l., 3000m a.s.l., 3500m a.s.l. and 4000m a.s.l., are presented on graphs. The data show thatδ13C values is a good predictor of spatial diversity and shift of the species along the altitudinal gradient of environmental factors.There is phenomenal trend such that δ13C values distribution along altitudinal differentiation the values of -10.60‰, to -16.65‰, -17.75‰ to -18.87‰, and -18.89‰ to -32.42‰ correspond to the species at low altitudes (0m a.s.l. – 1500m a.s.l.), intermediate altitude (1,550m a.s.l.-1,700m a.s.l.) and high altitude (1,800m a.s.l. – 4200m a.s.l.0, respectively. The inverse correlation between temperature and rainfall defines the causal climatic factors affecting C3 and C4 species along the altitudinal gradient. The occurrence of the transition zone between temperature and rainfall mirror that between the relative abundance of the C3 and C4 species along the altitude. This floristic data predict NAD-ME, NADP-ME AND PEP-CK types of monocot-dicot transition along the altitude with respect to bioproductivity in the tropics.
Alternative Usage Cases for Pressure Retarded Osmosis Power GenerationJoshua Benjamin, E.I.
These slides describe my current Doctoral research in Pressure Retarded Osmosis, where I demonstrate the applicability of the technology to desalination utilities in Tampa, Florida. While still in it's early stages, I hope to continue this project throughout my Doctoral Program. This talk was presented at the 2018 American Ecological Engineering Society Meeting in Houston, Texas.
Triple Green-Agricultural Management Interventions for a New Green RevolutionSIANI
This study was presented during the conference “Production and Carbon Dynamics in Sustainable Agricultural and Forest Systems in Africa” held in September, 2010.
Richard's aventures in two entangled wonderlandsRichard Gill
Since the loophole-free Bell experiments of 2020 and the Nobel prizes in physics of 2022, critics of Bell's work have retreated to the fortress of super-determinism. Now, super-determinism is a derogatory word - it just means "determinism". Palmer, Hance and Hossenfelder argue that quantum mechanics and determinism are not incompatible, using a sophisticated mathematical construction based on a subtle thinning of allowed states and measurements in quantum mechanics, such that what is left appears to make Bell's argument fail, without altering the empirical predictions of quantum mechanics. I think however that it is a smoke screen, and the slogan "lost in math" comes to my mind. I will discuss some other recent disproofs of Bell's theorem using the language of causality based on causal graphs. Causal thinking is also central to law and justice. I will mention surprising connections to my work on serial killer nurse cases, in particular the Dutch case of Lucia de Berk and the current UK case of Lucy Letby.
Seminar of U.V. Spectroscopy by SAMIR PANDASAMIR PANDA
Spectroscopy is a branch of science dealing the study of interaction of electromagnetic radiation with matter.
Ultraviolet-visible spectroscopy refers to absorption spectroscopy or reflect spectroscopy in the UV-VIS spectral region.
Ultraviolet-visible spectroscopy is an analytical method that can measure the amount of light received by the analyte.
(May 29th, 2024) Advancements in Intravital Microscopy- Insights for Preclini...Scintica Instrumentation
Intravital microscopy (IVM) is a powerful tool utilized to study cellular behavior over time and space in vivo. Much of our understanding of cell biology has been accomplished using various in vitro and ex vivo methods; however, these studies do not necessarily reflect the natural dynamics of biological processes. Unlike traditional cell culture or fixed tissue imaging, IVM allows for the ultra-fast high-resolution imaging of cellular processes over time and space and were studied in its natural environment. Real-time visualization of biological processes in the context of an intact organism helps maintain physiological relevance and provide insights into the progression of disease, response to treatments or developmental processes.
In this webinar we give an overview of advanced applications of the IVM system in preclinical research. IVIM technology is a provider of all-in-one intravital microscopy systems and solutions optimized for in vivo imaging of live animal models at sub-micron resolution. The system’s unique features and user-friendly software enables researchers to probe fast dynamic biological processes such as immune cell tracking, cell-cell interaction as well as vascularization and tumor metastasis with exceptional detail. This webinar will also give an overview of IVM being utilized in drug development, offering a view into the intricate interaction between drugs/nanoparticles and tissues in vivo and allows for the evaluation of therapeutic intervention in a variety of tissues and organs. This interdisciplinary collaboration continues to drive the advancements of novel therapeutic strategies.
Slide 1: Title Slide
Extrachromosomal Inheritance
Slide 2: Introduction to Extrachromosomal Inheritance
Definition: Extrachromosomal inheritance refers to the transmission of genetic material that is not found within the nucleus.
Key Components: Involves genes located in mitochondria, chloroplasts, and plasmids.
Slide 3: Mitochondrial Inheritance
Mitochondria: Organelles responsible for energy production.
Mitochondrial DNA (mtDNA): Circular DNA molecule found in mitochondria.
Inheritance Pattern: Maternally inherited, meaning it is passed from mothers to all their offspring.
Diseases: Examples include Leber’s hereditary optic neuropathy (LHON) and mitochondrial myopathy.
Slide 4: Chloroplast Inheritance
Chloroplasts: Organelles responsible for photosynthesis in plants.
Chloroplast DNA (cpDNA): Circular DNA molecule found in chloroplasts.
Inheritance Pattern: Often maternally inherited in most plants, but can vary in some species.
Examples: Variegation in plants, where leaf color patterns are determined by chloroplast DNA.
Slide 5: Plasmid Inheritance
Plasmids: Small, circular DNA molecules found in bacteria and some eukaryotes.
Features: Can carry antibiotic resistance genes and can be transferred between cells through processes like conjugation.
Significance: Important in biotechnology for gene cloning and genetic engineering.
Slide 6: Mechanisms of Extrachromosomal Inheritance
Non-Mendelian Patterns: Do not follow Mendel’s laws of inheritance.
Cytoplasmic Segregation: During cell division, organelles like mitochondria and chloroplasts are randomly distributed to daughter cells.
Heteroplasmy: Presence of more than one type of organellar genome within a cell, leading to variation in expression.
Slide 7: Examples of Extrachromosomal Inheritance
Four O’clock Plant (Mirabilis jalapa): Shows variegated leaves due to different cpDNA in leaf cells.
Petite Mutants in Yeast: Result from mutations in mitochondrial DNA affecting respiration.
Slide 8: Importance of Extrachromosomal Inheritance
Evolution: Provides insight into the evolution of eukaryotic cells.
Medicine: Understanding mitochondrial inheritance helps in diagnosing and treating mitochondrial diseases.
Agriculture: Chloroplast inheritance can be used in plant breeding and genetic modification.
Slide 9: Recent Research and Advances
Gene Editing: Techniques like CRISPR-Cas9 are being used to edit mitochondrial and chloroplast DNA.
Therapies: Development of mitochondrial replacement therapy (MRT) for preventing mitochondrial diseases.
Slide 10: Conclusion
Summary: Extrachromosomal inheritance involves the transmission of genetic material outside the nucleus and plays a crucial role in genetics, medicine, and biotechnology.
Future Directions: Continued research and technological advancements hold promise for new treatments and applications.
Slide 11: Questions and Discussion
Invite Audience: Open the floor for any questions or further discussion on the topic.
Richard's entangled aventures in wonderlandRichard Gill
Since the loophole-free Bell experiments of 2020 and the Nobel prizes in physics of 2022, critics of Bell's work have retreated to the fortress of super-determinism. Now, super-determinism is a derogatory word - it just means "determinism". Palmer, Hance and Hossenfelder argue that quantum mechanics and determinism are not incompatible, using a sophisticated mathematical construction based on a subtle thinning of allowed states and measurements in quantum mechanics, such that what is left appears to make Bell's argument fail, without altering the empirical predictions of quantum mechanics. I think however that it is a smoke screen, and the slogan "lost in math" comes to my mind. I will discuss some other recent disproofs of Bell's theorem using the language of causality based on causal graphs. Causal thinking is also central to law and justice. I will mention surprising connections to my work on serial killer nurse cases, in particular the Dutch case of Lucia de Berk and the current UK case of Lucy Letby.
Cancer cell metabolism: special Reference to Lactate PathwayAADYARAJPANDEY1
Normal Cell Metabolism:
Cellular respiration describes the series of steps that cells use to break down sugar and other chemicals to get the energy we need to function.
Energy is stored in the bonds of glucose and when glucose is broken down, much of that energy is released.
Cell utilize energy in the form of ATP.
The first step of respiration is called glycolysis. In a series of steps, glycolysis breaks glucose into two smaller molecules - a chemical called pyruvate. A small amount of ATP is formed during this process.
Most healthy cells continue the breakdown in a second process, called the Kreb's cycle. The Kreb's cycle allows cells to “burn” the pyruvates made in glycolysis to get more ATP.
The last step in the breakdown of glucose is called oxidative phosphorylation (Ox-Phos).
It takes place in specialized cell structures called mitochondria. This process produces a large amount of ATP. Importantly, cells need oxygen to complete oxidative phosphorylation.
If a cell completes only glycolysis, only 2 molecules of ATP are made per glucose. However, if the cell completes the entire respiration process (glycolysis - Kreb's - oxidative phosphorylation), about 36 molecules of ATP are created, giving it much more energy to use.
IN CANCER CELL:
Unlike healthy cells that "burn" the entire molecule of sugar to capture a large amount of energy as ATP, cancer cells are wasteful.
Cancer cells only partially break down sugar molecules. They overuse the first step of respiration, glycolysis. They frequently do not complete the second step, oxidative phosphorylation.
This results in only 2 molecules of ATP per each glucose molecule instead of the 36 or so ATPs healthy cells gain. As a result, cancer cells need to use a lot more sugar molecules to get enough energy to survive.
introduction to WARBERG PHENOMENA:
WARBURG EFFECT Usually, cancer cells are highly glycolytic (glucose addiction) and take up more glucose than do normal cells from outside.
Otto Heinrich Warburg (; 8 October 1883 – 1 August 1970) In 1931 was awarded the Nobel Prize in Physiology for his "discovery of the nature and mode of action of the respiratory enzyme.
WARNBURG EFFECT : cancer cells under aerobic (well-oxygenated) conditions to metabolize glucose to lactate (aerobic glycolysis) is known as the Warburg effect. Warburg made the observation that tumor slices consume glucose and secrete lactate at a higher rate than normal tissues.
A brief information about the SCOP protein database used in bioinformatics.
The Structural Classification of Proteins (SCOP) database is a comprehensive and authoritative resource for the structural and evolutionary relationships of proteins. It provides a detailed and curated classification of protein structures, grouping them into families, superfamilies, and folds based on their structural and sequence similarities.
Observation of Io’s Resurfacing via Plume Deposition Using Ground-based Adapt...Sérgio Sacani
Since volcanic activity was first discovered on Io from Voyager images in 1979, changes
on Io’s surface have been monitored from both spacecraft and ground-based telescopes.
Here, we present the highest spatial resolution images of Io ever obtained from a groundbased telescope. These images, acquired by the SHARK-VIS instrument on the Large
Binocular Telescope, show evidence of a major resurfacing event on Io’s trailing hemisphere. When compared to the most recent spacecraft images, the SHARK-VIS images
show that a plume deposit from a powerful eruption at Pillan Patera has covered part
of the long-lived Pele plume deposit. Although this type of resurfacing event may be common on Io, few have been detected due to the rarity of spacecraft visits and the previously low spatial resolution available from Earth-based telescopes. The SHARK-VIS instrument ushers in a new era of high resolution imaging of Io’s surface using adaptive
optics at visible wavelengths.
Nutraceutical market, scope and growth: Herbal drug technologyLokesh Patil
As consumer awareness of health and wellness rises, the nutraceutical market—which includes goods like functional meals, drinks, and dietary supplements that provide health advantages beyond basic nutrition—is growing significantly. As healthcare expenses rise, the population ages, and people want natural and preventative health solutions more and more, this industry is increasing quickly. Further driving market expansion are product formulation innovations and the use of cutting-edge technology for customized nutrition. With its worldwide reach, the nutraceutical industry is expected to keep growing and provide significant chances for research and investment in a number of categories, including vitamins, minerals, probiotics, and herbal supplements.
2. CONTENT
•WUE – definitions
•Approaches
i. Gravimetric
ii. Gas Exchange
iii. Irrigation aspects
iv. Carbon isotope discrimination
•Higher WUE ?
•Application
•Examples
3. WATER USE EFFICIENCY
• Amount of water used per unit of plant material produced.
DEFINITIONS
Agronomists define it in terms of the units of water used per unit of dry matter
produced, often using total water lost by both evaporation and transpiration
(Teare et al., 1973)
Dry matter or crop yield in kg
Water used in evapotranspiration in m3
Physiologists are more likely to discuss it in terms of photosynthesis, expressed as
milligrams of CO2 per gram of water or even as moles of CO2 per mole of water
(Fischer and Turner, 1978).
Net CO2 uptake in mg or gm
H2O loss(transpired) in gm or kg
WUE =
WUE =
4. Water Use Efficiency Can Be Defined In
A Variety Of Different Ways.
LEAF LEVEL: On a single leaf basis, instantaneous WUE is
more strictly defined, as the current net CO2 assimilation
rate, divided by the current transpiration rate.
WHOLE PLANT LEVEL: WUE is defined as the ratio of the
biomass produced to total water used.
STAND OR CROP LEVEL: WUE is defined as the ratio of the
biomass produced to total water inputs to the whole
ecosystem (yield/total water input).
6. Gravimetric methods
• Measuring WUE by taking difference between the
control and treatment. Here the control is without
plants i.e. soil alone and treatment is with plant and
soil.
• In control only evaporation takes place and in
treatment both evaporation and transpiration occurs.
• The amount of water loss is more in treatment than in
control.
• It is a tedious method.
7. Gas Exchange (Instantaneous WUE)
Both A (CO2 assimilation rate/photosynthesis rate) and E (transpiration
rate) are the product of two factors:
• stomatal conductance (g) for either CO2 (gc) or water vapour (gw) and
• The concentration difference of either CO2 (ca and ci) or water vapour
(wa and wi) between the air outside and inside the leaf.
• Stomatal coductance is a numerical measure of the rate of passage of
either water vapour or CO2 through the stomata or small pores of the
plant.
8. • However, since CO2 enters the leaf via the same path by
which H2O exits the leaf (i.e., the stomata and boundary
layer), it is possible to remove the conductance term from
the equation altogether. To a first approximation,
gw = 1.6 × gc. Therefore, the equation above can be
rewritten as:
• Since the leaf is using CO2, the value of ci depends on both
the stomatal conductance and the photosynthetic capacity
of the leaf.
9. • High Δ values resulting from high Ci/Ca reflect
higher CO2 assimilation rate to transpiration ratio
(Farquhar et al., 1989), i.e., lower TE.
10. • Ci inversely proportional to WUE
• Lesser the value of Ci i.e., minimum stomatal
conductance(gs) and maximum mesophyll
conductance(gm)
• Stomatal conductance is the measure of either exit
of water or CO2 entry through the stomata.
• Mesophyll conductance is the level of CO2 inside
the chloroplast where photosynthesis take place to
fix atmospheric CO2
11. • Water use efficiency also increases with increase in crop water supply
up to a certain point.
• Water supply has also been observed to increase fertilizer use efficiency
by increasing the availability of applied nutrients, and water and
nutrients exhibit interactions in respect of yield and yield components.
• The irrigation system perspective of water use efficiency depends upon
the water accounting where,
Losses occur at each stage as water moves from the reservoir
(storage losses)
Conveyed and delivered at the farm gate (conveyance losses)
Applied to the farm (distribution losses)
Stored in the soil (application losses) and
Finally consumed by the crops (crop management losses) for crop
production.
12. Measurements Based On Irrigation Aspects
• Depending upon the area of interest, it is possible to measure the
Field water use efficiency
Crop water use efficiency
Water conveyance efficiency
Application efficiency
WUE (kg/ha-cm or q/ha-cm or kg/ha-mm)
1. Crop Water Use Efficiency /Consumptive Water Use Efficiency:
CWUE = Y/CU
2. Field Water Use Efficiency:
FWUE = Y/WR
Where,
G + E + T + D = WR; (G + E + T) = CU
Growth (G)
Direct evaporation from the soil surface (E)
Transpiration (T)
Deep percolation loss (D)
13. 3. Water conveyance efficiency:
Ec=Wf/Wd x 100
Wf= Water delivered at the field supply channel
Wd= Water diverted from the source.
4. Water application efficiency :
Ea = Ws/Wf x 100
Ws= Water stored in the root zone of the plants
Wf= Water delivered to the field
14. WUE And Carbon Isotope Discrimination
• The efficacy of the use of 13C as an indicator of WUE, has been
firmly established under both greenhouse and field conditions.
• CO2 in air naturally contains two stable isotopes of carbon, 12C and
13C, in an approximate of 99% to 1 %.
• The theoretical model describing fractionation during photosynthesis
was developed by Farquhar et uf. ( 1989).
∆= a + (b-a)ci/ca
Where ∆ represents the total difference in isotopic composition
between photosynthetically fixed carbon in the atmosphere
a and b are the fractionation constants associated with diffusion
versus carboxylation and have values of 4.4 and 27‰(per mill),
respectively
15. IRMS
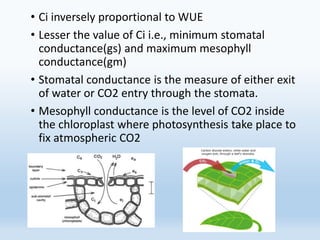
• The carbon isotopic ratio (R=13C/12C) of the samples (Rsample)
and standard (Rstandard) was determined using an Isotope Ratio
Mass Spectrometer (GD 150, MAT, Germany). R values were
converted to δ13C (in ‰ or per mil) using the relationship:
δ13C (‰) = [Rsample/Rstandard-1] x 1000.
• The standard is the CO2 obtained from a limestone from Pee Dee
Belmenite “PDB” formation in South Carolina, USA. The δ13C
values were converted to carbon isotope discrimination (Δ) values
using the relationship established by Farquhar et al., (1989):
Δ (‰) = (δ13Ca - δ13Cp) /(1 - δ13Cp/1000) ,
• where a and p represent air and plant, respectively.
17. WUE and carbon isotope
discrimination are
negatively related i.e.
lesser the discrimination
more will be the WUE
18. • The difference in ratio (13C/12C) between C3 and
C4 is correlated with isotopic fractionation present
between the ribulose biphosphate carboxlase
(RuBP) activity in C3 plants and
phosphoenolpyruvate (PEP) carboxylase activity in
C4 plants.
• RuBP discriminates more against 13C than PEP
(Christeller et al., 1976).
• This indicates that why C4 plants are more efficient
than C3 plants.
19. When the WUE will be higher?
• Stomatal conductance (and photosynthesis) are lowest.
• The most important of these factors is stomatal conductance. As
stomata open, both AN and E increase.
• Ambient water vapour concentration (wa) increases.
• Leaf temperature (and therefore wi) decreases.
• Increasing the ambient CO2 concentration (ca).
• Decrease in ci will also increase WUE. However, it is important to
remember that a decrease in ci can result from two distinct
mechanisms:
A decrease in stomatal conductance or
An increase in leaf photosynthetic response to internal CO2.
20. A decrease in stomatal conductance & an increase in
WUE
21. Application
A study in Groundnut genotypes by
Farquhar et.al.
• The relationship between WUE and Carbon isotope discrimination
was useful in identifying the groundnut genotypes.
• WUE ranged from 1.81 to 3.15g/kg which was negatively correlated
with Δ which ranged from 19.1 to 21.8%.
• Variation in WUE arose mainly from genotypic differences in Total
dry matter production rather than differences in water use.
• Finally it is concluded that a strong negative relationship existed
between WUE and SLA (cm/g) and between Δ ad SLA, indicating
that genotypes with thicker leaves had greater WUE.
22. Genetic Control of Water Use Efficiency and Leaf Carbon Isotope
Discrimination in Sunflower (Helianthus annuus L.) Subjected to Two
Drought Scenarios by Afifuddin Latif Adiredjo et.al.
• A population of 148 recombinant inbred lines (RILs) o sunflower derived from a
cross between XRQ and PSC8 lines was studied to identify quantitative trait loci
(QTL) controlling WUE and CID, and to compare QTL associated with these traits
in different drought scenarios.
• They conducted greenhouse experiments in 2011 and 2012 by using 100 balances
which provided a daily measurement of water transpired, and they determined
WUE, CID, biomass and cumulative water transpired by plants.
• Wide phenotypic variability, significant genotypic effects, and significant negative
correlations between WUE and CID were observed in both experiments.
23. • C3 crops, such as wheat and barley, are less water-efficient than
C4 crops, such as maize and sugarcane.
• The most water-efficient crops are the CAM (Crassulacean acid
metabolism) crops such as cactus and pineapple (xerophytes).
• WUE : CAM> C4> C3
24. REFERENCE
• Sharma,B.,Molden,D.,Cook,S. Water use efficiency in agriculture: Measurement,
current situation and trends.
• Boutraa,T., Akhkha,A., Abdulkhaliq A. Al-Shoaibi Ali and Alhejeli,M. (2010)
Effect of water stress on growth and water use efficiency (WUE) of some wheat
cultivars (Triticum durum) grown in Saudi Arabia.
• GUO Shi-wei, ZHOU Yi, SONG Na, SHEN Qi-rong (2006) Some Physiological
Processes Related to Water Use Efficiency of Higher Plants.
• Nemali,K.S.,(2008) Physiological Responses to Different Substrate Water
Contents: Screening for High Water-use Efficiency in Bedding Plants.
• Grossnickle,S.C.(2005) Variation in gas exchange and water use efficiency
patterns among populations of western redcedar.