Downloaded 372 times


![BASIS OF WATER AUDITING
It is based on the Continuity Equation
INCOMING = OUTGOING
Water Balance Equation:-
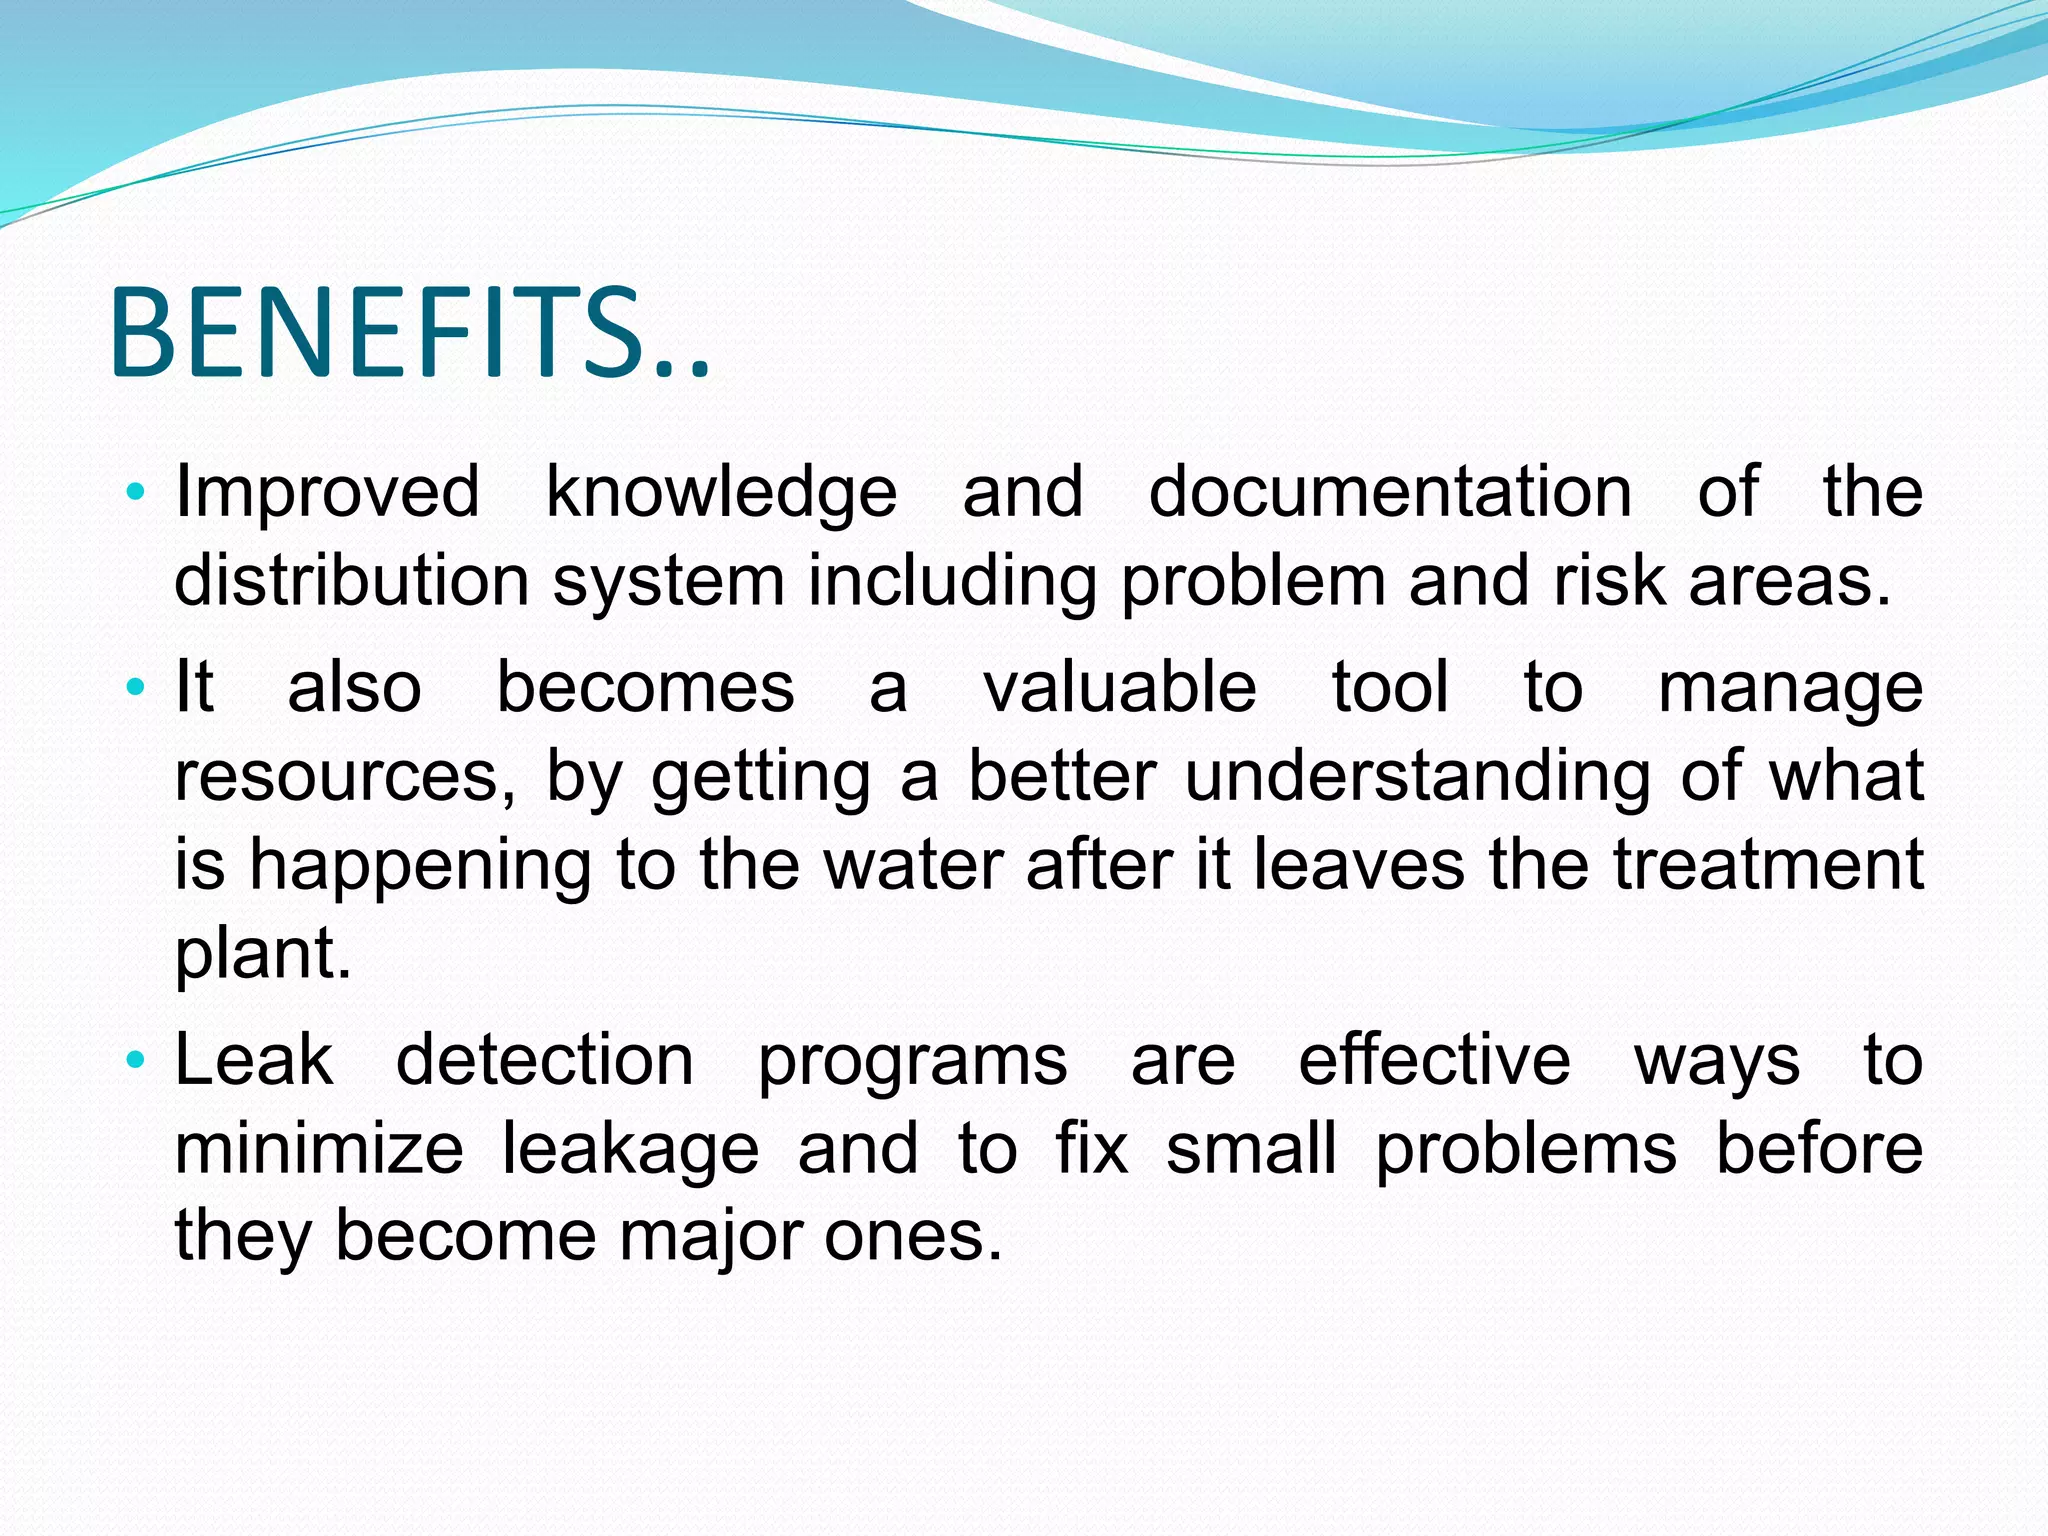
System input volume:- the annual volume input to a
transmission and/or a distribution system, including
water exported to other supply systems.
SIV = [Actual consumption] + [ Losses ]](https://image.slidesharecdn.com/waterauditing-140222160205-phpapp02/75/Water-auditing-9-2048.jpg)

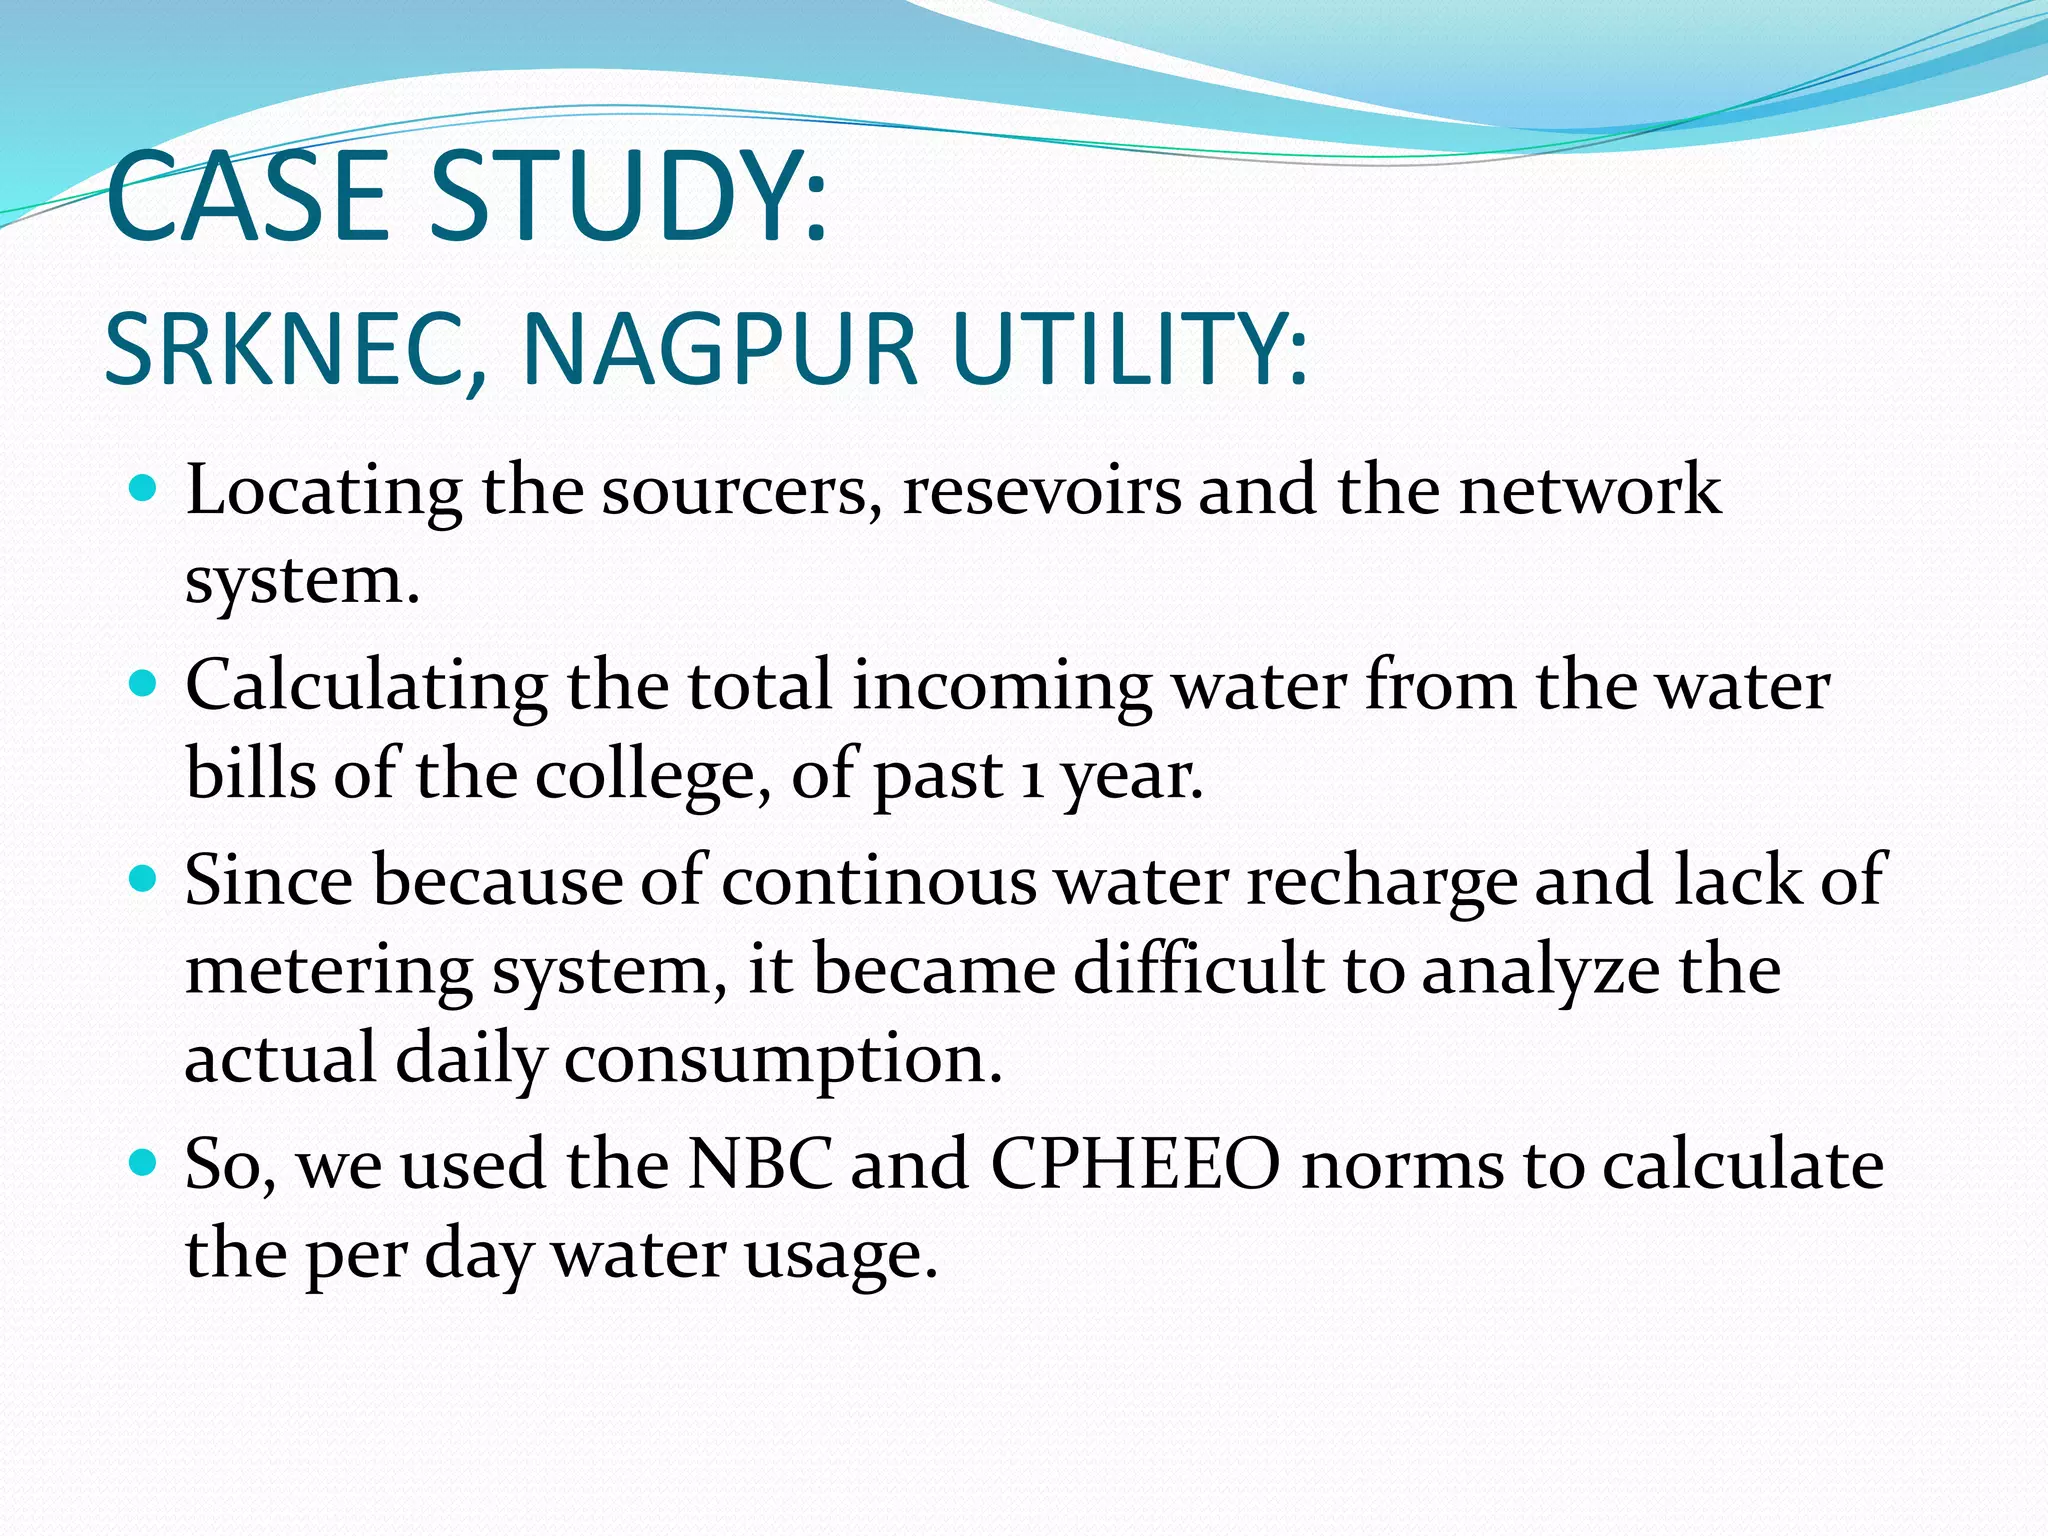


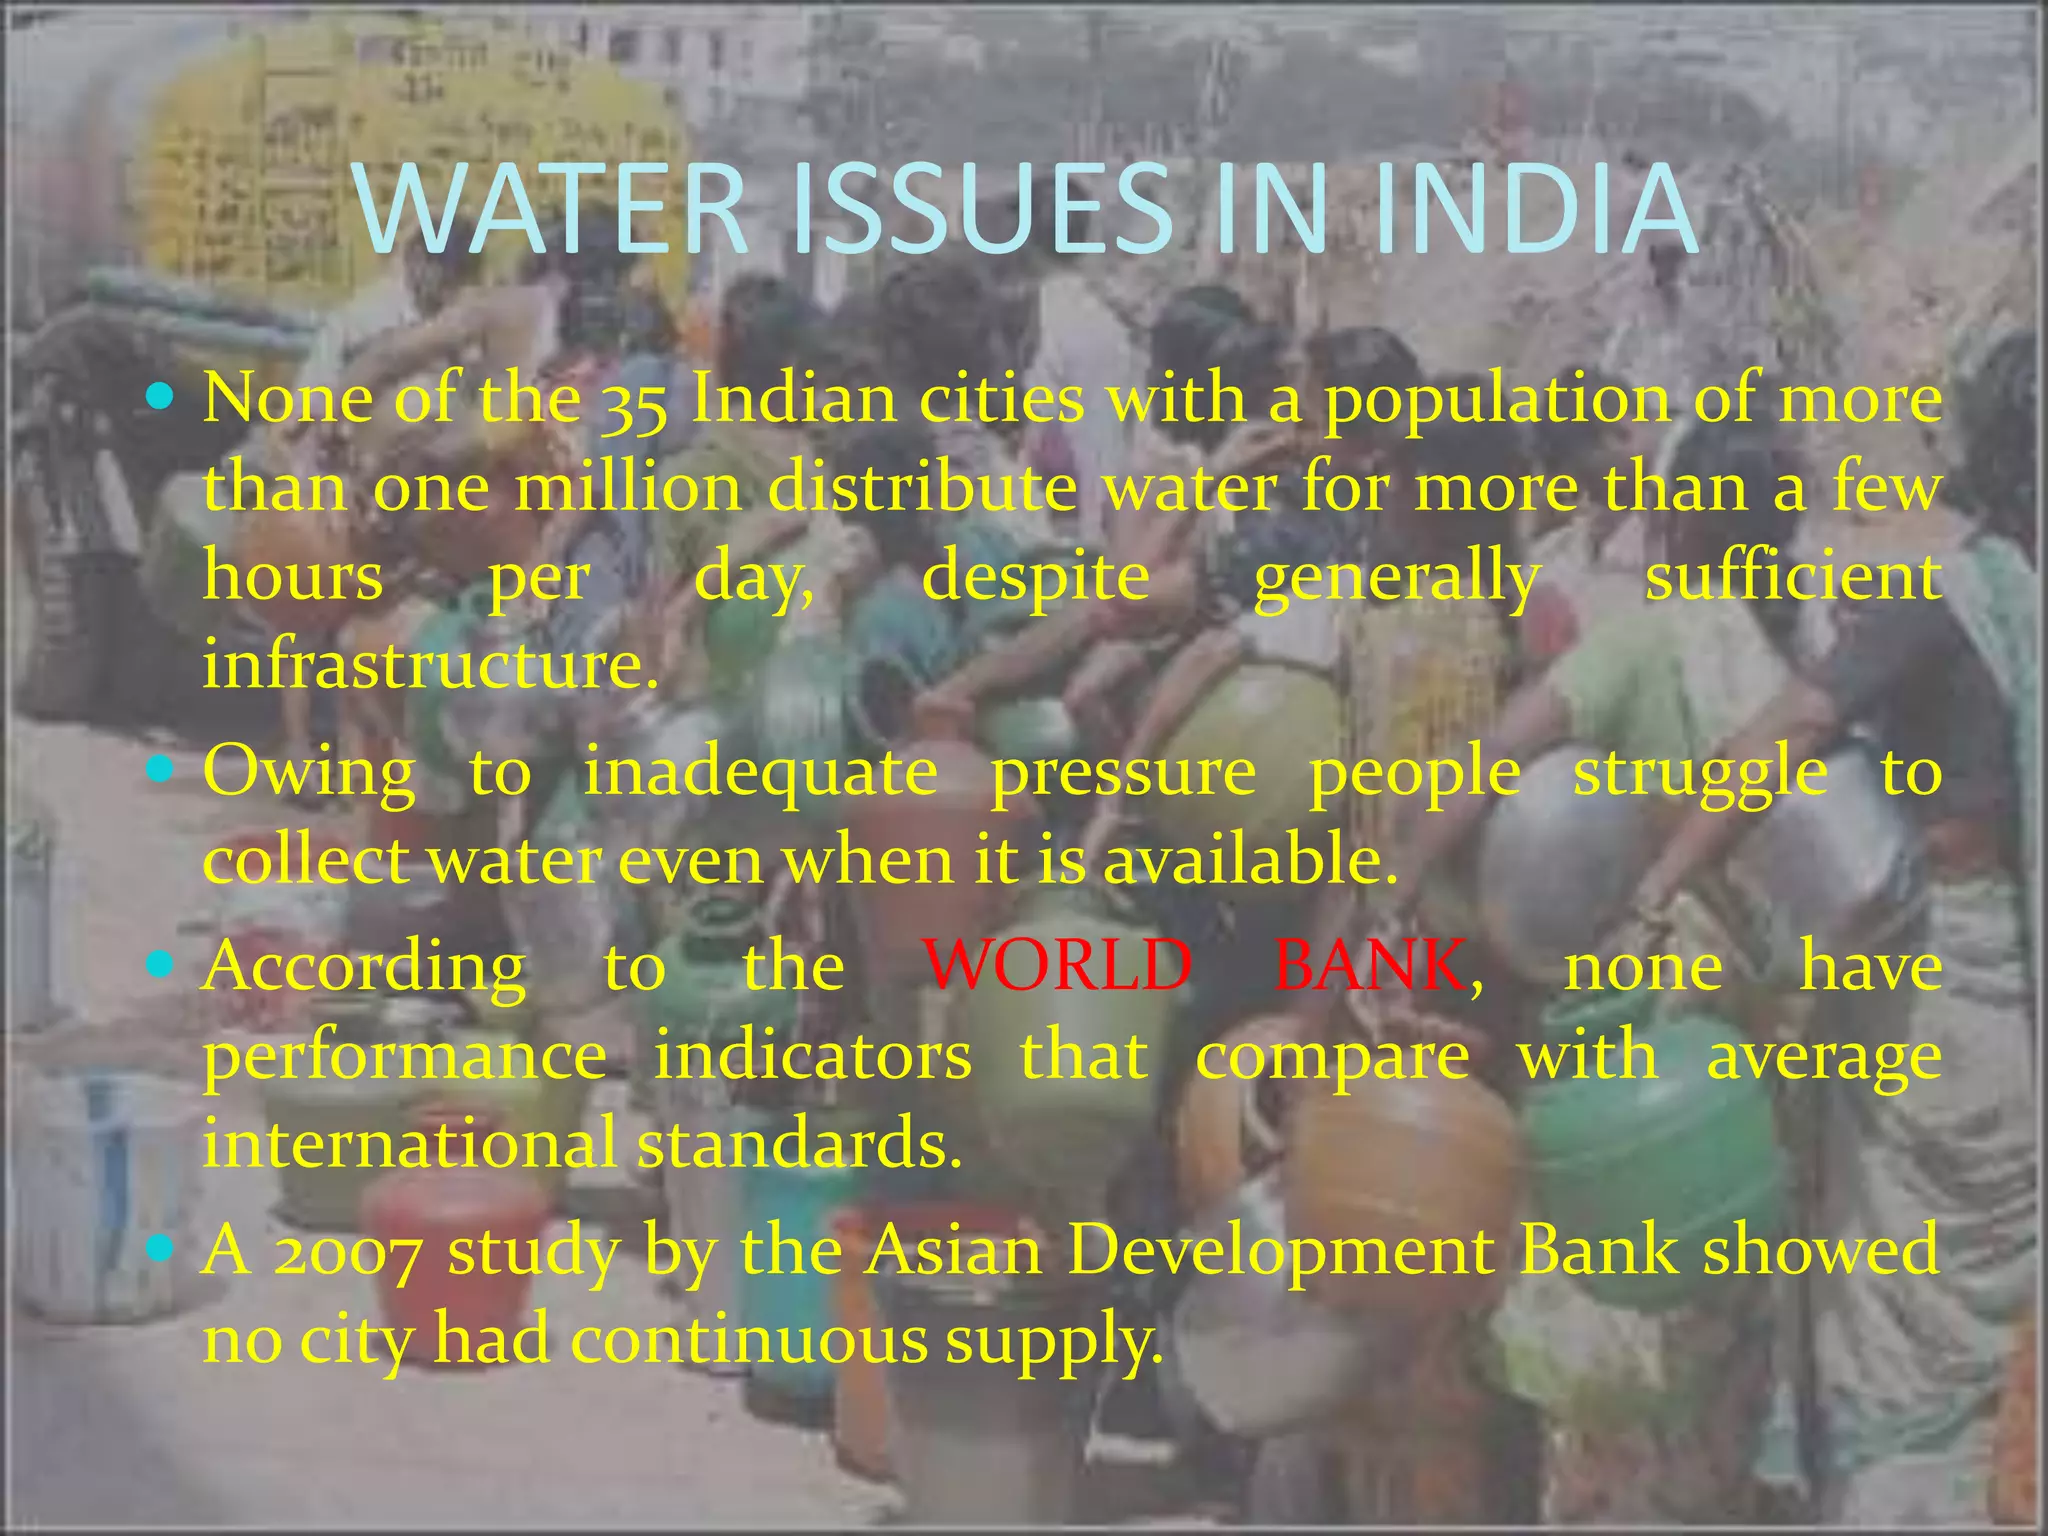
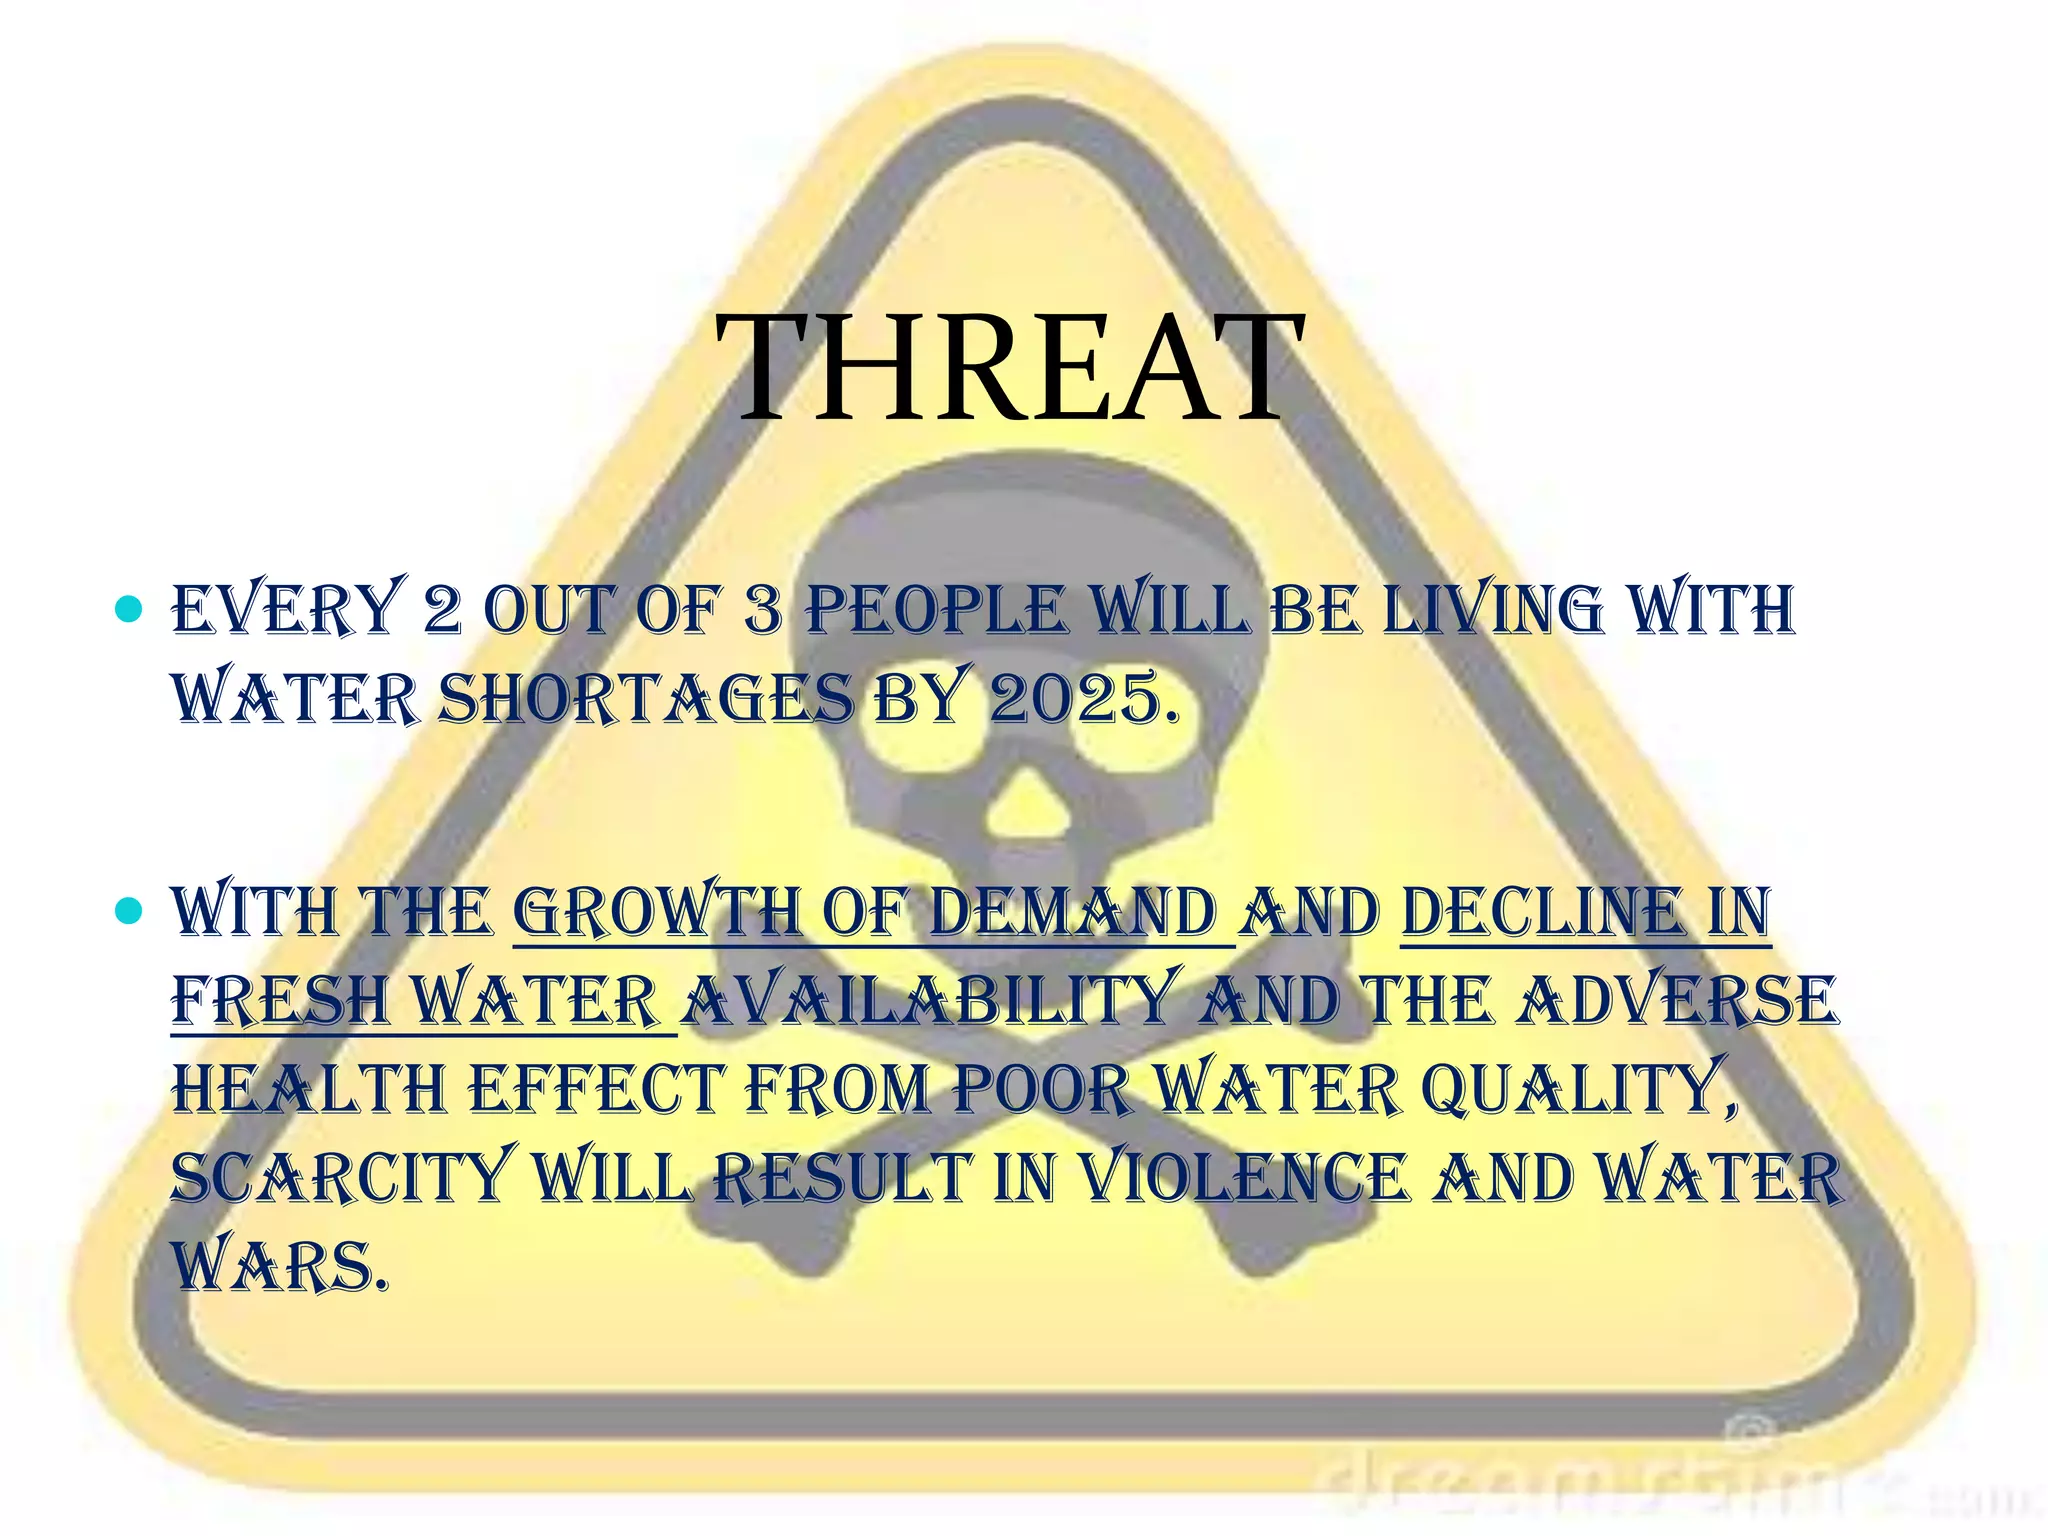
This document discusses water issues in India and the importance of water auditing. It notes that none of India's cities with over 1 million people can distribute water for more than a few hours daily. By 2025, two-thirds of Indians may face water shortages due to increasing demand and declining availability. Water auditing assesses water losses by comparing the amount produced to the amount distributed. It helps identify problem areas, minimize leakage, and improve resource management. The document outlines water auditing methods and benefits, such as leak detection. It provides an example audit of a college's water system and calculates losses of 28%. The audit found recycling greywater could save water and money. In conclusion, water auditing is an effective tool


