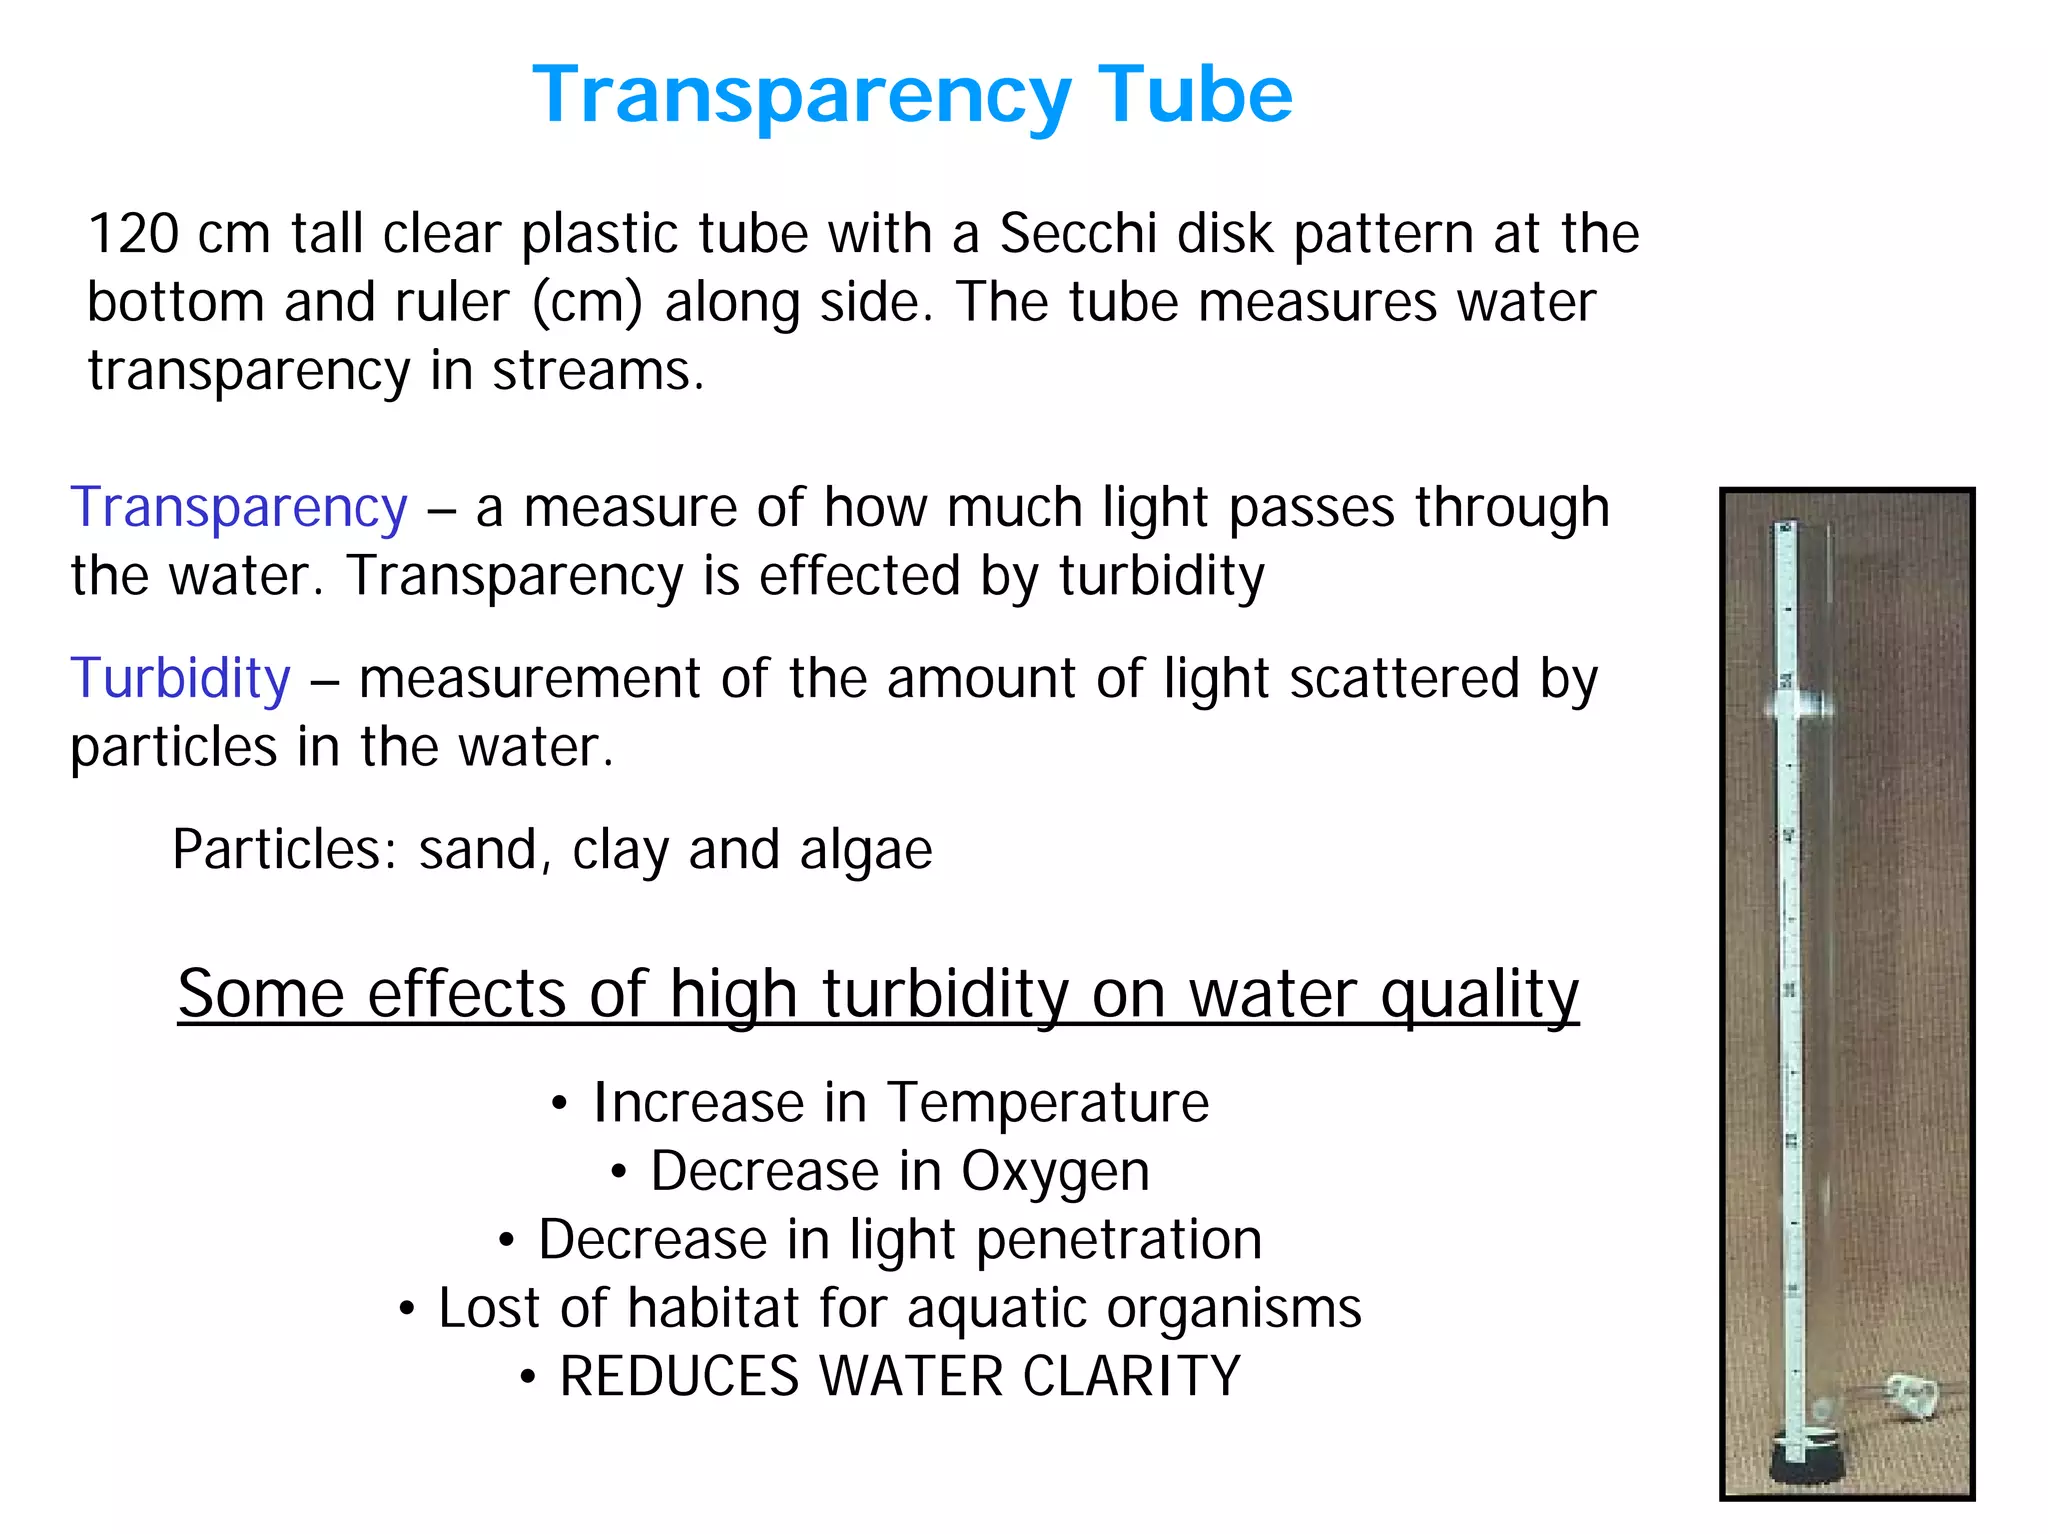
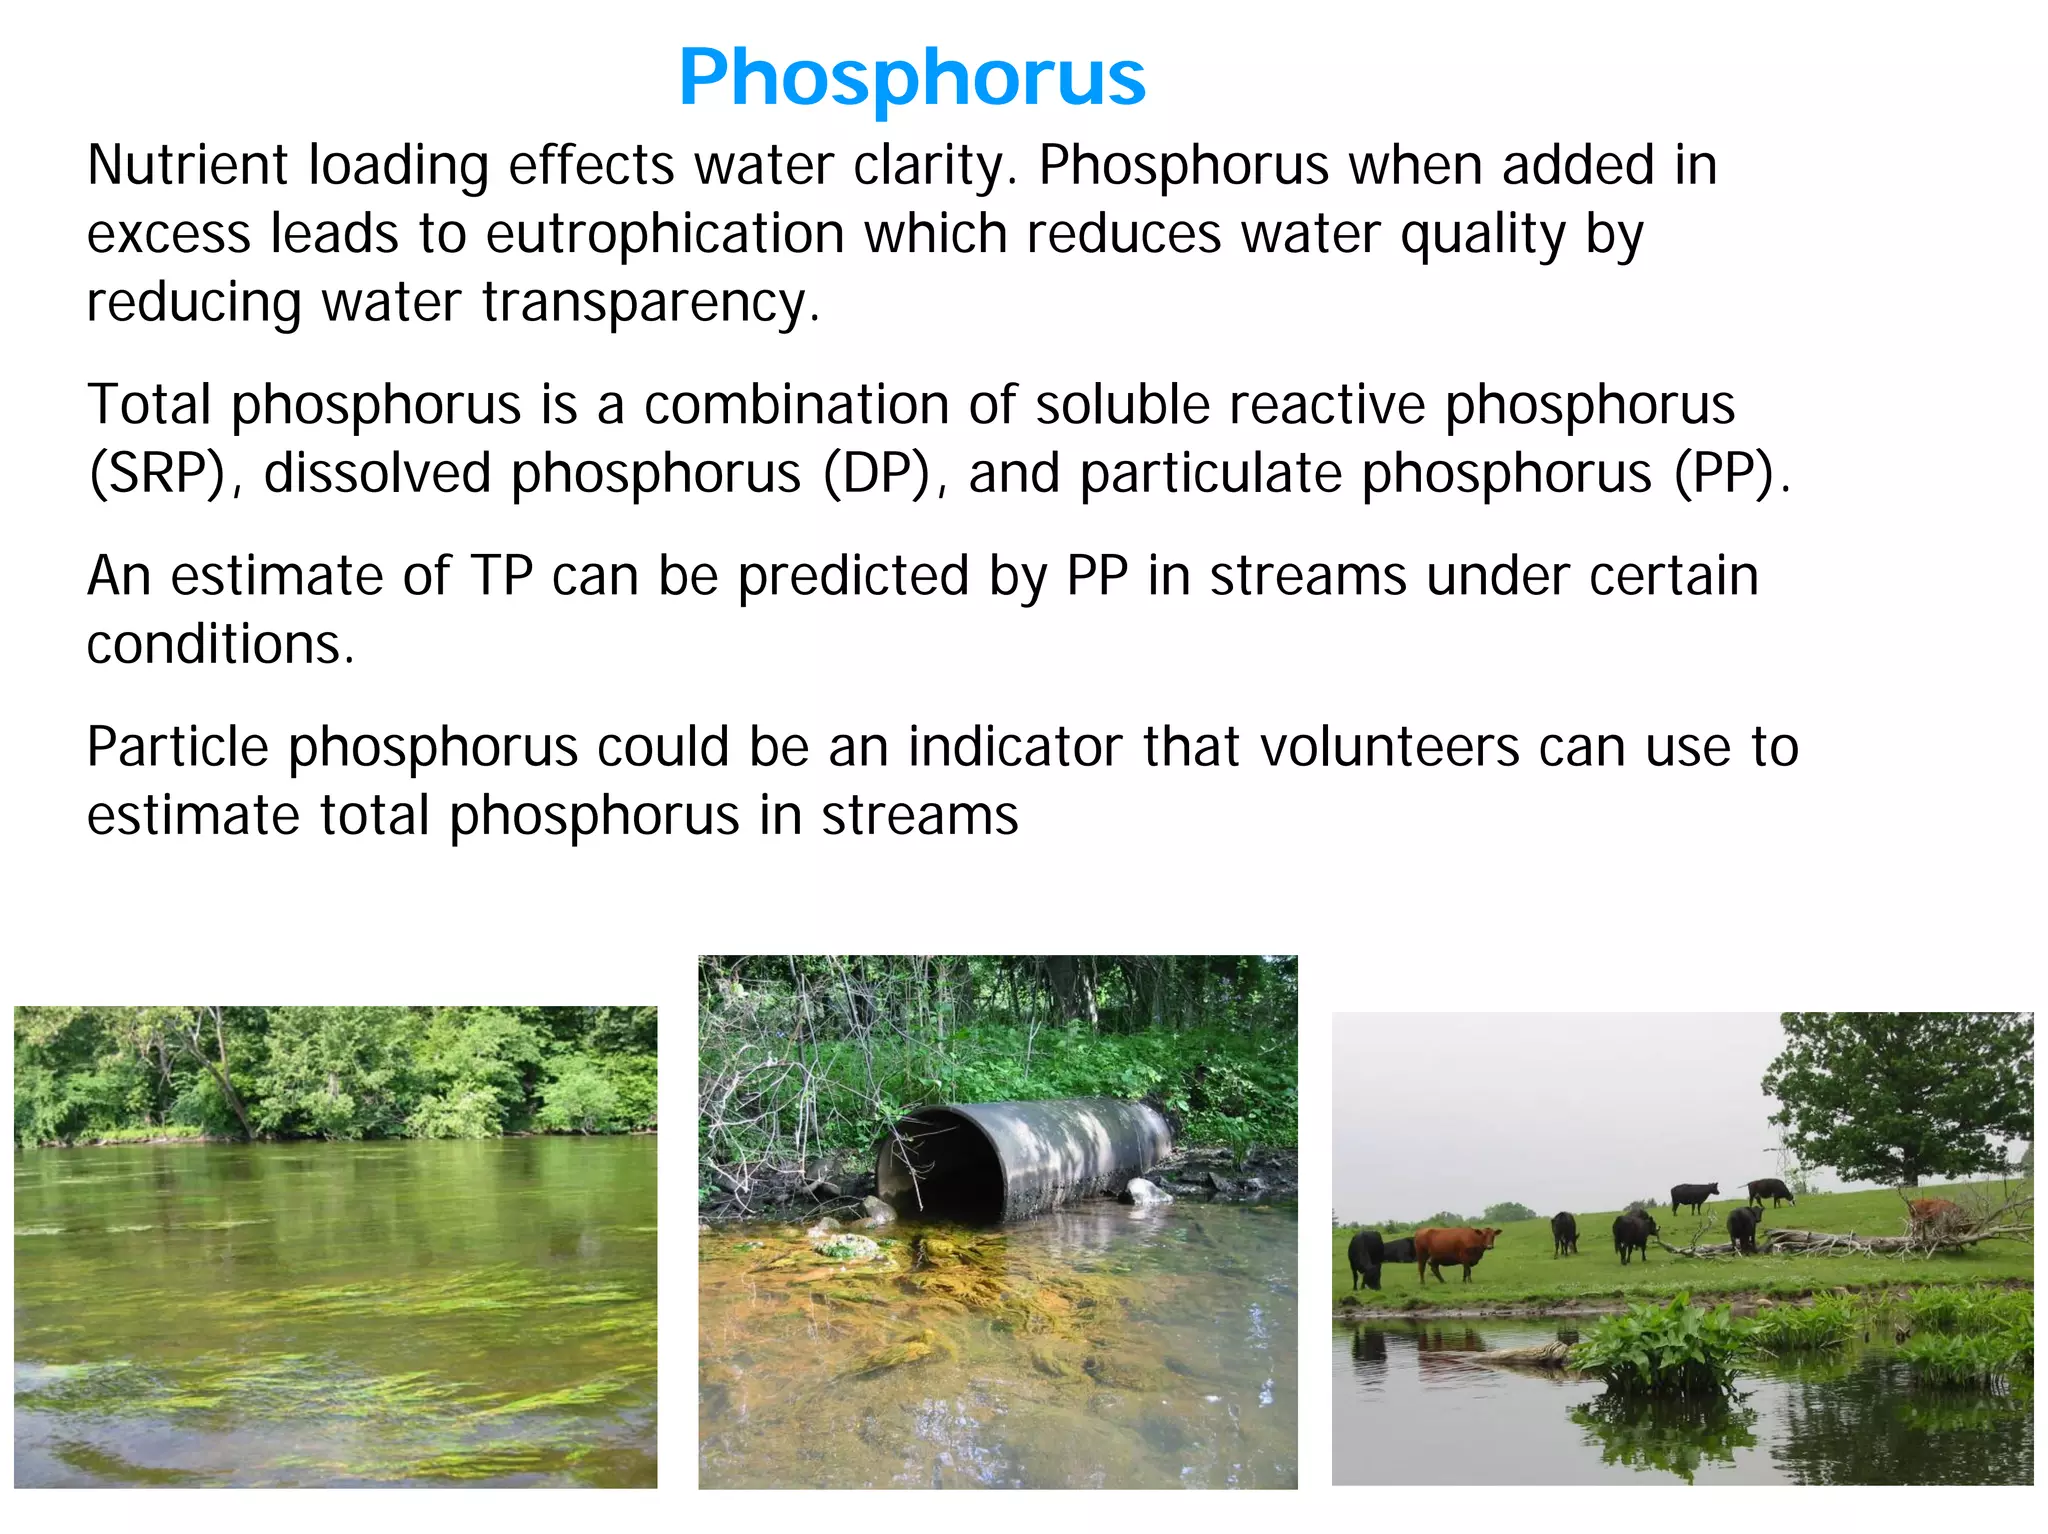
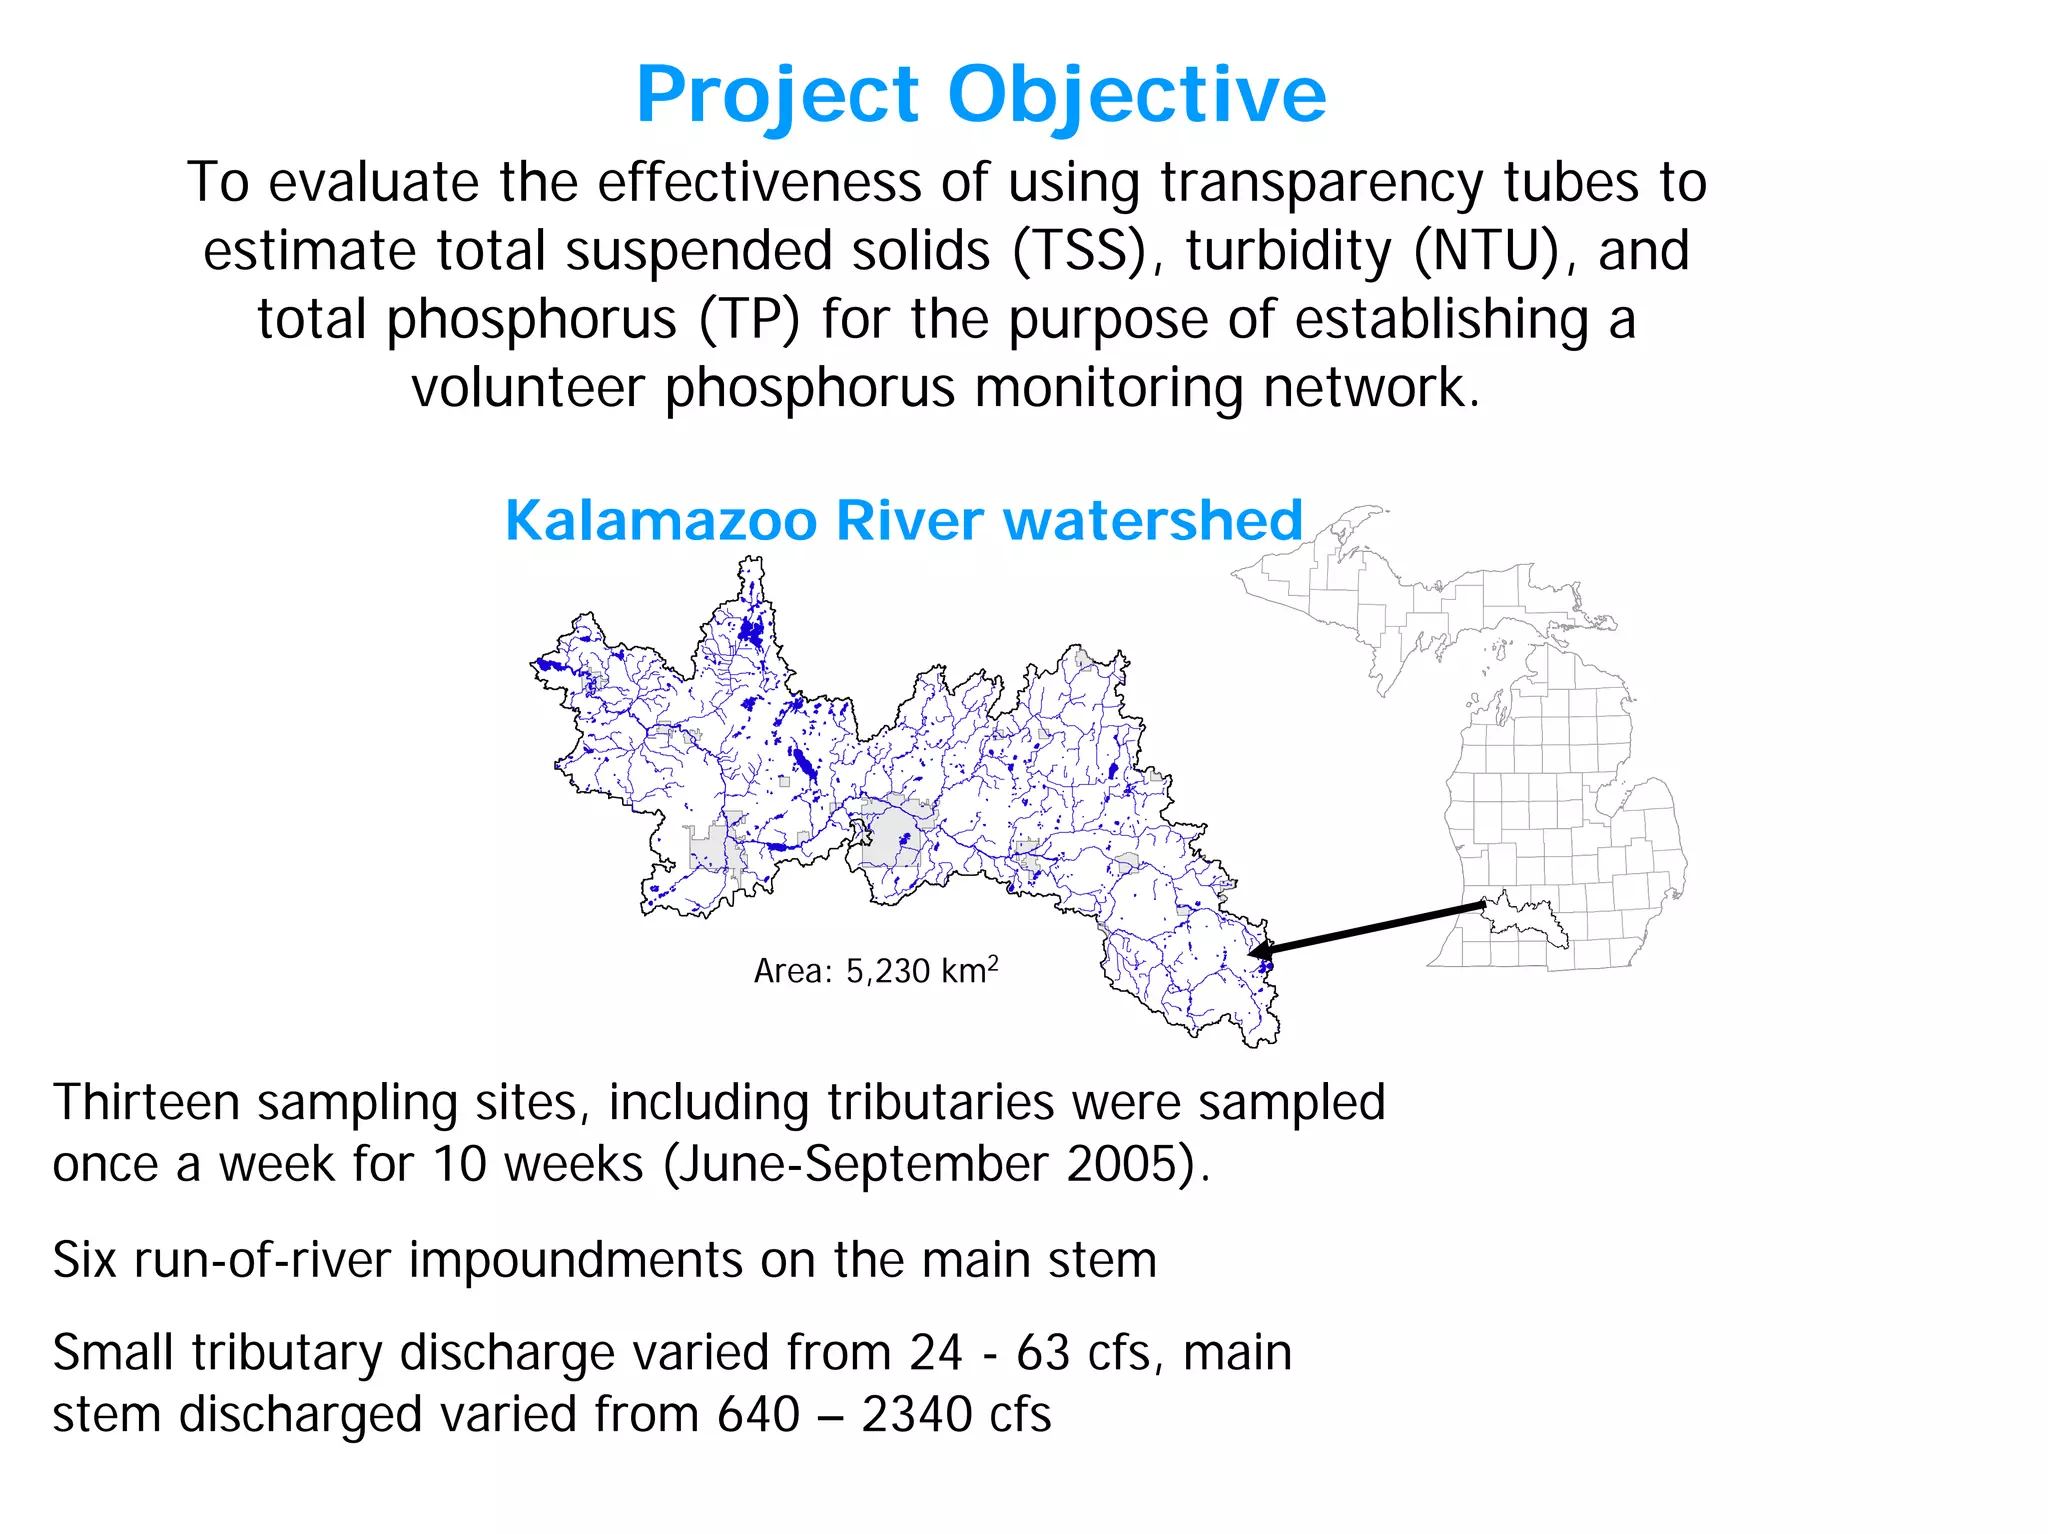
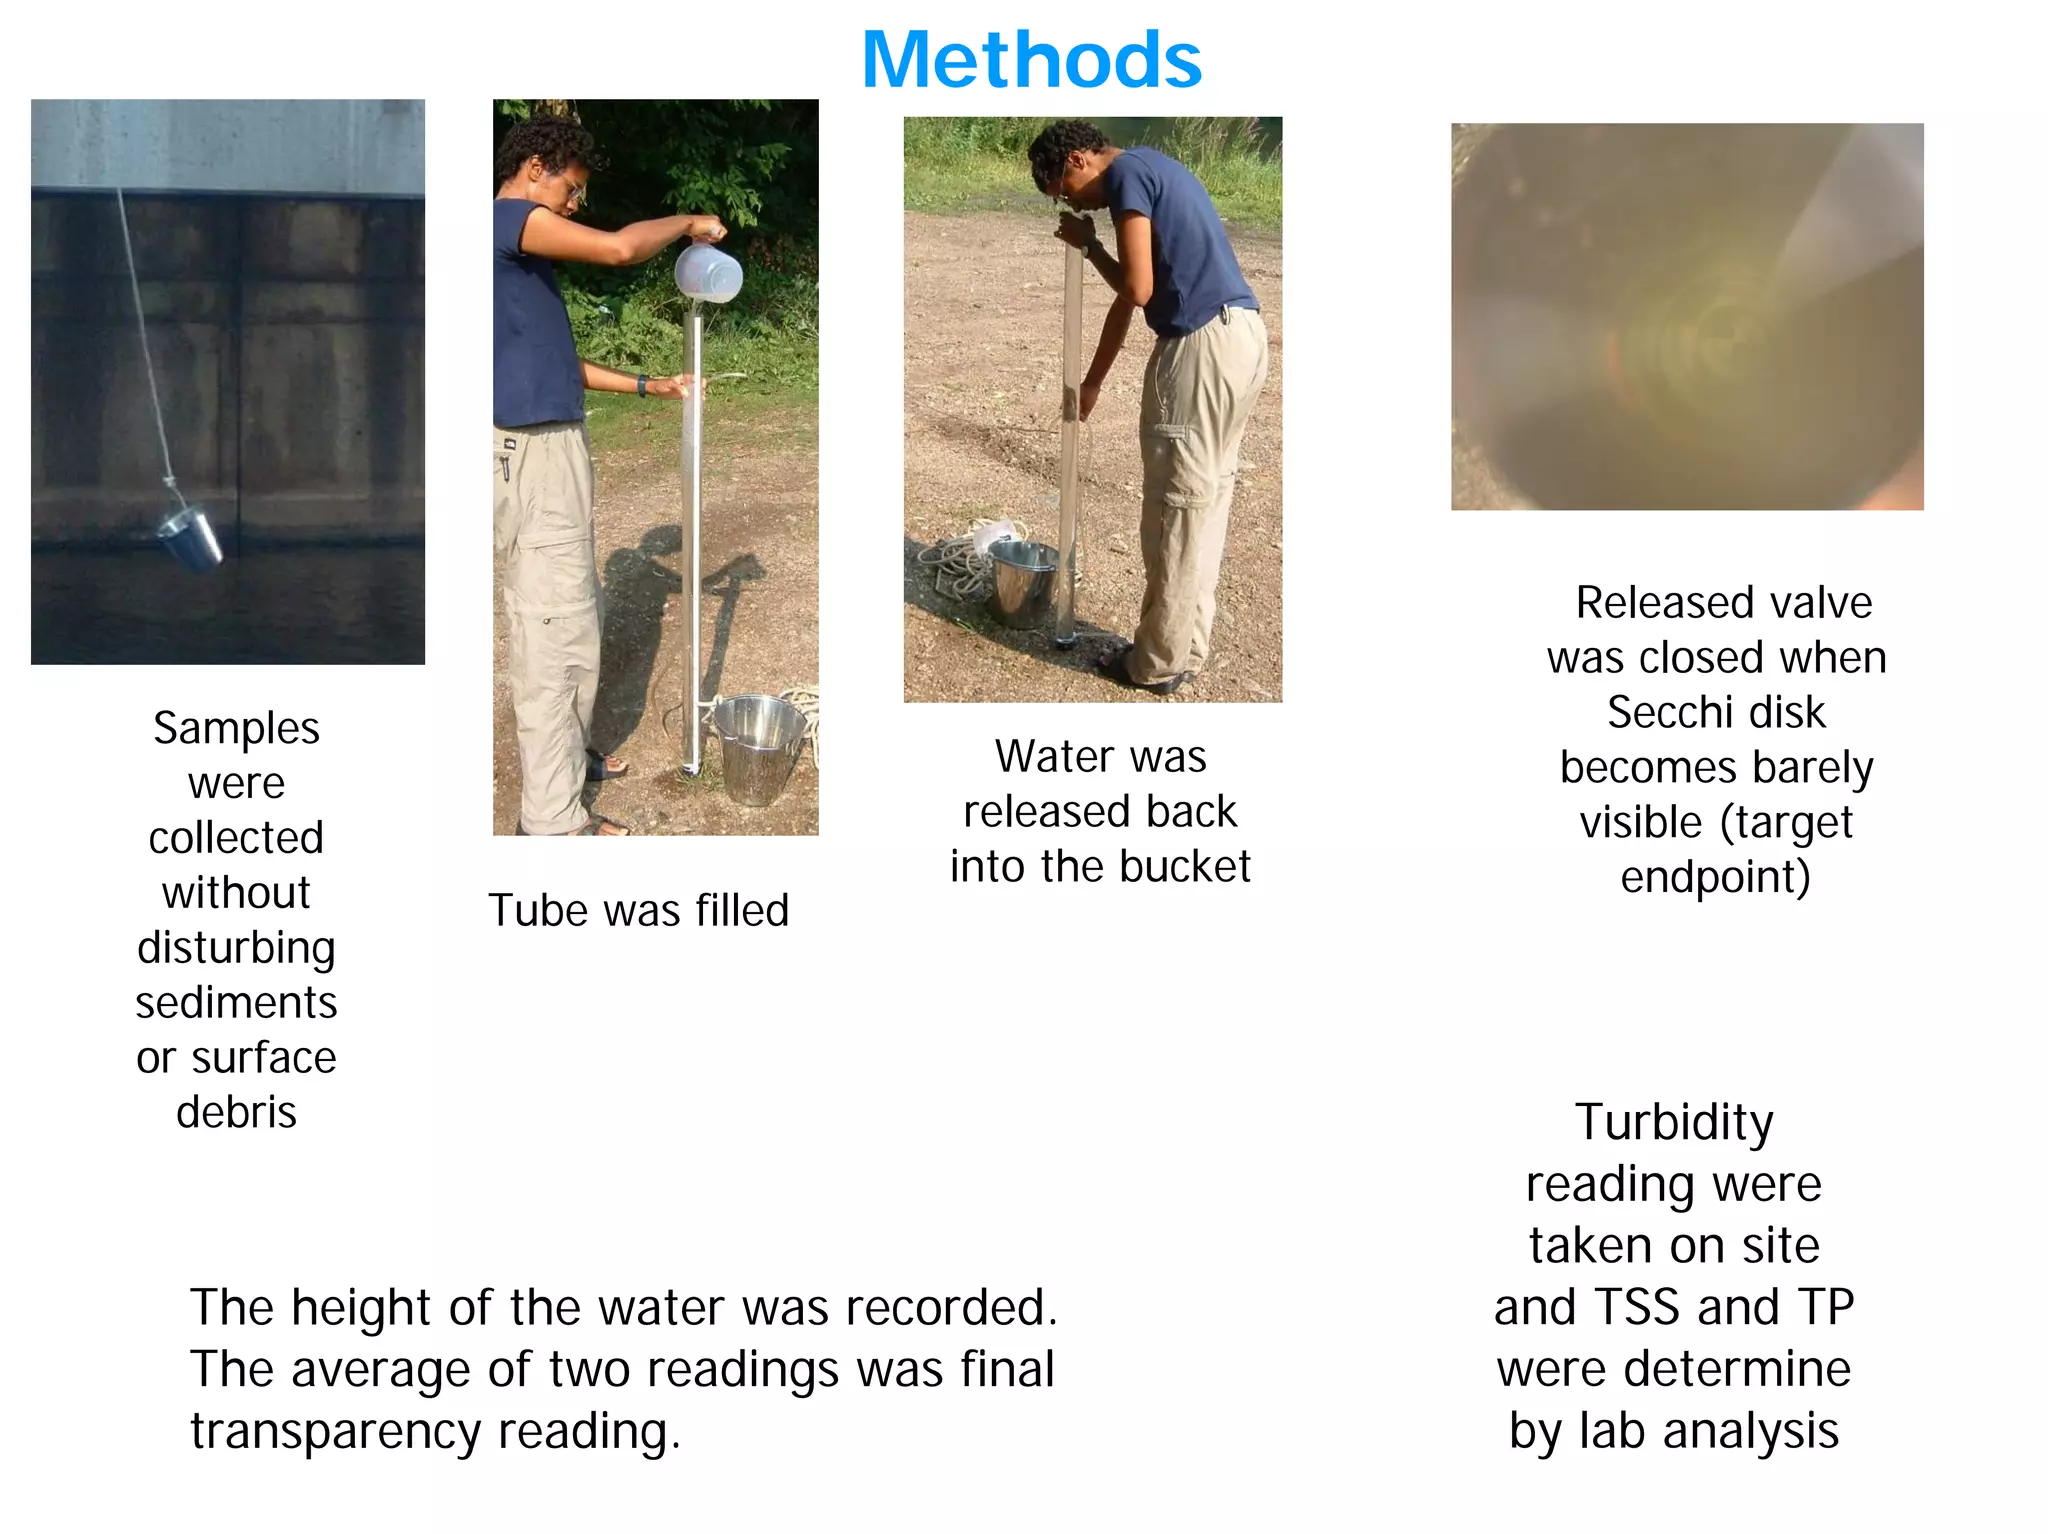
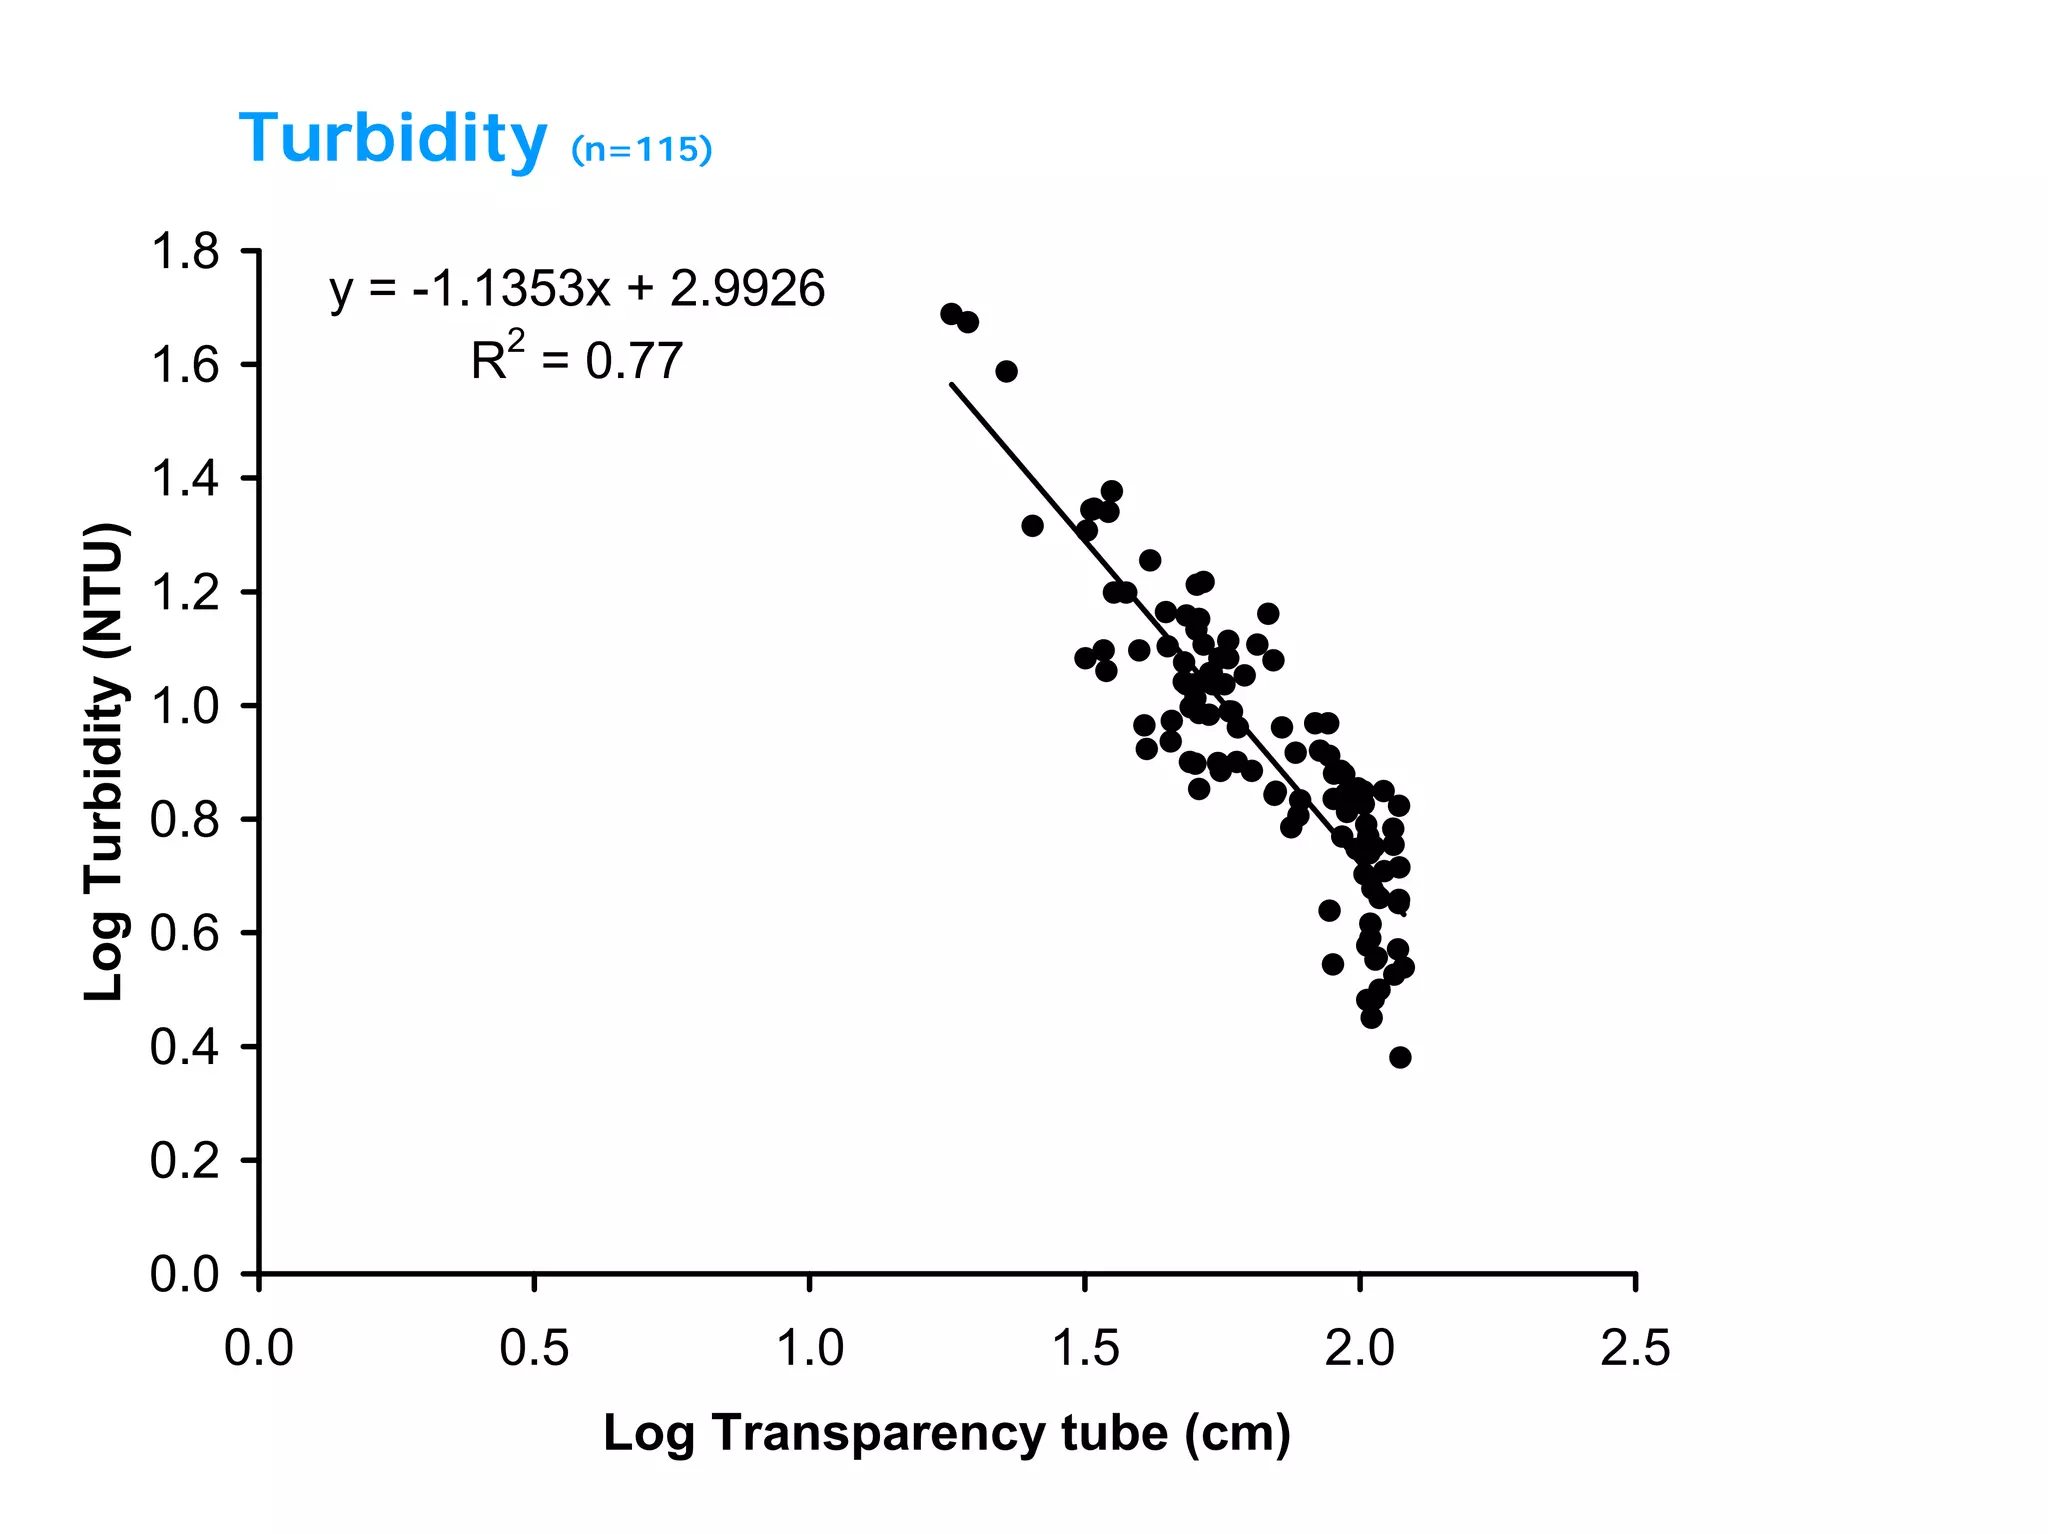
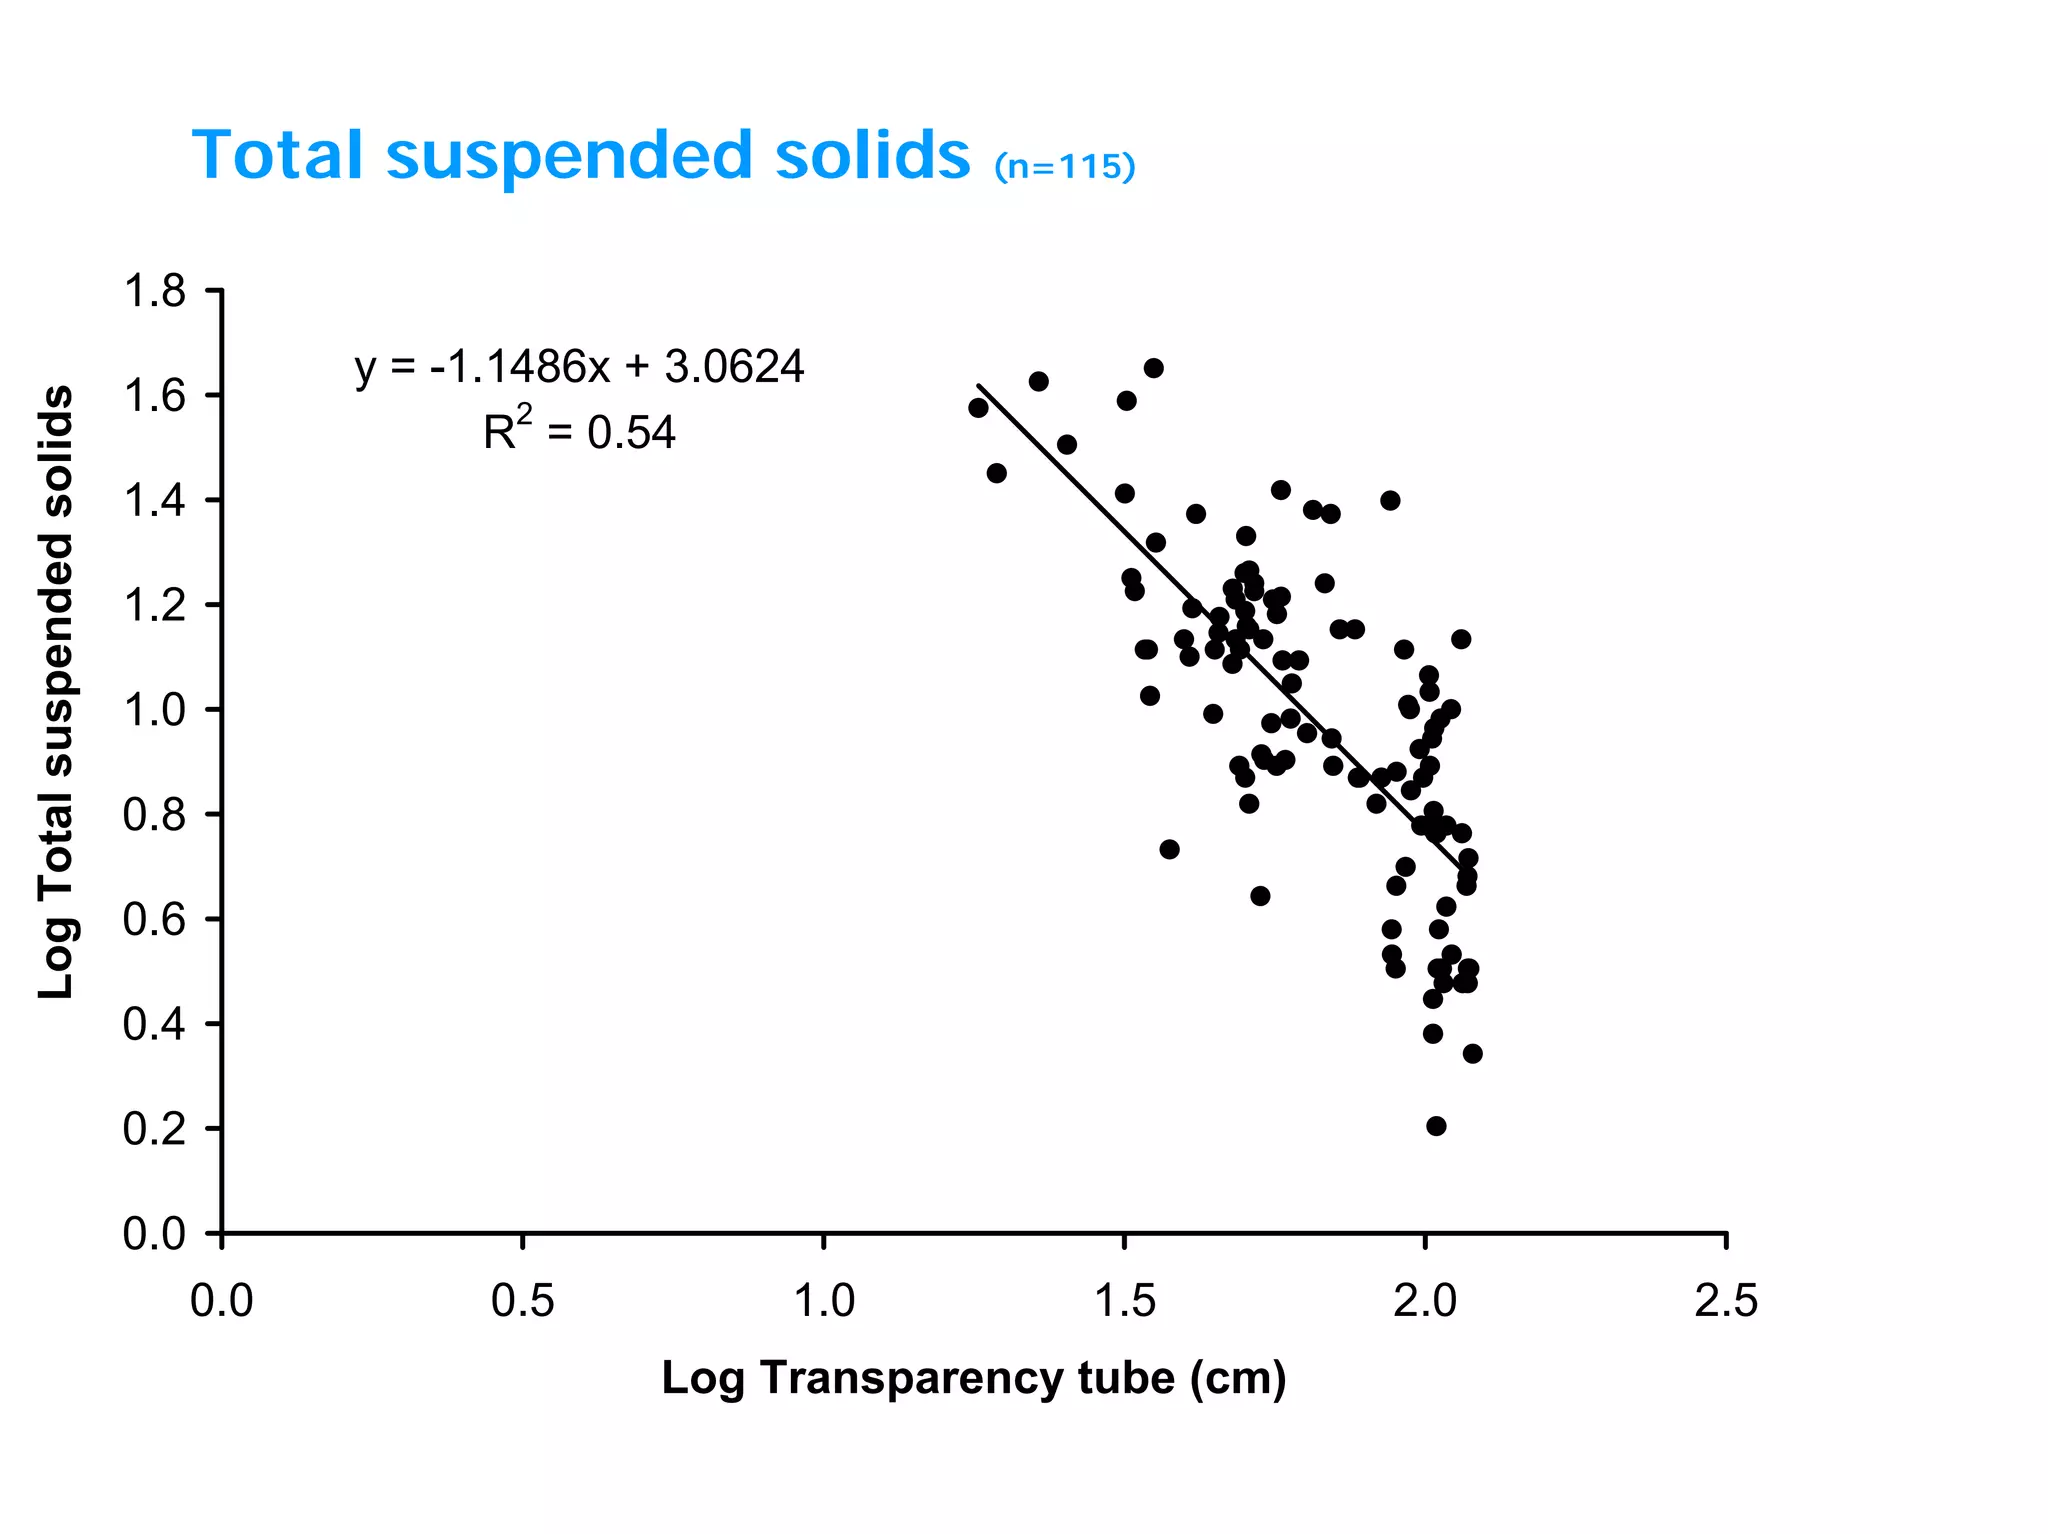
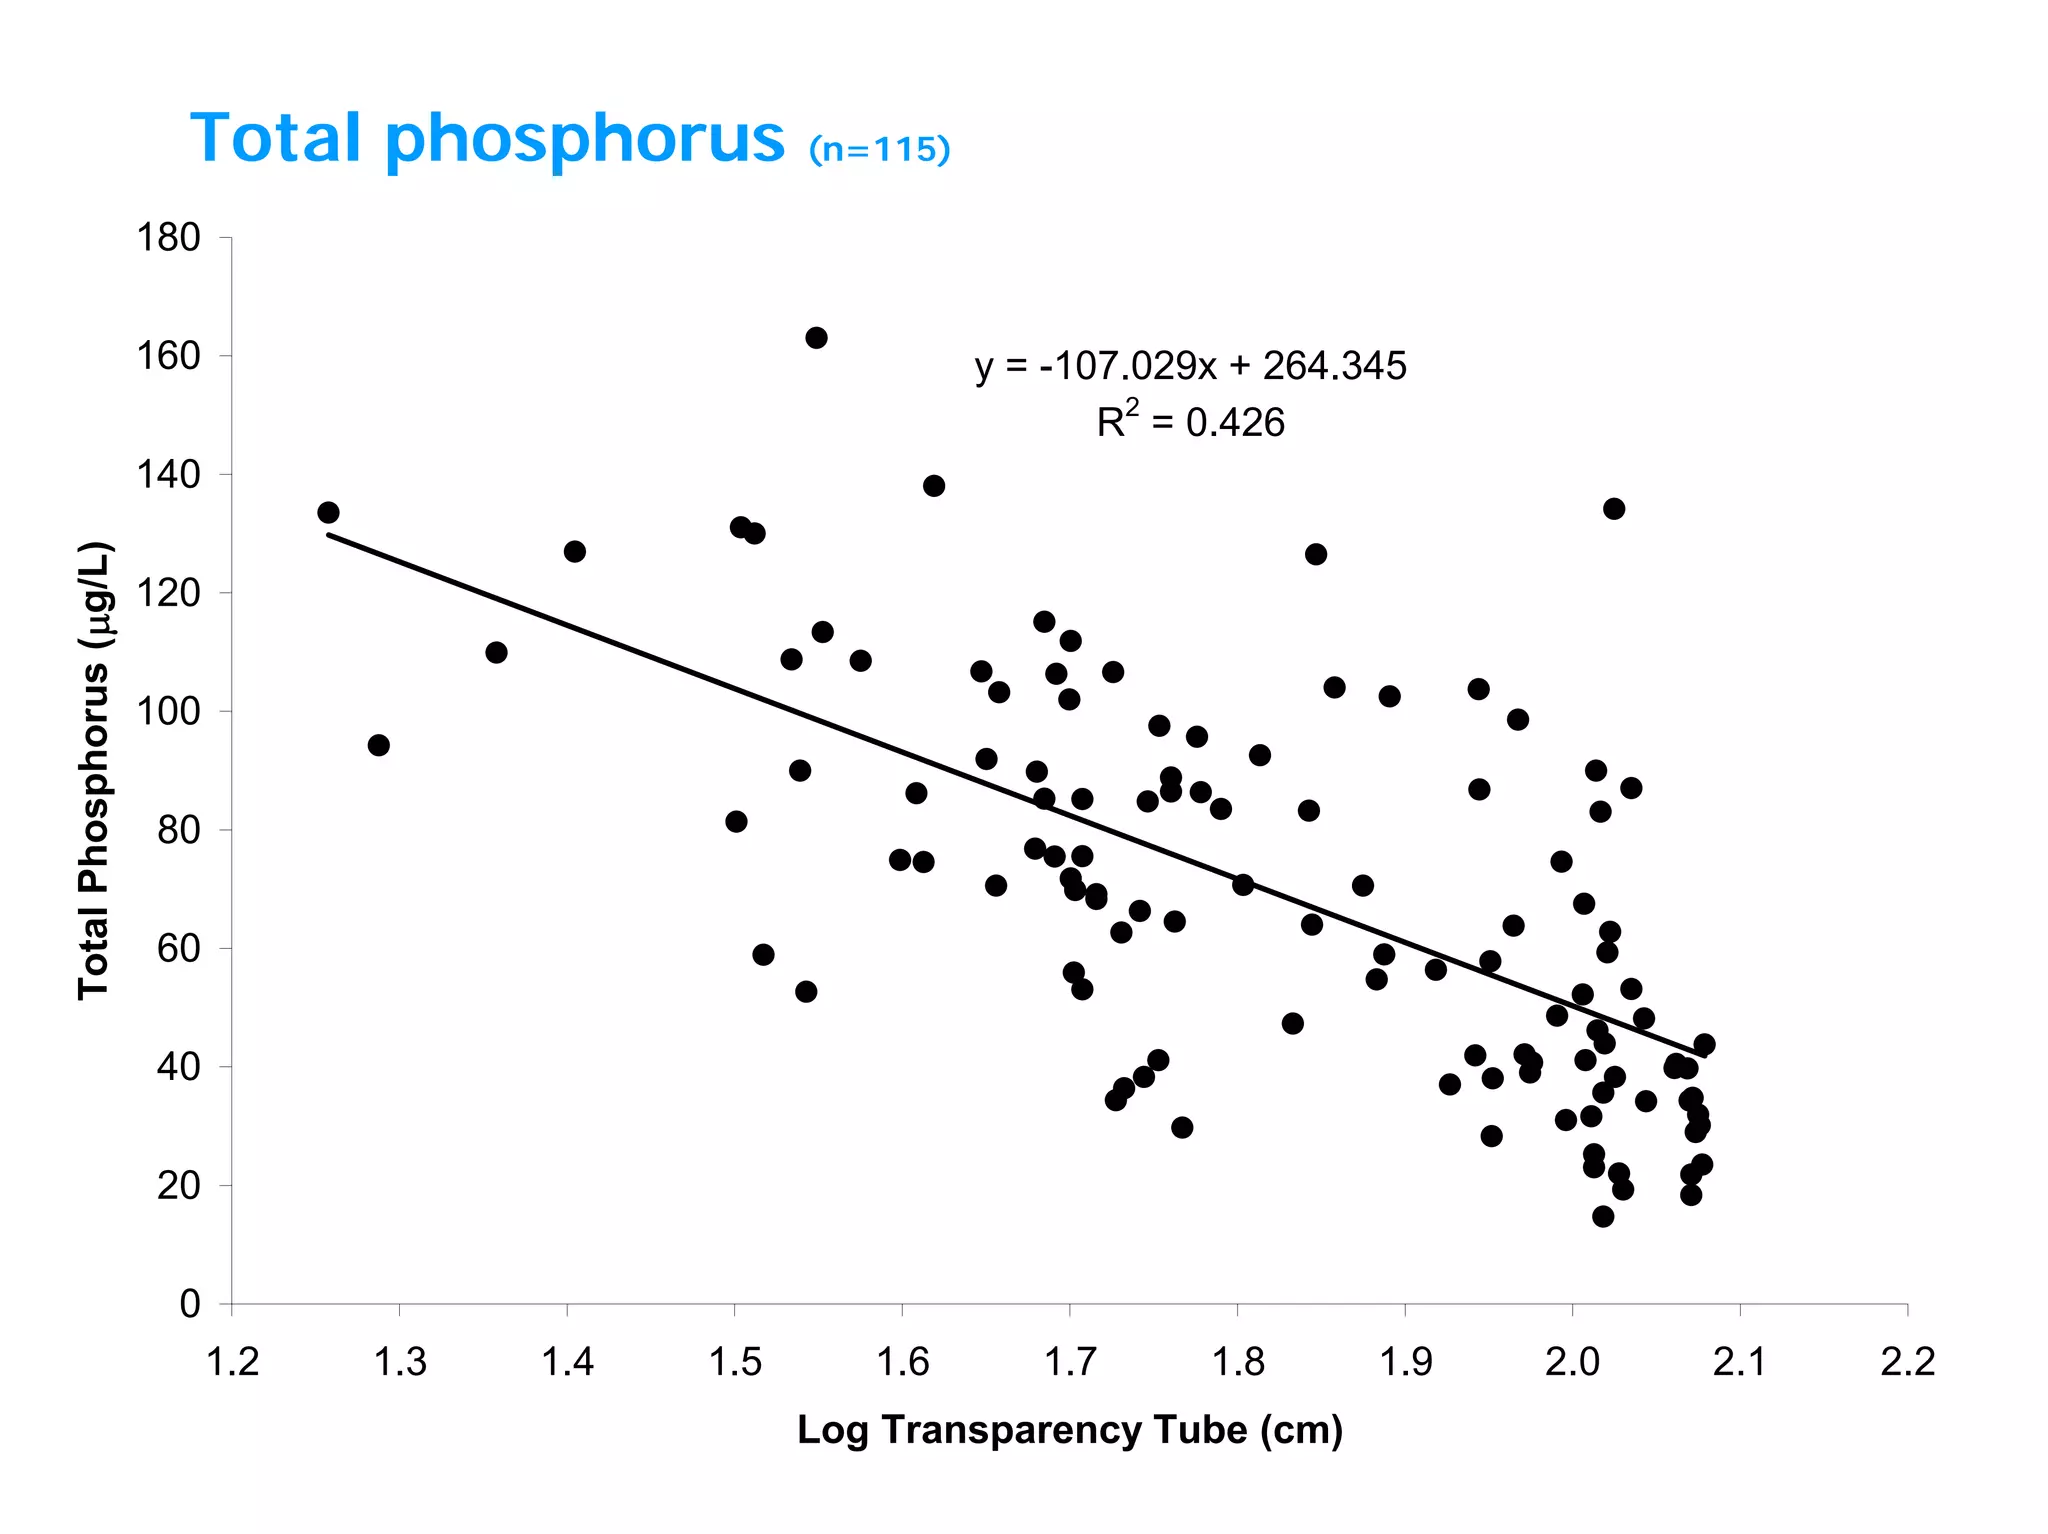
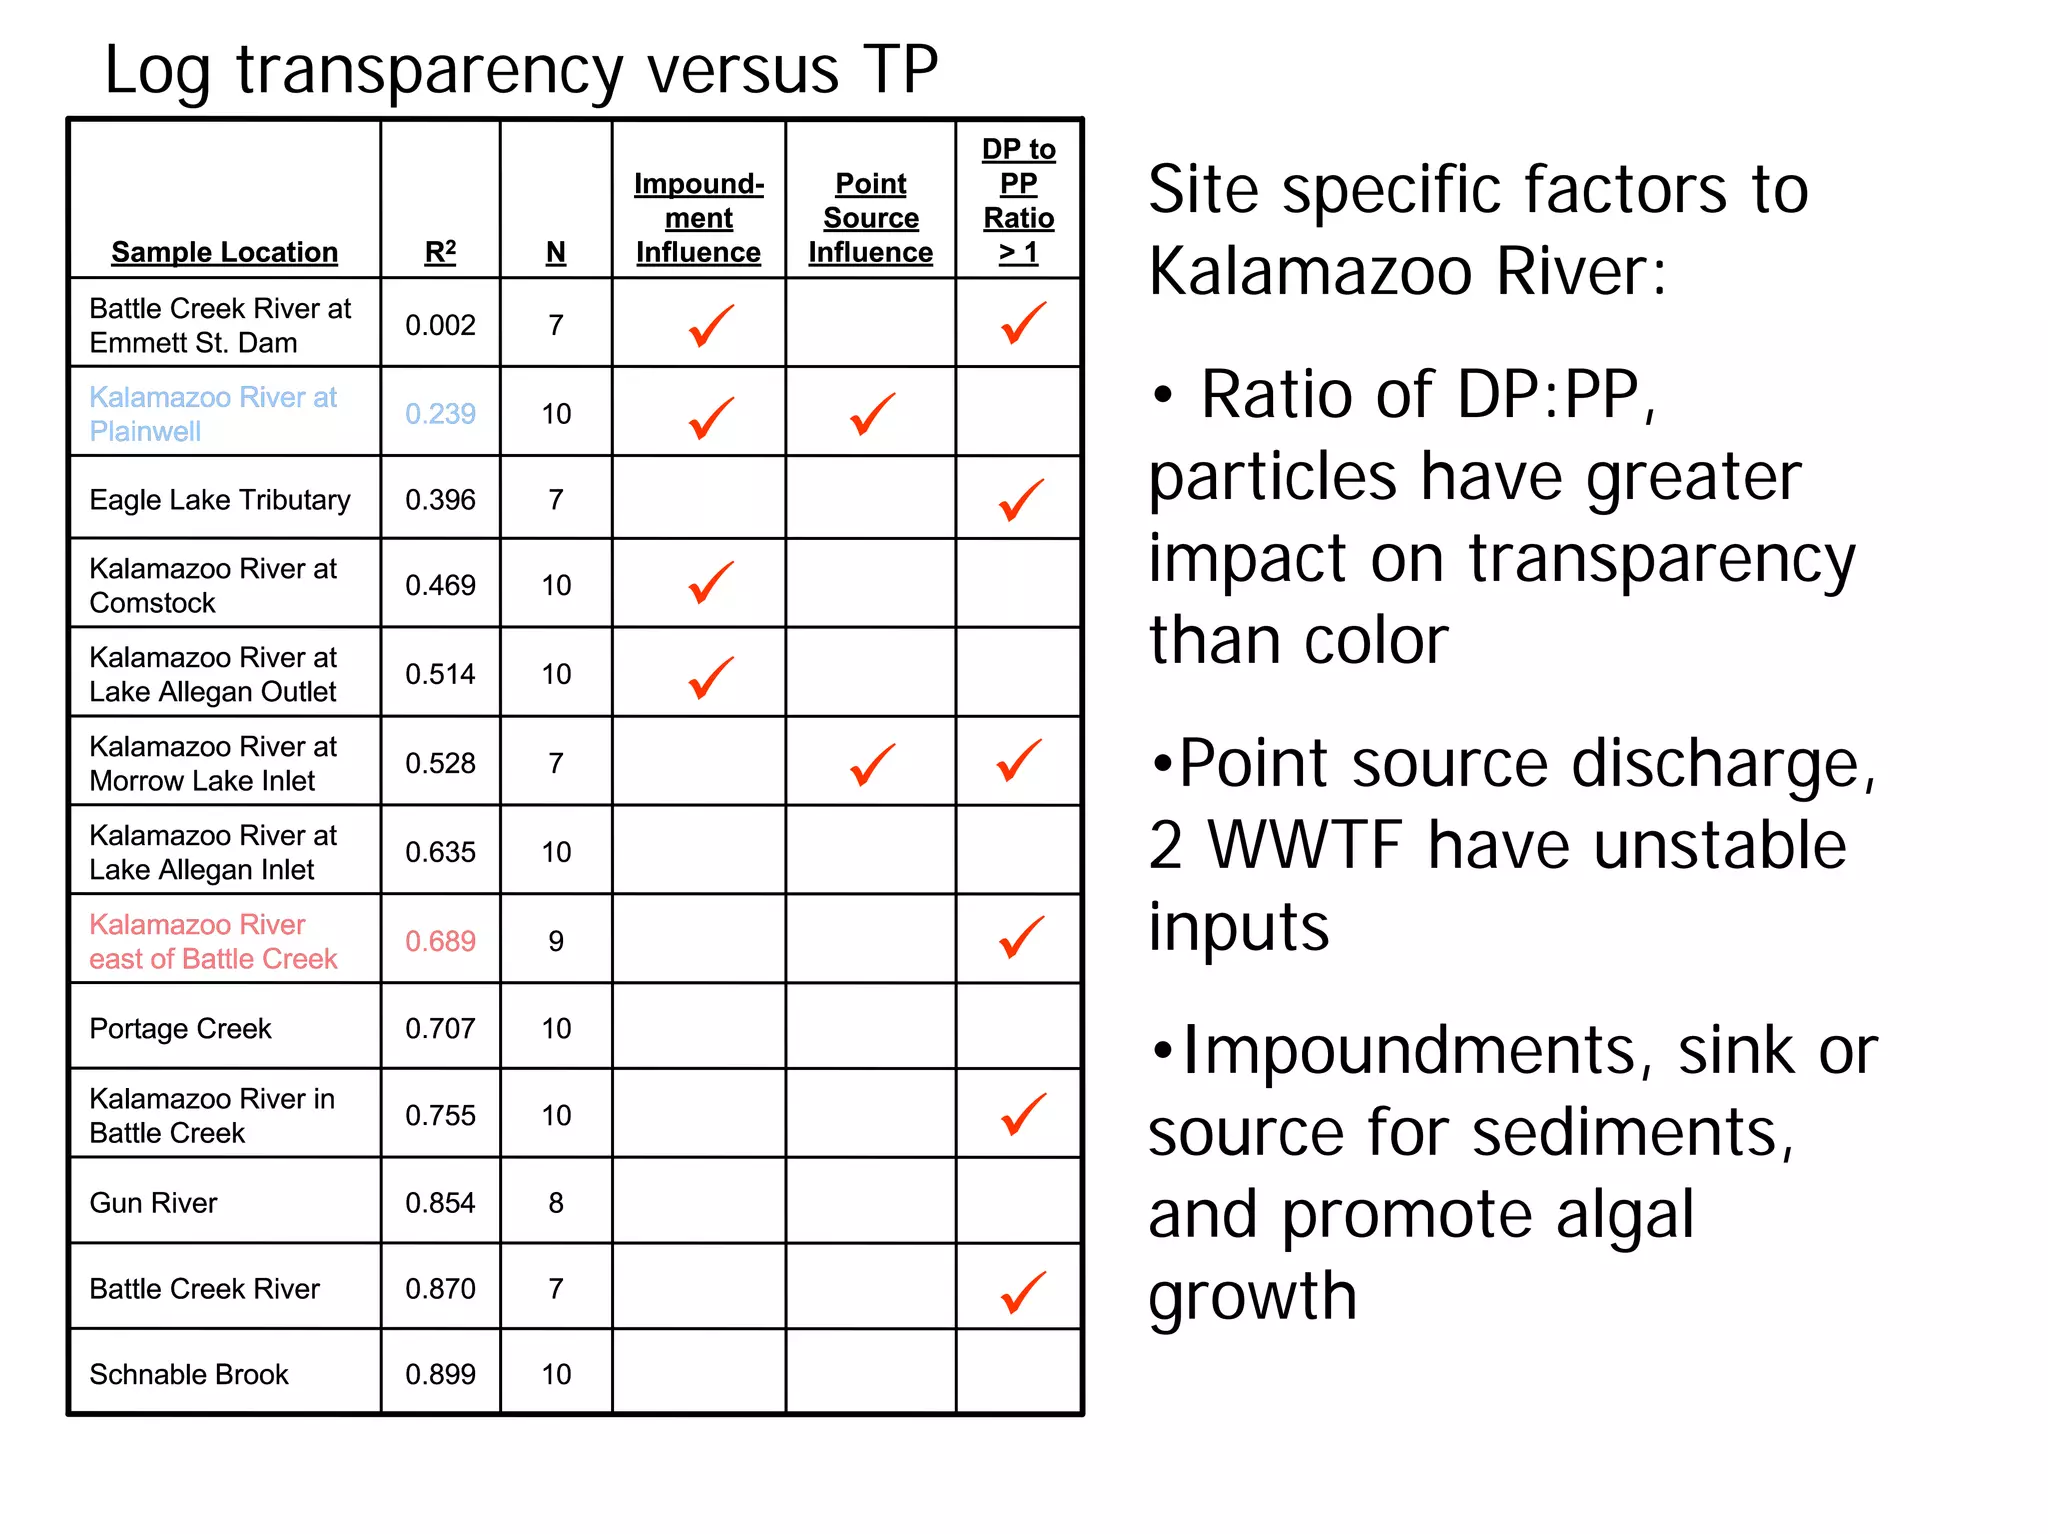
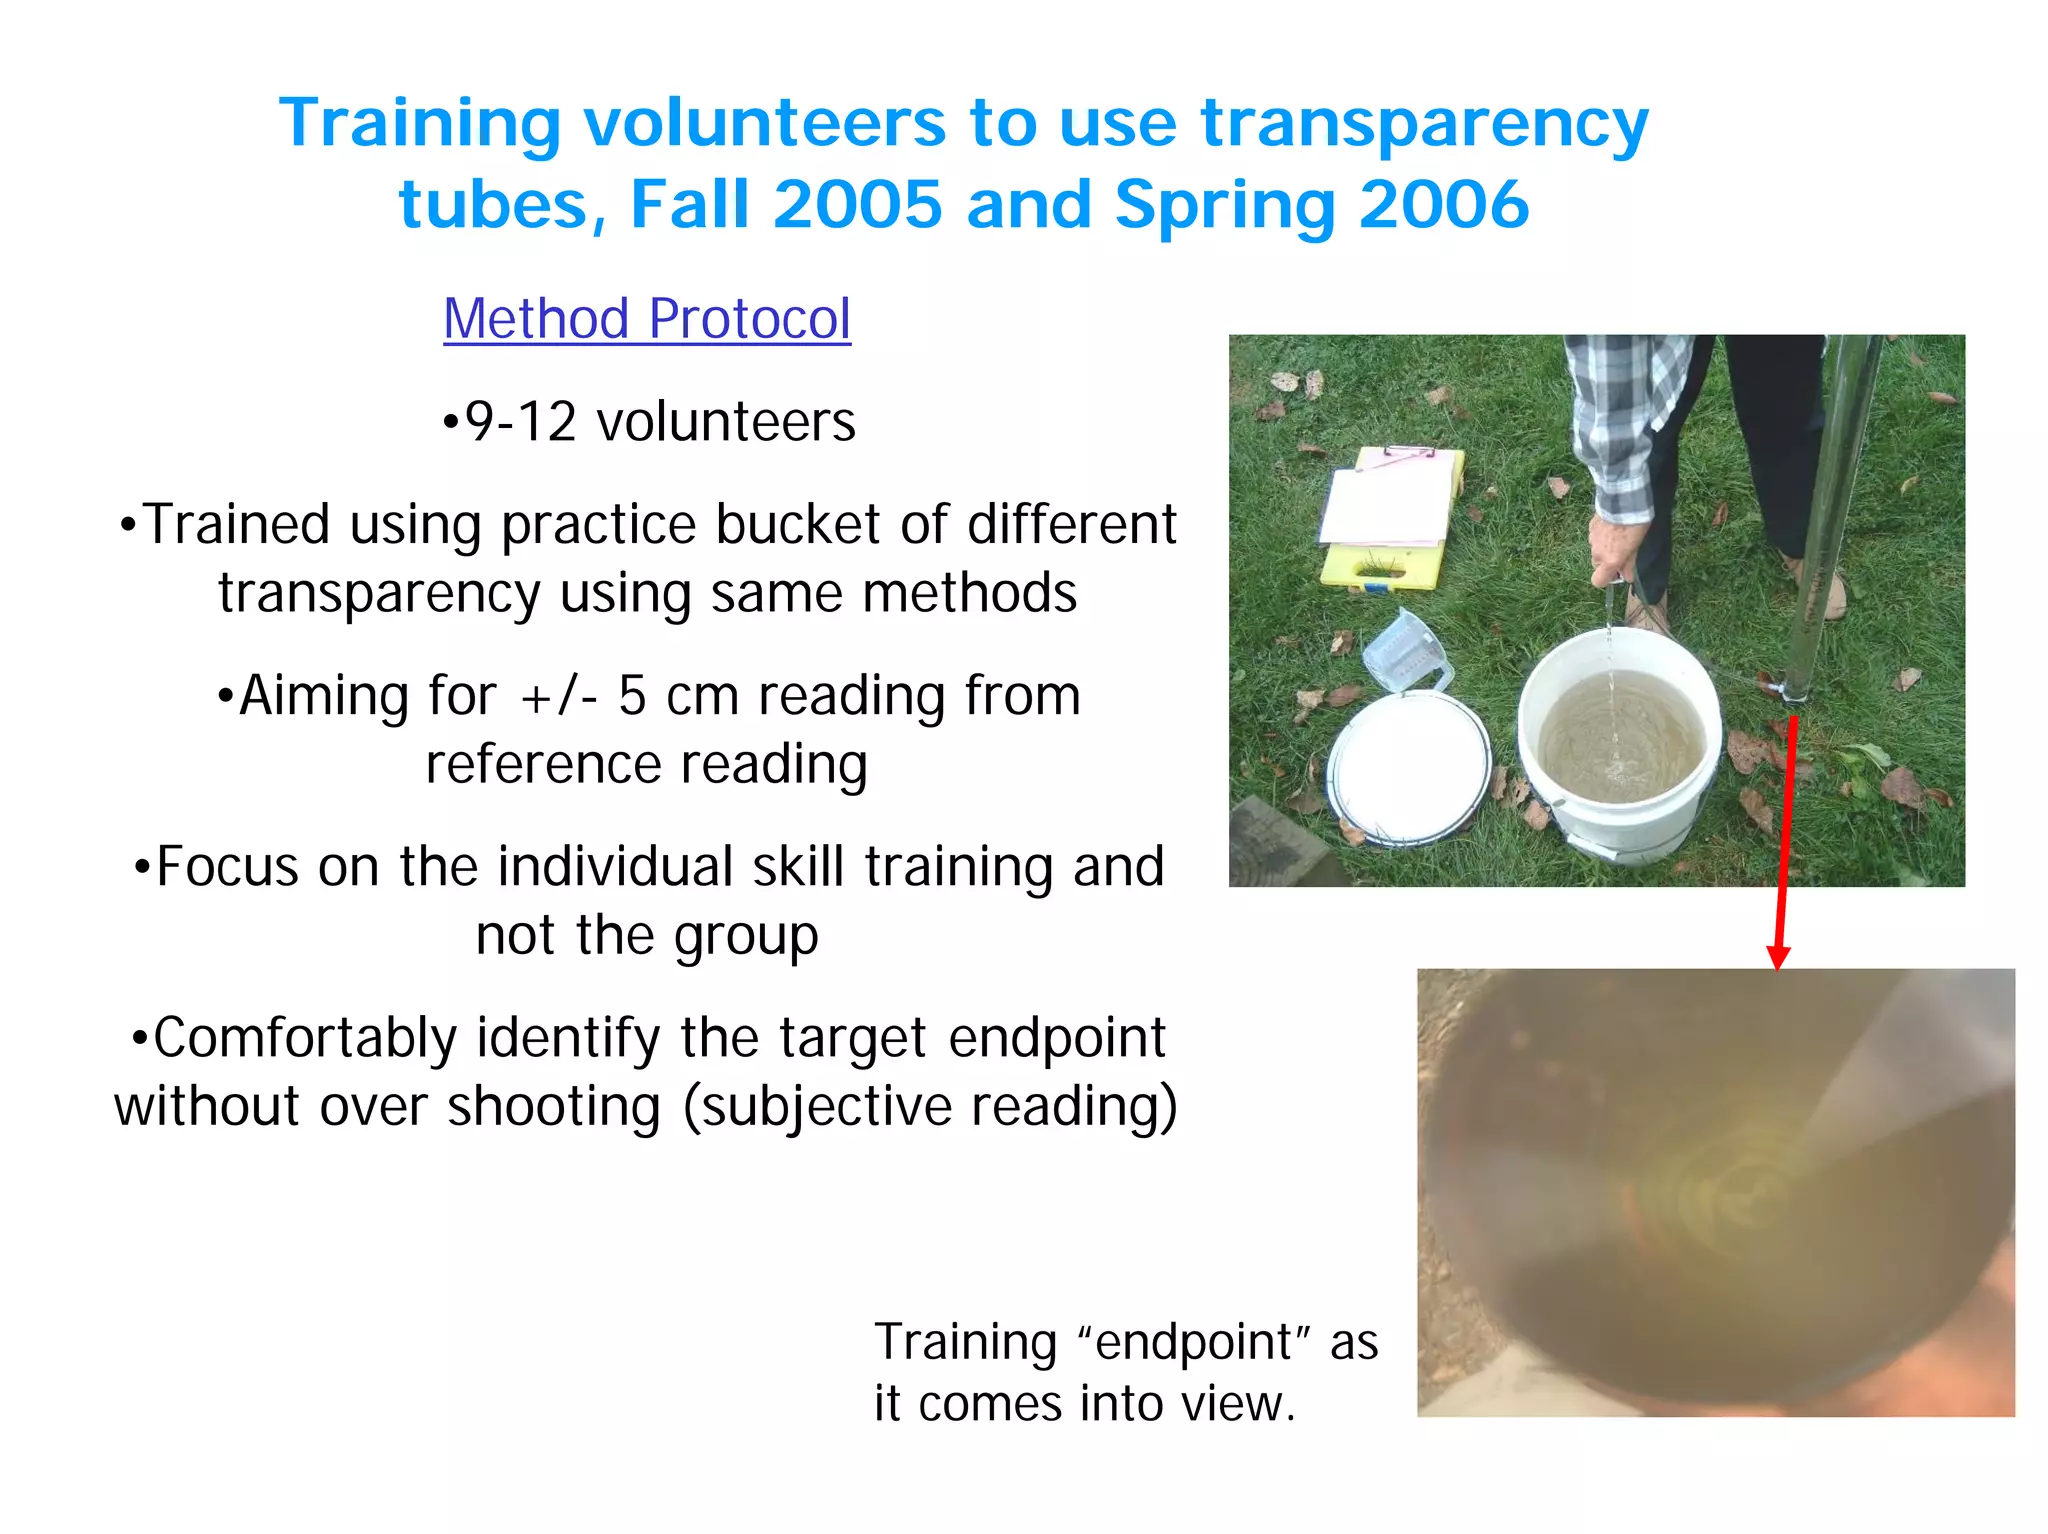
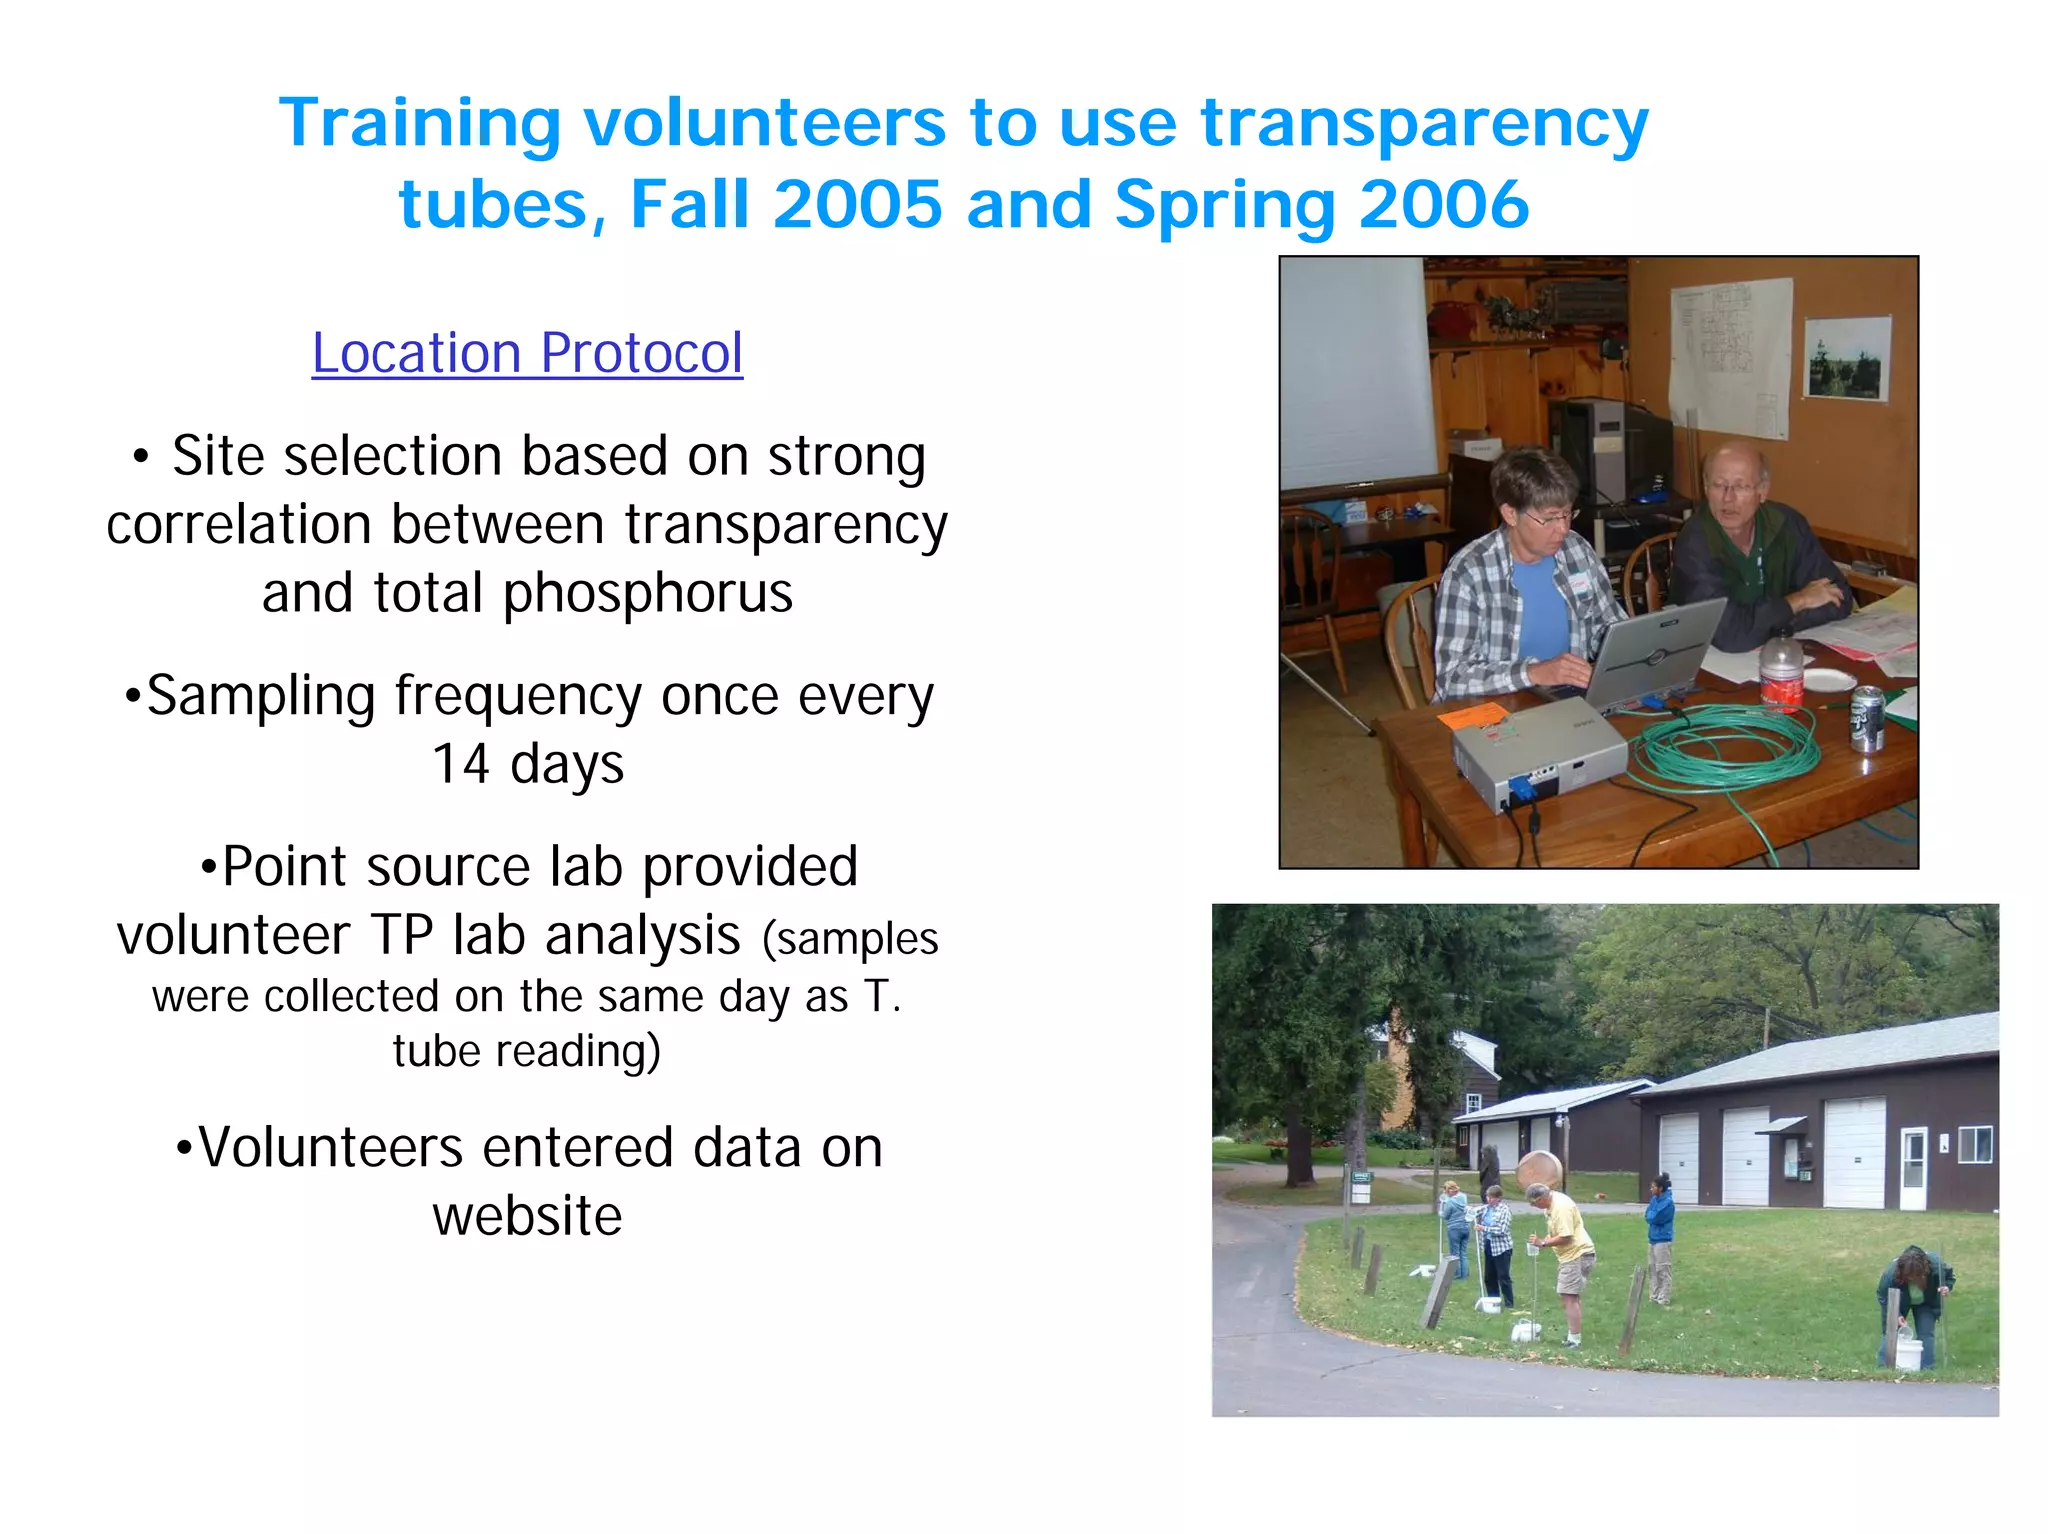
Nicole Reid, Jane Herbert , and Dean Baas
MSU Extension Land & Water Program
W. K. Kellogg Biological Station
Transparency tube as a surrogate
for turbidity, suspended solids and
total phosphorus in rivers and
reservoirs
Transparency Tube
Transparency – a measure of how much light passes through
the water. Transparency is effected by turbidity
Turbidity – measurement of the amount of light scattered by
particles in the water.
Particles: sand, clay and algae
120 cm tall clear plastic tube with a Secchi disk pattern at the
bottom and ruler (cm) along side. The tube measures water
transparency in streams.
Some effects of high turbidity on water quality
• Increase in Temperature
• Decrease in Oxygen
• Decrease in light penetration
• Lost of habitat for aquatic organisms
• REDUCES WATER CLARITY
Nutrient loading effects water clarity. Phosphorus when added in
excess leads to eutrophication which reduces water quality by
reducing water transparency.
Total phosphorus is a combination of soluble reactive phosphorus
(SRP), dissolved phosphorus (DP), and particulate phosphorus (PP).
An estimate of TP can be predicted by PP in streams under certain
conditions.
Particle phosphorus could be an indicator that volunteers can use to
estimate total phosphorus in streams
Phosphorus
Kalamazoo River watershed
Six run-of-river impoundments on the main stem
Small tributary discharge varied from 24 - 63 cfs, main
stem discharged varied from 640 – 2340 cfs
Thirteen sampling sites, including tributaries were sampled
once a week for 10 weeks (June-September 2005).
To evaluate the effectiveness of using transparency tubes to
estimate total suspended solids (TSS), turbidity (NTU), and
total phosphorus (TP) for the purpose of establishing a
volunteer phosphorus monitoring network.
Area: 5,230 km2
Project Objective
Methods
Samples
were
collected
without
disturbing
sediments
or surface
debris
Tube was filled
Water was
released back
into the bucket
Released valve
was closed when
Secchi disk
becomes barely
visible (target
endpoint)
The height of the water was recorded.
The average of two readings was final
transparency reading.
Turbidity
reading were
taken on site
and TSS and TP
were determine
by lab analysis
Turbidity (n=115)
y = -1.1353x + 2.9926
R
2
= 0.77
0.0
0.2
0.4
0.6
0.8
1.0
1.2
1.4
1.6
1.8
0.0 0.5 1.0 1.5 2.0 2.5
Log Transparency tube (cm)
LogTurbidity(NTU)
Total suspended solids (n=115)
y = -1.1486x + 3.0624
R
2
= 0.54
0.0
0.2
0.4
0.6
0.8
1.0
1.2
1.4
1.6
1.8
0.0 0.5 1.0 1.5 2.0 2.5
Log Transparency tube (cm)
LogTotalsuspendedsolids
Total phosphorus (n=115)
y = -107.029x + 264.345
R2
= 0.426
0
20
40
60
80
100
120
140
160
180
1.2 1.3 1.4 1.5 1.6 1.7 1.8 1.9 2.0 2.1 2.2
Log Transparency Tube (cm)
TotalPhosphorus(μg/L)
• The transparency tube was a good predictor of turbidity (R2=0.78)
Transparency tube and turbidity measures similar stream properties
(scattering of light by particulates)
•The decrease in correlation with total suspended solids (R2=0.55)
Particles vary in size, shape, and composition within a stream.
Indicating that there is no universal relationship among sites and so
the sites are unique
Results
•Site uniqueness pattern continues for total phosphorus concentrations
in streams (R2=0.42)
Total phosphorus has 3 forms and those forms may vary in
concentration and particulate (PP) form is important for transparency.
Site specific factors to
Kalamazoo River:
• Ratio of DP:PP,
particles have greater
impact on transparency
than color
•Point source discharge,
2 WWTF have unstable
inputs
•Impoundments, sink or
source for sediments,
and promote algal
growth
100.899Schnable Brook
70.870Battle Creek River
80.854Gun River
100.755
Kalamazoo River in
Battle Creek
100.707Portage Creek
90.689
Kalamazoo River
east of Battle Creek
100.635
Kalamazoo River at
Lake Allegan Inlet
70.528
Kalamazoo River at
Morrow Lake Inlet
100.514
Kalamazoo River at
Lake Allegan Outlet
100.469
Kalamazoo River at
Comstock
70.396Eagle Lake Tributary
100.239
Kalamazoo River at
Plainwell
70.002
Battle Creek River at
Emmett St. Dam
DP to
PP
Ratio
> 1
Point
Source
Influence
Impound-
ment
InfluenceNR2Sample Location
Log transparency versus TP
Training volunteers to use transparency
tubes, Fall 2005 and Spring 2006
Method Protocol
•9-12 volunteers
•Trained using practice bucket of different
transparency using same methods
•Aiming for +/- 5 cm reading from
reference reading
•Focus on the individual skill training and
not the group
•Comfortably identify the target endpoint
without over shooting (subjective reading)
Training “endpoint” as
it comes into view.
Location Protocol
• Site selection based on strong
correlation between transparency
and total phosphorus
•Sampling frequency once every
14 days
•Point source lab provided
volunteer TP lab analysis (samples
were collected on the same day as T.
tube reading)
•Volunteers entered data on
website
Training volunteers to use transparency
tubes, Fall 2005 and Spring 2006
Conclusions
Data
Water clarity measured by transparency tube provided information for
general water quality (turbidity)
Establish individual site correlation each site is unique and influence by
site characteristics
Volunteer program
Focus on outdoor individual skill training in order to develop consistent
transparency tube readings
Focus on recognizing the target endpoint – DO NOT go pass target
endpoint
Estimates of total phosphorus in certain sites can be obtained
with transparency tube in volunteer hands
Acknowledgments
CSREES Water Quality Program
David Weed – Total phosphorus lab
analysis
Kalamazoo River/Lake Allegan TMDL
Implementation Committee
Kellogg Biological Station

C7_Reid_Nicole

  • 1.
    Nicole Reid, JaneHerbert , and Dean Baas MSU Extension Land & Water Program W. K. Kellogg Biological Station Transparency tube as a surrogate for turbidity, suspended solids and total phosphorus in rivers and reservoirs
  • 2.
    Transparency Tube Transparency –a measure of how much light passes through the water. Transparency is effected by turbidity Turbidity – measurement of the amount of light scattered by particles in the water. Particles: sand, clay and algae 120 cm tall clear plastic tube with a Secchi disk pattern at the bottom and ruler (cm) along side. The tube measures water transparency in streams. Some effects of high turbidity on water quality • Increase in Temperature • Decrease in Oxygen • Decrease in light penetration • Lost of habitat for aquatic organisms • REDUCES WATER CLARITY
  • 3.
    Nutrient loading effectswater clarity. Phosphorus when added in excess leads to eutrophication which reduces water quality by reducing water transparency. Total phosphorus is a combination of soluble reactive phosphorus (SRP), dissolved phosphorus (DP), and particulate phosphorus (PP). An estimate of TP can be predicted by PP in streams under certain conditions. Particle phosphorus could be an indicator that volunteers can use to estimate total phosphorus in streams Phosphorus
  • 4.
    Kalamazoo River watershed Sixrun-of-river impoundments on the main stem Small tributary discharge varied from 24 - 63 cfs, main stem discharged varied from 640 – 2340 cfs Thirteen sampling sites, including tributaries were sampled once a week for 10 weeks (June-September 2005). To evaluate the effectiveness of using transparency tubes to estimate total suspended solids (TSS), turbidity (NTU), and total phosphorus (TP) for the purpose of establishing a volunteer phosphorus monitoring network. Area: 5,230 km2 Project Objective
  • 5.
    Methods Samples were collected without disturbing sediments or surface debris Tube wasfilled Water was released back into the bucket Released valve was closed when Secchi disk becomes barely visible (target endpoint) The height of the water was recorded. The average of two readings was final transparency reading. Turbidity reading were taken on site and TSS and TP were determine by lab analysis
  • 6.
    Turbidity (n=115) y =-1.1353x + 2.9926 R 2 = 0.77 0.0 0.2 0.4 0.6 0.8 1.0 1.2 1.4 1.6 1.8 0.0 0.5 1.0 1.5 2.0 2.5 Log Transparency tube (cm) LogTurbidity(NTU)
  • 7.
    Total suspended solids(n=115) y = -1.1486x + 3.0624 R 2 = 0.54 0.0 0.2 0.4 0.6 0.8 1.0 1.2 1.4 1.6 1.8 0.0 0.5 1.0 1.5 2.0 2.5 Log Transparency tube (cm) LogTotalsuspendedsolids
  • 8.
    Total phosphorus (n=115) y= -107.029x + 264.345 R2 = 0.426 0 20 40 60 80 100 120 140 160 180 1.2 1.3 1.4 1.5 1.6 1.7 1.8 1.9 2.0 2.1 2.2 Log Transparency Tube (cm) TotalPhosphorus(μg/L)
  • 9.
    • The transparencytube was a good predictor of turbidity (R2=0.78) Transparency tube and turbidity measures similar stream properties (scattering of light by particulates) •The decrease in correlation with total suspended solids (R2=0.55) Particles vary in size, shape, and composition within a stream. Indicating that there is no universal relationship among sites and so the sites are unique Results •Site uniqueness pattern continues for total phosphorus concentrations in streams (R2=0.42) Total phosphorus has 3 forms and those forms may vary in concentration and particulate (PP) form is important for transparency.
  • 10.
    Site specific factorsto Kalamazoo River: • Ratio of DP:PP, particles have greater impact on transparency than color •Point source discharge, 2 WWTF have unstable inputs •Impoundments, sink or source for sediments, and promote algal growth 100.899Schnable Brook 70.870Battle Creek River 80.854Gun River 100.755 Kalamazoo River in Battle Creek 100.707Portage Creek 90.689 Kalamazoo River east of Battle Creek 100.635 Kalamazoo River at Lake Allegan Inlet 70.528 Kalamazoo River at Morrow Lake Inlet 100.514 Kalamazoo River at Lake Allegan Outlet 100.469 Kalamazoo River at Comstock 70.396Eagle Lake Tributary 100.239 Kalamazoo River at Plainwell 70.002 Battle Creek River at Emmett St. Dam DP to PP Ratio > 1 Point Source Influence Impound- ment InfluenceNR2Sample Location 100.899Schnable Brook 70.870Battle Creek River 80.854Gun River 100.755 Kalamazoo River in Battle Creek 100.707Portage Creek 90.689 Kalamazoo River east of Battle Creek 100.635 Kalamazoo River at Lake Allegan Inlet 70.528 Kalamazoo River at Morrow Lake Inlet 100.514 Kalamazoo River at Lake Allegan Outlet 100.469 Kalamazoo River at Comstock 70.396Eagle Lake Tributary 100.239 Kalamazoo River at Plainwell 70.002 Battle Creek River at Emmett St. Dam DP to PP Ratio > 1 Point Source Influence Impound- ment InfluenceNR2Sample Location Log transparency versus TP
  • 11.
    Training volunteers touse transparency tubes, Fall 2005 and Spring 2006 Method Protocol •9-12 volunteers •Trained using practice bucket of different transparency using same methods •Aiming for +/- 5 cm reading from reference reading •Focus on the individual skill training and not the group •Comfortably identify the target endpoint without over shooting (subjective reading) Training “endpoint” as it comes into view.
  • 12.
    Location Protocol • Siteselection based on strong correlation between transparency and total phosphorus •Sampling frequency once every 14 days •Point source lab provided volunteer TP lab analysis (samples were collected on the same day as T. tube reading) •Volunteers entered data on website Training volunteers to use transparency tubes, Fall 2005 and Spring 2006
  • 13.
    Conclusions Data Water clarity measuredby transparency tube provided information for general water quality (turbidity) Establish individual site correlation each site is unique and influence by site characteristics Volunteer program Focus on outdoor individual skill training in order to develop consistent transparency tube readings Focus on recognizing the target endpoint – DO NOT go pass target endpoint Estimates of total phosphorus in certain sites can be obtained with transparency tube in volunteer hands
  • 14.
    Acknowledgments CSREES Water QualityProgram David Weed – Total phosphorus lab analysis Kalamazoo River/Lake Allegan TMDL Implementation Committee Kellogg Biological Station