
![Wal-Mart business overview from the company’s financial report:
“Wal-Mart Stores, Inc. helps people around the world save money and live
better – anytime and anywhere – in retail stores, online, and through their
mobile devices. We earn the trust of our customers every day by providing a
broad assortment of quality merchandise and services at everyday low prices
("EDLP"), while fostering a culture that rewards and embraces mutual respect,
integrity and diversity. EDLP is our pricing philosophy under which we price
items at a low price every day so our customers trust that our prices will not
change under frequent promotional activity.”[1]
SLIDE | 3
BUSINESS DESCRIPTION (1/2)
“ ”](https://image.slidesharecdn.com/walmartswotanalysis2017short-171019093004/85/Walmart-SWOT-analysis-2017-3-320.jpg)
![“Our operations comprise three reportable business segments: Walmart U.S.,
Walmart International and Sam's Club. During fiscal 2016, we generated total
revenues of $482 billion, which was primarily comprised of net sales of $479
billion. Walmart U.S. is our largest segment and operates retail stores in various
formats in all 50 states in the U.S., Washington D.C. and Puerto Rico, as well as
its online retail operations, walmart.com.
Walmart International consists of the Company's operations in 27 countries
outside of the U.S. and its operations include numerous formats of retail stores,
wholesale clubs, including Sam's Clubs, restaurants, banks and various retail
websites.
Sam's Club consists of warehouse membership clubs and operates in 48 states
in the U.S. and in Puerto Rico, as well as its online operations,
samsclub.com.”[1]
SLIDE | 4
BUSINESS DESCRIPTION (2/2)
“ ”](https://image.slidesharecdn.com/walmartswotanalysis2017short-171019093004/85/Walmart-SWOT-analysis-2017-4-320.jpg)
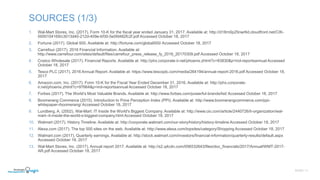
![1. Being the largest retailer in the world, with unmatched scale of operations
and strong market power over suppliers and competitors
SLIDE | 5
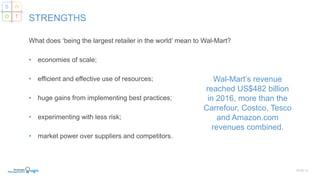
STRENGTHS
S W
O T
Wal-Mart is the
world’s largest
company by
revenue and the
largest retailer in
the world.[2]
Wal-Mart Carrefour Costco Tesco
Revenue
(US$
billions)
482.130 ~113.280 113.666 ~102.684
Locations 11,528 12,296 686 6,902
Countries
served
28 35 9 13
Employees 2.3 million 380,000 205,000 476,000
Retail space
(square feet)
1.149 billion - 98.7million -
Figure 1. Comparison of the top 4 retailers in the world in 2016
Source: The respective companies’ financial reports[1][3][4][5] (Carrefour and Tesco revenues are
rounded up due to revenue translation.)](https://image.slidesharecdn.com/walmartswotanalysis2017short-171019093004/85/Walmart-SWOT-analysis-2017-5-320.jpg)
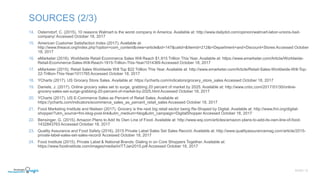
![1. Overdependence on sales from the U.S. market
SLIDE | 7
WEAKNESSES
S W
O T
In 2016, 74.5%
of all company
revenue and
more than 85%
of its operating
income came
from the U.S.
Walmart U.S.
2016
Net sales 298.378
% share of total
revenue
62.3
% revenue growth 3.6
2015
Net sales 288.049
% share of total
revenue
59.8
% revenue growth 3.1
2014
Net sales 279.406
% share of total
revenue
59.0
% revenue growth 1.8
Figure 5. Wal-Mart’s revenue growth in 2014-2016 (in US$ billions)
Source: Wal-Mart’s financial report 2016[1]](https://image.slidesharecdn.com/walmartswotanalysis2017short-171019093004/85/Walmart-SWOT-analysis-2017-7-320.jpg)
![1. The e-commerce market is forecast to reach US$2.5 trillion by 2018, a
projected growth of 89.1% in 4 years
SLIDE | 8
OPPORTUNITIES
S W
O T
Figure 10. Total e-commerce sales worldwide (actual and forecast), 2013-2018
1.077
1.316
1.592
1.888
2.189
2.489
25.9% 22.2% 20.9% 18.6% 16.4% 13.3%
2013 2014 2015 2016 2017 2018
Total E-Commerce Sales (in trillions, US$) Change (%)
Source: eMarketer[22]](https://image.slidesharecdn.com/walmartswotanalysis2017short-171019093004/85/Walmart-SWOT-analysis-2017-8-320.jpg)
![• Wal-Mart currently
operates in 6 of the 10
largest e-commerce
markets in the world,
including China, the
U.S., the U.K., Japan,
Canada and Brazil.
• The company could
expand its e-commerce
operations in other
countries as well.
SLIDE | 9
OPPORTUNITIES
Countries 2014 2015 2016 2017 2018
1. China 315.75 426.26 562.66 871.79 1,011.28
2. U.S. 264.28 305.65 349.06 442.55 493.89
3. UK 70.39 82.00 93.89 114.64 124.96
4. Japan 62.13 70.83 79.33 96.87 106.07
5. Germany 51.91 63.38 73.46 91.97 99.33
6. France 34.21 38.36 42.62 49.71 53.26
7. South Korea 29.30 33.11 36.76 44.07 47.82
8. Canada 20.98 24.63 28.77 37.61 42.67
9. Russia 15.06 17.47 20.30 26.88 30.91
10. Brazil 13.34 16.28 18.80 23.79 26.17
Figure 11. Top 10 countries ranked by total e-commerce sales worldwide (actual and forecast, 2014-2018 (in US$ billions)
Source: eMarketer[30]
S W
O T](https://image.slidesharecdn.com/walmartswotanalysis2017short-171019093004/85/Walmart-SWOT-analysis-2017-9-320.jpg)
![1. Slowing growth of the China, Canada, Brazil, Japan and Chile retail markets
SLIDE | 10
THREATS
S W
O T
2012 Jan 2013 Jan 2014 Jan 2015 Jan 2016 Jan
China 14.7 12.2 11.8 10.7 10.2
Canada 0.2 0.9 0.9 - 2
Brazil 7.3 5.9 6.2 0.6 (10.6)
Japan 1.5 (1.1) 4.4 (1.1) (0.1)
Chile 6.8 9.5 6 1.8 3.4
Figure 17. Retail sales growth in China, Canada, Brazil, Japan and Chile in 2010-2015 (in percentages)
Source: Trading Economics [31][32][33][34][35]
Wal-Mart’s foreign retail
markets are becoming
increasingly saturated
each year and their
growth is slowing.](https://image.slidesharecdn.com/walmartswotanalysis2017short-171019093004/85/Walmart-SWOT-analysis-2017-10-320.jpg)


The document presents a SWOT analysis of Wal-Mart Stores, Inc. in 2017, highlighting its position as the world's largest retailer with revenues of $482.13 billion. It emphasizes strengths such as market power and economies of scale, while addressing weaknesses like overdependence on the U.S. market and threats from slowing international growth. Opportunities for expansion in e-commerce markets are also discussed, along with significant competitors in the retail sector.


