Smart Noise Cancellation: New Level of Clarity in Digital Radiography
•
0 likes•156 views

Smart Noise Cancellation (SNC) is a deep learning technique developed by Carestream Health to reduce noise in medical images while preserving fine detail. It uses a U-Net convolutional neural network trained on pairs of low-noise and simulated high-noise images. SNC predicts and subtracts a noise field from input images. Objective tests found SNC reduced noise by 2-4x while maintaining high-contrast sharpness and improving low-contrast detail detection. Subjective reader tests with radiologists found images processed with SNC were slightly to strongly preferable over traditional processing and had higher diagnostic capability ratings. SNC allows lowering radiation dose levels while maintaining image quality.

Recommended
Recommended
More Related Content
What's hot
What's hot (19)
Similar to Smart Noise Cancellation: New Level of Clarity in Digital Radiography
Similar to Smart Noise Cancellation: New Level of Clarity in Digital Radiography (20)
More from Carestream
More from Carestream (20)
Recently uploaded
Recently uploaded (20)
Smart Noise Cancellation: New Level of Clarity in Digital Radiography
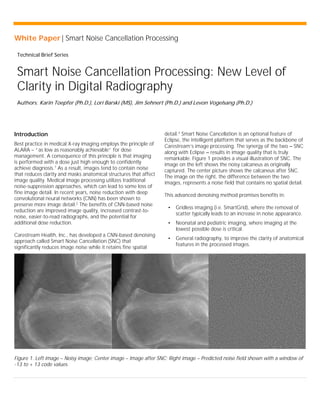
- 1. White Paper | Smart Noise Cancellation Processing Technical Brief Series Smart Noise Cancellation Processing: New Level of Clarity in Digital Radiography Authors: Karin Toepfer (Ph.D.), Lori Barski (MS), Jim Sehnert (Ph.D.) and Levon Vogelsang (Ph.D.) Introduction Best practice in medical X-ray imaging employs the principle of ALARA – “as low as reasonably achievable” for dose management. A consequence of this principle is that imaging is performed with a dose just high enough to confidently achieve diagnosis.1 As a result, images tend to contain noise that reduces clarity and masks anatomical structures that affect image quality. Medical image processing utilizes traditional noise-suppression approaches, which can lead to some loss of fine image detail. In recent years, noise reduction with deep convolutional neural networks (CNN) has been shown to preserve more image detail.2 The benefits of CNN-based noise reduction are improved image quality, increased contrast-to- noise, easier-to-read radiographs, and the potential for additional dose reduction. Carestream Health, Inc., has developed a CNN-based denoising approach called Smart Noise Cancellation (SNC) that significantly reduces image noise while it retains fine spatial detail.3 Smart Noise Cancellation is an optional feature of Eclipse, the intelligent platform that serves as the backbone of Carestream’s image processing. The synergy of the two – SNC along with Eclipse – results in image quality that is truly remarkable. Figure 1 provides a visual illustration of SNC. The image on the left shows the noisy calcaneus as originally captured. The center picture shows the calcaneus after SNC. The image on the right, the difference between the two images, represents a noise field that contains no spatial detail. This advanced denoising method promises benefits in: • Gridless imaging (i.e. SmartGrid), where the removal of scatter typically leads to an increase in noise appearance. • Neonatal and pediatric imaging, where imaging at the lowest possible dose is critical. • General radiography, to improve the clarity of anatomical features in the processed images. Figure 1. Left image – Noisy image; Center image – Image after SNC; Right image – Predicted noise field shown with a window of -13 to + 13 code values.
- 2. White Paper | Smart Noise Cancellation Processing 2 Smart Noise Cancellation Algorithm Smart Noise Cancellation uses a deep convolutional neural network4 that is trained to predict a noise field from an input image (Figure 2). A U-Net architecture5 was trained using low- noise/high-noise image pairs of clinical patient, cadaver, and anthropomorphic phantom images representative of general radiography. The high-noise images were produced by using image simulations6 to create a lower-dose equivalent of the input original (low-noise) images. The simulated high-noise images were equivalent to 40 % of the dose of the input original (low-noise) images. The noise simulations were based on a validated physical noise model of a-Si-based flat-panel detectors incorporating exposure-dependent X-ray quantum and detector panel structure noise, exposure-independent electronic noise as well as the spatial texture of the noise. The input original images, scaled to the lower-dose aim, but preserving the higher signal-to-noise ratio, were used as the aims for training. The benefits of using simulated noise are that misregistration issues are eliminated (misregistration would cause an artificial loss of sharpness) and many examples of noisy images are readily available without repeated patient exposures. Figure 2. Diagram illustrating the model pipeline. A noisy image is input into the network that predicts a noise field. This noise field is then subtracted from the input image to produce the noise-reduced image. During the training process, 480 small patches of 128 x 128 pixels were randomly sampled from the input images with a 2560 x 3072 pixel matrix. Patch selection was randomized for each batch in the optimization, resulting in at least 25 million different noise patches used during training. The weights of the U-Net were optimized based on the mean absolute error-loss function between the predicted and the aim noise field. Different CNN noise models were trained for all types of flat- panel detectors in the Carestream portfolio. Detectors were grouped by pixel spacing, flat panel, and scintillator technology (cesium iodide, CSI and gadolinium oxysulfide, GOS), as shown in Table 1. Detector Type Scintillator Pixel Pitch DRX Plus 3543/4343 GOS 0.139 DRX Plus 3543C/4343C CsI 0.139 DRX Plus 2530C CsI 0.098 DRX-1 GOS 0.139 DRX1-C, DRX 2530C CsI 0.139 Table 1. Detector types for which CNN noise models were created.
- 3. White Paper | Smart Noise Cancellation Processing 3 Objective Performance on Carestream DRX Plus Detectors Background While it is understood that the properties of CNN-based noise suppression are nonlinear, it is nevertheless valuable to characterize its performance in terms of image quality using traditional methods of analysis of nonclinical data. Specifically, noise in flat image areas, sharpness, and rendition of low contrast and fine detail were characterized based on flat-field and test-phantom captures. Smart Noise Cancellation is the first step in the image-processing chain after receiving the raw images from the detector before any other image enhancements. This makes the images before and after SNC suitable for analysis of image-quality measures, such as using Normalized Noise Power Spectra (NNPS) and Modulation Transfer Function (MTF), measured according to the IEC 62220-1-1 Standard7 , and the contrast-detail curve obtained using the Artinis CDRAD 2.0 phantom. A second form of objective testing was done based upon disease-feature simulation. Disease features consisted of 10 mm lung nodules8 and a 0.5 mm high-contrast feature at two contrast levels. A mathematical observer, specifically a channelized Hotelling observer, was employed to demonstrate increased detectability of disease features with SNC. Details of this analysis are provided in Reference 3. Noise reduction in uniform image areas A special test phantom shown in Figure 3a contains aluminum step tablets, resolution targets, small acrylic beads, wire mesh, bone chips, and other features for the qualitative and quantitative evaluation of image quality. This phantom was imaged at 80 kVp, 0.5 mm Cu / 1 mm Al filtration, 180 cm source-to-image distance, 0.5, 1.0, 2.0 and 10 mAs. Uniform- area noise-reduction results are shown for the CARESTREAM DRX Plus 3543C Detector in Figure 3c. Figure 3b shows an image of the phantom's one-step tablets together with the regions of interest used for analysis of standard deviation, as a measure of noise and mean. The solid blue line before denoising indicates quantum-limited behavior (Noise µ mean0.5 ). The flat-field noise reduction ranged between 4X at low exposures and 2X at higher exposures. In terms of quantum noise, a 2X noise reduction corresponds to the image appearance of a 4X higher exposure. a b c Figure 3. Uniform area noise reduction. Preservation of high-contrast sharpness The Modulation Transfer Function (MTF) was calculated from acquisitions of an edge target conforming to the IEC 62220-1- 1 standard for DQE measurement under RQA-5 beam conditions. The exposure level was chosen at approximately 3.2 times the normal exposure level for each detector. The normal exposure level corresponds to 2.5 µGy for detectors with a CsI (Tl) scintillator and 3.1 µGy for detectors with a GOS scintillator.
- 4. White Paper | Smart Noise Cancellation Processing 4 An image of the edge phantom is shown in Figure 4a. Preservation of high-contrast sharpness is demonstrated in Figure 4b for the CARESTREAM DRX Plus 3543C Detector – there was no MTF loss after SNC was performed. a b Figure 4. Preservation of high-contrast sharpness. Preservation of low-contrast and high-frequency detail Contrast-detail analysis is a common procedure to characterize the detectability of low-contrast and fine (high-frequency) detail in an X-ray imaging system including the X-ray detector, medical image display, and the human visual system. The Artinis CDRAD Phantom 2.09 , used for this purpose, is a 265 x 265 x 10 mm3 PMMA tablet with a matrix of 15 rows and columns containing cylindrical holes of variable diameter and depth. The layout of the phantom is shown in Figure 5a. A contrast-detail curve is generated using this phantom and represents a plot of minimum visible feature size as a function of contrast (hole depth). The images of the CDRAD 2.0 phantom were acquired at 70 kVp with a 12:1 203 lp/cm grid to represent general radiography. The phantom was sandwiched between two 5 cm thick sheets of polymethyl methacrylate (PMMA) to simulate thicker anatomy. All images were acquired on a CPI Indico 100 X-ray generator without additional filtration at SID = 183 cm, small focal spot (0.6 mm). Detector entrance air kerma under the phantom corresponded to 1, 1.25, 2.5, 5 and 10 µGy. The images were scored with the Artinis CDRAD Analyzer 2.1.15 software to produce contrast-detail curves and IQFinv image quality scores before and after SNC. Eight replicate images were included in each score and the confidence level was set to 5.e-5 in the software. The inverse of image quality figure score IQFinv was calculated according to the following equation: 𝐼𝐼𝐼𝐼𝐼𝐼𝑖𝑖𝑖𝑖𝑖𝑖 = 100
- 5. White Paper | Smart Noise Cancellation Processing 5 In summary, objective measures used to assess image quality with Smart Noise Cancellation demonstrate the following: • A 2X to 4X noise reduction in flat areas is attainable. • High-contrast sharpness is preserved. • A 10 % to 20 % improvement in contrast-detail scores on the CDRAD 2.0 phantom is attainable. a. Artinis CDRAD Phantom b. Hole pair before and after SNC c. IQFinv scores vs. detector air kerma d. Contrast-detail curve before and after SNC, 1.25 µGy Figure 5. Contrast-detail results for the CARESTREAM DRX Plus 3543C Detector.
- 6. White Paper | Smart Noise Cancellation Processing 6 Comparison of Scintillator Technology Carestream’s detector portfolio offers a choice of two scintillators – gadolinium oxysulfide (GOS) and cesium iodide (CsI). GOS scintillators provide a cost-effective offering with good image quality and reduced dose compared with computed radiography. The CsI scintillator is a premium offering, delivering the highest image quality at the lowest dose based on its higher X-ray absorption and improved light management due to the columnar structure of the scintillator material compared with GOS. As a result, images acquired on a CsI detector have a higher signal-to-noise ratio (SNR) than images on GOS at the same input exposure (dose). This is illustrated by the fitted red and blue lines in Figure 6. The data in Figure 6 refer to flat-field exposures under RQA-5 beam conditions. After SNC, denoted by the open red circles and blue triangles in Figure 6, the SNR for both scintillator technologies is significantly improved. In flat fields, the SNR with the GOS scintillator after SNC is higher than that of CsI scintillator without applying the algorithm. For more complex anatomical images, SNC enables the noise associated with the GOS scintillator to be reduced to a level that is comparable to a CsI scintillator as illustrated in Figure 7. The acquisitions were performed at 500 speed (75 kVp, 6.3 mAs, 40 ln/cm 6:1 grid, IEC EI 129 (CsI), 126 (GOS). Figure 6. Signal-to-noise ratio (SNR) of flat fields vs. air kerma under RQA-5 beam conditions; CsI (CARESTREAM DRX Plus 3543C Detector)) and GOS (DRX Plus 3543) before and after SNC. Figure 7. Comparison of a 500 speed Hip exam acquired on CSI vs. 500 speed Hip exam acquired on GOS with Smart Noise Cancellation.
- 7. White Paper | Smart Noise Cancellation Processing 7 Subjective Performance of Smart Noise Cancellation The greatest risk of denoising images is the possibility of inadvertently removing important information. The assessment of this risk is best accomplished by performing a controlled observational study that evaluates image quality based upon human observers with appropriate domain knowledge. Two U.S. board certified radiologists (specialty in diagnostic radiology) evaluated 67 pairs of human clinical and cadaveric subjects on five detector types (Table 1). Exposures ranged from 200–1000 speed (image selection biased towards low- exposure cases) with an IEC EI distribution shown in Figure 8. Varied exam types and patient sizes were evaluated. The evaluation was performed on a PACS workstation configured with two diagnostic monitors calibrated to the DICOM grayscale standard display function. Figure 8. Distribution of IEC Exposure indexes in the reader study. Pairs consisted of the same image processed with default Eclipse II image-processing software (which includes traditional noise suppression) and Eclipse II with SNC software where 100 % of the predicted noise field was removed. Prior to the study, Eclipse II with SNC was tuned to have default processing, which turns off the traditional noise suppression (a separate capability in Eclipse II) and takes advantage of the noise reduction by optimizing sharpness. Image pairs were randomly placed left/right on the PACS workstation monitors and the pairs were randomly distributed among five reading worklists. The worklists were shuffled for each reader so that no reader could read images in the same order. Readers were blinded to the image treatments (i.e. what image was on the left vs. right). The images were evaluated pairwise using a five-point visual- difference preference scale tied to diagnostic confidence, as described in Table 2. The readers were instructed to use the preference scale such that slightly preferable ratings would likely not impact the diagnosis and strongly preferable ratings would likely impact the diagnosis. In addition, the overall diagnostic capability of each image in the pair was rated using the RadLex10 scale, as described in Table 3. Rating Score Score Description -2 Left image strongly preferable, probable diagnostic impact -1 Left image slightly preferable, no diagnostic impact 0 No preference +1 Right image slightly preferable, no diagnostic impact +2 Right image strongly preferable, probable diagnostic impact Table 2. Five-Point Visual-Difference Preference Scale.
- 8. White Paper | Smart Noise Cancellation Processing 8 Score Term Definition 1 Non-diagnostic Unacceptable for diagnostic purposes. Little or no clinically usable diagnostic information (e.g., gross underexposure, system failure, or extensive motion artifact). Almost all such imaging should be repeated. Similar to International Labor Office (ILO) classification* #4: “Unacceptable.” 2 Limited Acceptable, with some technical defect (motion artifact, body habitus/poor X-ray penetration, or patient positioning may limit visualization of some body regions but still adequate for diagnostic purposes). Not as much diagnostic information as is typical for an examination of this type, but likely sufficient. Similar to ILO classification #3: “Poor,” with some technical defect, but still acceptable. 3 Diagnostic Image quality that would be routinely expected when imaging cooperative patients. Similar to ILO classification #2: “Acceptable,” with no technical defect likely to impair classification of the radiograph. 4 Exemplary Good, most adequate for diagnostic purposes. Image quality that can serve as an example that should be emulated. Similar to (ILO) classification #1: “Good.” Table 3. RadLex Scale for Diagnostic Capability Rating. The readers were trained on the PACS. Each observer started the evaluation at a different point in the worklist of images in order to guard against learning bias. Observers could adjust the window width/window level, pan, magnify, and synchronized pan/magnify on the PACS workstation while evaluating image quality. After the observers finished rating the images, left/right preference ratings were decoded so that positive values indicated favor for SNC. Similarly, RadLex ratings were decoded to map left/right ratings to their corresponding treatment: Eclipse II or Eclipse II with SNC. Reader Study Results Table 4 presents descriptive statistics of all ratings and the distribution of RadLex ratings is presented in Figure 2. The median Eclipse II with SNC RadLex rating was 4 (exemplary). A RadLex difference of 0.5 (one-half of a rating level) is a meaningful difference that indicates a substantial difference in image quality. Inference testing (paired t-test) of the RadLex rating differences – testing if the mean difference was greater than 0.5 – is summarized in Table 5 and demonstrates that Eclipse II processing with SNC yields diagnostic quality ratings that are substantially higher than the Eclipse II processing alone, with a 95 % level of confidence (* indicates a significant p-value result). Eclipse II RadLex Eclipse II w/ SNC RadLex Pair Preference (+ favor for SNC) Mean 2.9 3.6 1.3 Std. Error mean 0.03 0.04 0.06 Median 3 4 1.0 Std. Deviation 0.34 0.50 0.66 95% Conf. Interval (2.83, 2.95) (3.48,3.65) (1.23, 1.46) Count 133 133 133 Table 4. Descriptive statistics for all RadLex and preference ratings.
- 9. White Paper | Smart Noise Cancellation Processing 9 Figure 9. Distribution of RadLex ratings for all readers. Metric Hypothesis Statement Test Estimation of Paired Difference Mean Std. Dev. SE Mean 95 % Lower Bound for m diff t-statistic p-value RadLex Difference Ho: mean diff = 0.5 Ha: mean diff > 0.5 Paired t-test 0.68 0.53 0.05 0.60 3.84 0.000* Table 5. Paired t-test results of RadLex rating differences. A preference rating greater than 0.5 is considered a level that matters. The one-sample t-test was used to determine if the mean preference was greater than 0.5 and the result is summarized in Table 6. The mean preference (positive values indicate favor for Eclipse II with SNC) is greater than 0.5, supporting the conclusion that Eclipse II with SNC is substantially more preferred over Eclipse II alone with 95 % confidence. Figure 10 is the distribution of all preference ratings and 89.5 % of all ratings showed slight to strong preference for the SNC processing (Figure 10).
- 10. White Paper | Smart Noise Cancellation Processing 10 Metric Hypothesis Statement Test Estimation of Preference Mean Std. Dev. SE Mean 95 % Lower Bound for µ t-statistic p-value Preference Ho: mean ≤ 0.5 Ha: mean > 0.5 1-sample t-test 1.35 0.66 0.06 1.25 14.70 0.000* Table 6. One-sample t-test of preference ratings. Figure 10. Distribution of preference ratings for all readers. Table 7 is a paired comparison contingency table of RadLex ratings. Zero counts above the shaded diagonal indicate zero instances of the Eclipse II processing being rated higher than Eclipse II processing with SNC. There were four instances of images processed with default Eclipse processing being rated as “Limited,” but after SNC were rated “Exemplary.” Likewise, there were 13 instances of images processed with default Eclipse processing being rated as “Limited,” but after SNC were rated “Diagnostic.” And finally, there were 77 instances of images processed with default Eclipse processing being rated as “Diagnostic,” but after SNC were rated “Exemplary.”
- 11. White Paper | Smart Noise Cancellation Processing 11 Predicate RadLex Ratings Counts % of Row 1 Non-diagnostic 2 Limited 3 Diagnostic 4 Exemplary Total Investigational RadLex Ratings 1 Non-diagnostic 0 0 0 0 0 0.00 % 0.00 % 0.00 % 0.00 % 0.00 % 2 Limited 0 0 0 0 0 0.00 % 0.00 % 0.00 % 0.00 % 0.00 % 3 Diagnostic 0 12 46 0 58 0.00 % 20.69 % 79.31 % 0.00 % 100.00 % 4 Exemplary 0 4 70 1 75 0.00 % 5.33 % 93.33 % 1.33 % 100.00 % Total 0 16 116 1 133 0.00 % 12.03 % 87.22 % 0.75 % 100.00 % Table 7. RadLex paired-comparison contingency table. These increases in diagnostic capability clearly indicate that Eclipse II with SNC provides significant improvements in image quality. Reader variability was not a significant source of variation in the study (ANOVA with Ho: readers are equal; Ha: readers are not equal; p = 0.572). Likewise, detector type was not a significant source of variation (p = 0.264) and speed was not a significant source of variation (p = 0.518). In conclusion, subjective assessment by board-certified radiologists yields a strong signal that Eclipse II with Smart Noise Cancellation significantly improves image quality and is strongly preferred. Examples of Smart Noise Cancellation Processing Figures 11 through 14 are additional examples of SNC. Figure 11 demonstrates its benefit when combined with SmartGrid. Figure 12 demonstrates its benefit on an adult elbow and includes the noise field. Notice the lack of structure and edges in the noise field. Figure 13 demonstrates SNC on a low-exposure pediatric arm along with the noise field. Figure 14 demonstrates SNC processing on a low-exposure pediatric babygram acquired on the CARESTREAM DRX Plus 2530C Detector.
- 12. White Paper | Smart Noise Cancellation Processing 12 Figure 11. Left image – Eclipse with scatter suppression (SmartGrid), EI 158; Right image – same image Eclipse with scatter suppression (SmartGrid) and SNC, resulting in improved clarity. Figure 12. Adult elbow imaged on the CARESTREAM DRX Plus 2530C Detector, 55 kVp, 0.36 mAs, IEC EI 69. Left image – Eclipse II default processing; Middle image – Eclipse II with SNC; Right image – noise field.
- 13. White Paper | Smart Noise Cancellation Processing 13 Figure 13. Infant arm imaged on the CARESTREAM DRX-1 Detector (GOS), 43 kVp, 46” SID, 1 mAs, IEC EI 154. Left image – Eclipse II default processing; Middle image – Eclipse II with SNC; Right image – noise field.
- 14. White Paper | Smart Noise Cancellation Processing 14 Figure 14. Pediatric babygram imaged on the CARESTREAM DRX Plus 2530 Detector, 55 kVp, 1 mAs, IEC EI 80. Left half – default processing; Right half – SNC processing Customized Noise Reduction Objective measurements and subjective ratings demonstrate that SNC processing can reduce noise while simultaneously retaining fine spatial detail. The objective measurements present reasonable evidence that dose reduction is possible, potentially up to 2X for detectors using CsI scintillators. But because the desired level of noise is subjective (e.g., some radiologists expect to see a certain degree of noise in images, which assures them that the patient was not over-exposed), and its impact can be substantial, Carestream has enabled users to select their preferred level of noise reduction. The “Noise Adjustment Level” parameter is available to the user on the Image Processing Preference Editor and enables the key operator to set the amount of noise that is removed, from 100 % (the full noise field) to 50 % (half the magnitude of the noise field). SNC processing is available with Carestream’s ImageView software. Conclusion Images processed with Eclipse II with SNC demonstrate a significant improvement in image quality and provide a level of clarity never achieved before in projection radiography. Objective testing demonstrates that Smart Noise Cancellation processing enables a 2X to 4X noise reduction in flat areas, preserves high-frequency sharpness, and improves contrast detail. Subjective evaluation of images from five detector types, a wide range of exams, and a wide range of exposure levels corroborate these results. A dose-reduction study is forthcoming to further explore the capabilities of this new and exciting technology.
- 15. White Paper | Smart Noise Cancellation Processing carestream.com ©Carestream Health, Inc., 2021. CARESTREAM is a trademark of Carestream Health. CAT 2000 289 04/21 “Rx only” 1 https://www.carestream.com/blog/2020/04/21/ understanding-and-managing-noise-sources-in-x-ray-imaging/ 2 Hu Chen, Yi Zhang, “Low-Dose CT with a Residual Encoder- Decoder Convolutional Neural Network (RED-CNN),” 2017, https://arxiv.org/ftp/arxiv/papers/1702/1702.00288.pdf 3 SNC Technical Paper: https://www.carestream.com/en/us/medical/software/~/media// publicSite/Resources/Smart%20Noise%20Cancellation%20%2 0Technical%20Paper%20%20Dec%202020.pdf 4 Rikiya Yamashita, Mizuho Nishio, Richard Kinh Gian Do, Kaori Togashi, “Convolutional Neural Networks: An Overview and Application in Radiology,” 2018, https://doi.org/10.1007/s13244-018-0639-9 5 Olaf Ronneberger, Philipp Fischer, Thomas Brox, “U-Net: Convolutional Networks for Biomedical Image Segmentation,” 2015, https://arxiv.org/pdf/1505.04597.pdf 6 US Patent 7480,365 B1 (K. Topfer, J. Ellinwood, “Dose Reduced Digital Medical Image Simulations”), 1/20/2009 7 IEC 62220-1-1, “Medical Electrical Equipment – Characteristics of Digital X-ray Imaging Devices – Part 1-1: Determination of the Detective Quantum Efficiency – Detectors Used in Radiographic Imaging,” Ed. 1, 2015 8 E. Samei, M. J. Flynn, and W. R. Eyler, “Simulation of Subtle Lung Nodules in Projection Chest Radiography,” Radiology, 202, 117-124 (1997) 9 M.A.O Thijssen, K.R. Bijkerk, R.J.M. van der Burght, “Manual Contrast-Detail Phantom CDRAD Type 2.0,” University Hospital Nijmegen, St. Radboud, 1998 10 Radiological Society of North America (2010) RadLex: A Lexicon for Uniform Indexing and Retrieval of Radiology Information Resources. Available via http://www.rsna.org/radlex/. Accessed 22 Oct 2010.