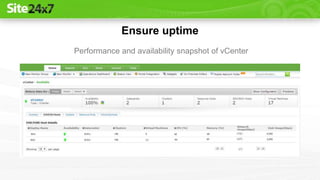
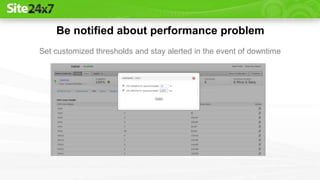
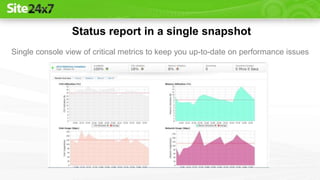
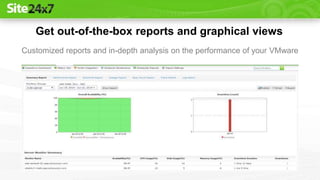
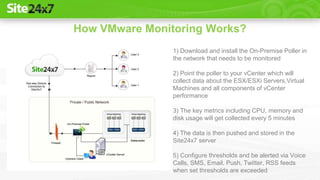
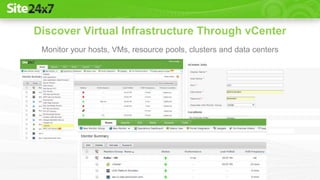
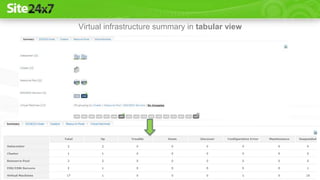
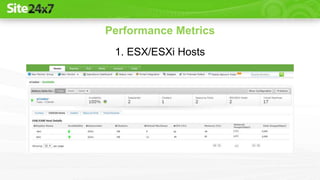
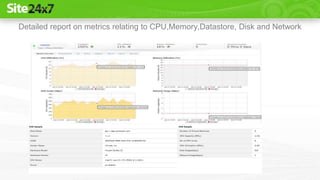
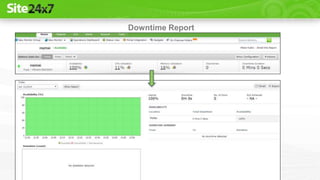
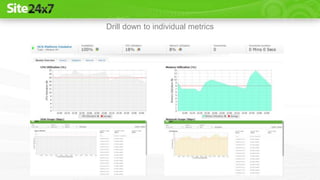
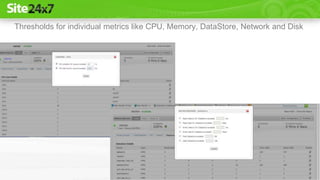
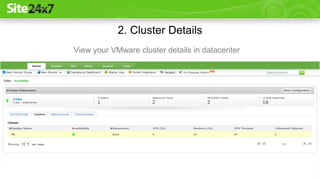
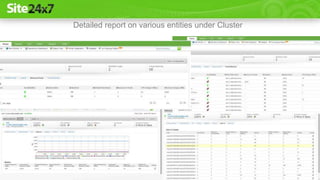
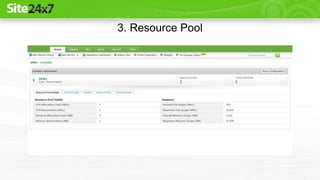
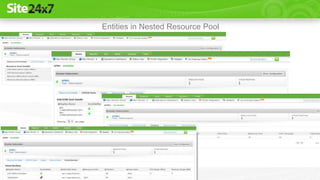
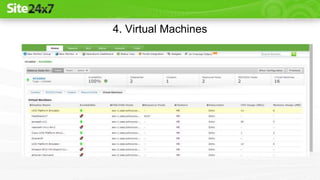
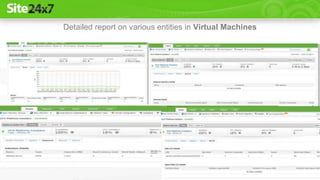
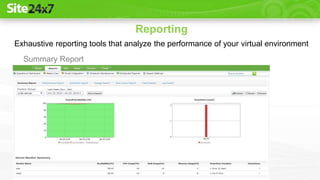
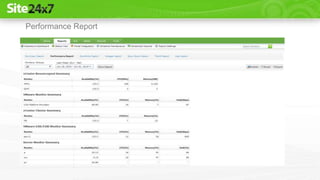
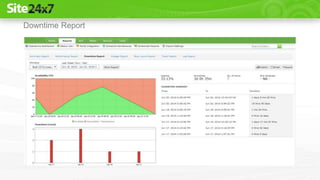
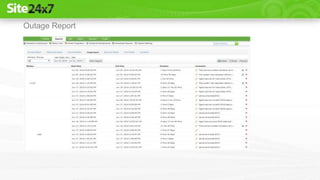
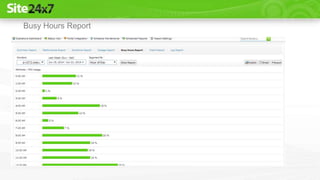
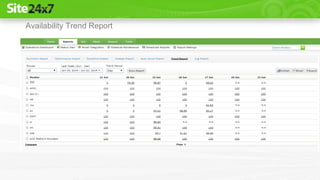
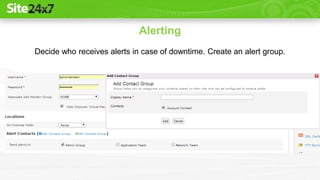
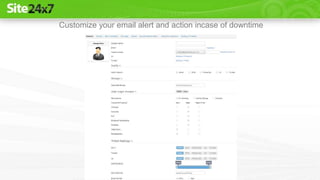
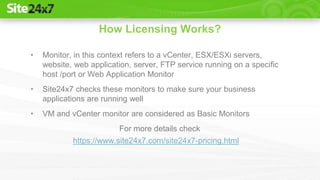
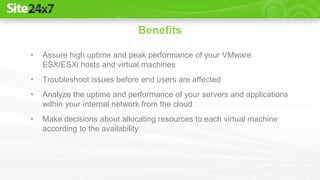
Site24x7 VMware vSphere
Monitoring
Auto Discover Your Entire Virtual Environment
• Highlights-VMware monitoring
• How VMware monitoring works
• Discover virtual infrastructure through vCenter
• Performance metrics
• Reporting and Alerting
• How licensing works
• Benefits
Agenda
• Auto-Discover the entire virtual environment through vCenter
• Add and Monitor ESX/ESXi hosts independently
• Visualize your virtual infrastructure
• Status report in a single snapshot
• Ensure uptime
• Be notified about performance problems
• Get out-of-the-box reports and graphical views
• SaaS
Highlights-VMware Monitoring
Auto-Discover the entire virtual environment through
vCenter
Entire virtual infrastructure in a single view
Ensure uptime
Performance and availability snapshot of vCenter
Be notified about performance problem
Set customized thresholds and stay alerted in the event of downtime
Status report in a single snapshot
Single console view of critical metrics to keep you up-to-date on performance issues
Get out-of-the-box reports and graphical views
Customized reports and in-depth analysis on the performance of your VMware
How VMware Monitoring Works?
1) Download and install the On-Premise Poller in
the network that needs to be monitored
2) Point the poller to your vCenter which will
collect data about the ESX/ESXi Servers,Virtual
Machines and all components of vCenter
performance
3) The key metrics including CPU, memory and
disk usage will get collected every 5 minutes
4) The data is then pushed and stored in the
Site24x7 server
5) Configure thresholds and be alerted via Voice
Calls, SMS, Email, Push, Twitter, RSS feeds
when set thresholds are exceeded
Discover Virtual Infrastructure Through vCenter
Monitor your hosts, VMs, resource pools, clusters and data centers
Auto discovery of your virtual infrastructure
Virtual infrastructure summary in tabular view
Performance Metrics
1. ESX/ESXi Hosts
Detailed report on metrics relating to CPU,Memory,Datastore, Disk and Network
Downtime Report
Drill down to individual metrics
Thresholds for individual metrics like CPU, Memory, DataStore, Network and Disk
2. Cluster Details
View your VMware cluster details in datacenter
Detailed report on various entities under Cluster
3. Resource Pool
Entities in Nested Resource Pool
4. Virtual Machines
Detailed report on various entities in Virtual Machines
Reporting
Summary Report
Exhaustive reporting tools that analyze the performance of your virtual environment
Performance Report
Downtime Report
Outage Report
Busy Hours Report
Availability Trend Report
Alerting
Decide who receives alerts in case of downtime. Create an alert group.
Customize your email alert and action incase of downtime
• Monitor, in this context refers to a vCenter, ESX/ESXi servers,
website, web application, server, FTP service running on a specific
host /port or Web Application Monitor
• Site24x7 checks these monitors to make sure your business
applications are running well
• VM and vCenter monitor are considered as Basic Monitors
For more details check
How Licensing Works?
https://www.site24x7.com/site24x7-pricing.html
• Assure high uptime and peak performance of your VMware
ESX/ESXi hosts and virtual machines
• Troubleshoot issues before end users are affected
• Analyze the uptime and performance of your servers and applications
within your internal network from the cloud
• Make decisions about allocating resources to each virtual machine
according to the availability
Benefits
Sign Up At Site24x7 Now!
https://www.site24x7.com/signup.html
For More Details
https://help.site24x7.com/vmware-monitoring-site24x7.html
For Any Query Or Assistance, Contact Support
https://www.site24x7.com/contact-support.html
E-mail: support@site24x7.com
Call Toll Free: +1 408 352 9117

VMware Monitoring-Discover And Monitor Your Virtual Environment

  • 1.
    Site24x7 VMware vSphere Monitoring AutoDiscover Your Entire Virtual Environment
  • 2.
    • Highlights-VMware monitoring •How VMware monitoring works • Discover virtual infrastructure through vCenter • Performance metrics • Reporting and Alerting • How licensing works • Benefits Agenda
  • 3.
    • Auto-Discover theentire virtual environment through vCenter • Add and Monitor ESX/ESXi hosts independently • Visualize your virtual infrastructure • Status report in a single snapshot • Ensure uptime • Be notified about performance problems • Get out-of-the-box reports and graphical views • SaaS Highlights-VMware Monitoring
  • 4.
    Auto-Discover the entirevirtual environment through vCenter Entire virtual infrastructure in a single view
  • 5.
    Ensure uptime Performance andavailability snapshot of vCenter
  • 6.
    Be notified aboutperformance problem Set customized thresholds and stay alerted in the event of downtime
  • 7.
    Status report ina single snapshot Single console view of critical metrics to keep you up-to-date on performance issues
  • 8.
    Get out-of-the-box reportsand graphical views Customized reports and in-depth analysis on the performance of your VMware
  • 9.
    How VMware MonitoringWorks? 1) Download and install the On-Premise Poller in the network that needs to be monitored 2) Point the poller to your vCenter which will collect data about the ESX/ESXi Servers,Virtual Machines and all components of vCenter performance 3) The key metrics including CPU, memory and disk usage will get collected every 5 minutes 4) The data is then pushed and stored in the Site24x7 server 5) Configure thresholds and be alerted via Voice Calls, SMS, Email, Push, Twitter, RSS feeds when set thresholds are exceeded
  • 10.
    Discover Virtual InfrastructureThrough vCenter Monitor your hosts, VMs, resource pools, clusters and data centers
  • 11.
    Auto discovery ofyour virtual infrastructure
  • 12.
  • 13.
  • 14.
    Detailed report onmetrics relating to CPU,Memory,Datastore, Disk and Network
  • 15.
  • 16.
    Drill down toindividual metrics
  • 17.
    Thresholds for individualmetrics like CPU, Memory, DataStore, Network and Disk
  • 18.
    2. Cluster Details Viewyour VMware cluster details in datacenter
  • 19.
    Detailed report onvarious entities under Cluster
  • 20.
  • 21.
    Entities in NestedResource Pool
  • 22.
  • 23.
    Detailed report onvarious entities in Virtual Machines
  • 24.
    Reporting Summary Report Exhaustive reportingtools that analyze the performance of your virtual environment
  • 25.
  • 26.
  • 27.
  • 28.
  • 29.
  • 30.
    Alerting Decide who receivesalerts in case of downtime. Create an alert group.
  • 31.
    Customize your emailalert and action incase of downtime
  • 32.
    • Monitor, inthis context refers to a vCenter, ESX/ESXi servers, website, web application, server, FTP service running on a specific host /port or Web Application Monitor • Site24x7 checks these monitors to make sure your business applications are running well • VM and vCenter monitor are considered as Basic Monitors For more details check How Licensing Works? https://www.site24x7.com/site24x7-pricing.html
  • 33.
    • Assure highuptime and peak performance of your VMware ESX/ESXi hosts and virtual machines • Troubleshoot issues before end users are affected • Analyze the uptime and performance of your servers and applications within your internal network from the cloud • Make decisions about allocating resources to each virtual machine according to the availability Benefits
  • 34.
    Sign Up AtSite24x7 Now! https://www.site24x7.com/signup.html For More Details https://help.site24x7.com/vmware-monitoring-site24x7.html For Any Query Or Assistance, Contact Support https://www.site24x7.com/contact-support.html E-mail: support@site24x7.com Call Toll Free: +1 408 352 9117