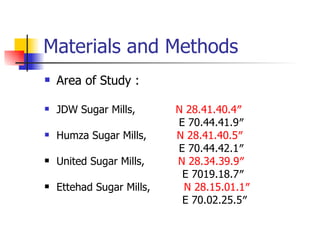
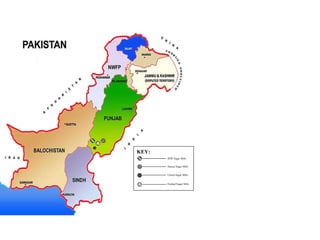
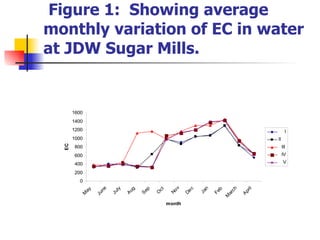
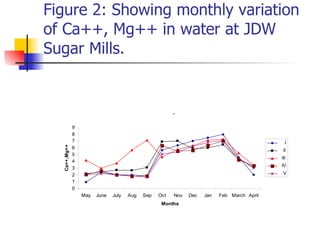
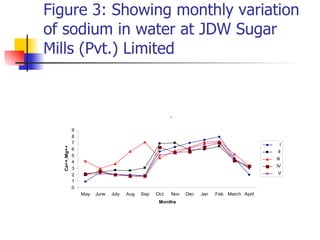
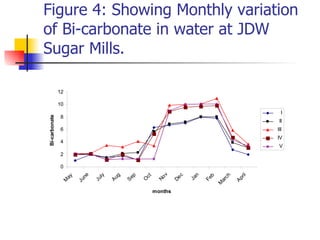
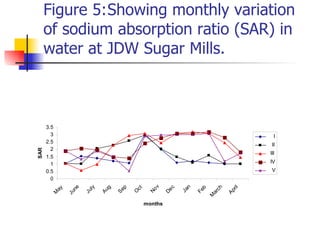
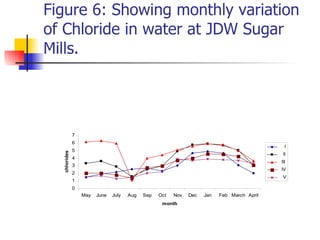
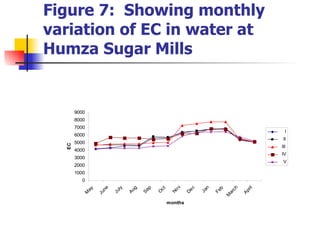
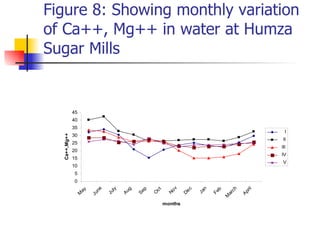
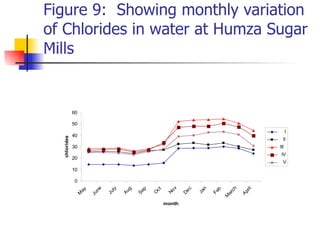
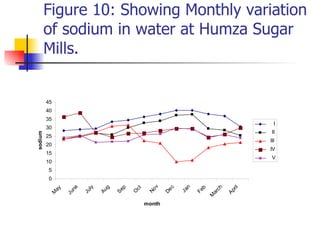
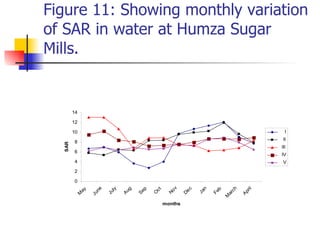
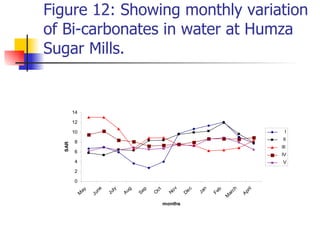
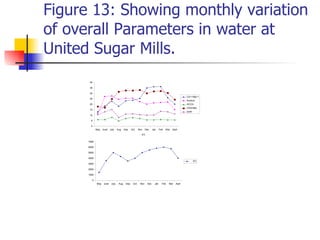
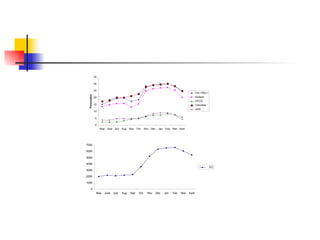
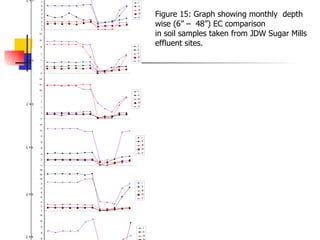
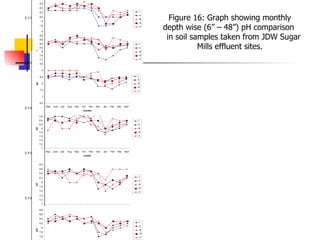
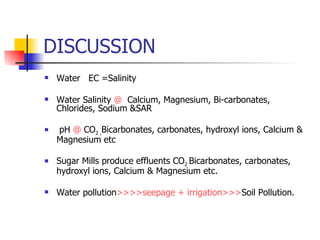
An Assessment of Environmental Impact of Sugar Mills in District Rahim Yar Khan, Punjab, Pakistan. A thesis submitted in partial fulfillment of the requirement for the Degree of M. Phil in Zoology. By Saghir Ahmad Roll No. 1 Session 2005-2007 INSTITUTE OF PURE AND APPLIED BIOLOGY BAHAUDDIN ZAKARIYA UNIVERSITY, MULTAN
In Pakistan, 77 Sugar mills constitute the second most  important industry sharing 16% in agricultural economy. Of these 38 are in punjab,32 in Sindh,6 in NWFP 1 in AK.  Sugar mills use various chemicals during processing which include Calcium Hydroxide, polyelectrolyte, limestone, phosphoric acid, sulphur dioxide, caustic soda, HCl and Lead sub acetate etc. It is high time to keep an eye on our habitat and assess whether some sort of pollution is being caused by sugar industry or not.
AIMS AND OBJECTIVES The study was structured to ascertain the impact of growing Sugar Industry on natural resources including  soil  and  water.
Materials and Methods Area of Study : JDW Sugar Mills,  N 28.41.40.4″ E 70.44.41.9″  Humza Sugar Mills,  N 28.41.40.5″ E 70.44.42.1″ United Sugar Mills,  N 28.34.39.9″ E 7019.18.7″ Ettehad Sugar Mills,  N 28.15.01.1″ E 70.02.25.5″
KEY: JDW Sugar Mills  Hamza Sugar Mills  United Sugar Mills  Ettehad Sugar Mills
JDW Sugar Mills
Sampling Sites  Water Sampling (site I, II, III, IV, V) Soil Sampling (site I, II, III, IV, V) Fig. Saghir at site III of Humza Sugar Mills
Saim- Nullah near Humza Sugar Mills
Sampling Duration and Analysis  May 2007 to April 2008 S & W Testing Lab. Multan S & W Testing Lab. R Y KHAN
Figure 1:  Showing average monthly variation of EC in water at JDW Sugar Mills.
Figure 2: Showing monthly variation of Ca++, Mg++ in water at JDW Sugar Mills.
Figure 3: Showing monthly variation of sodium in water at JDW Sugar Mills (Pvt.) Limited
Figure 4: Showing Monthly variation of Bi-carbonate in water at JDW Sugar Mills.
Figure 5: Showing monthly variation of sodium absorption ratio (SAR) in water at JDW Sugar Mills.
Figure 6: Showing monthly variation of Chloride in water at JDW Sugar Mills.
Figure 7:  Showing monthly variation of EC in water at Humza Sugar Mills
Figure 8: Showing monthly variation of Ca++, Mg++ in water at Humza Sugar Mills
Figure 9:  Showing monthly variation of Chlorides in water at Humza Sugar Mills
Figure 10: Showing Monthly variation of sodium in water at Humza Sugar Mills.
Figure 11: Showing monthly variation of SAR in water at Humza Sugar Mills.
Figure 12: Showing monthly variation of Bi-carbonates in water at Humza Sugar Mills.
Figure 13: Showing monthly variation of overall Parameters in water at United Sugar Mills.
 
Figure 15: Graph showing monthly  depth wise (6” –  48”) EC comparison  in soil samples taken from JDW Sugar Mills  effluent sites. EC at 6” EC at 12” EC at 18” EC at 24” EC at 30” EC at 36” EC at 48” Figure 15: Graph showing monthly  depth wise (6” –  48”) EC comparison  in soil samples taken from JDW Sugar Mills  effluent sites. Depth wise
pH at 6” pH at 12” pH at 18” pH at 24” pH at 30” pH at 36” Depth wise Figure 16: Graph showing monthly depth wise (6” – 48”) pH comparison  in soil samples taken from JDW Sugar Mills effluent sites.
DISCUSSION Water  EC =Salinity Water Salinity  @   Calcium, Magnesium, Bi-carbonates, Chlorides, Sodium &SAR pH  @  CO 2 , Bicarbonates, carbonates, hydroxyl ions, Calcium & Magnesium etc Sugar Mills produce effluents CO 2  Bicarbonates, carbonates, hydroxyl ions, Calcium & Magnesium etc. Water pollution >>>>seepage + irrigation>>> Soil Pollution.
CONCLUSION Habitat degradation, Ecological Imbalance,  Desertification.
RECOMMENDATIONS It is evident from the results that effluents these sugar mills are polluting the nearby natural resources. NEQS must be enforced on the basis of “Acta non Verba”
QUESTIONS ?

Viva presentation

  • 1.
    An Assessment ofEnvironmental Impact of Sugar Mills in District Rahim Yar Khan, Punjab, Pakistan. A thesis submitted in partial fulfillment of the requirement for the Degree of M. Phil in Zoology. By Saghir Ahmad Roll No. 1 Session 2005-2007 INSTITUTE OF PURE AND APPLIED BIOLOGY BAHAUDDIN ZAKARIYA UNIVERSITY, MULTAN
  • 2.
    In Pakistan, 77Sugar mills constitute the second most important industry sharing 16% in agricultural economy. Of these 38 are in punjab,32 in Sindh,6 in NWFP 1 in AK. Sugar mills use various chemicals during processing which include Calcium Hydroxide, polyelectrolyte, limestone, phosphoric acid, sulphur dioxide, caustic soda, HCl and Lead sub acetate etc. It is high time to keep an eye on our habitat and assess whether some sort of pollution is being caused by sugar industry or not.
  • 3.
    AIMS AND OBJECTIVESThe study was structured to ascertain the impact of growing Sugar Industry on natural resources including soil and water.
  • 4.
    Materials and MethodsArea of Study : JDW Sugar Mills, N 28.41.40.4″ E 70.44.41.9″ Humza Sugar Mills, N 28.41.40.5″ E 70.44.42.1″ United Sugar Mills, N 28.34.39.9″ E 7019.18.7″ Ettehad Sugar Mills, N 28.15.01.1″ E 70.02.25.5″
  • 5.
    KEY: JDW SugarMills Hamza Sugar Mills United Sugar Mills Ettehad Sugar Mills
  • 6.
  • 7.
    Sampling Sites Water Sampling (site I, II, III, IV, V) Soil Sampling (site I, II, III, IV, V) Fig. Saghir at site III of Humza Sugar Mills
  • 8.
    Saim- Nullah nearHumza Sugar Mills
  • 9.
    Sampling Duration andAnalysis May 2007 to April 2008 S & W Testing Lab. Multan S & W Testing Lab. R Y KHAN
  • 10.
    Figure 1: Showing average monthly variation of EC in water at JDW Sugar Mills.
  • 11.
    Figure 2: Showingmonthly variation of Ca++, Mg++ in water at JDW Sugar Mills.
  • 12.
    Figure 3: Showingmonthly variation of sodium in water at JDW Sugar Mills (Pvt.) Limited
  • 13.
    Figure 4: ShowingMonthly variation of Bi-carbonate in water at JDW Sugar Mills.
  • 14.
    Figure 5: Showingmonthly variation of sodium absorption ratio (SAR) in water at JDW Sugar Mills.
  • 15.
    Figure 6: Showingmonthly variation of Chloride in water at JDW Sugar Mills.
  • 16.
    Figure 7: Showing monthly variation of EC in water at Humza Sugar Mills
  • 17.
    Figure 8: Showingmonthly variation of Ca++, Mg++ in water at Humza Sugar Mills
  • 18.
    Figure 9: Showing monthly variation of Chlorides in water at Humza Sugar Mills
  • 19.
    Figure 10: ShowingMonthly variation of sodium in water at Humza Sugar Mills.
  • 20.
    Figure 11: Showingmonthly variation of SAR in water at Humza Sugar Mills.
  • 21.
    Figure 12: Showingmonthly variation of Bi-carbonates in water at Humza Sugar Mills.
  • 22.
    Figure 13: Showingmonthly variation of overall Parameters in water at United Sugar Mills.
  • 23.
  • 24.
    Figure 15: Graphshowing monthly depth wise (6” – 48”) EC comparison in soil samples taken from JDW Sugar Mills effluent sites. EC at 6” EC at 12” EC at 18” EC at 24” EC at 30” EC at 36” EC at 48” Figure 15: Graph showing monthly depth wise (6” – 48”) EC comparison in soil samples taken from JDW Sugar Mills effluent sites. Depth wise
  • 25.
    pH at 6”pH at 12” pH at 18” pH at 24” pH at 30” pH at 36” Depth wise Figure 16: Graph showing monthly depth wise (6” – 48”) pH comparison in soil samples taken from JDW Sugar Mills effluent sites.
  • 26.
    DISCUSSION Water EC =Salinity Water Salinity @ Calcium, Magnesium, Bi-carbonates, Chlorides, Sodium &SAR pH @ CO 2 , Bicarbonates, carbonates, hydroxyl ions, Calcium & Magnesium etc Sugar Mills produce effluents CO 2 Bicarbonates, carbonates, hydroxyl ions, Calcium & Magnesium etc. Water pollution >>>>seepage + irrigation>>> Soil Pollution.
  • 27.
    CONCLUSION Habitat degradation,Ecological Imbalance, Desertification.
  • 28.
    RECOMMENDATIONS It isevident from the results that effluents these sugar mills are polluting the nearby natural resources. NEQS must be enforced on the basis of “Acta non Verba”
  • 29.