Download as PDF, PPTX

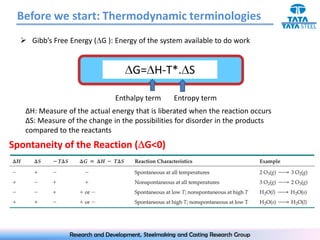
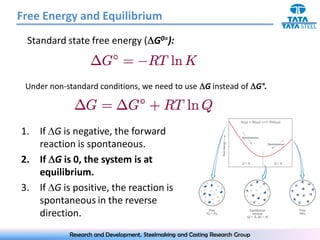
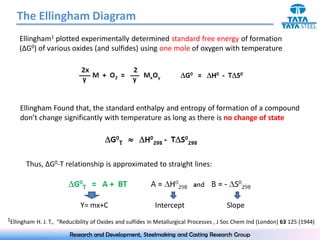
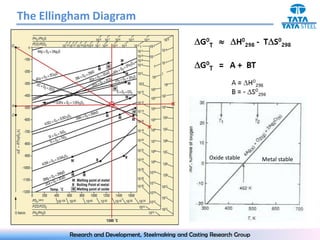
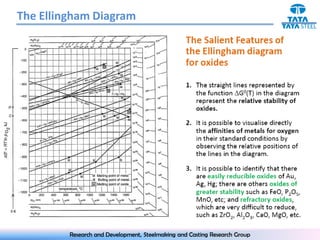
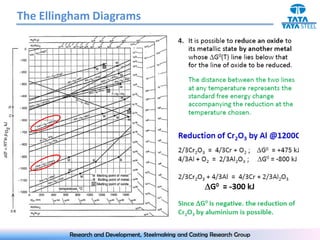
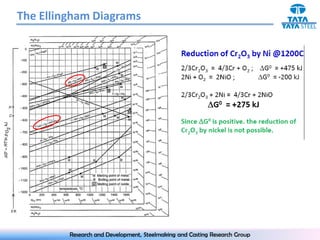
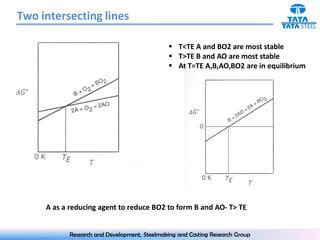
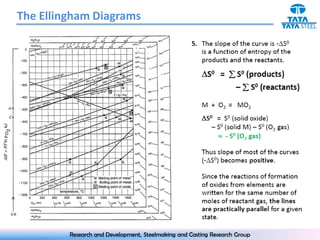
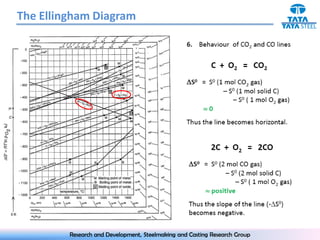
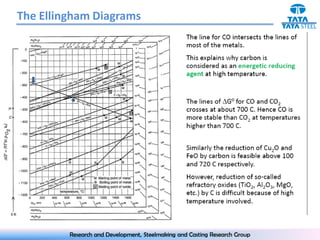

The document discusses the Ellingham diagram, which plots the standard free energy of formation (ΔG0) of various oxides and sulfides as a function of temperature. The diagram shows that below a critical temperature, oxides are more stable than metals, while above this temperature metals become more stable. Lines on the diagram represent oxidation/reduction reactions, with their intersection indicating the equilibrium temperature. Additional scales were later added to allow reading the equilibrium oxygen partial pressure directly from the diagram. The Ellingham diagram is a useful tool for predicting spontaneity and equilibrium in metallurgical oxidation/reduction reactions.


