SlideShare a Scribd company logo
GRAPHS
0
5
10
15
20
25
1998 1999 2000 2001 2002 2003 2004
0
20
40
60
80
100
120
140
1st
Qtr
2nd
Qtr
3rd
Qtr
4th
Qtr
1999
1st
Qtr
2nd
Qtr
3rd
Qtr
4th
Qtr
2000
1st
Qtr
2nd
Qtr
3rd
Qtr
4th
Qtr
2001
VH Warehouse Ltd
45%
25%
15%
15%
Purchasing
Marketing
Administration
Entertainment
BAR CHART
PIE CHART
LINE CHART
European Advertising Spending 1996 – 1999 (US$ billions)
Germany UK France Spain
1996
1997
1998
1999
16
17
23
25
14
15
17
19
9
10
11
12
3
3
4
5
TABLE
Mobile phone Owner Growth
0
2
4
6
8
10
12
14
16
UK Germany Italy Sweden France Finland Norway Denmark Spain
Owners 1995
Owners 2000
Millions
The graph illustrates the information on the growing number of
mobile phone owners in Europe between 1995 and 2000. The
European countries are the
UK, Germany, Italy, Sweden, France, Finland, Norway, Denmark and
Spain.
Generally speaking, the number of mobile phone owners increased
over the five years. The first five countries had shown a rapid increase
by year 2000 and the last four countries had shown a slight increase
except for Spain. Spain had showed a dramatic increase over the five
years.
The UK had the most mobile phone owners in 1995 (just over 4
millions) and the figure increased to 12 million in 2000.
Meanwhile, there were 4 million owners in Germany in 1995 but there
was a dramatic increase to a peak of 14 million which was the highest
number in 2000. The other countries like Italy, Sweden, and France had
a dramatic increase to more than 6 million owners. The figure in
Finland, Norway, Denmark and Spain was almost the same at around 1
million in 1995. The number of mobile phone owners rose slightly to 2
million owners in 2000 except for Spain which had a rapid increase to 5
million owners in 2000.
As a conclusion, there was a significant mobile phone owner
growth in the European countries in 2000. Each country had an
increase.
1. INTRODUCING THE TOPIC
Beginning Middle Time
The graph shows…….
The graph illustrates…..
From the graph we can see….
From the graph we can observe…………
From the graph we can understand………
The graph displays
the information on
how …… changed
over ……. years
over ….. period
between…and…
0
2
4
6
8
10
12
14
16
Owners 1995
Owners 2000
-The graph illustrates/shows the information on the growing number
of mobile phone owners in Europe between 1995 and 2000.
- From the graph we can see/observe/understand how the number
of mobile phone owners in Europe changed over 5 years.
Mobile phone Owner Growth
Millions
Practice
0
200
400
600
800
1000
1980 1985 1990 1995 2000
Companyyears
NumberofemployeesNumberofEmployees
Practice
0
20
40
60
80
100
120
140
1st
Qtr
2nd
Qtr
3rd
Qtr
4th
Qtr
1999
1st
Qtr
2nd
Qtr
3rd
Qtr
4th
Qtr
2000
1st
Qtr
2nd
Qtr
3rd
Qtr
4th
Qtr
2001
VH Warehouse Ltd
SALES
Practice
Supermarkets built
0
200
400
600
800
1000
1200
1993 1994 1995 1996 1997 1998 1999 2000 2001 2002 2003 2004
Practice
0
100
200
300
400
500
6 7 8 9 10 11 12 13 14 15 16 17 18 19 20 21 22
Time
Numberofpeopleata
Londonstation
Sales in Percentage terms for TewkesMart
20
20
20
13
10
17
Electical Goods
Computer
Hardware
Toys
Food
Clothes
Others
European Advertising Spending 1996 – 1999 (US$ billions)
Germany UK France Spain
1996
1997
1998
1999
16
17
23
25
14
15
17
19
9
10
11
12
3
3
4
5
2.GENERAL TREND
General Trends are the general changes or
movements in facts and figures over a period of
time.
It usually uses linking words like:
-In general
-In overall
-Generally speaking
0
2
4
6
8
10
12
14
16
Owners 1995
Owners 2000
Mobile phone Owner Growth
Millions
Generally speaking, the number of mobile phone
owners increased over the five years. The first five
countries had shown a rapid increase by year
2000 and the last four countries had shown a
slight increase except for Spain. Spain had shown
a dramatic increase over the five years.
0
50
100
150
200
250
300
350
400
450
500
Instantaneous increase
Increase instantaneously
Very rapid
sudden
increase
rise
Increase
Rise
quickly
dramatically
rapidly
suddenly
Rapid
Strong
Marked
Increase
Rise
Increase
Rise
rapidly
strongly
quickly
dramaticallySteady
Moderate
Gradual
Increase
Rise
Increase
Rise
steadily
moderately
gradually
Slight
Gentle
Small
Slow
increase
rise
Increase
Rise
slightly
gently
a little
a bit
Very slight increase
rise
Increase
Rise
very slightly
0
10
20
30
40
50
60
70
80
2002 2003 2004
A sharp fall
Fall sharply
0
5
10
15
20
25
1998 1999 2000 2001 2002 2003 2004
Fluctuate
Fluctuate upwards
A gradual increase
A slow fluctuation
Increase gradually
0
5
10
15
20
25
1998 1999 2000 2001 2002 2003 2004
Remain stable
Remain stagnant
0
5
10
15
20
25
1999 2000 2001 2002 2003 2004
A slow decrease
A gentle decrease
A slight decrease
Generally speaking,
In general,
In overall,
the number of…
increased…
decreased…
fell…
fluctuated…
remained stable/stagnant
had shown
a … increase
a….decrease
a….fall
a….fluctuation
PRACTICE
Make a general trend for the following charts.
0
200
400
600
800
1000
1980 1985 1990 1995 2000
Companyyears
Numberofemployees
0
20
40
60
80
100
120
140
1st
Qtr
2nd
Qtr
3rd
Qtr
4th
Qtr
1999
1st
Qtr
2nd
Qtr
3rd
Qtr
4th
Qtr
2000
1st
Qtr
2nd
Qtr
3rd
Qtr
4th
Qtr
2001
VH Warehouse Ltd
Supermarkets built
0
200
400
600
800
1000
1200
1993 1994 1995 1996 1997 1998 1999 2000 2001 2002 2003 2004
0
100
200
300
400
500
6 7 8 9 10 11 12 13 14 15 16 17 18 19 20 21 22
Time
Numberofpeopleata
Londonstation
Sales in Percentage terms for TewkesMart
20
20
20
13
10
17
Electical Goods
Computer
Hardware
Toys
Food
Clothes
Others
All Almost
all
Just
over
3/4
¾
(Most of…./
majority/
a large portion
Just
over
half
75%80%
Half
Almost
half
¼
a few/
a minority/
a small portion
Almost
nearly
None
DETAILS
It should contain depth description of the data
that expands the general trend that has been
stated in the previous part. But the
information presented should be effectively
organized in order to preclude too much
unnecessary information described. So it is
important to select the appropriate details
and organize the material in a relevant way.
The way can be stated as GROUPING
INFORMATION.
Consider what the graph shows and think about the
vocabulary and tenses we will use in describing it.
Select significant features of the graph (overall) to tell
about.
Note some points
Consider the comparison we will make
Think about a final point
0
2
4
6
8
10
12
14
16
Owners 1995
Owners 2000
Millions
Mobile phone Owner Growth
The UK had the most mobile phone owners in 1995 (just over 4 million)
and the figure increased to 12 million in 2000. Meanwhile, there were 4
million owners in Germany in 1995 but there was a dramatic increase to
a peak of 14 million which was the highest number in 2000. The other
countries like Italy, Sweden, and France had a dramatic increase to more
than 6 million owners. The figure in Finland, Norway, Denmark and Spain
was almost the same at around 1 million in 1995. The number of mobile
phone owners rose slightly to 2 million owners in 2000 except for Spain
which had a rapid increase to 5 million owners in 2000.
0
5
10
15
20
25
30
35
40
45
1990
1991
1992
1993
1994
1995
Average Book Price in Pound sterling
In 1990 the price of children’s book was the cheapest.
On the other hand, the price of scientific book was the highest/the most expensive.
In 1994 the price of scientific book was cheaper than it was in 1993.
The children’s book price in 1991 was as expensive as it was in 1992, 1993, 1994, 1995.
Like the school text book’s price, the academic book’s price also increased rapidly.
COMPARING DATA
To contrast To compare
While/Whilst
Whereas
Meanwhile
However
On the other hand
Even so
Nevertheless
Less…than (less than)
Little less than
More than
Different from
Although
In contrast to
Conversely
Opposite
Unlike
Likewise
Similarly
As..as
Just as
In the same way
Like
Alike
To reflect
To mirror
To have in common
Lower/Higher than
The most/the lowest/the highest
Annual Sales of hamburgers
0
500
1000
1500
2000
2500
3000
Jan Feb Mar Apr May Jun Jul Aug Sep Oct Nov Dec
From January to June, the sales were fairly constant at around 1800 to 1950
hamburger sales but they were slightly lower during April and may. After
June, there was a dramatic increase to a peak of 3000 in August. Then sales
declined sharply to a low point of 1300 in October. Afterwards, the sales
increased gradually between October and December from 1300 to 1800.
Finally, the sales picked up to finish the years at around 1700.
Expressions
VERB ADJECTIVE ADVERB NOUN
Rise
Increase
Decrease
Decline
Fall
Reach
Drop (off)
Fluctuate
Pick up
Peak
Go up
Go down
Climb
Boom
Dip
Slump
Reduce
Stand at
Sudden, Rapid, Gentle,
Gradual, Stagnant, Mar
ked, Obvious, Sharp, Dr
amatic, Considerable, S
light,
Slow, Sharp, Dramatic,
Relative, Huge,
Enormous, Steep
Substantial, Significant
Moderate, Minimal
Quick, Swift, Sudden
Steady, Gradual
Quickly
Rapidly
Steadily
Slowly
Gently
Suddenly
Gradually
Slightly
Respectively (in the same order)
Sharply
Dramatically
Considerably
Relatively
Increase
Fall
Decrease
Decline
Fluctuation
Drop
Rise
Peak/dip
Trough
Plateau
A low point
Growth
An upward trend
A boom
A slump
(a dramatic fall)
0
5
10
15
20
25
1999 2000 2001 2002 2003 2004
Reach a peak
To be stagnant
Remain steady
Shoot up
Level rocket
Fluctuate between
Fluctuate upwards
Fall a trough
Fall to (it’s) lowest level
Level out
Remain steady
At a steady level
Remain the same
Reach a plateau
Remain stable
Remain constant
Stay constant
Reach a peak
Hit/fall to the lowest point
Did not change
Maintain the same level
PRACTICE
0
200
400
600
800
1000
1980 1985 1990 1995 2000
Companyyears
Numberofemployees
PRACTICE
0
20
40
60
80
100
120
140
1st
Qtr
2nd
Qtr
3rd
Qtr
4th
Qtr
1999
1st
Qtr
2nd
Qtr
3rd
Qtr
4th
Qtr
2000
1st
Qtr
2nd
Qtr
3rd
Qtr
4th
Qtr
2001
VH Warehouse Ltd
PRACTICE
Supermarkets built
0
200
400
600
800
1000
1200
1993 1994 1995 1996 1997 1998 1999 2000 2001 2002 2003 2004
PRACTICE
0
100
200
300
400
500
6 7 8 9 10 11 12 13 14 15 16 17 18 19 20 21 22
Time
Numberofpeopleata
Londonstation
PRACTICE
Sales in Percentage terms for TewkesMart
20
20
20
13
10
17
Electical Goods
Computer
Hardware
Toys
Food
Clothes
Others
4. CONCLUSION
In summary
As a conclusion
Generally speaking
1. The conclusion rephrases sentences which are already
described in the general trend.
2. The superlative adjectives (the highest, the lowest, etc.)
are usually used.
3. The suggestion or prediction might be included in the
conclusion.
100% I’m sure/certain that the share prices will (definitely)
rise
75%
It’s likely that the share prices will increase
50%
Share prices should increase
Share prices may/might increase
25%
It’s (very) unlikely that share prices will increase
Share prices are unlikely to increase
0%
I’m sure/certain that the share prices (definitely)
won’t increase
0
2
4
6
8
10
12
14
16
UK Germany Italy Sweden France Finland Norway Denmark Spain
Owners 1995
Owners 2000
Mobile phone Owner Growth
Millions
As a conclusion, there was a significant
mobile phone owner growth in the
European countries in 2000. Each
country had an increase.
A COMPLETE VISUAL PRESENTATION
INTRODUCTION:
WELCOMING THE AUDIENCE
INTRODUCING THE PRESENTER
BODY:
INTRODUCING TOPIC
DESCRIBING GENERAL TREND
DETAILS
CONCLUSION
INTRODUCTION
WELCOMING THE AUDIENCE
Good morning ladies and gentlemen
Good morning everybody
Hello/hi everyone (informal)
Welcome to…
It’s very nice to see you all today
First of all let me thank you all for coming here today
It’s a pleasure to welcome you today
It’s good to see you all here (informal)
INTRODUCTION
INTRODUCING THE PRESENTER
My name is Jane Shaw. I’m responsible for travel
arrangements
For those who don’t know me, my name is…
As you know I’m in charge of public relation (informal)
I’m the new marketing manager
Let me introduce myself. I’m Dave Andrew from…
As probably you know, I’m the new HR manager
(informal)
I’m head of logistic here at Air Spares
I’m here in my function as the Head of Controlling
Let me just start by introducing myself. My name is…

More Related Content

Similar to VisualPresentation

HLEG thematic workshop on Measuring Inequalities of Income and Wealth, Facund...
HLEG thematic workshop on Measuring Inequalities of Income and Wealth, Facund...HLEG thematic workshop on Measuring Inequalities of Income and Wealth, Facund...
HLEG thematic workshop on Measuring Inequalities of Income and Wealth, Facund...
StatsCommunications
 
IBIZA Prime Real Estate Market 1Q 2016 Report
IBIZA Prime Real Estate Market 1Q 2016 ReportIBIZA Prime Real Estate Market 1Q 2016 Report
IBIZA Prime Real Estate Market 1Q 2016 Report
Houses in Ibiza
 
Social Inequalities
Social InequalitiesSocial Inequalities
Social Inequalities
Danny Dorling
 
The distribution of wealth: Evidence from five data sources
The distribution of wealth: Evidence from five data sourcesThe distribution of wealth: Evidence from five data sources
The distribution of wealth: Evidence from five data sources
StatsCommunications
 
Writing task 1
Writing task 1Writing task 1
Writing task 1
Thanh Thuy
 
Property in Wimbledon - Letting Agent Insight
Property in Wimbledon - Letting Agent InsightProperty in Wimbledon - Letting Agent Insight
Property in Wimbledon - Letting Agent Insight
Knight Frank LLP
 
Zombie companies myth or reality The 2014 Update
Zombie companies myth or reality The 2014 Update Zombie companies myth or reality The 2014 Update
Zombie companies myth or reality The 2014 Update John Ashcroft
 
Japan deflation
Japan deflationJapan deflation
Japan deflation
Lokendra Singh Rathore
 
Credo Group
Credo GroupCredo Group
Martin Wolf: Has the financial crisis changed the world?
Martin Wolf: Has the financial crisis changed the world?Martin Wolf: Has the financial crisis changed the world?
Martin Wolf: Has the financial crisis changed the world?
janzemanek
 
Internation business, globalisation
Internation business, globalisationInternation business, globalisation
Internation business, globalisationshweta puneyani
 
Monthly report on UK international sales compiled by Webinterpret September 2015
Monthly report on UK international sales compiled by Webinterpret September 2015Monthly report on UK international sales compiled by Webinterpret September 2015
Monthly report on UK international sales compiled by Webinterpret September 2015
WebInterpret SAS
 
Ipsos MORI End of Year Review of 2015
Ipsos MORI End of Year Review of 2015Ipsos MORI End of Year Review of 2015
Ipsos MORI End of Year Review of 2015
Ipsos UK
 
Internation business, globalisation
Internation business, globalisationInternation business, globalisation
Internation business, globalisation
shweta puneyani
 
Herman Schwartz UNC-CH 20130927
Herman Schwartz UNC-CH 20130927Herman Schwartz UNC-CH 20130927
Herman Schwartz UNC-CH 20130927UNCEurope
 
Toscafund Discussion Paper- 1992 It will be deja-vu all over again
Toscafund Discussion Paper- 1992 It will be deja-vu all over againToscafund Discussion Paper- 1992 It will be deja-vu all over again
Toscafund Discussion Paper- 1992 It will be deja-vu all over againsavvas savouri
 
4.2.5 Global-Competitiveness
4.2.5 Global-Competitiveness4.2.5 Global-Competitiveness
4.2.5 Global-Competitiveness
IGilmore
 
POWER BI - Ribbon Chart, Waterfall, Scatter Chart, Bubble Chart, Dot Plot Chart
POWER BI - Ribbon Chart, Waterfall, Scatter Chart, Bubble Chart, Dot Plot ChartPOWER BI - Ribbon Chart, Waterfall, Scatter Chart, Bubble Chart, Dot Plot Chart
POWER BI - Ribbon Chart, Waterfall, Scatter Chart, Bubble Chart, Dot Plot Chart
Silvia Alongi
 
B416 The Evolution Of Global Economies Lecture 9 Recent Global Economic Crisi...
B416 The Evolution Of Global Economies Lecture 9 Recent Global Economic Crisi...B416 The Evolution Of Global Economies Lecture 9 Recent Global Economic Crisi...
B416 The Evolution Of Global Economies Lecture 9 Recent Global Economic Crisi...
Pearson College London
 
Global Retail Report 2011
Global Retail Report 2011Global Retail Report 2011
Global Retail Report 2011yStats.com
 

Similar to VisualPresentation (20)

HLEG thematic workshop on Measuring Inequalities of Income and Wealth, Facund...
HLEG thematic workshop on Measuring Inequalities of Income and Wealth, Facund...HLEG thematic workshop on Measuring Inequalities of Income and Wealth, Facund...
HLEG thematic workshop on Measuring Inequalities of Income and Wealth, Facund...
 
IBIZA Prime Real Estate Market 1Q 2016 Report
IBIZA Prime Real Estate Market 1Q 2016 ReportIBIZA Prime Real Estate Market 1Q 2016 Report
IBIZA Prime Real Estate Market 1Q 2016 Report
 
Social Inequalities
Social InequalitiesSocial Inequalities
Social Inequalities
 
The distribution of wealth: Evidence from five data sources
The distribution of wealth: Evidence from five data sourcesThe distribution of wealth: Evidence from five data sources
The distribution of wealth: Evidence from five data sources
 
Writing task 1
Writing task 1Writing task 1
Writing task 1
 
Property in Wimbledon - Letting Agent Insight
Property in Wimbledon - Letting Agent InsightProperty in Wimbledon - Letting Agent Insight
Property in Wimbledon - Letting Agent Insight
 
Zombie companies myth or reality The 2014 Update
Zombie companies myth or reality The 2014 Update Zombie companies myth or reality The 2014 Update
Zombie companies myth or reality The 2014 Update
 
Japan deflation
Japan deflationJapan deflation
Japan deflation
 
Credo Group
Credo GroupCredo Group
Credo Group
 
Martin Wolf: Has the financial crisis changed the world?
Martin Wolf: Has the financial crisis changed the world?Martin Wolf: Has the financial crisis changed the world?
Martin Wolf: Has the financial crisis changed the world?
 
Internation business, globalisation
Internation business, globalisationInternation business, globalisation
Internation business, globalisation
 
Monthly report on UK international sales compiled by Webinterpret September 2015
Monthly report on UK international sales compiled by Webinterpret September 2015Monthly report on UK international sales compiled by Webinterpret September 2015
Monthly report on UK international sales compiled by Webinterpret September 2015
 
Ipsos MORI End of Year Review of 2015
Ipsos MORI End of Year Review of 2015Ipsos MORI End of Year Review of 2015
Ipsos MORI End of Year Review of 2015
 
Internation business, globalisation
Internation business, globalisationInternation business, globalisation
Internation business, globalisation
 
Herman Schwartz UNC-CH 20130927
Herman Schwartz UNC-CH 20130927Herman Schwartz UNC-CH 20130927
Herman Schwartz UNC-CH 20130927
 
Toscafund Discussion Paper- 1992 It will be deja-vu all over again
Toscafund Discussion Paper- 1992 It will be deja-vu all over againToscafund Discussion Paper- 1992 It will be deja-vu all over again
Toscafund Discussion Paper- 1992 It will be deja-vu all over again
 
4.2.5 Global-Competitiveness
4.2.5 Global-Competitiveness4.2.5 Global-Competitiveness
4.2.5 Global-Competitiveness
 
POWER BI - Ribbon Chart, Waterfall, Scatter Chart, Bubble Chart, Dot Plot Chart
POWER BI - Ribbon Chart, Waterfall, Scatter Chart, Bubble Chart, Dot Plot ChartPOWER BI - Ribbon Chart, Waterfall, Scatter Chart, Bubble Chart, Dot Plot Chart
POWER BI - Ribbon Chart, Waterfall, Scatter Chart, Bubble Chart, Dot Plot Chart
 
B416 The Evolution Of Global Economies Lecture 9 Recent Global Economic Crisi...
B416 The Evolution Of Global Economies Lecture 9 Recent Global Economic Crisi...B416 The Evolution Of Global Economies Lecture 9 Recent Global Economic Crisi...
B416 The Evolution Of Global Economies Lecture 9 Recent Global Economic Crisi...
 
Global Retail Report 2011
Global Retail Report 2011Global Retail Report 2011
Global Retail Report 2011
 

More from Leite Bayukaka

Letter of Complaint and Adjustment
Letter of Complaint and AdjustmentLetter of Complaint and Adjustment
Letter of Complaint and AdjustmentLeite Bayukaka
 
Miscellaneous Correspodence
Miscellaneous CorrespodenceMiscellaneous Correspodence
Miscellaneous CorrespodenceLeite Bayukaka
 
Hukum pajak internasional
Hukum pajak internasionalHukum pajak internasional
Hukum pajak internasionalLeite Bayukaka
 
Bayu dita & widya bab 11 12
Bayu dita & widya bab 11 12Bayu dita & widya bab 11 12
Bayu dita & widya bab 11 12Leite Bayukaka
 
Bayu dita & w idya bab 10
Bayu dita & w idya bab 10Bayu dita & w idya bab 10
Bayu dita & w idya bab 10Leite Bayukaka
 
Bab 7 & 8 bayu dita widya
Bab 7 & 8 bayu dita widyaBab 7 & 8 bayu dita widya
Bab 7 & 8 bayu dita widyaLeite Bayukaka
 
AKHLAK ISLAM DAN PERANANNYA DALAM PAREMBINAAN MASYARAKAT
AKHLAK ISLAM DAN PERANANNYA DALAM PAREMBINAAN MASYARAKATAKHLAK ISLAM DAN PERANANNYA DALAM PAREMBINAAN MASYARAKAT
AKHLAK ISLAM DAN PERANANNYA DALAM PAREMBINAAN MASYARAKATLeite Bayukaka
 
Penyimpangan Penegakan Hukum Yang Ada di Indonesia
Penyimpangan Penegakan Hukum Yang Ada di IndonesiaPenyimpangan Penegakan Hukum Yang Ada di Indonesia
Penyimpangan Penegakan Hukum Yang Ada di IndonesiaLeite Bayukaka
 
Diskon & tingkat diskon
Diskon & tingkat diskonDiskon & tingkat diskon
Diskon & tingkat diskonLeite Bayukaka
 
Revolusi Ketergantungan Internasional
Revolusi Ketergantungan InternasionalRevolusi Ketergantungan Internasional
Revolusi Ketergantungan InternasionalLeite Bayukaka
 
Contoh kasus
Contoh kasusContoh kasus
Contoh kasus
Leite Bayukaka
 

More from Leite Bayukaka (15)

Letter of Complaint and Adjustment
Letter of Complaint and AdjustmentLetter of Complaint and Adjustment
Letter of Complaint and Adjustment
 
Credit
CreditCredit
Credit
 
Application Letter
Application LetterApplication Letter
Application Letter
 
Miscellaneous Correspodence
Miscellaneous CorrespodenceMiscellaneous Correspodence
Miscellaneous Correspodence
 
Telephoning
TelephoningTelephoning
Telephoning
 
Telephoning
TelephoningTelephoning
Telephoning
 
Hukum pajak internasional
Hukum pajak internasionalHukum pajak internasional
Hukum pajak internasional
 
Bayu dita & widya bab 11 12
Bayu dita & widya bab 11 12Bayu dita & widya bab 11 12
Bayu dita & widya bab 11 12
 
Bayu dita & w idya bab 10
Bayu dita & w idya bab 10Bayu dita & w idya bab 10
Bayu dita & w idya bab 10
 
Bab 7 & 8 bayu dita widya
Bab 7 & 8 bayu dita widyaBab 7 & 8 bayu dita widya
Bab 7 & 8 bayu dita widya
 
AKHLAK ISLAM DAN PERANANNYA DALAM PAREMBINAAN MASYARAKAT
AKHLAK ISLAM DAN PERANANNYA DALAM PAREMBINAAN MASYARAKATAKHLAK ISLAM DAN PERANANNYA DALAM PAREMBINAAN MASYARAKAT
AKHLAK ISLAM DAN PERANANNYA DALAM PAREMBINAAN MASYARAKAT
 
Penyimpangan Penegakan Hukum Yang Ada di Indonesia
Penyimpangan Penegakan Hukum Yang Ada di IndonesiaPenyimpangan Penegakan Hukum Yang Ada di Indonesia
Penyimpangan Penegakan Hukum Yang Ada di Indonesia
 
Diskon & tingkat diskon
Diskon & tingkat diskonDiskon & tingkat diskon
Diskon & tingkat diskon
 
Revolusi Ketergantungan Internasional
Revolusi Ketergantungan InternasionalRevolusi Ketergantungan Internasional
Revolusi Ketergantungan Internasional
 
Contoh kasus
Contoh kasusContoh kasus
Contoh kasus
 

Recently uploaded

Maksym Vyshnivetskyi: PMO Quality Management (UA)
Maksym Vyshnivetskyi: PMO Quality Management (UA)Maksym Vyshnivetskyi: PMO Quality Management (UA)
Maksym Vyshnivetskyi: PMO Quality Management (UA)
Lviv Startup Club
 
RMD24 | Retail media: hoe zet je dit in als je geen AH of Unilever bent? Heid...
RMD24 | Retail media: hoe zet je dit in als je geen AH of Unilever bent? Heid...RMD24 | Retail media: hoe zet je dit in als je geen AH of Unilever bent? Heid...
RMD24 | Retail media: hoe zet je dit in als je geen AH of Unilever bent? Heid...
BBPMedia1
 
Improving profitability for small business
Improving profitability for small businessImproving profitability for small business
Improving profitability for small business
Ben Wann
 
3.0 Project 2_ Developing My Brand Identity Kit.pptx
3.0 Project 2_ Developing My Brand Identity Kit.pptx3.0 Project 2_ Developing My Brand Identity Kit.pptx
3.0 Project 2_ Developing My Brand Identity Kit.pptx
tanyjahb
 
Cracking the Workplace Discipline Code Main.pptx
Cracking the Workplace Discipline Code Main.pptxCracking the Workplace Discipline Code Main.pptx
Cracking the Workplace Discipline Code Main.pptx
Workforce Group
 
LA HUG - Video Testimonials with Chynna Morgan - June 2024
LA HUG - Video Testimonials with Chynna Morgan - June 2024LA HUG - Video Testimonials with Chynna Morgan - June 2024
LA HUG - Video Testimonials with Chynna Morgan - June 2024
Lital Barkan
 
Digital Transformation and IT Strategy Toolkit and Templates
Digital Transformation and IT Strategy Toolkit and TemplatesDigital Transformation and IT Strategy Toolkit and Templates
Digital Transformation and IT Strategy Toolkit and Templates
Aurelien Domont, MBA
 
The Parable of the Pipeline a book every new businessman or business student ...
The Parable of the Pipeline a book every new businessman or business student ...The Parable of the Pipeline a book every new businessman or business student ...
The Parable of the Pipeline a book every new businessman or business student ...
awaisafdar
 
Enterprise Excellence is Inclusive Excellence.pdf
Enterprise Excellence is Inclusive Excellence.pdfEnterprise Excellence is Inclusive Excellence.pdf
Enterprise Excellence is Inclusive Excellence.pdf
KaiNexus
 
ikea_woodgreen_petscharity_dog-alogue_digital.pdf
ikea_woodgreen_petscharity_dog-alogue_digital.pdfikea_woodgreen_petscharity_dog-alogue_digital.pdf
ikea_woodgreen_petscharity_dog-alogue_digital.pdf
agatadrynko
 
Search Disrupted Google’s Leaked Documents Rock the SEO World.pdf
Search Disrupted Google’s Leaked Documents Rock the SEO World.pdfSearch Disrupted Google’s Leaked Documents Rock the SEO World.pdf
Search Disrupted Google’s Leaked Documents Rock the SEO World.pdf
Arihant Webtech Pvt. Ltd
 
CADAVER AS OUR FIRST TEACHER anatomt in your.pptx
CADAVER AS OUR FIRST TEACHER anatomt in your.pptxCADAVER AS OUR FIRST TEACHER anatomt in your.pptx
CADAVER AS OUR FIRST TEACHER anatomt in your.pptx
fakeloginn69
 
一比一原版加拿大渥太华大学毕业证(uottawa毕业证书)如何办理
一比一原版加拿大渥太华大学毕业证(uottawa毕业证书)如何办理一比一原版加拿大渥太华大学毕业证(uottawa毕业证书)如何办理
一比一原版加拿大渥太华大学毕业证(uottawa毕业证书)如何办理
taqyed
 
20240425_ TJ Communications Credentials_compressed.pdf
20240425_ TJ Communications Credentials_compressed.pdf20240425_ TJ Communications Credentials_compressed.pdf
20240425_ TJ Communications Credentials_compressed.pdf
tjcomstrang
 
Putting the SPARK into Virtual Training.pptx
Putting the SPARK into Virtual Training.pptxPutting the SPARK into Virtual Training.pptx
Putting the SPARK into Virtual Training.pptx
Cynthia Clay
 
What is the TDS Return Filing Due Date for FY 2024-25.pdf
What is the TDS Return Filing Due Date for FY 2024-25.pdfWhat is the TDS Return Filing Due Date for FY 2024-25.pdf
What is the TDS Return Filing Due Date for FY 2024-25.pdf
seoforlegalpillers
 
Buy Verified PayPal Account | Buy Google 5 Star Reviews
Buy Verified PayPal Account | Buy Google 5 Star ReviewsBuy Verified PayPal Account | Buy Google 5 Star Reviews
Buy Verified PayPal Account | Buy Google 5 Star Reviews
usawebmarket
 
The-McKinsey-7S-Framework. strategic management
The-McKinsey-7S-Framework. strategic managementThe-McKinsey-7S-Framework. strategic management
The-McKinsey-7S-Framework. strategic management
Bojamma2
 
Introduction to Amazon company 111111111111
Introduction to Amazon company 111111111111Introduction to Amazon company 111111111111
Introduction to Amazon company 111111111111
zoyaansari11365
 
ikea_woodgreen_petscharity_cat-alogue_digital.pdf
ikea_woodgreen_petscharity_cat-alogue_digital.pdfikea_woodgreen_petscharity_cat-alogue_digital.pdf
ikea_woodgreen_petscharity_cat-alogue_digital.pdf
agatadrynko
 

Recently uploaded (20)

Maksym Vyshnivetskyi: PMO Quality Management (UA)
Maksym Vyshnivetskyi: PMO Quality Management (UA)Maksym Vyshnivetskyi: PMO Quality Management (UA)
Maksym Vyshnivetskyi: PMO Quality Management (UA)
 
RMD24 | Retail media: hoe zet je dit in als je geen AH of Unilever bent? Heid...
RMD24 | Retail media: hoe zet je dit in als je geen AH of Unilever bent? Heid...RMD24 | Retail media: hoe zet je dit in als je geen AH of Unilever bent? Heid...
RMD24 | Retail media: hoe zet je dit in als je geen AH of Unilever bent? Heid...
 
Improving profitability for small business
Improving profitability for small businessImproving profitability for small business
Improving profitability for small business
 
3.0 Project 2_ Developing My Brand Identity Kit.pptx
3.0 Project 2_ Developing My Brand Identity Kit.pptx3.0 Project 2_ Developing My Brand Identity Kit.pptx
3.0 Project 2_ Developing My Brand Identity Kit.pptx
 
Cracking the Workplace Discipline Code Main.pptx
Cracking the Workplace Discipline Code Main.pptxCracking the Workplace Discipline Code Main.pptx
Cracking the Workplace Discipline Code Main.pptx
 
LA HUG - Video Testimonials with Chynna Morgan - June 2024
LA HUG - Video Testimonials with Chynna Morgan - June 2024LA HUG - Video Testimonials with Chynna Morgan - June 2024
LA HUG - Video Testimonials with Chynna Morgan - June 2024
 
Digital Transformation and IT Strategy Toolkit and Templates
Digital Transformation and IT Strategy Toolkit and TemplatesDigital Transformation and IT Strategy Toolkit and Templates
Digital Transformation and IT Strategy Toolkit and Templates
 
The Parable of the Pipeline a book every new businessman or business student ...
The Parable of the Pipeline a book every new businessman or business student ...The Parable of the Pipeline a book every new businessman or business student ...
The Parable of the Pipeline a book every new businessman or business student ...
 
Enterprise Excellence is Inclusive Excellence.pdf
Enterprise Excellence is Inclusive Excellence.pdfEnterprise Excellence is Inclusive Excellence.pdf
Enterprise Excellence is Inclusive Excellence.pdf
 
ikea_woodgreen_petscharity_dog-alogue_digital.pdf
ikea_woodgreen_petscharity_dog-alogue_digital.pdfikea_woodgreen_petscharity_dog-alogue_digital.pdf
ikea_woodgreen_petscharity_dog-alogue_digital.pdf
 
Search Disrupted Google’s Leaked Documents Rock the SEO World.pdf
Search Disrupted Google’s Leaked Documents Rock the SEO World.pdfSearch Disrupted Google’s Leaked Documents Rock the SEO World.pdf
Search Disrupted Google’s Leaked Documents Rock the SEO World.pdf
 
CADAVER AS OUR FIRST TEACHER anatomt in your.pptx
CADAVER AS OUR FIRST TEACHER anatomt in your.pptxCADAVER AS OUR FIRST TEACHER anatomt in your.pptx
CADAVER AS OUR FIRST TEACHER anatomt in your.pptx
 
一比一原版加拿大渥太华大学毕业证(uottawa毕业证书)如何办理
一比一原版加拿大渥太华大学毕业证(uottawa毕业证书)如何办理一比一原版加拿大渥太华大学毕业证(uottawa毕业证书)如何办理
一比一原版加拿大渥太华大学毕业证(uottawa毕业证书)如何办理
 
20240425_ TJ Communications Credentials_compressed.pdf
20240425_ TJ Communications Credentials_compressed.pdf20240425_ TJ Communications Credentials_compressed.pdf
20240425_ TJ Communications Credentials_compressed.pdf
 
Putting the SPARK into Virtual Training.pptx
Putting the SPARK into Virtual Training.pptxPutting the SPARK into Virtual Training.pptx
Putting the SPARK into Virtual Training.pptx
 
What is the TDS Return Filing Due Date for FY 2024-25.pdf
What is the TDS Return Filing Due Date for FY 2024-25.pdfWhat is the TDS Return Filing Due Date for FY 2024-25.pdf
What is the TDS Return Filing Due Date for FY 2024-25.pdf
 
Buy Verified PayPal Account | Buy Google 5 Star Reviews
Buy Verified PayPal Account | Buy Google 5 Star ReviewsBuy Verified PayPal Account | Buy Google 5 Star Reviews
Buy Verified PayPal Account | Buy Google 5 Star Reviews
 
The-McKinsey-7S-Framework. strategic management
The-McKinsey-7S-Framework. strategic managementThe-McKinsey-7S-Framework. strategic management
The-McKinsey-7S-Framework. strategic management
 
Introduction to Amazon company 111111111111
Introduction to Amazon company 111111111111Introduction to Amazon company 111111111111
Introduction to Amazon company 111111111111
 
ikea_woodgreen_petscharity_cat-alogue_digital.pdf
ikea_woodgreen_petscharity_cat-alogue_digital.pdfikea_woodgreen_petscharity_cat-alogue_digital.pdf
ikea_woodgreen_petscharity_cat-alogue_digital.pdf
 

VisualPresentation

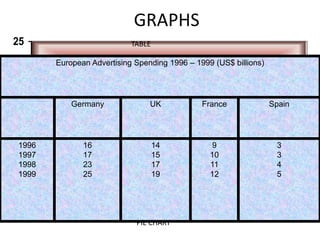
  • 1. GRAPHS 0 5 10 15 20 25 1998 1999 2000 2001 2002 2003 2004 0 20 40 60 80 100 120 140 1st Qtr 2nd Qtr 3rd Qtr 4th Qtr 1999 1st Qtr 2nd Qtr 3rd Qtr 4th Qtr 2000 1st Qtr 2nd Qtr 3rd Qtr 4th Qtr 2001 VH Warehouse Ltd 45% 25% 15% 15% Purchasing Marketing Administration Entertainment BAR CHART PIE CHART LINE CHART European Advertising Spending 1996 – 1999 (US$ billions) Germany UK France Spain 1996 1997 1998 1999 16 17 23 25 14 15 17 19 9 10 11 12 3 3 4 5 TABLE
  • 2. Mobile phone Owner Growth 0 2 4 6 8 10 12 14 16 UK Germany Italy Sweden France Finland Norway Denmark Spain Owners 1995 Owners 2000 Millions
  • 3. The graph illustrates the information on the growing number of mobile phone owners in Europe between 1995 and 2000. The European countries are the UK, Germany, Italy, Sweden, France, Finland, Norway, Denmark and Spain. Generally speaking, the number of mobile phone owners increased over the five years. The first five countries had shown a rapid increase by year 2000 and the last four countries had shown a slight increase except for Spain. Spain had showed a dramatic increase over the five years. The UK had the most mobile phone owners in 1995 (just over 4 millions) and the figure increased to 12 million in 2000. Meanwhile, there were 4 million owners in Germany in 1995 but there was a dramatic increase to a peak of 14 million which was the highest number in 2000. The other countries like Italy, Sweden, and France had a dramatic increase to more than 6 million owners. The figure in Finland, Norway, Denmark and Spain was almost the same at around 1 million in 1995. The number of mobile phone owners rose slightly to 2 million owners in 2000 except for Spain which had a rapid increase to 5 million owners in 2000. As a conclusion, there was a significant mobile phone owner growth in the European countries in 2000. Each country had an increase.
  • 4. 1. INTRODUCING THE TOPIC Beginning Middle Time The graph shows……. The graph illustrates….. From the graph we can see…. From the graph we can observe………… From the graph we can understand……… The graph displays the information on how …… changed over ……. years over ….. period between…and…
  • 5. 0 2 4 6 8 10 12 14 16 Owners 1995 Owners 2000 -The graph illustrates/shows the information on the growing number of mobile phone owners in Europe between 1995 and 2000. - From the graph we can see/observe/understand how the number of mobile phone owners in Europe changed over 5 years. Mobile phone Owner Growth Millions
  • 6. Practice 0 200 400 600 800 1000 1980 1985 1990 1995 2000 Companyyears NumberofemployeesNumberofEmployees
  • 8. Practice Supermarkets built 0 200 400 600 800 1000 1200 1993 1994 1995 1996 1997 1998 1999 2000 2001 2002 2003 2004
  • 9. Practice 0 100 200 300 400 500 6 7 8 9 10 11 12 13 14 15 16 17 18 19 20 21 22 Time Numberofpeopleata Londonstation
  • 10. Sales in Percentage terms for TewkesMart 20 20 20 13 10 17 Electical Goods Computer Hardware Toys Food Clothes Others
  • 11. European Advertising Spending 1996 – 1999 (US$ billions) Germany UK France Spain 1996 1997 1998 1999 16 17 23 25 14 15 17 19 9 10 11 12 3 3 4 5
  • 12. 2.GENERAL TREND General Trends are the general changes or movements in facts and figures over a period of time. It usually uses linking words like: -In general -In overall -Generally speaking
  • 13. 0 2 4 6 8 10 12 14 16 Owners 1995 Owners 2000 Mobile phone Owner Growth Millions Generally speaking, the number of mobile phone owners increased over the five years. The first five countries had shown a rapid increase by year 2000 and the last four countries had shown a slight increase except for Spain. Spain had shown a dramatic increase over the five years.
  • 14. 0 50 100 150 200 250 300 350 400 450 500 Instantaneous increase Increase instantaneously Very rapid sudden increase rise Increase Rise quickly dramatically rapidly suddenly Rapid Strong Marked Increase Rise Increase Rise rapidly strongly quickly dramaticallySteady Moderate Gradual Increase Rise Increase Rise steadily moderately gradually Slight Gentle Small Slow increase rise Increase Rise slightly gently a little a bit Very slight increase rise Increase Rise very slightly
  • 16. 0 5 10 15 20 25 1998 1999 2000 2001 2002 2003 2004 Fluctuate Fluctuate upwards A gradual increase A slow fluctuation Increase gradually
  • 17. 0 5 10 15 20 25 1998 1999 2000 2001 2002 2003 2004 Remain stable Remain stagnant
  • 18. 0 5 10 15 20 25 1999 2000 2001 2002 2003 2004 A slow decrease A gentle decrease A slight decrease
  • 19. Generally speaking, In general, In overall, the number of… increased… decreased… fell… fluctuated… remained stable/stagnant had shown a … increase a….decrease a….fall a….fluctuation
  • 20. PRACTICE Make a general trend for the following charts. 0 200 400 600 800 1000 1980 1985 1990 1995 2000 Companyyears Numberofemployees 0 20 40 60 80 100 120 140 1st Qtr 2nd Qtr 3rd Qtr 4th Qtr 1999 1st Qtr 2nd Qtr 3rd Qtr 4th Qtr 2000 1st Qtr 2nd Qtr 3rd Qtr 4th Qtr 2001 VH Warehouse Ltd Supermarkets built 0 200 400 600 800 1000 1200 1993 1994 1995 1996 1997 1998 1999 2000 2001 2002 2003 2004 0 100 200 300 400 500 6 7 8 9 10 11 12 13 14 15 16 17 18 19 20 21 22 Time Numberofpeopleata Londonstation Sales in Percentage terms for TewkesMart 20 20 20 13 10 17 Electical Goods Computer Hardware Toys Food Clothes Others
  • 21. All Almost all Just over 3/4 ¾ (Most of…./ majority/ a large portion Just over half 75%80% Half Almost half ¼ a few/ a minority/ a small portion Almost nearly None
  • 22. DETAILS It should contain depth description of the data that expands the general trend that has been stated in the previous part. But the information presented should be effectively organized in order to preclude too much unnecessary information described. So it is important to select the appropriate details and organize the material in a relevant way. The way can be stated as GROUPING INFORMATION.
  • 23. Consider what the graph shows and think about the vocabulary and tenses we will use in describing it. Select significant features of the graph (overall) to tell about. Note some points Consider the comparison we will make Think about a final point
  • 24. 0 2 4 6 8 10 12 14 16 Owners 1995 Owners 2000 Millions Mobile phone Owner Growth The UK had the most mobile phone owners in 1995 (just over 4 million) and the figure increased to 12 million in 2000. Meanwhile, there were 4 million owners in Germany in 1995 but there was a dramatic increase to a peak of 14 million which was the highest number in 2000. The other countries like Italy, Sweden, and France had a dramatic increase to more than 6 million owners. The figure in Finland, Norway, Denmark and Spain was almost the same at around 1 million in 1995. The number of mobile phone owners rose slightly to 2 million owners in 2000 except for Spain which had a rapid increase to 5 million owners in 2000.
  • 25. 0 5 10 15 20 25 30 35 40 45 1990 1991 1992 1993 1994 1995 Average Book Price in Pound sterling In 1990 the price of children’s book was the cheapest. On the other hand, the price of scientific book was the highest/the most expensive. In 1994 the price of scientific book was cheaper than it was in 1993. The children’s book price in 1991 was as expensive as it was in 1992, 1993, 1994, 1995. Like the school text book’s price, the academic book’s price also increased rapidly.
  • 26. COMPARING DATA To contrast To compare While/Whilst Whereas Meanwhile However On the other hand Even so Nevertheless Less…than (less than) Little less than More than Different from Although In contrast to Conversely Opposite Unlike Likewise Similarly As..as Just as In the same way Like Alike To reflect To mirror To have in common Lower/Higher than The most/the lowest/the highest
  • 27. Annual Sales of hamburgers 0 500 1000 1500 2000 2500 3000 Jan Feb Mar Apr May Jun Jul Aug Sep Oct Nov Dec From January to June, the sales were fairly constant at around 1800 to 1950 hamburger sales but they were slightly lower during April and may. After June, there was a dramatic increase to a peak of 3000 in August. Then sales declined sharply to a low point of 1300 in October. Afterwards, the sales increased gradually between October and December from 1300 to 1800. Finally, the sales picked up to finish the years at around 1700.
  • 28. Expressions VERB ADJECTIVE ADVERB NOUN Rise Increase Decrease Decline Fall Reach Drop (off) Fluctuate Pick up Peak Go up Go down Climb Boom Dip Slump Reduce Stand at Sudden, Rapid, Gentle, Gradual, Stagnant, Mar ked, Obvious, Sharp, Dr amatic, Considerable, S light, Slow, Sharp, Dramatic, Relative, Huge, Enormous, Steep Substantial, Significant Moderate, Minimal Quick, Swift, Sudden Steady, Gradual Quickly Rapidly Steadily Slowly Gently Suddenly Gradually Slightly Respectively (in the same order) Sharply Dramatically Considerably Relatively Increase Fall Decrease Decline Fluctuation Drop Rise Peak/dip Trough Plateau A low point Growth An upward trend A boom A slump (a dramatic fall)
  • 29. 0 5 10 15 20 25 1999 2000 2001 2002 2003 2004 Reach a peak
  • 30. To be stagnant Remain steady Shoot up Level rocket Fluctuate between Fluctuate upwards Fall a trough Fall to (it’s) lowest level Level out Remain steady At a steady level Remain the same Reach a plateau Remain stable Remain constant Stay constant Reach a peak Hit/fall to the lowest point Did not change Maintain the same level
  • 31. PRACTICE 0 200 400 600 800 1000 1980 1985 1990 1995 2000 Companyyears Numberofemployees
  • 33. PRACTICE Supermarkets built 0 200 400 600 800 1000 1200 1993 1994 1995 1996 1997 1998 1999 2000 2001 2002 2003 2004
  • 34. PRACTICE 0 100 200 300 400 500 6 7 8 9 10 11 12 13 14 15 16 17 18 19 20 21 22 Time Numberofpeopleata Londonstation
  • 35. PRACTICE Sales in Percentage terms for TewkesMart 20 20 20 13 10 17 Electical Goods Computer Hardware Toys Food Clothes Others
  • 36. 4. CONCLUSION In summary As a conclusion Generally speaking 1. The conclusion rephrases sentences which are already described in the general trend. 2. The superlative adjectives (the highest, the lowest, etc.) are usually used. 3. The suggestion or prediction might be included in the conclusion.
  • 37. 100% I’m sure/certain that the share prices will (definitely) rise 75% It’s likely that the share prices will increase 50% Share prices should increase Share prices may/might increase 25% It’s (very) unlikely that share prices will increase Share prices are unlikely to increase 0% I’m sure/certain that the share prices (definitely) won’t increase
  • 38. 0 2 4 6 8 10 12 14 16 UK Germany Italy Sweden France Finland Norway Denmark Spain Owners 1995 Owners 2000 Mobile phone Owner Growth Millions As a conclusion, there was a significant mobile phone owner growth in the European countries in 2000. Each country had an increase.
  • 39. A COMPLETE VISUAL PRESENTATION INTRODUCTION: WELCOMING THE AUDIENCE INTRODUCING THE PRESENTER BODY: INTRODUCING TOPIC DESCRIBING GENERAL TREND DETAILS CONCLUSION
  • 40. INTRODUCTION WELCOMING THE AUDIENCE Good morning ladies and gentlemen Good morning everybody Hello/hi everyone (informal) Welcome to… It’s very nice to see you all today First of all let me thank you all for coming here today It’s a pleasure to welcome you today It’s good to see you all here (informal)
  • 41. INTRODUCTION INTRODUCING THE PRESENTER My name is Jane Shaw. I’m responsible for travel arrangements For those who don’t know me, my name is… As you know I’m in charge of public relation (informal) I’m the new marketing manager Let me introduce myself. I’m Dave Andrew from… As probably you know, I’m the new HR manager (informal) I’m head of logistic here at Air Spares I’m here in my function as the Head of Controlling Let me just start by introducing myself. My name is…