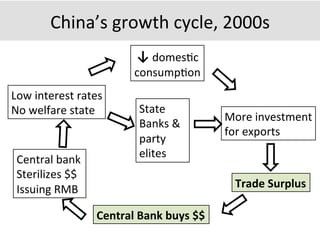
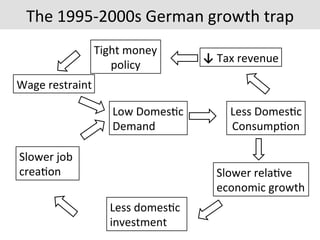
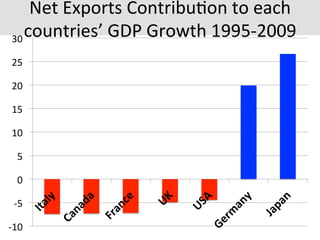
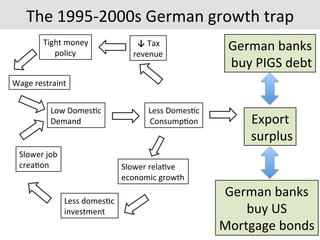
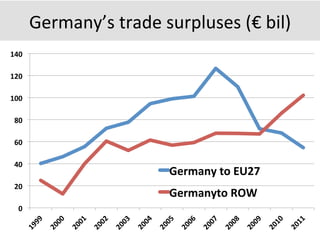
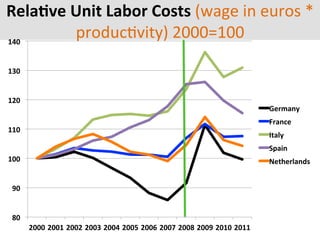
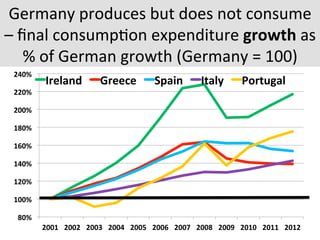
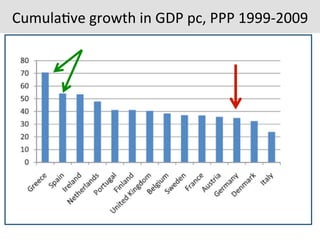
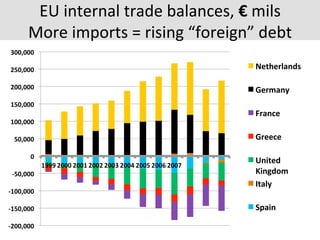
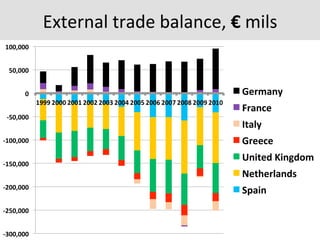
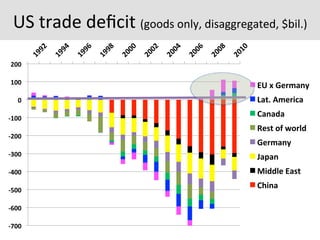
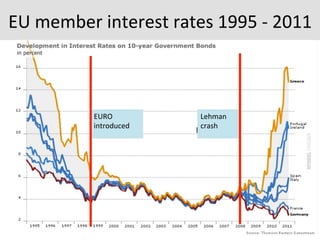
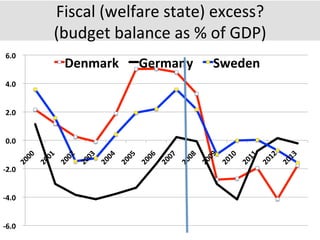
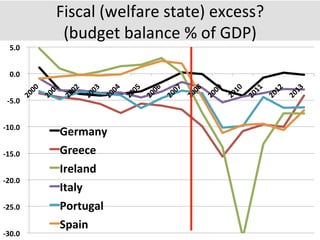
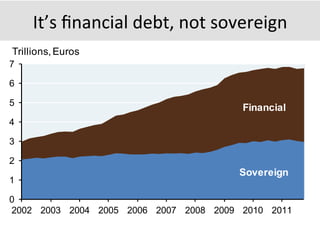
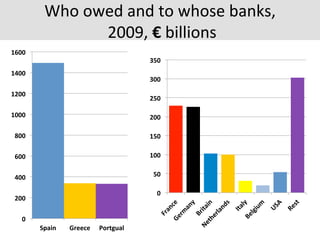
From	
  (US)	
  financial	
  crisis	
  to	
  eurocrisis:	
  	
  
Why	
  are	
  American	
  houses	
  connected	
  
to	
  Europe's	
  internal	
  imbalances?	
  
Herman	
  Schwartz	
  
University	
  of	
  Virginia	
  
27	
  September	
  2013	
  
UNC	
  Chapel	
  Hill	
  /	
  TAM	
  
Everything	
  you	
  need	
  to	
  know…	
  
Euroland:	
  	
  an	
  Op7mal	
  Currency	
  Area?	
  
•  Euro	
  only	
  works	
  if	
  Europe	
  is	
  an	
  OCA	
  
•  OCA	
  needs:	
  
– Essen7ally	
  open	
  financial	
  markets	
  (Yes)	
  
– Essen7ally	
  open	
  goods	
  markets	
  (Mostly,	
  but…)	
  
– High	
  internal	
  labor	
  mobility	
  (No)	
  
– High	
  fiscal	
  transfers	
  (No)	
  
– And	
  –	
  same	
  ideas	
  about	
  proper	
  policy	
  
•  Result:	
  regional	
  instabili7es	
  that	
  are	
  
magnified	
  by	
  na7onal	
  poli7cal	
  structures	
  
US	
  Produc7vity	
  growth	
  vs	
  wage	
  growth	
  
%	
  change	
  1948-­‐2011	
  
100	
  
150	
  
200	
  
250	
  
300	
  
350	
  
400	
  
1948	
  
1951	
  
1954	
  
1957	
  
1960	
  
1963	
  
1966	
  
1969	
  
1972	
  
1975	
  
1978	
  
1981	
  
1984	
  
1987	
  
1990	
  
1993	
  
1996	
  
1999	
  
2002	
  
2005	
  
2008	
  
2011	
  
Wages*	
  
ProducWvity	
  
Produc7vity	
  vs	
  average	
  wage	
  and	
  average	
  
income	
  of	
  top	
  1%,	
  in	
  US,	
  1979+	
  
Rising	
  US	
  household	
  debt	
  compared	
  to	
  
incomes	
  
1:1	
  	
  
ra7o	
  
The	
  1991-­‐2007	
  US	
  growth	
  cycle	
  
Asia	
  Recycles	
  
US	
  Dollars	
  as	
  new	
  	
  
Treasury	
  /	
  MBS	
  Debt	
  
Disinfla7on	
   Housing	
  	
  
Finance	
  
System	
  
More	
  Consump7on	
  
US	
  trade	
  deficits	
  
à	
  Global	
  Growth	
  
Faster	
  US	
  	
  
Economic	
  Growth	
  
↑	
  Tax	
  revenue	
  
Fed	
  ↓	
  interest	
  rates	
  
Low	
  interest	
  rates	
  
No	
  welfare	
  state	
  
China’s	
  growth	
  cycle,	
  2000s	
  
Central	
  bank	
  
Sterilizes	
  $$	
  
Issuing	
  RMB	
  
State	
  
Banks	
  &	
  
party	
  
elites	
  
More	
  investment	
  
for	
  exports	
  
Central	
  Bank	
  buys	
  $$	
  
Trade	
  Surplus	
  
↓	
  domes7c	
  	
  
consump7on	
  
The	
  1995-­‐2000s	
  German	
  growth	
  trap	
  
Slower	
  job	
  	
  
crea7on	
  
Wage	
  restraint	
  
Low	
  Domes7c	
  
Demand	
  
Less	
  Domes7c	
  
Consump7on	
  
Less	
  domes7c	
  	
  
investment	
  
Slower	
  rela7ve	
  
economic	
  growth	
  
↓	
  Tax	
  revenue	
  
Tight	
  money	
  
policy	
  
Net	
  Exports	
  Contribu7on	
  to	
  each	
  
countries’	
  GDP	
  Growth	
  1995-­‐2009	
  
-­‐10	
  
-­‐5	
  
0	
  
5	
  
10	
  
15	
  
20	
  
25	
  
30	
  
The	
  1995-­‐2000s	
  German	
  growth	
  trap	
  
Slower	
  job	
  	
  
crea7on	
  
Wage	
  restraint	
  
Low	
  Domes7c	
  
Demand	
  
Less	
  Domes7c	
  
Consump7on	
  
Less	
  domes7c	
  	
  
investment	
  
Slower	
  rela7ve	
  
economic	
  growth	
  
↓	
  Tax	
  	
  
revenue	
  
Tight	
  money	
  
policy	
  
Export	
  
	
  surplus	
  
German	
  banks	
  
	
  buy	
  PIGS	
  debt	
  
German	
  banks	
  
buy	
  US	
  	
  
Mortgage	
  bonds	
  
Germany’s	
  trade	
  surpluses	
  (€	
  bil)	
  	
  
0	
  
20	
  
40	
  
60	
  
80	
  
100	
  
120	
  
140	
  
Germany	
  to	
  EU27	
  
Germanyto	
  ROW	
  
RelaWve	
  Unit	
  Labor	
  Costs	
  (wage	
  in	
  euros	
  *	
  
produc7vity)	
  2000=100	
  
80	
  
90	
  
100	
  
110	
  
120	
  
130	
  
140	
  
2000	
  2001	
  2002	
  2003	
  2004	
  2005	
  2006	
  2007	
  2008	
  2009	
  2010	
  2011	
  
Germany	
  
France	
  
Italy	
  
Spain	
  
Netherlands	
  
Germany	
  produces	
  but	
  does	
  not	
  consume	
  
–	
  final	
  consump7on	
  expenditure	
  growth	
  as	
  
%	
  of	
  German	
  growth	
  (Germany	
  =	
  100)	
  
80%	
  
100%	
  
120%	
  
140%	
  
160%	
  
180%	
  
200%	
  
220%	
  
240%	
  
2001	
   2002	
   2003	
   2004	
   2005	
   2006	
   2007	
   2008	
   2009	
   2010	
   2011	
   2012	
  
Ireland	
   Greece	
   Spain	
   Italy	
   Portugal	
  
Cumula7ve	
  growth	
  in	
  GDP	
  pc,	
  PPP	
  1999-­‐2009	
  	
  
EU	
  member	
  interest	
  rates	
  1995	
  -­‐	
  2011	
  
EURO	
  	
  
introduced	
  
Lehman	
  
crash	
  
EU	
  internal	
  trade	
  balances,	
  €	
  mils	
  
More	
  imports	
  =	
  rising	
  “foreign”	
  debt	
  
-­‐200,000	
  
-­‐150,000	
  
-­‐100,000	
  
-­‐50,000	
  
0	
  
50,000	
  
100,000	
  
150,000	
  
200,000	
  
250,000	
  
300,000	
  
1999	
  2000	
  2001	
  2002	
  2003	
  2004	
  2005	
  2006	
  2007	
  
Netherlands	
  
Germany	
  	
  
France	
  
Greece	
  
United	
  
Kingdom	
  
Italy	
  
Spain	
  
External	
  trade	
  balance,	
  €	
  mils	
  
-­‐300,000	
  
-­‐250,000	
  
-­‐200,000	
  
-­‐150,000	
  
-­‐100,000	
  
-­‐50,000	
  
0	
  
50,000	
  
100,000	
  
1999	
  2000	
  2001	
  2002	
  2003	
  2004	
  2005	
  2006	
  2007	
  2008	
  2009	
  2010	
  
Germany	
  
France	
  
Italy	
  
Greece	
  
United	
  Kingdom	
  
Netherlands	
  
Spain	
  
US	
  trade	
  deficit	
  (goods	
  only,	
  disaggregated,	
  $bil.)	
  
-­‐700	
  
-­‐600	
  
-­‐500	
  
-­‐400	
  
-­‐300	
  
-­‐200	
  
-­‐100	
  
0	
  
100	
  
200	
  
EU	
  x	
  Germany	
  
Lat.	
  America	
  
Canada	
  
Rest	
  of	
  world	
  
Germany	
  
Japan	
  
Middle	
  East	
  
China	
  
EU	
  member	
  interest	
  rates	
  1995	
  -­‐	
  2011	
  
EURO	
  	
  
introduced	
  
Lehman	
  
crash	
  
Fiscal	
  (welfare	
  state)	
  excess?	
  	
  
(budget	
  balance	
  as	
  %	
  of	
  GDP)	
  
-­‐6.0	
  	
  
-­‐4.0	
  	
  
-­‐2.0	
  	
  
0.0	
  	
  
2.0	
  	
  
4.0	
  	
  
6.0	
  	
  
Denmark	
   Germany	
   Sweden	
  
Fiscal	
  (welfare	
  state)	
  excess?	
  	
  
(budget	
  balance	
  %	
  of	
  GDP)	
  
-­‐30.0	
  	
  
-­‐25.0	
  	
  
-­‐20.0	
  	
  
-­‐15.0	
  	
  
-­‐10.0	
  	
  
-­‐5.0	
  	
  
0.0	
  	
  
5.0	
  	
  
Germany	
  
Greece	
  
Ireland	
  
Italy	
  
Portugal	
  
Spain	
  
It’s	
  financial	
  debt,	
  not	
  sovereign	
  
nce all the maturing Peripheral sovereign and bank debt that
nd bank debt: almost 7 trillion Euros.
0
1
2
3
4
5
6
7
2002 2003 2004 2005 2006 2007 2008 2009 2010 2011
Source: J.P. Morgan SecuritiesLLC.
Peripheral sovereign and financial debt
Trillions,Euros
Sovereign
Financial
What	
  if	
  Greece	
  (Spain,	
  Italy)	
  defaulted?	
  
Who	
  owed	
  and	
  to	
  whose	
  banks,	
  
	
  2009,	
  €	
  billions	
  	
  
0	
  
200	
  
400	
  
600	
  
800	
  
1000	
  
1200	
  
1400	
  
1600	
  
Spain	
   Greece	
   Portgual	
  
0	
  
50	
  
100	
  
150	
  
200	
  
250	
  
300	
  
350	
  
Private	
  capital	
  ounlows,	
  public	
  inflows…	
  
as	
  %	
  of	
  GDP	
  of	
  Spain,	
  Greece,	
  Italy,	
  Portugal,	
  Ireland	
  
The	
  ECB	
  reacts	
  
Banking
sector
Public
sector
0
500
1,000
1,500
2,000
2,500
ECB borrowing
Borrowing 
from
private banks
EFSF/EFSM
SMP
ECB borrowing
Borrowing 
from
private banks
Figure 1.7. Euro Area Exposures to Greece, Ireland, Italy, 
Portugal, and Spain
(In billions of euros)
Dec-09 Current
…and private borrowing is being replaced by public sector
flows…
Wolfgang	
  Schauble	
  (FRG	
  Fin	
  Minister)	
  
“Nobody	
  in	
  Europe	
  sees	
  this	
  contradic7on	
  
between	
  fiscal	
  policy	
  consolida7on	
  and	
  growth.	
  
We	
  have	
  a	
  growth-­‐friendly	
  process	
  of	
  
consolida7on,	
  and	
  we	
  have	
  sustainable	
  growth,	
  
however	
  you	
  want	
  to	
  word	
  it.”	
  
	
  Washington	
  Post	
  10	
  April	
  2013	


Eurozone	
  2012	
  GDP	
  growth:	
  	
  -­‐	
  0.6%	
  	
  	
  2013:	
  -­‐	
  0.4%	
  
Eurozone	
  Q2	
  unemployment	
  rate:	
  12.1%	
  
Eurozone	
  total	
  employment	
  =	
  level	
  of	
  Q2	
  2005	
  
The	
  eurozone	
  is	
  a	
  straw	
  house	
  
QUESTIONS?	
  

Herman Schwartz UNC-CH 20130927

  • 1.
    From  (US)  financial  crisis  to  eurocrisis:     Why  are  American  houses  connected   to  Europe's  internal  imbalances?   Herman  Schwartz   University  of  Virginia   27  September  2013   UNC  Chapel  Hill  /  TAM  
  • 2.
    Everything  you  need  to  know…  
  • 3.
    Euroland:    an  Op7mal  Currency  Area?   •  Euro  only  works  if  Europe  is  an  OCA   •  OCA  needs:   – Essen7ally  open  financial  markets  (Yes)   – Essen7ally  open  goods  markets  (Mostly,  but…)   – High  internal  labor  mobility  (No)   – High  fiscal  transfers  (No)   – And  –  same  ideas  about  proper  policy   •  Result:  regional  instabili7es  that  are   magnified  by  na7onal  poli7cal  structures  
  • 4.
    US  Produc7vity  growth  vs  wage  growth   %  change  1948-­‐2011   100   150   200   250   300   350   400   1948   1951   1954   1957   1960   1963   1966   1969   1972   1975   1978   1981   1984   1987   1990   1993   1996   1999   2002   2005   2008   2011   Wages*   ProducWvity  
  • 5.
    Produc7vity  vs  average  wage  and  average   income  of  top  1%,  in  US,  1979+  
  • 6.
    Rising  US  household  debt  compared  to   incomes   1:1     ra7o  
  • 7.
    The  1991-­‐2007  US  growth  cycle   Asia  Recycles   US  Dollars  as  new     Treasury  /  MBS  Debt   Disinfla7on   Housing     Finance   System   More  Consump7on   US  trade  deficits   à  Global  Growth   Faster  US     Economic  Growth   ↑  Tax  revenue   Fed  ↓  interest  rates  
  • 8.
    Low  interest  rates   No  welfare  state   China’s  growth  cycle,  2000s   Central  bank   Sterilizes  $$   Issuing  RMB   State   Banks  &   party   elites   More  investment   for  exports   Central  Bank  buys  $$   Trade  Surplus   ↓  domes7c     consump7on  
  • 9.
    The  1995-­‐2000s  German  growth  trap   Slower  job     crea7on   Wage  restraint   Low  Domes7c   Demand   Less  Domes7c   Consump7on   Less  domes7c     investment   Slower  rela7ve   economic  growth   ↓  Tax  revenue   Tight  money   policy  
  • 10.
    Net  Exports  Contribu7on  to  each   countries’  GDP  Growth  1995-­‐2009   -­‐10   -­‐5   0   5   10   15   20   25   30  
  • 11.
    The  1995-­‐2000s  German  growth  trap   Slower  job     crea7on   Wage  restraint   Low  Domes7c   Demand   Less  Domes7c   Consump7on   Less  domes7c     investment   Slower  rela7ve   economic  growth   ↓  Tax     revenue   Tight  money   policy   Export    surplus   German  banks    buy  PIGS  debt   German  banks   buy  US     Mortgage  bonds  
  • 12.
    Germany’s  trade  surpluses  (€  bil)     0   20   40   60   80   100   120   140   Germany  to  EU27   Germanyto  ROW  
  • 13.
    RelaWve  Unit  Labor  Costs  (wage  in  euros  *   produc7vity)  2000=100   80   90   100   110   120   130   140   2000  2001  2002  2003  2004  2005  2006  2007  2008  2009  2010  2011   Germany   France   Italy   Spain   Netherlands  
  • 14.
    Germany  produces  but  does  not  consume   –  final  consump7on  expenditure  growth  as   %  of  German  growth  (Germany  =  100)   80%   100%   120%   140%   160%   180%   200%   220%   240%   2001   2002   2003   2004   2005   2006   2007   2008   2009   2010   2011   2012   Ireland   Greece   Spain   Italy   Portugal  
  • 15.
    Cumula7ve  growth  in  GDP  pc,  PPP  1999-­‐2009    
  • 16.
    EU  member  interest  rates  1995  -­‐  2011   EURO     introduced   Lehman   crash  
  • 17.
    EU  internal  trade  balances,  €  mils   More  imports  =  rising  “foreign”  debt   -­‐200,000   -­‐150,000   -­‐100,000   -­‐50,000   0   50,000   100,000   150,000   200,000   250,000   300,000   1999  2000  2001  2002  2003  2004  2005  2006  2007   Netherlands   Germany     France   Greece   United   Kingdom   Italy   Spain  
  • 18.
    External  trade  balance,  €  mils   -­‐300,000   -­‐250,000   -­‐200,000   -­‐150,000   -­‐100,000   -­‐50,000   0   50,000   100,000   1999  2000  2001  2002  2003  2004  2005  2006  2007  2008  2009  2010   Germany   France   Italy   Greece   United  Kingdom   Netherlands   Spain  
  • 19.
    US  trade  deficit  (goods  only,  disaggregated,  $bil.)   -­‐700   -­‐600   -­‐500   -­‐400   -­‐300   -­‐200   -­‐100   0   100   200   EU  x  Germany   Lat.  America   Canada   Rest  of  world   Germany   Japan   Middle  East   China  
  • 20.
    EU  member  interest  rates  1995  -­‐  2011   EURO     introduced   Lehman   crash  
  • 21.
    Fiscal  (welfare  state)  excess?     (budget  balance  as  %  of  GDP)   -­‐6.0     -­‐4.0     -­‐2.0     0.0     2.0     4.0     6.0     Denmark   Germany   Sweden  
  • 22.
    Fiscal  (welfare  state)  excess?     (budget  balance  %  of  GDP)   -­‐30.0     -­‐25.0     -­‐20.0     -­‐15.0     -­‐10.0     -­‐5.0     0.0     5.0     Germany   Greece   Ireland   Italy   Portugal   Spain  
  • 23.
    It’s  financial  debt,  not  sovereign   nce all the maturing Peripheral sovereign and bank debt that nd bank debt: almost 7 trillion Euros. 0 1 2 3 4 5 6 7 2002 2003 2004 2005 2006 2007 2008 2009 2010 2011 Source: J.P. Morgan SecuritiesLLC. Peripheral sovereign and financial debt Trillions,Euros Sovereign Financial
  • 24.
    What  if  Greece  (Spain,  Italy)  defaulted?  
  • 25.
    Who  owed  and  to  whose  banks,    2009,  €  billions     0   200   400   600   800   1000   1200   1400   1600   Spain   Greece   Portgual   0   50   100   150   200   250   300   350  
  • 26.
    Private  capital  ounlows,  public  inflows…   as  %  of  GDP  of  Spain,  Greece,  Italy,  Portugal,  Ireland  
  • 27.
    The  ECB  reacts   Banking sector Public sector 0 500 1,000 1,500 2,000 2,500 ECB borrowing Borrowing  from private banks EFSF/EFSM SMP ECB borrowing Borrowing  from private banks Figure 1.7. Euro Area Exposures to Greece, Ireland, Italy,  Portugal, and Spain (In billions of euros) Dec-09 Current …and private borrowing is being replaced by public sector flows…
  • 28.
    Wolfgang  Schauble  (FRG  Fin  Minister)   “Nobody  in  Europe  sees  this  contradic7on   between  fiscal  policy  consolida7on  and  growth.   We  have  a  growth-­‐friendly  process  of   consolida7on,  and  we  have  sustainable  growth,   however  you  want  to  word  it.”    Washington  Post  10  April  2013     Eurozone  2012  GDP  growth:    -­‐  0.6%      2013:  -­‐  0.4%   Eurozone  Q2  unemployment  rate:  12.1%   Eurozone  total  employment  =  level  of  Q2  2005  
  • 29.
    The  eurozone  is  a  straw  house  
  • 30.