This document provides instructions for several exercises involving configuring and retrieving data from a Vision meter outstation using DataLink software:
1. The first exercise describes configuring a Vision meter outstation with 14 inputs and setting communication and timing options.
2. The second exercise involves automatically and manually retrieving load profile data from the configured Vision meter for 7 days.
3. The third exercise uses DataLink system options to edit, view as a load profile chart, and identify flags for the retrieved Import kWh data.
4. The fourth exercise exports 1 day of data from the Vision meter to a CSV file and deletes the corresponding period data.
5. The final exercise draws a 2-month load
Computer Organisation and Architecture (COA) UNIT 3
Computer Organisation and Architecture (COA) UNIT 3Computer Organisation and Architecture (COA) UNIT 3Computer Organisation and Architecture (COA) UNIT 3Computer Organisation and Architecture (COA) UNIT 3Computer Organisation and Architecture (COA) UNIT 3
Computer Organisation and Architecture (COA) UNIT 3Computer Organisation and Architecture (COA) UNIT 3
Computer Organisation and Architecture (COA) UNIT 3
Computer Organisation and Architecture (COA) UNIT 3Computer Organisation and Architecture (COA) UNIT 3
Last Rev. August 2014 Calibration and Temperature Measurement.docxsmile790243
Last Rev.: August 2014 Calibration and Temperature Measurement Page 2
ME 495—Thermo Fluids Laboratory
~~~~~~~~~~~~~~
Temperature Measurement and First-
Order Dynamic Response
~~~~~~~~~~~~~~
PREPARED BY: GROUP LEADER’S NAME
LAB PARTNERS: NAME
NAME
NAME
TIME/DATE OF EXPERIMENT: TIME , DATE
~~~~~~~~~~~~~~
OBJECTIVE — The objectives of this laboratory are:
• To learn basic concepts and definitions associated with the
temperature and temperature measurements.
• To learn how to calibrate a Thermocouple and a Thermistor.
• To determine and compare the time constants of a
thermocouple and a thermometer.
• To determine how a thermocouple and a thermometer
responds to different inputs. You will also observe the
response of a thermocouple to an oscillatory input.
• To develop awareness for sources of error in temperature
measurements.
THEORY – In this lab, we will use first-order models to
approximate the response of a thermometer, thermocouple, and a
thermistor to temperature inputs, as these temperature sensors
measure temperatures in a different way.
A thermometer senses a change in temperature as a change in
the density of a fluid.
A thermocouple consists of two wires of different metals
joined at one end (the junction). When a voltage is applied
across the free ends of the two wires, the differing properties
of the wires create an induced voltage that it proportional to
the temperature change at the junction.
A thermistor is a type of resistor whose resistance is
dependent on temperature, more so than in standard resistors.
The change in resistance is linear with respect to change in
temperature, thus making a thermistor an accurate
temperature measuring device.
EXPERIMENT PREPARATION - Get a thermometer, a K (or J)
type thermocouple, and a thermistor from the TA. Identify the
positive and negative terminals for the thermocouple.
• Verify that the thermocouple is functioning well. This can be
done by connecting the thermocouple to a DMM and ensuring that
the voltage changes when you hold the thermocouple weld
between your fingers.
• Be familiar with all of the instruments you will be using for this
experiment. Knowing your equipment well is essential.
• Prepare an ice bath. Most EMF (electromotive force) tables use
ice point (0C) as the reference temperature and this traditional
fixed point temperature is preferred for accurate and reliable
measurements. To prepare the ice bath:
o Crush or flake the ice (Ice is available in the white icebox
located on the measurement table).
o Fill the thermos (the blue with white lid) half with crushed-ice,
add water and stir it until the mixture becomes a slush without
having the ice float. [Recall: If the ice floats, the bottom
temperature could be higher than 0C –Anomalous expansion of
water.]
PROCEDURE - Part 1: Modify a VI for temperature measurements
In this lab, you will b ...
CNC Programming for Begainer.
1.Easy Mehtod.
2.Complete Theoritical Knowledge.
3.Motion and coordinate system for NC machine.
4.Axes convention of VMC & HMC.
5.How to make Part Programming.
6.Coordinates System.
7.Programming Format.
8.List of G Codes And M Codes.
9.How to Use of Above Codes In Programme.
10.Reference Point and Return of Machine.
Computer Organisation and Architecture (COA) UNIT 3
Computer Organisation and Architecture (COA) UNIT 3Computer Organisation and Architecture (COA) UNIT 3Computer Organisation and Architecture (COA) UNIT 3Computer Organisation and Architecture (COA) UNIT 3Computer Organisation and Architecture (COA) UNIT 3
Computer Organisation and Architecture (COA) UNIT 3Computer Organisation and Architecture (COA) UNIT 3
Computer Organisation and Architecture (COA) UNIT 3
Computer Organisation and Architecture (COA) UNIT 3Computer Organisation and Architecture (COA) UNIT 3
Last Rev. August 2014 Calibration and Temperature Measurement.docxsmile790243
Last Rev.: August 2014 Calibration and Temperature Measurement Page 2
ME 495—Thermo Fluids Laboratory
~~~~~~~~~~~~~~
Temperature Measurement and First-
Order Dynamic Response
~~~~~~~~~~~~~~
PREPARED BY: GROUP LEADER’S NAME
LAB PARTNERS: NAME
NAME
NAME
TIME/DATE OF EXPERIMENT: TIME , DATE
~~~~~~~~~~~~~~
OBJECTIVE — The objectives of this laboratory are:
• To learn basic concepts and definitions associated with the
temperature and temperature measurements.
• To learn how to calibrate a Thermocouple and a Thermistor.
• To determine and compare the time constants of a
thermocouple and a thermometer.
• To determine how a thermocouple and a thermometer
responds to different inputs. You will also observe the
response of a thermocouple to an oscillatory input.
• To develop awareness for sources of error in temperature
measurements.
THEORY – In this lab, we will use first-order models to
approximate the response of a thermometer, thermocouple, and a
thermistor to temperature inputs, as these temperature sensors
measure temperatures in a different way.
A thermometer senses a change in temperature as a change in
the density of a fluid.
A thermocouple consists of two wires of different metals
joined at one end (the junction). When a voltage is applied
across the free ends of the two wires, the differing properties
of the wires create an induced voltage that it proportional to
the temperature change at the junction.
A thermistor is a type of resistor whose resistance is
dependent on temperature, more so than in standard resistors.
The change in resistance is linear with respect to change in
temperature, thus making a thermistor an accurate
temperature measuring device.
EXPERIMENT PREPARATION - Get a thermometer, a K (or J)
type thermocouple, and a thermistor from the TA. Identify the
positive and negative terminals for the thermocouple.
• Verify that the thermocouple is functioning well. This can be
done by connecting the thermocouple to a DMM and ensuring that
the voltage changes when you hold the thermocouple weld
between your fingers.
• Be familiar with all of the instruments you will be using for this
experiment. Knowing your equipment well is essential.
• Prepare an ice bath. Most EMF (electromotive force) tables use
ice point (0C) as the reference temperature and this traditional
fixed point temperature is preferred for accurate and reliable
measurements. To prepare the ice bath:
o Crush or flake the ice (Ice is available in the white icebox
located on the measurement table).
o Fill the thermos (the blue with white lid) half with crushed-ice,
add water and stir it until the mixture becomes a slush without
having the ice float. [Recall: If the ice floats, the bottom
temperature could be higher than 0C –Anomalous expansion of
water.]
PROCEDURE - Part 1: Modify a VI for temperature measurements
In this lab, you will b ...
CNC Programming for Begainer.
1.Easy Mehtod.
2.Complete Theoritical Knowledge.
3.Motion and coordinate system for NC machine.
4.Axes convention of VMC & HMC.
5.How to make Part Programming.
6.Coordinates System.
7.Programming Format.
8.List of G Codes And M Codes.
9.How to Use of Above Codes In Programme.
10.Reference Point and Return of Machine.
Mitsubishi energy measuring unit eco monitorlight_dienhathe.vnDien Ha The
Khoa Học - Kỹ Thuật & Giải Trí: http://phongvan.org
Tài Liệu Khoa Học Kỹ Thuật: http://tailieukythuat.info
Thiết bị Điện Công Nghiệp - Điện Hạ Thế: http://dienhathe.vn
Mitsubishi energy measuring unit eco monitorlightDien Ha The
Mitsubishi ,
Catalog Thiết Bị Điện Mitsubishi , Catalog Thiết Bị Điện
Catalog Phụ Kiện Mitsubishi , Catalog Phụ Kiện,
Catalog Mitsubishi , Catalog,
https://www.dienhathe.com,
Chi tiết các sản phẩm khác của Mitsubishi tại https://dienhathe.com
Xem thêm các Catalog khác của Mitsubishi tại https://dienhathe.info
Để nhận báo giá sản phẩm Mitsubishi vui lòng gọi: 0907.764.966
DevOps and Testing slides at DASA ConnectKari Kakkonen
My and Rik Marselis slides at 30.5.2024 DASA Connect conference. We discuss about what is testing, then what is agile testing and finally what is Testing in DevOps. Finally we had lovely workshop with the participants trying to find out different ways to think about quality and testing in different parts of the DevOps infinity loop.
Smart TV Buyer Insights Survey 2024 by 91mobiles.pdf91mobiles
91mobiles recently conducted a Smart TV Buyer Insights Survey in which we asked over 3,000 respondents about the TV they own, aspects they look at on a new TV, and their TV buying preferences.
UiPath Test Automation using UiPath Test Suite series, part 4DianaGray10
Welcome to UiPath Test Automation using UiPath Test Suite series part 4. In this session, we will cover Test Manager overview along with SAP heatmap.
The UiPath Test Manager overview with SAP heatmap webinar offers a concise yet comprehensive exploration of the role of a Test Manager within SAP environments, coupled with the utilization of heatmaps for effective testing strategies.
Participants will gain insights into the responsibilities, challenges, and best practices associated with test management in SAP projects. Additionally, the webinar delves into the significance of heatmaps as a visual aid for identifying testing priorities, areas of risk, and resource allocation within SAP landscapes. Through this session, attendees can expect to enhance their understanding of test management principles while learning practical approaches to optimize testing processes in SAP environments using heatmap visualization techniques
What will you get from this session?
1. Insights into SAP testing best practices
2. Heatmap utilization for testing
3. Optimization of testing processes
4. Demo
Topics covered:
Execution from the test manager
Orchestrator execution result
Defect reporting
SAP heatmap example with demo
Speaker:
Deepak Rai, Automation Practice Lead, Boundaryless Group and UiPath MVP
Essentials of Automations: Optimizing FME Workflows with ParametersSafe Software
Are you looking to streamline your workflows and boost your projects’ efficiency? Do you find yourself searching for ways to add flexibility and control over your FME workflows? If so, you’re in the right place.
Join us for an insightful dive into the world of FME parameters, a critical element in optimizing workflow efficiency. This webinar marks the beginning of our three-part “Essentials of Automation” series. This first webinar is designed to equip you with the knowledge and skills to utilize parameters effectively: enhancing the flexibility, maintainability, and user control of your FME projects.
Here’s what you’ll gain:
- Essentials of FME Parameters: Understand the pivotal role of parameters, including Reader/Writer, Transformer, User, and FME Flow categories. Discover how they are the key to unlocking automation and optimization within your workflows.
- Practical Applications in FME Form: Delve into key user parameter types including choice, connections, and file URLs. Allow users to control how a workflow runs, making your workflows more reusable. Learn to import values and deliver the best user experience for your workflows while enhancing accuracy.
- Optimization Strategies in FME Flow: Explore the creation and strategic deployment of parameters in FME Flow, including the use of deployment and geometry parameters, to maximize workflow efficiency.
- Pro Tips for Success: Gain insights on parameterizing connections and leveraging new features like Conditional Visibility for clarity and simplicity.
We’ll wrap up with a glimpse into future webinars, followed by a Q&A session to address your specific questions surrounding this topic.
Don’t miss this opportunity to elevate your FME expertise and drive your projects to new heights of efficiency.
JMeter webinar - integration with InfluxDB and GrafanaRTTS
Watch this recorded webinar about real-time monitoring of application performance. See how to integrate Apache JMeter, the open-source leader in performance testing, with InfluxDB, the open-source time-series database, and Grafana, the open-source analytics and visualization application.
In this webinar, we will review the benefits of leveraging InfluxDB and Grafana when executing load tests and demonstrate how these tools are used to visualize performance metrics.
Length: 30 minutes
Session Overview
-------------------------------------------
During this webinar, we will cover the following topics while demonstrating the integrations of JMeter, InfluxDB and Grafana:
- What out-of-the-box solutions are available for real-time monitoring JMeter tests?
- What are the benefits of integrating InfluxDB and Grafana into the load testing stack?
- Which features are provided by Grafana?
- Demonstration of InfluxDB and Grafana using a practice web application
To view the webinar recording, go to:
https://www.rttsweb.com/jmeter-integration-webinar
LF Energy Webinar: Electrical Grid Modelling and Simulation Through PowSyBl -...DanBrown980551
Do you want to learn how to model and simulate an electrical network from scratch in under an hour?
Then welcome to this PowSyBl workshop, hosted by Rte, the French Transmission System Operator (TSO)!
During the webinar, you will discover the PowSyBl ecosystem as well as handle and study an electrical network through an interactive Python notebook.
PowSyBl is an open source project hosted by LF Energy, which offers a comprehensive set of features for electrical grid modelling and simulation. Among other advanced features, PowSyBl provides:
- A fully editable and extendable library for grid component modelling;
- Visualization tools to display your network;
- Grid simulation tools, such as power flows, security analyses (with or without remedial actions) and sensitivity analyses;
The framework is mostly written in Java, with a Python binding so that Python developers can access PowSyBl functionalities as well.
What you will learn during the webinar:
- For beginners: discover PowSyBl's functionalities through a quick general presentation and the notebook, without needing any expert coding skills;
- For advanced developers: master the skills to efficiently apply PowSyBl functionalities to your real-world scenarios.
Securing your Kubernetes cluster_ a step-by-step guide to success !KatiaHIMEUR1
Today, after several years of existence, an extremely active community and an ultra-dynamic ecosystem, Kubernetes has established itself as the de facto standard in container orchestration. Thanks to a wide range of managed services, it has never been so easy to set up a ready-to-use Kubernetes cluster.
However, this ease of use means that the subject of security in Kubernetes is often left for later, or even neglected. This exposes companies to significant risks.
In this talk, I'll show you step-by-step how to secure your Kubernetes cluster for greater peace of mind and reliability.
Connector Corner: Automate dynamic content and events by pushing a buttonDianaGray10
Here is something new! In our next Connector Corner webinar, we will demonstrate how you can use a single workflow to:
Create a campaign using Mailchimp with merge tags/fields
Send an interactive Slack channel message (using buttons)
Have the message received by managers and peers along with a test email for review
But there’s more:
In a second workflow supporting the same use case, you’ll see:
Your campaign sent to target colleagues for approval
If the “Approve” button is clicked, a Jira/Zendesk ticket is created for the marketing design team
But—if the “Reject” button is pushed, colleagues will be alerted via Slack message
Join us to learn more about this new, human-in-the-loop capability, brought to you by Integration Service connectors.
And...
Speakers:
Akshay Agnihotri, Product Manager
Charlie Greenberg, Host
Slack (or Teams) Automation for Bonterra Impact Management (fka Social Soluti...Jeffrey Haguewood
Sidekick Solutions uses Bonterra Impact Management (fka Social Solutions Apricot) and automation solutions to integrate data for business workflows.
We believe integration and automation are essential to user experience and the promise of efficient work through technology. Automation is the critical ingredient to realizing that full vision. We develop integration products and services for Bonterra Case Management software to support the deployment of automations for a variety of use cases.
This video focuses on the notifications, alerts, and approval requests using Slack for Bonterra Impact Management. The solutions covered in this webinar can also be deployed for Microsoft Teams.
Interested in deploying notification automations for Bonterra Impact Management? Contact us at sales@sidekicksolutionsllc.com to discuss next steps.
Neuro-symbolic is not enough, we need neuro-*semantic*Frank van Harmelen
Neuro-symbolic (NeSy) AI is on the rise. However, simply machine learning on just any symbolic structure is not sufficient to really harvest the gains of NeSy. These will only be gained when the symbolic structures have an actual semantics. I give an operational definition of semantics as “predictable inference”.
All of this illustrated with link prediction over knowledge graphs, but the argument is general.
Accelerate your Kubernetes clusters with Varnish CachingThijs Feryn
A presentation about the usage and availability of Varnish on Kubernetes. This talk explores the capabilities of Varnish caching and shows how to use the Varnish Helm chart to deploy it to Kubernetes.
This presentation was delivered at K8SUG Singapore. See https://feryn.eu/presentations/accelerate-your-kubernetes-clusters-with-varnish-caching-k8sug-singapore-28-2024 for more details.
Generating a custom Ruby SDK for your web service or Rails API using Smithyg2nightmarescribd
Have you ever wanted a Ruby client API to communicate with your web service? Smithy is a protocol-agnostic language for defining services and SDKs. Smithy Ruby is an implementation of Smithy that generates a Ruby SDK using a Smithy model. In this talk, we will explore Smithy and Smithy Ruby to learn how to generate custom feature-rich SDKs that can communicate with any web service, such as a Rails JSON API.
How world-class product teams are winning in the AI era by CEO and Founder, P...
Vietnam data link training
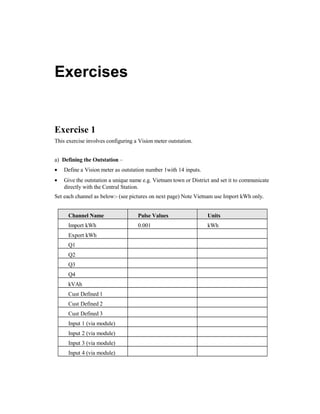
1. Exercises
Exercise 1
This exercise involves configuring a Vision meter outstation.
a) Defining the Outstation –
• Define a Vision meter as outstation number 1with 14 inputs.
• Give the outstation a unique name e.g. Vietnam town or District and set it to communicate
directly with the Central Station.
Set each channel as below:- (see pictures on next page) Note Vietnam use Import kWh only.
Channel Name Pulse Values Units
Import kWh 0.001 kWh
Export kWh
Q1
Q2
Q3
Q4
kVAh
Cust Defined 1
Cust Defined 2
Cust Defined 3
Input 1 (via module)
Input 2 (via module)
Input 3 (via module)
Input 4 (via module)
3. b) Setting the Comms –
• Use the Comms Setup to set the communications links to the outstation i.e. direct or
modem.
• Set both ports to 2400 baud.
• Set the phone type to tone and link the options so that Comms Port 1 is connected to direct
line.
• Leave the preamble box blank while setting maximum retrieval attempts to 1. Set the guard
time to 50.
c) Setting the Timing Options –
• Set the system so that all outstations clocks (Vision meters) are synchronised to the internal
clock (RTC) of the PC.
• Make the maximum time adjustment equal to 45 seconds and the allowable time error on
external synchronised outstation to be 50 seconds.
d) Specifying the Automatic Export Options –
• Set DataLink to automatically export daily data in a .CSV format following a daily
retrieval .
• Set the path to C:ABBCSEXPORT and Apply Pulse Values to the exported readings.
Note : Ensure a directory is created using the File Manager or Windows Explorer.
4. Exercise 2
This exercise involves the Automatic And Manual retrieval of data for the Vision meter defined
in Exercise 1.
a) Automatically Retrieving Data –
• Set the Automatic Data Retrieval to collect Vision load profile readings at 01:15 AM.
• Retrieve a maximum of 7 day’s data for the Vision meter. Ensure the Status is set to On.
b) Manually Retrieving Data –
5. • For the Vision meter defined in Exercise 1, use Manual Data Retrieval to collect 7 days of
data starting from 1 September 99. Set the warn on overwrite to On.
• View the data retrieved for 1 September 99 by selecting System, Edit Data.
• Select the Time + button to step to the next page of load profile data.
6. Exercise 3
This exercise involves using the Systems Options of DataLink for data retrieved on 1st
September 99 for Import kWh channel.
a) Edit & Quick Data –
• Edit the data with pulse values applied for Vision Import kWh channel on the 15/09/99.
• Initiate the Quick Data button to view as a load profile chart.
7. b) Editing Data –
• Edit the data with pulse values applied for 20th
September 99 for Import kWh channel on
the 10/01/96.
• Alter the period values from 01:30 to 04:00 inclusive. Press the OK button.
• Re-edit the same data to identify message flags.
8. Exercise 4
a) Exporting Data Manually –
• Export 1 day’s data for the 18/09/99 from Vision – Hanoi using the .CSV file format.
• Apply pulse values and set the Export Path to C:ABBCSEXPORT.
• View the exported data using Microsoft Excel.
• Using the Edit Data facility in DataLink Plus, delete all period data for 18/09/99. Select the
OK button.
• Use Microsoft Excel to view the data you have just exported.
9. Exercise 5
a) Profile Viewer -
• Draw 2 months data, starting from August 1999, for Vision – Hanoi Import kWh meter.
10. Exercise 5
a) Profile Viewer -
• Draw 2 months data, starting from August 1999, for Vision – Hanoi Import kWh meter.