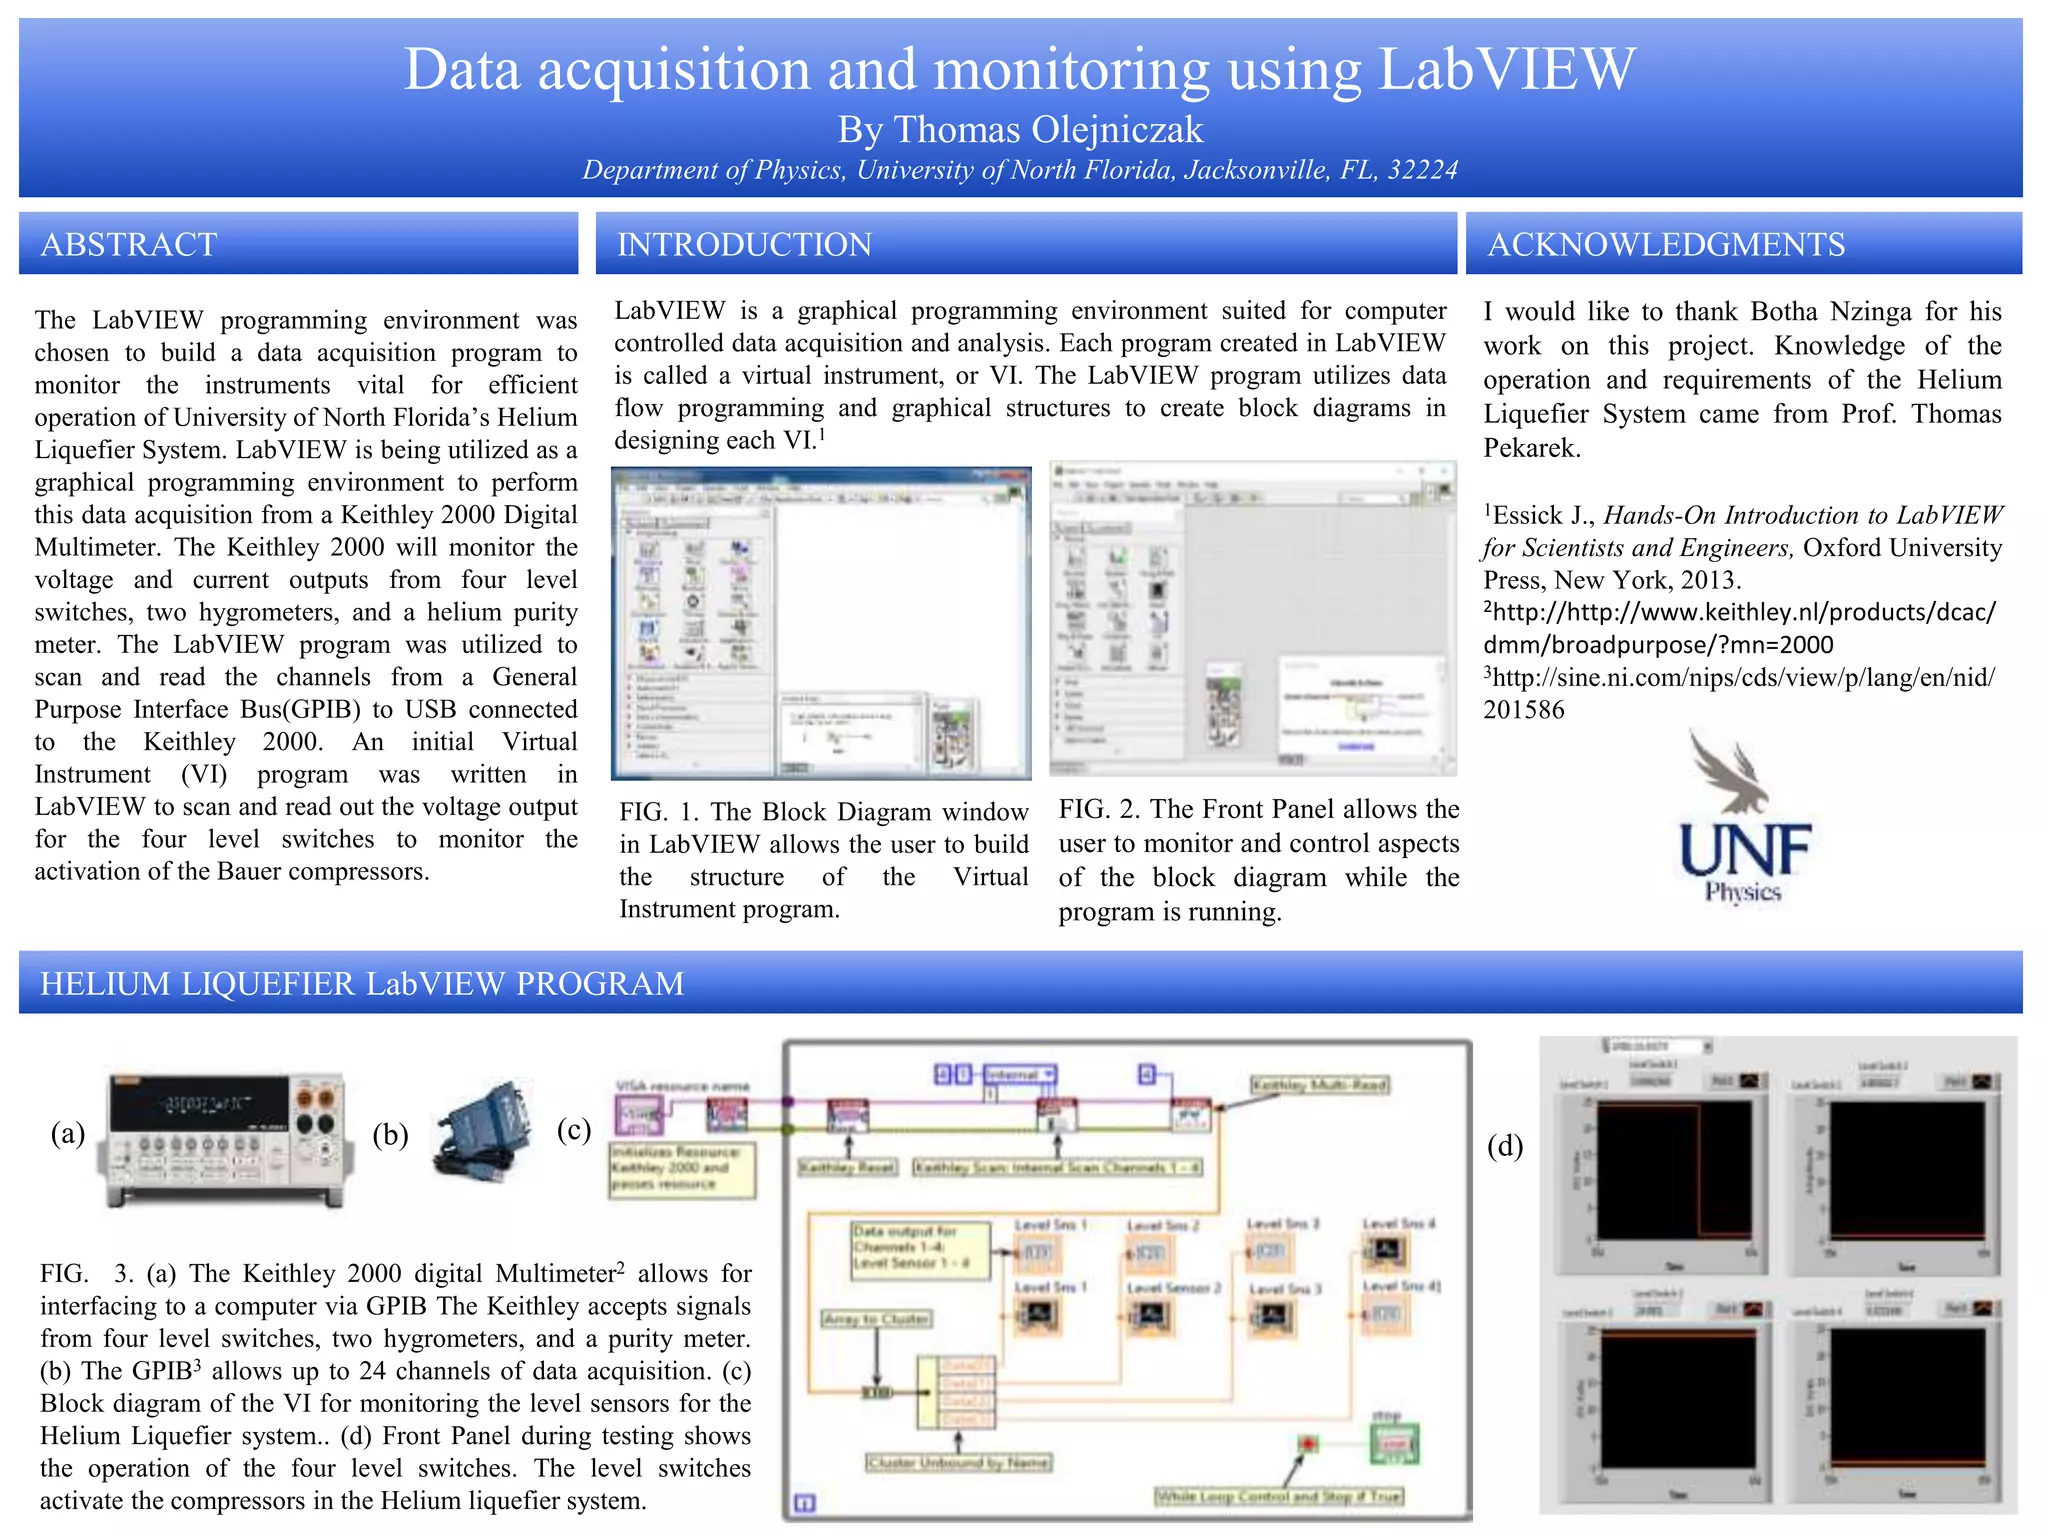
The LabVIEW programming environment was used to build a data acquisition program to monitor instruments for the University of North Florida's Helium Liquefier System. LabVIEW was used as a graphical programming tool to acquire data from a Keithley 2000 Digital Multimeter, which monitors the voltage and current outputs from four level switches, two hygrometers, and a helium purity meter. An initial LabVIEW program, or virtual instrument, was created to scan and read the voltage output of the four level switches to monitor the activation of compressors in the helium liquefier system.