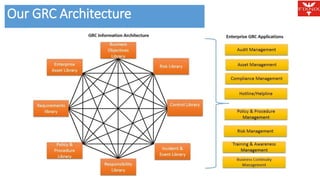
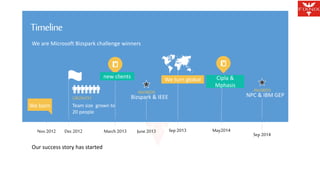
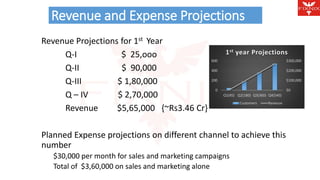
Cloudify your Compliance
Agenda OUR VISION 
To be the top “Governance, Risk & Compliance” solutions company of the 
globe.
Our Mission Agenda 
To Serve Small & Medium enterprises with intuitive, easy to use 
GRC solution.
Our GRC Architecture Agenda
Agenda 
Timeline 
We are Microsoft Bizspark challenge winners 
We born 
Nov 2012 
new clients 
GROWTH 
Team size grown to 
20 people 
March 2013 
We turn global 
AWARDS 
Bizspark & IEEE 
June 2013 Sep 2013 
Dec 2012 
Our success story has started 
Cipla & 
Mphasis 
May2014 
AWARDS 
NPC & IBM GEP 
Sep 2014
STRATEGIC TEAM Agenda 
Shanmugavel Sankaran, CEO & Founder, Chief Nixer 
Chief Nixer Shan has many accolades, endorsements, 
accomplishments in honor for his service to the project 
management & information security community in his past 
organizations. With more than 10 years of global management 
experience including experience in General Management and 
Security Architecture across Motorola, Microsoft, IBM & 
Reasoning Global. 
He has completed his post graduation M.Tech CSE from IIIT 
Hyderabad and joined Microsoft as Intern. Post Microsoft, 
Shan joined IBM where he was security landscape consultant 
for CISO of clients of IBM. After that he took the mandate to 
set up security function in a startup Reasoning Global at 
Hyderabad where in a short stint he helped them mature their 
security processes, application architecture and most 
importantly the security mindset of the employees. 
Over time, his management skills have leaped to become 
exceptional in managing business line operations, people, 
technology and PMO.
Kunwar Rohitashwa, Marketing & Sales Head 
Senior Management Professional with 15 years of experience in 
Global IT Outsourcing Industry across all core functions of , 
Delivery, Operations and Strategy working in India, US and 
Europe. 
Strong background in Account Management, Delivery 
Management, Business Development and Program 
Management of large scale strategic engagements. 
Specialty in program managing large transformational 
proposals with strong innovation themes 
Consulted with various financial services clients to strategize 
global delivery strategy, operationalize “In-source” vs. 
“Outsource” decisions and execute comprehensive governance 
and metrics program 
BFSI and eGovernance domain experience through working on 
projects in various roles.
Clients And key partners Agenda 
Service to others is the rent you pay for your room here on earth “
Competitors of FixNix Agenda
GRC three years from now Agenda
Which model customers prefer Agenda
Regulations difficult to comply with? Agenda
Voice of customer Agenda
Document/Email Approaches challenge Agenda 
GRC
Future Of GRC Agenda
Spending perspectives in GRC
SaaS or not SaaS Agenda
GRC TAM (Target Addressable Market) 
Computing 
Hardware 
11% 
Software 
7% 
IT Services 
23% 
Telecom 
Equipment 
13% 
Telecom 
Services 
46% 
$3.8 trillion market, $1.6 trillion excluding Telecom 
6% annual growth rate expected excluding Telecom 
IT security represents only 1.5% of total 
IT security market expected to grow 12% through 2016 
Cloud GRC will grow from 17% to 24% by 2016 
CY 2010 CY 2011 CY 2012E CY 2013E CY 2014E CY 2015E CY 2016E CAGR 
Computing Hardware $375 $404 $421 $457 $496 $553 $592 7.9% 
Software $244 $267 $280 $299 $319 $339 $362 6.3% 
IT Services $793 $845 $856 $886 $920 $956 $995 3.3% 
Telecom Equipment $412 $442 $473 $508 $538 $567 $593 6.0% 
Telecom Services $1,603 $1,704 $1,721 $1,767 $1,816 $1,861 $1,898 2.2% 
All IT $3,427 $3,662 $3,751 $3,917 $4,089 $4,276 $4,440 3.9% 
HW, SW, Svcs $1,412 $1,516 $1,557 $1,642 $1,735 $1,848 $1,949 
IT Security $19 $22 $24 
Percent of Total 1.3% 1.5% 1.5% 12.0%
The 2012 Top Priorities of the CIO 
Top CIO priorities: 
– Governance and Dashboards 
– Mobility 
– Virtualization 
– Cloud computing 
– Business process management 
• Must derive insight, competitive advantage, and tangible business benefit from the 
huge volumes of data available across an enterprise – how? 
– Master data management, customer analytics, data warehousing, and visual 
information dashboards 
• Must deliver information technology securely and reliably 
• Must help simplify operations, business processes, products, and services 
• Leverage cloud computing and outsourcing to reallocate internal resources from 
routine system maintenance toward more valuable tasks
IT Security Sub-Markets 
$25,000 
$20,000 
$15,000 
$10,000 
$5,000 
$0 
FY 2009 FY 2010 FY 2011 FY 2012E 
Sales in USD (millions) 
Enterprise network firewalls MSSP 
Endpoint protection platforms Secure email gateways 
Unified threat management SIEM 
Secure web gateway Content aware data loss prevention 
Mobile device management Identity & Access Management 
Network access control
IT Security – Most Google-Searched Terms, 2014 
3,100,000 
826,000 
896,000 
1,050,000 
51,500 
76,800 
112,000 
123,000 
206,000 
289,000 
385,000 
562,000 
Managed security services 
Unified threat… 
0 500,000 1,000,000 1,500,000 2,000,000 2,500,000 3,000,000 3,500,000 
Data loss prevention 
Database security 
Email security 
SSL VPN 
Endpoint security 
Endpoint protection 
Computer forensics 
Identity management 
Intrusion detection system 
Fraud prevention
Enterprise 
Network 
Firewalls 
Endpoint 
Protection 
Platforms 
GRC 
Secure Email 
Gateways 
UTM 
IAM 
SIEM 
DLP 
Secure Web 
Gateway 
Mobile Device 
Management 
NAC 
Key: 
Size of circle reflects relative 2014 market size 
Vertical placement reflects relative growth rate
Channel 
 Conferences 
 Direct Marketing 
 Tele Marketing 
 Email 
 SEO/SEM 
 Direct Marketing 
 Radio / TV / Print 
 Dedicated Sales 
 Telemarketing 
 Widgets/Apps 
 Blogs/Blogger 
 Viral/Referral 
 Affiliate/CPA 
 LOLCats 
Marketing Channels
$500 /month /module 
$15,000 
$10,000 
$5,000 
$0 
30 
20 
10 
0 
Ist Quarter 
M1(10) M2(15) M3(20) 
Customers Revenue 
$50,000 
$40,000 
$30,000 
$20,000 
$10,000 
$0 
100 
80 
60 
40 
20 
0 
II nd Quarter 
M-4(40) M-5(60) M-6 80 
Customers Revenue 
$80,000 
$60,000 
$40,000 
$20,000 
$0 
150 
100 
50 
0 
III rd Quarter 
M-7(100) M-8 (120) M-9(140) 
Customers Revenue 
$150,000 
$100,000 
$50,000 
$0 
250 
200 
150 
100 
50 
0 
IV th Quarter 
M-10(160) M-11(180) M-12(200) 
Customers Revenue 
Cost Structure
Revenue and Expense Projections 
Revenue Projections for 1st Year 
Q-I $ 25,ooo 
Q-II $ 90,000 
Q-III $ 1,80,000 
Q – IV $ 2,70,000 
Revenue $5,65,000 {~Rs3.46 Cr} 
600 
400 
200 
1st year Projections 
Planned Expense projections on different channel to achieve this 
number 
$30,000 per month for sales and marketing campaigns 
Total of $3,60,000 on sales and marketing alone 
$300,000 
$200,000 
$100,000 
$0 
0 
Q1(45) Q2(180) Q3(360) Q4(540) 
Customers Revenue
Current Expenditure Breakup 
2947088.5 
Salary 
2233902 
Hyderaba 
d office 
Expenses 
1713046.4 
Vellore 
Office 
Expenses 
1571365 
Railsfacto 
ry 
892450.16 
Bank 
Charges 
803230.5 
Infrastruc 
ture 
Total 
406110.5 362747.14 344032.5 
Event 
Chennai 
Office 
Expenes 
Loan 
Repayme 
nt 
167715.5 118141.5 100535 28000 10000 
Sales 
Travel 
Credit 
Card 
Training 
Director 
Expenses 
Auditor (blank) 
3500000 
3000000 
2500000 
2000000 
1500000 
1000000 
500000 
0 
Total 2947089 2233902 1713046 1571365 892450.2 803230.5 406110.5 362747.1 344032.5 167715.5 118141.5 100535 28000 10000 
Total 
Row Labels Sum of Debit 
Salary 2947088.5 
Hyderabad office Expenses 2233902 
Vellore Office Expenses 1713046.4 
Railsfactory 1571365 
Bank Charges 892450.16 
Infrastructure 803230.5 
Event 406110.5 
Chennai Office Expenes 362747.14 
Loan Repayment 344032.5 
Sales Travel 167715.5 
Credit Card 118141.5 
Training 100535 
Director Expenses 28000 
Auditor 10000 
(blank) 
Grand Total 11698364.7
Break-even analysis 
• We have Spent $195599 
• Income till date $48808.260 
• Funding $250,000 
• Amount to be spent after funding in 1 year $494407.26 
• Revenue for 1st year after funding $988,814 
• Profit after funding by year $ 494407.26
Channel
Expense Plans 
People: 
Hiring full time senior in industry - 5 resource 
$1666 * 5*6month = $50,000 
Existing Employees- $5000 *6months =$30,000 
Consulting fee for Michael Rasmussen- $10,000 Per Annum 
Process: 
Gartner analysis $40,000 
Marketing Strategy (Affiliate marketing, google adds etc ) Avg $30,000*6/m=$1,80000 
Technology: 
Microsoft Azure Bizspark credits -$10,000 (currently free) 
IBM Soft Layer Credits- $10,000 (currently free) 
manageable for 6 months
Keen to join hands with us? 
Drop a mail to shan@fixnix.co 
www.fixnix.co

Vc us v4.0

  • 1.
  • 2.
    Agenda OUR VISION To be the top “Governance, Risk & Compliance” solutions company of the globe.
  • 3.
    Our Mission Agenda To Serve Small & Medium enterprises with intuitive, easy to use GRC solution.
  • 4.
  • 5.
    Agenda Timeline Weare Microsoft Bizspark challenge winners We born Nov 2012 new clients GROWTH Team size grown to 20 people March 2013 We turn global AWARDS Bizspark & IEEE June 2013 Sep 2013 Dec 2012 Our success story has started Cipla & Mphasis May2014 AWARDS NPC & IBM GEP Sep 2014
  • 6.
    STRATEGIC TEAM Agenda Shanmugavel Sankaran, CEO & Founder, Chief Nixer Chief Nixer Shan has many accolades, endorsements, accomplishments in honor for his service to the project management & information security community in his past organizations. With more than 10 years of global management experience including experience in General Management and Security Architecture across Motorola, Microsoft, IBM & Reasoning Global. He has completed his post graduation M.Tech CSE from IIIT Hyderabad and joined Microsoft as Intern. Post Microsoft, Shan joined IBM where he was security landscape consultant for CISO of clients of IBM. After that he took the mandate to set up security function in a startup Reasoning Global at Hyderabad where in a short stint he helped them mature their security processes, application architecture and most importantly the security mindset of the employees. Over time, his management skills have leaped to become exceptional in managing business line operations, people, technology and PMO.
  • 7.
    Kunwar Rohitashwa, Marketing& Sales Head Senior Management Professional with 15 years of experience in Global IT Outsourcing Industry across all core functions of , Delivery, Operations and Strategy working in India, US and Europe. Strong background in Account Management, Delivery Management, Business Development and Program Management of large scale strategic engagements. Specialty in program managing large transformational proposals with strong innovation themes Consulted with various financial services clients to strategize global delivery strategy, operationalize “In-source” vs. “Outsource” decisions and execute comprehensive governance and metrics program BFSI and eGovernance domain experience through working on projects in various roles.
  • 8.
    Clients And keypartners Agenda Service to others is the rent you pay for your room here on earth “
  • 9.
  • 10.
    GRC three yearsfrom now Agenda
  • 11.
    Which model customersprefer Agenda
  • 12.
    Regulations difficult tocomply with? Agenda
  • 13.
  • 14.
  • 15.
  • 16.
  • 17.
    SaaS or notSaaS Agenda
  • 18.
    GRC TAM (TargetAddressable Market) Computing Hardware 11% Software 7% IT Services 23% Telecom Equipment 13% Telecom Services 46% $3.8 trillion market, $1.6 trillion excluding Telecom 6% annual growth rate expected excluding Telecom IT security represents only 1.5% of total IT security market expected to grow 12% through 2016 Cloud GRC will grow from 17% to 24% by 2016 CY 2010 CY 2011 CY 2012E CY 2013E CY 2014E CY 2015E CY 2016E CAGR Computing Hardware $375 $404 $421 $457 $496 $553 $592 7.9% Software $244 $267 $280 $299 $319 $339 $362 6.3% IT Services $793 $845 $856 $886 $920 $956 $995 3.3% Telecom Equipment $412 $442 $473 $508 $538 $567 $593 6.0% Telecom Services $1,603 $1,704 $1,721 $1,767 $1,816 $1,861 $1,898 2.2% All IT $3,427 $3,662 $3,751 $3,917 $4,089 $4,276 $4,440 3.9% HW, SW, Svcs $1,412 $1,516 $1,557 $1,642 $1,735 $1,848 $1,949 IT Security $19 $22 $24 Percent of Total 1.3% 1.5% 1.5% 12.0%
  • 20.
    The 2012 TopPriorities of the CIO Top CIO priorities: – Governance and Dashboards – Mobility – Virtualization – Cloud computing – Business process management • Must derive insight, competitive advantage, and tangible business benefit from the huge volumes of data available across an enterprise – how? – Master data management, customer analytics, data warehousing, and visual information dashboards • Must deliver information technology securely and reliably • Must help simplify operations, business processes, products, and services • Leverage cloud computing and outsourcing to reallocate internal resources from routine system maintenance toward more valuable tasks
  • 21.
    IT Security Sub-Markets $25,000 $20,000 $15,000 $10,000 $5,000 $0 FY 2009 FY 2010 FY 2011 FY 2012E Sales in USD (millions) Enterprise network firewalls MSSP Endpoint protection platforms Secure email gateways Unified threat management SIEM Secure web gateway Content aware data loss prevention Mobile device management Identity & Access Management Network access control
  • 22.
    IT Security –Most Google-Searched Terms, 2014 3,100,000 826,000 896,000 1,050,000 51,500 76,800 112,000 123,000 206,000 289,000 385,000 562,000 Managed security services Unified threat… 0 500,000 1,000,000 1,500,000 2,000,000 2,500,000 3,000,000 3,500,000 Data loss prevention Database security Email security SSL VPN Endpoint security Endpoint protection Computer forensics Identity management Intrusion detection system Fraud prevention
  • 23.
    Enterprise Network Firewalls Endpoint Protection Platforms GRC Secure Email Gateways UTM IAM SIEM DLP Secure Web Gateway Mobile Device Management NAC Key: Size of circle reflects relative 2014 market size Vertical placement reflects relative growth rate
  • 24.
    Channel  Conferences  Direct Marketing  Tele Marketing  Email  SEO/SEM  Direct Marketing  Radio / TV / Print  Dedicated Sales  Telemarketing  Widgets/Apps  Blogs/Blogger  Viral/Referral  Affiliate/CPA  LOLCats Marketing Channels
  • 25.
    $500 /month /module $15,000 $10,000 $5,000 $0 30 20 10 0 Ist Quarter M1(10) M2(15) M3(20) Customers Revenue $50,000 $40,000 $30,000 $20,000 $10,000 $0 100 80 60 40 20 0 II nd Quarter M-4(40) M-5(60) M-6 80 Customers Revenue $80,000 $60,000 $40,000 $20,000 $0 150 100 50 0 III rd Quarter M-7(100) M-8 (120) M-9(140) Customers Revenue $150,000 $100,000 $50,000 $0 250 200 150 100 50 0 IV th Quarter M-10(160) M-11(180) M-12(200) Customers Revenue Cost Structure
  • 26.
    Revenue and ExpenseProjections Revenue Projections for 1st Year Q-I $ 25,ooo Q-II $ 90,000 Q-III $ 1,80,000 Q – IV $ 2,70,000 Revenue $5,65,000 {~Rs3.46 Cr} 600 400 200 1st year Projections Planned Expense projections on different channel to achieve this number $30,000 per month for sales and marketing campaigns Total of $3,60,000 on sales and marketing alone $300,000 $200,000 $100,000 $0 0 Q1(45) Q2(180) Q3(360) Q4(540) Customers Revenue
  • 27.
    Current Expenditure Breakup 2947088.5 Salary 2233902 Hyderaba d office Expenses 1713046.4 Vellore Office Expenses 1571365 Railsfacto ry 892450.16 Bank Charges 803230.5 Infrastruc ture Total 406110.5 362747.14 344032.5 Event Chennai Office Expenes Loan Repayme nt 167715.5 118141.5 100535 28000 10000 Sales Travel Credit Card Training Director Expenses Auditor (blank) 3500000 3000000 2500000 2000000 1500000 1000000 500000 0 Total 2947089 2233902 1713046 1571365 892450.2 803230.5 406110.5 362747.1 344032.5 167715.5 118141.5 100535 28000 10000 Total Row Labels Sum of Debit Salary 2947088.5 Hyderabad office Expenses 2233902 Vellore Office Expenses 1713046.4 Railsfactory 1571365 Bank Charges 892450.16 Infrastructure 803230.5 Event 406110.5 Chennai Office Expenes 362747.14 Loan Repayment 344032.5 Sales Travel 167715.5 Credit Card 118141.5 Training 100535 Director Expenses 28000 Auditor 10000 (blank) Grand Total 11698364.7
  • 28.
    Break-even analysis •We have Spent $195599 • Income till date $48808.260 • Funding $250,000 • Amount to be spent after funding in 1 year $494407.26 • Revenue for 1st year after funding $988,814 • Profit after funding by year $ 494407.26
  • 29.
  • 30.
    Expense Plans People: Hiring full time senior in industry - 5 resource $1666 * 5*6month = $50,000 Existing Employees- $5000 *6months =$30,000 Consulting fee for Michael Rasmussen- $10,000 Per Annum Process: Gartner analysis $40,000 Marketing Strategy (Affiliate marketing, google adds etc ) Avg $30,000*6/m=$1,80000 Technology: Microsoft Azure Bizspark credits -$10,000 (currently free) IBM Soft Layer Credits- $10,000 (currently free) manageable for 6 months
  • 31.
    Keen to joinhands with us? Drop a mail to shan@fixnix.co www.fixnix.co