Download to read offline


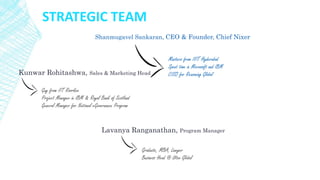

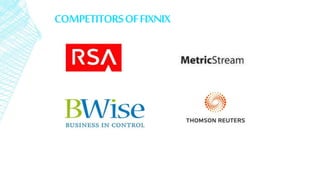

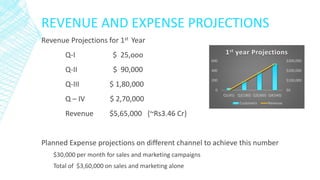


The document provides information about Fixnix Infosec Solutions, a cybersecurity company. It summarizes Fixnix's vision, mission, strategic team members, clients, competitors, and revenue projections for their first year after receiving $250,000 in funding. Key details include their goal to be a top governance, risk and compliance company globally, serve small and medium enterprises, and project $5.65 lakh in first year revenue and profit after funding.


