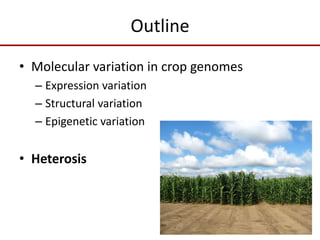
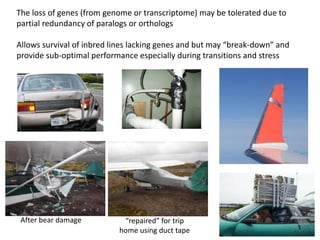
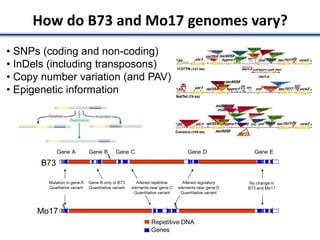
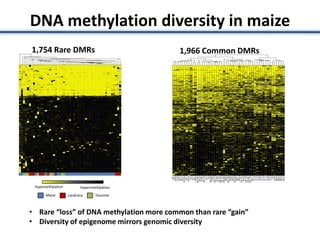
Variation in crop genomes and heterosis
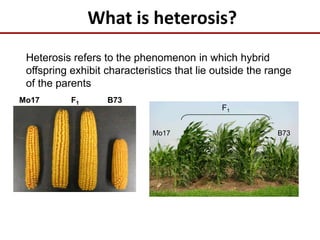
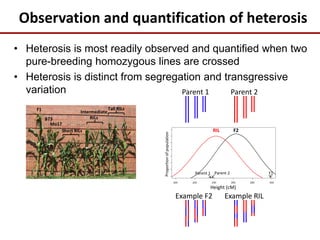
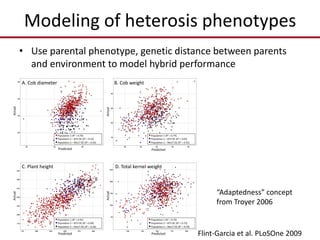
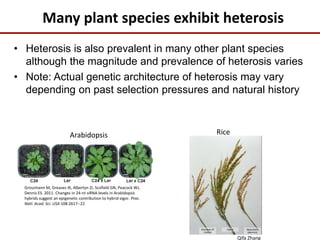
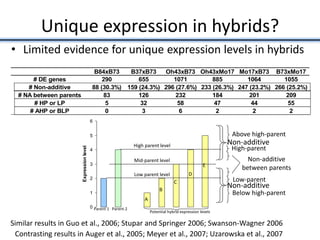
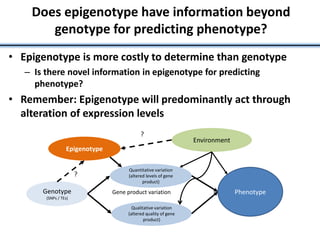
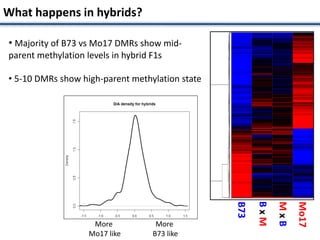
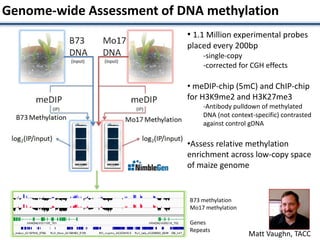
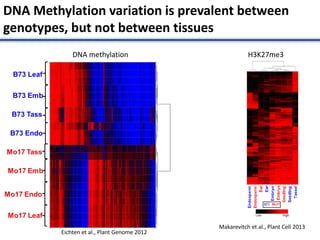
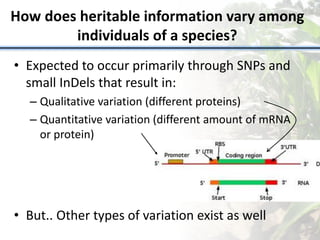
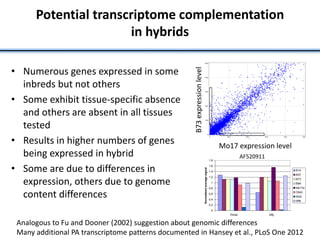
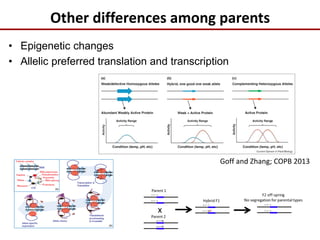
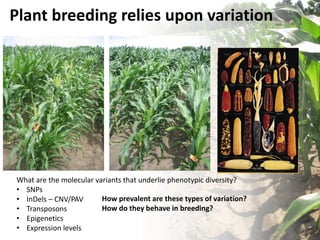
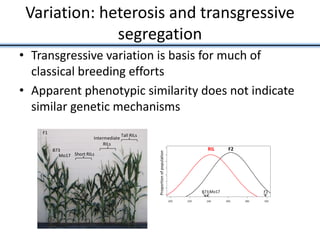
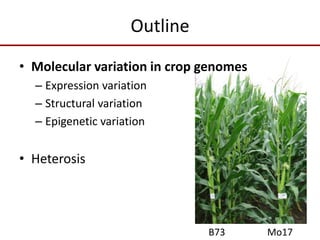
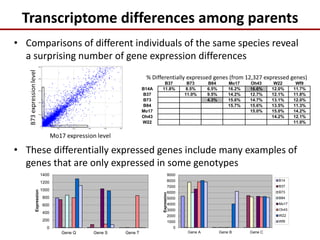
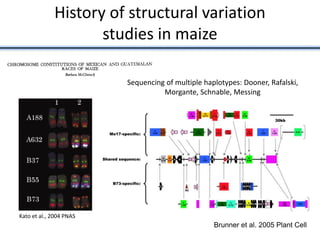
This document discusses sources of genetic variation in crop genomes including single nucleotide polymorphisms, insertions/deletions, transposons, epigenetics, and expression level differences. It explores how prevalent these types of variation are and how they behave in plant breeding. The document also discusses heterosis, or hybrid vigor, and how transgressive segregation contributes to phenotypic diversity. Molecular mechanisms underlying heterosis like dominance, overdominance, and gene expression levels in hybrids are examined. While many genes are expressed at mid-parent levels in hybrids, some are uniquely present or expressed. The potential role of improved gene interactions restoring proper developmental transitions and stress responses in hybrids is proposed.

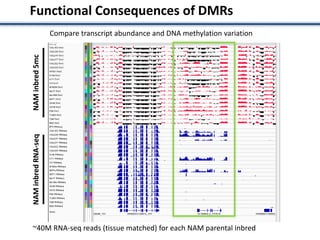
![• Identified nearest genes to each DMR (2,375 genes within 10kb of DMR) and
assessed correlation with transcript abundance
•277 (of 2,375 tested) had a significant (q<0.01) negative correlation with
expression [53 genes exhibited a positively correlation]
•No significant GO enrichments; many genes lack syntenic orthologs in other
species (TEs or novel genes)
• ~0.7% of all genes expression associated with nearby DNA methylation variation
Functional Consequences of DMRs
Qualitative association Quantitative association](https://image.slidesharecdn.com/springernathan-161104180656/85/Variation-in-crop-genomes-and-heterosis-17-320.jpg)