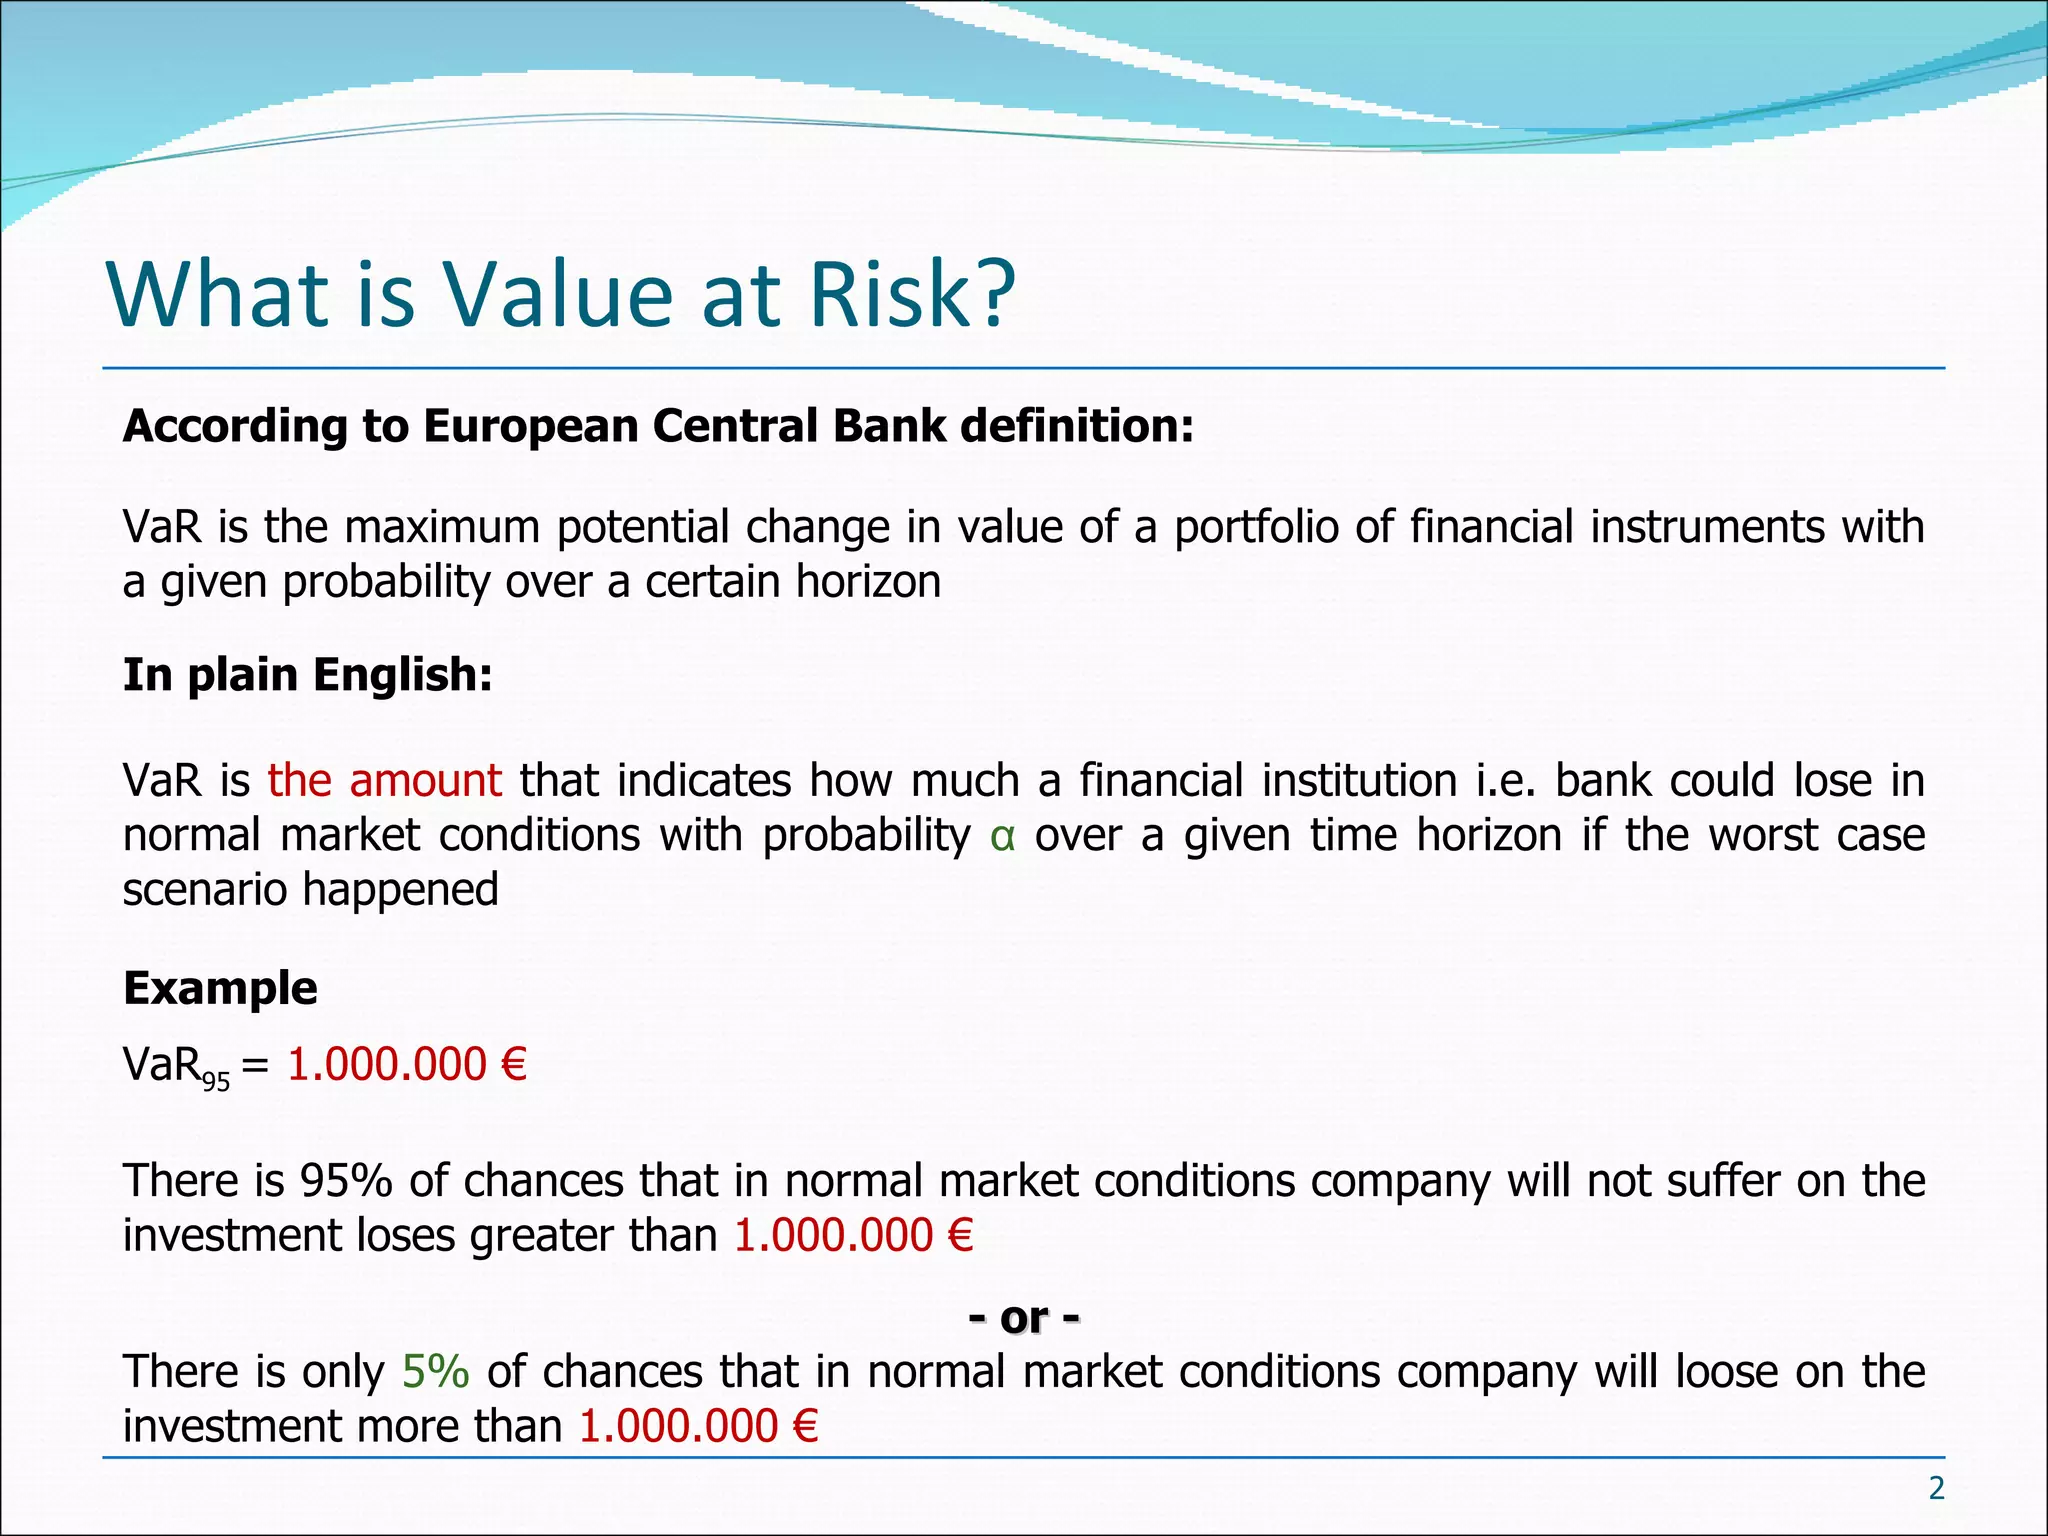
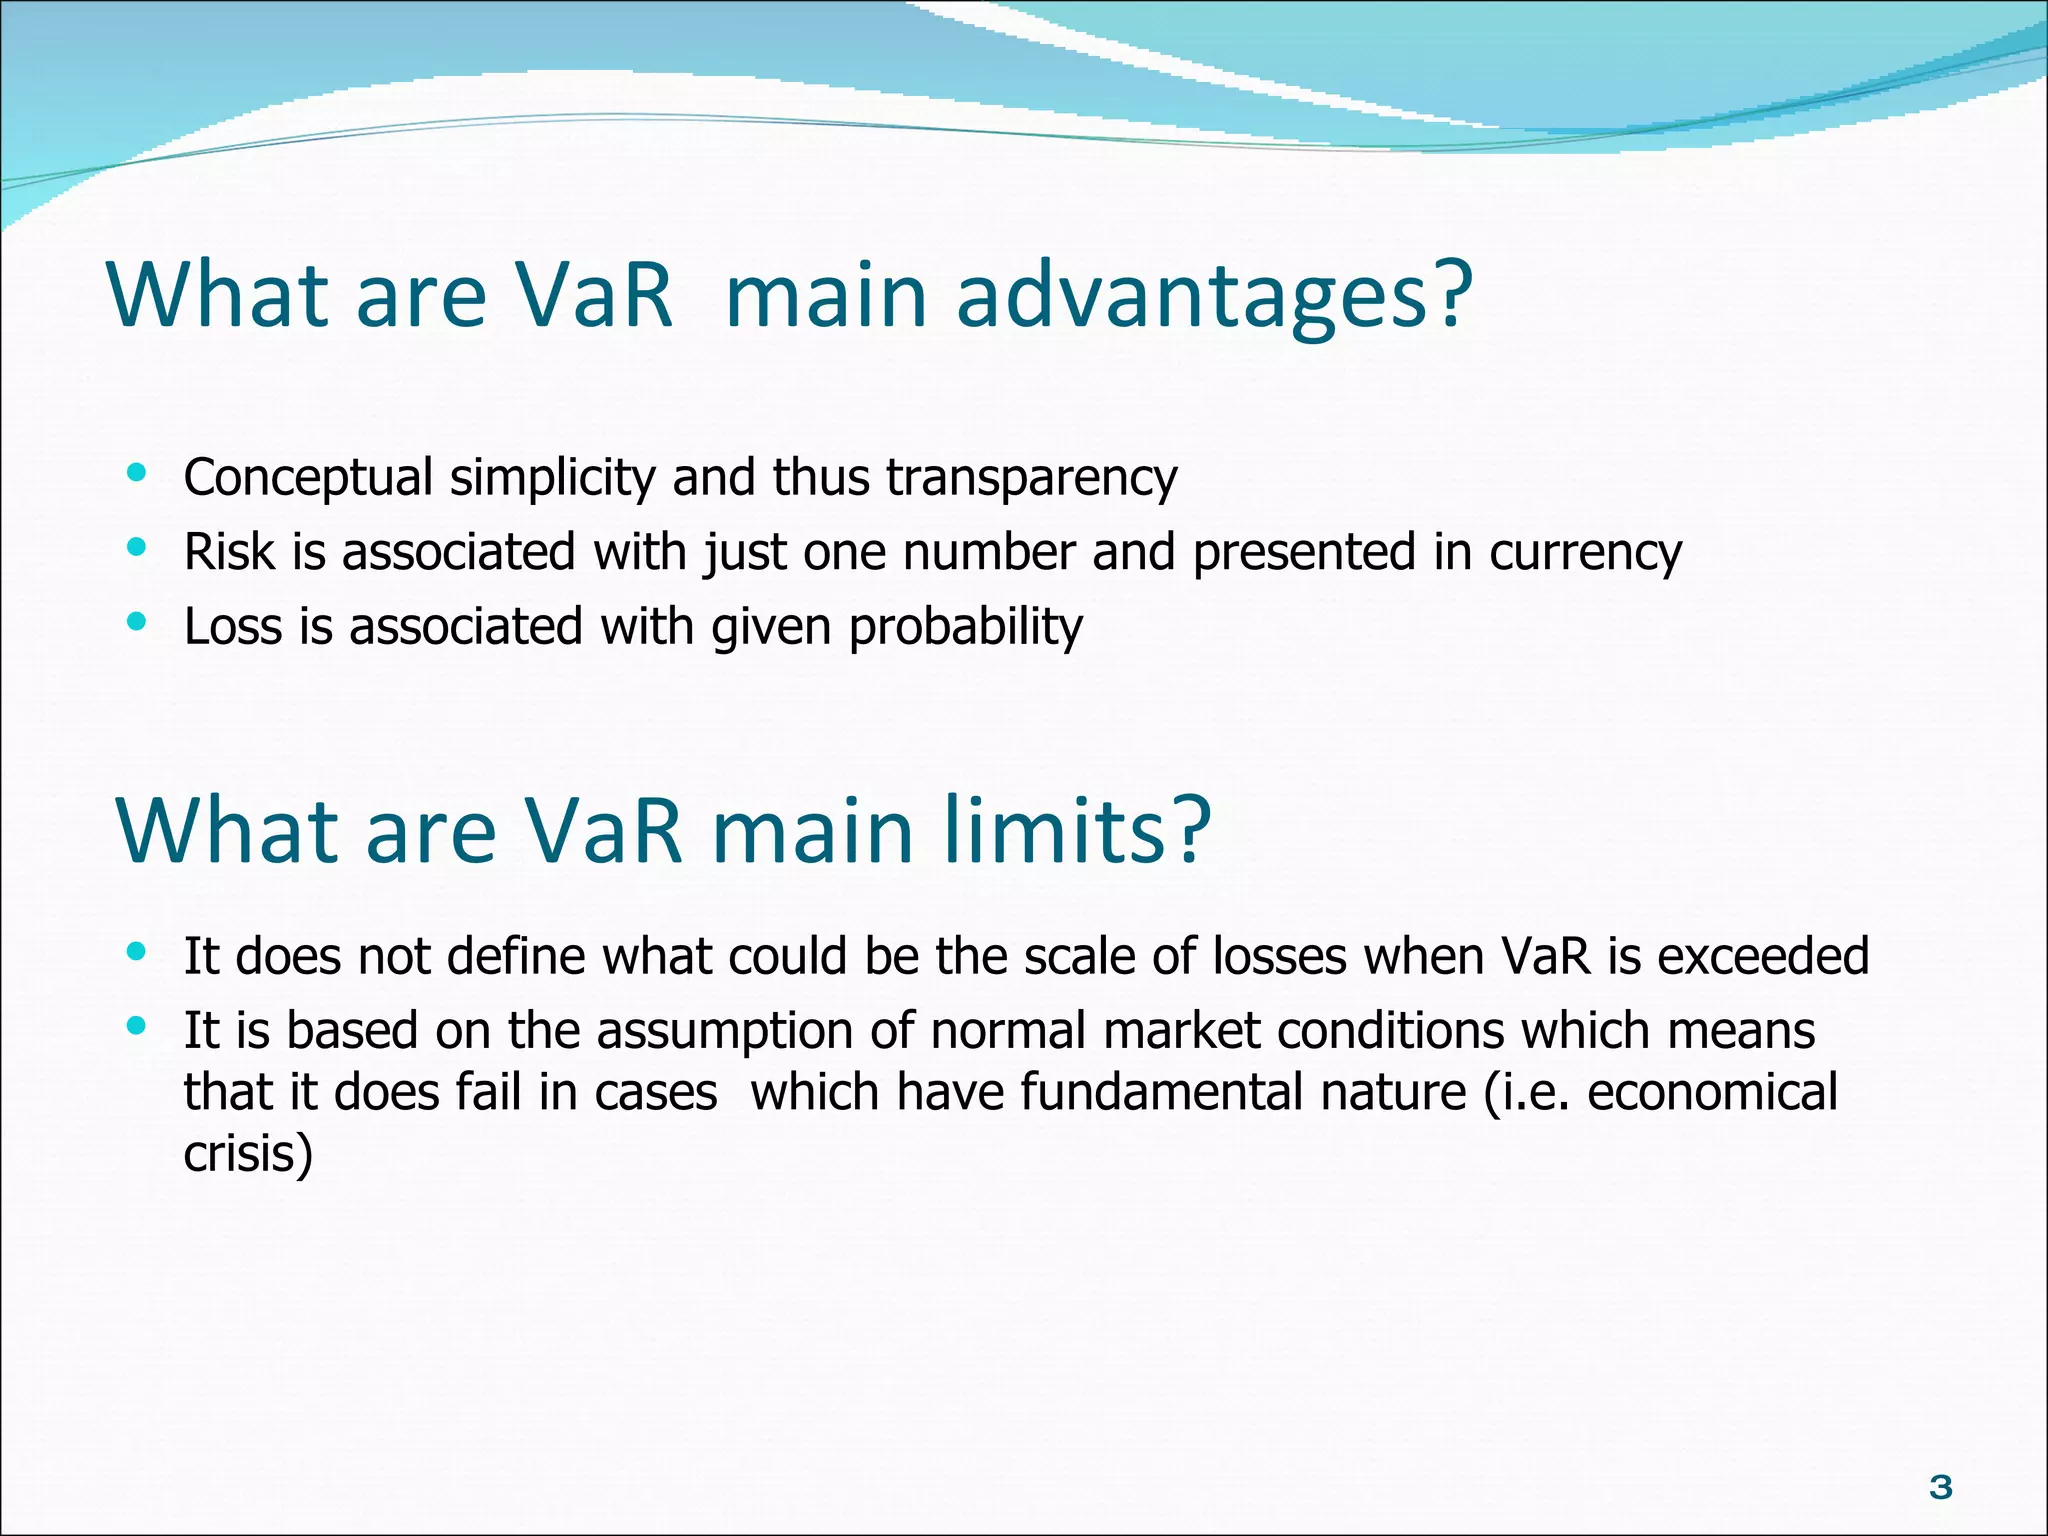
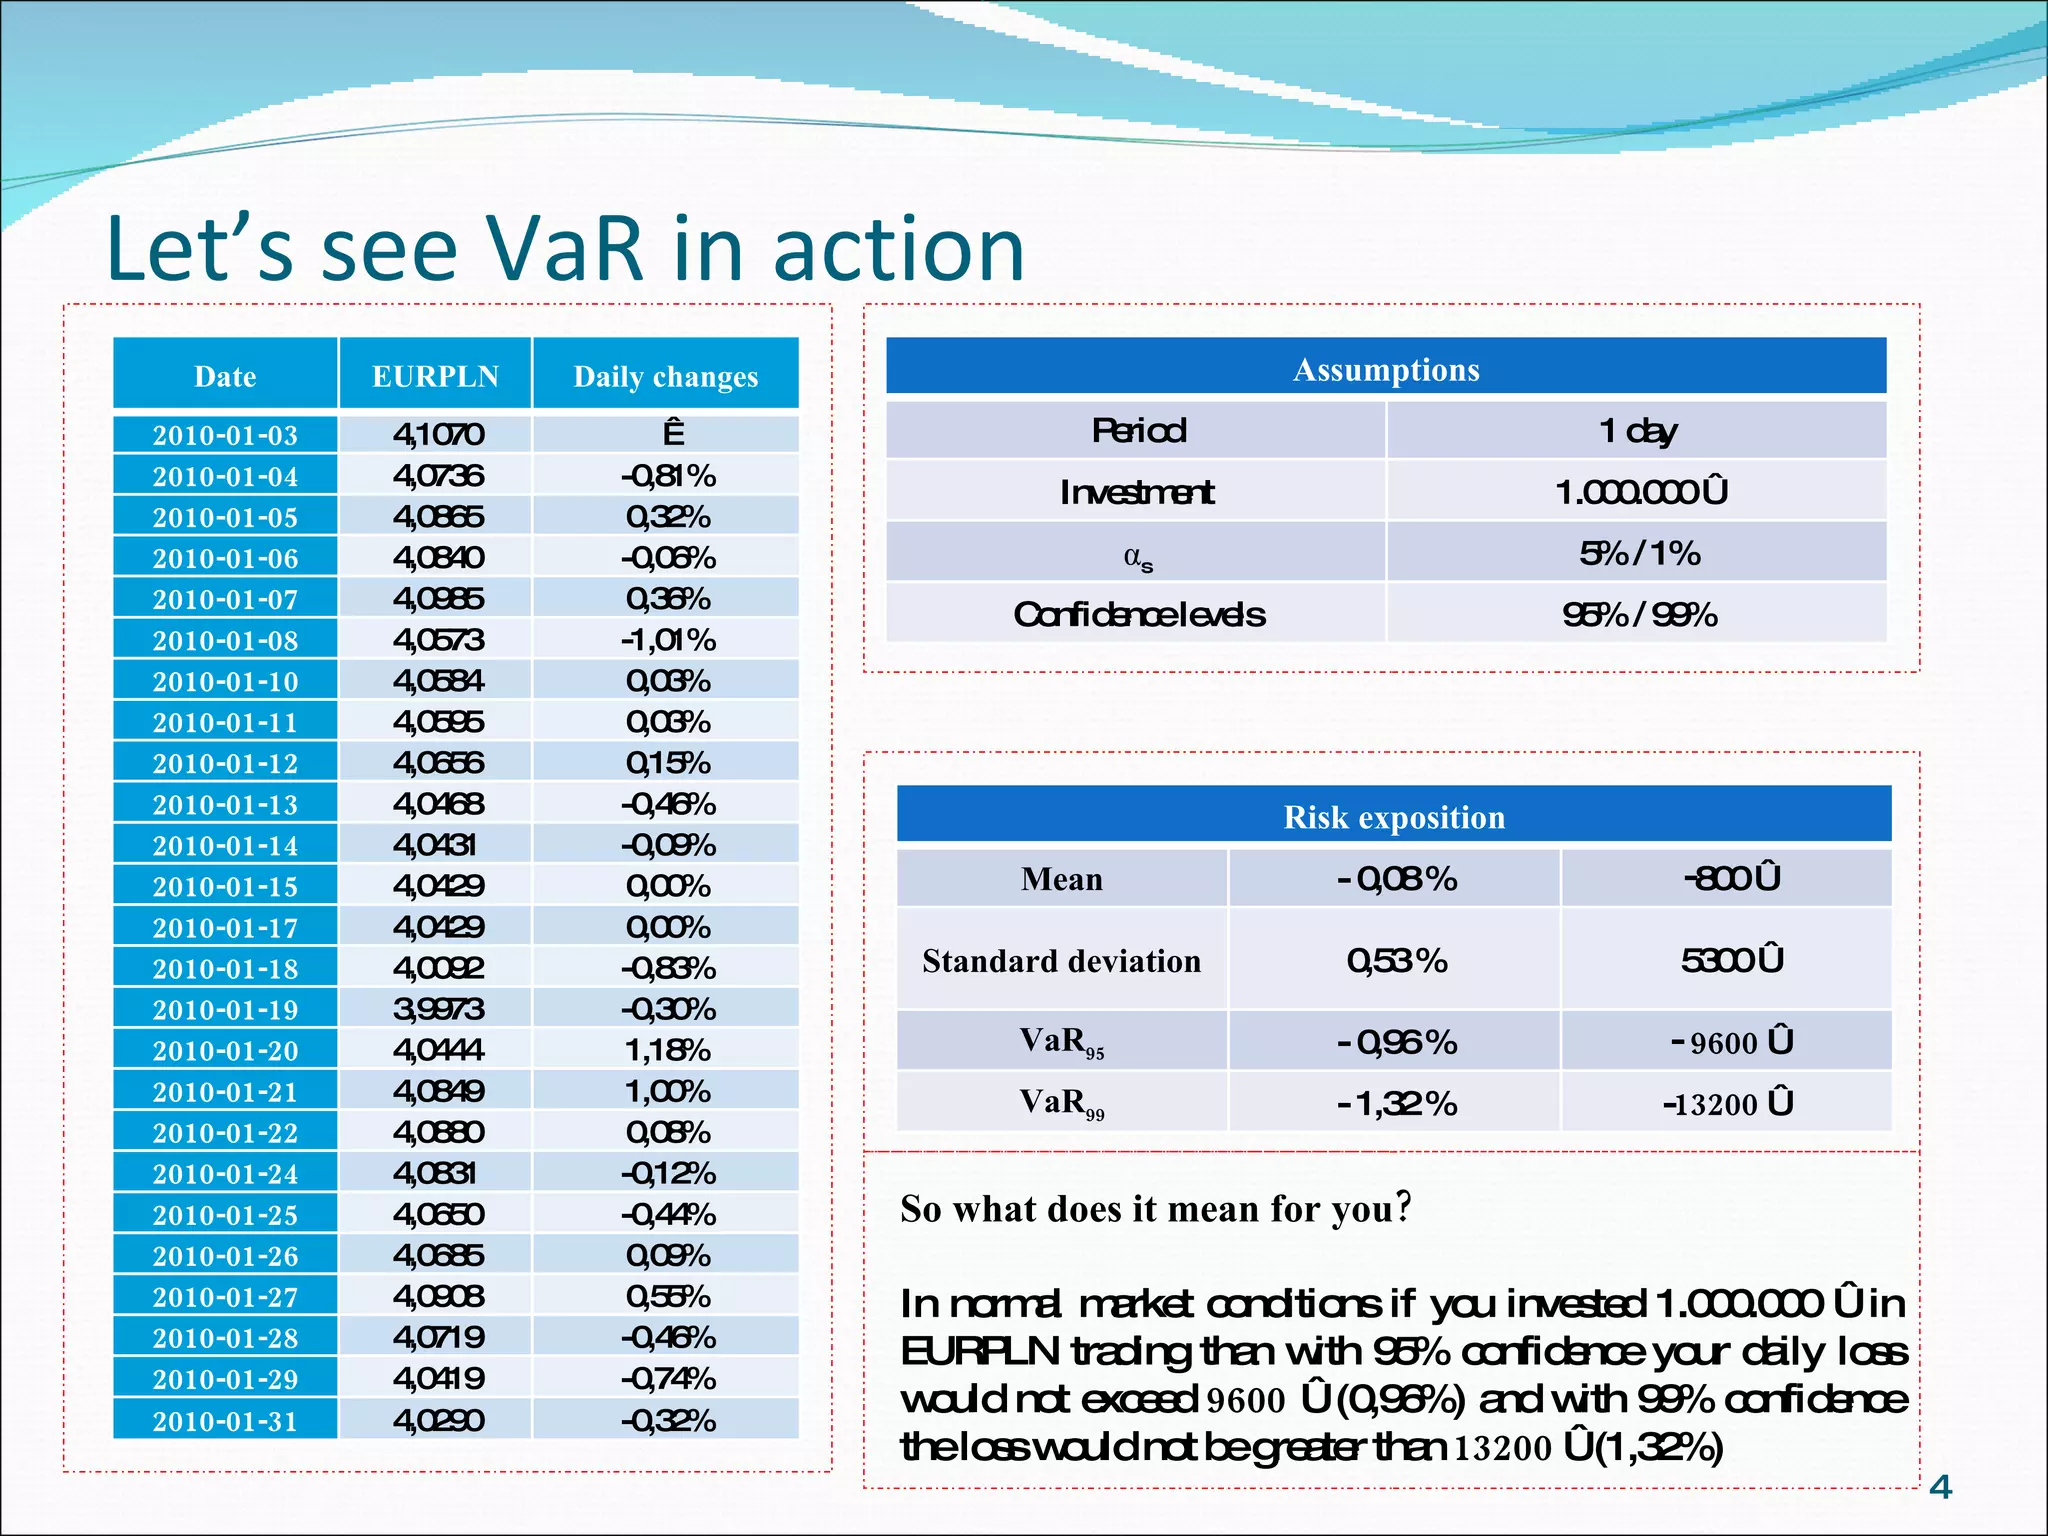
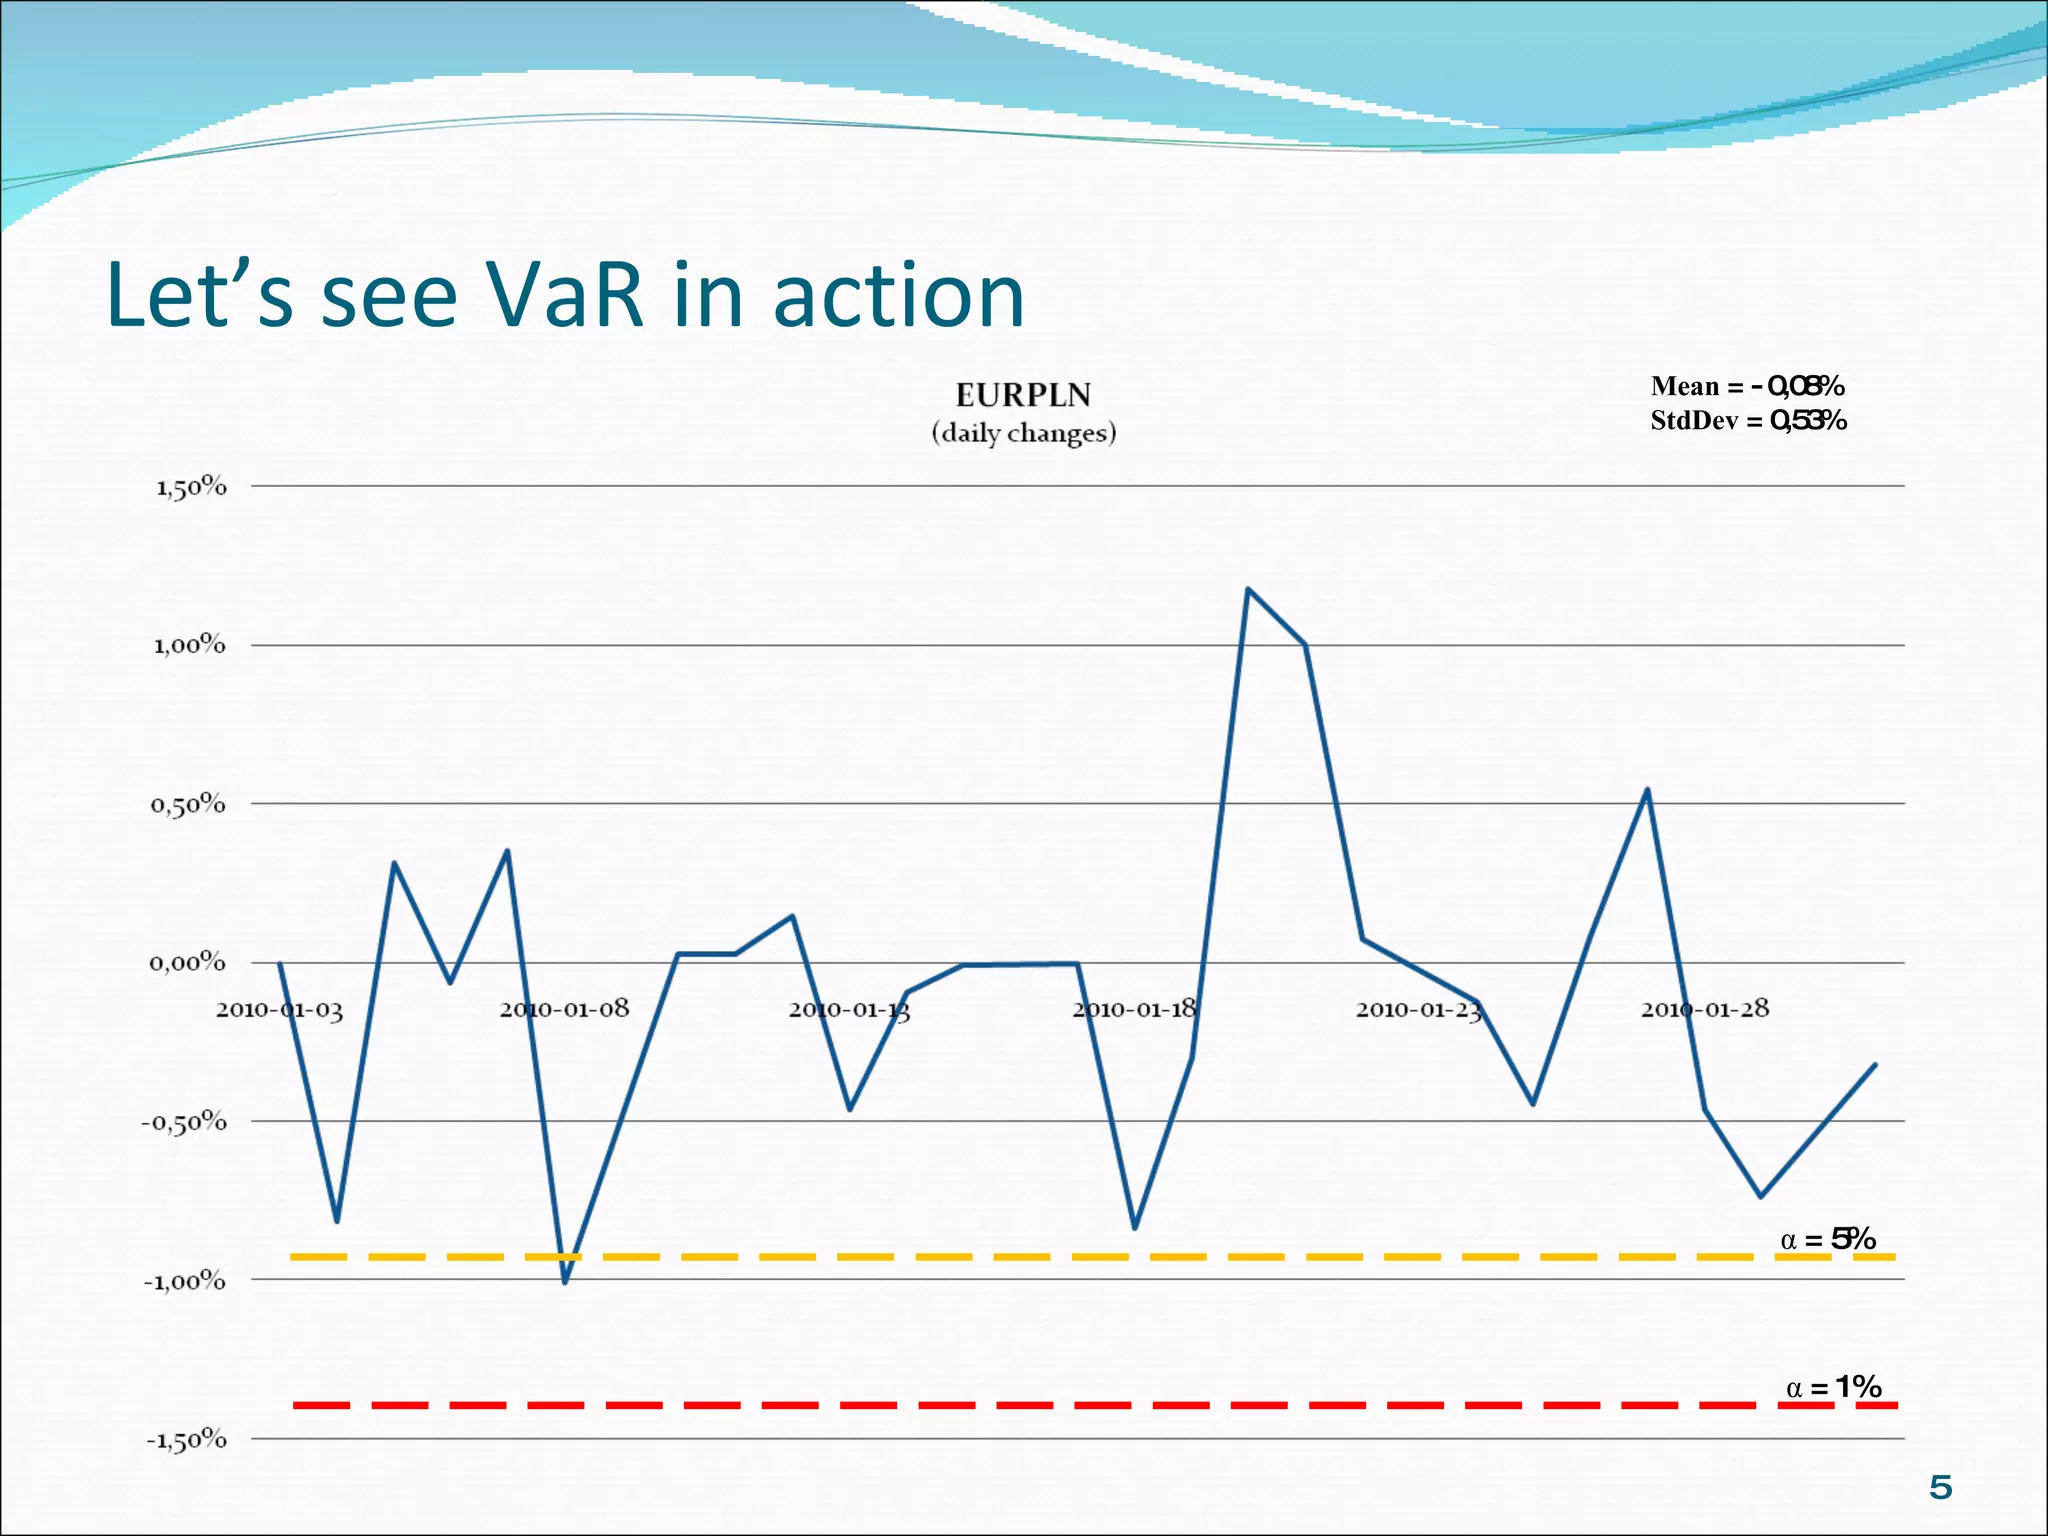
Everest-Stone
What is Value at Risk? According to European Central Bank definition: VaR is the maximum potential change in value of a portfolio of financial instruments with a given probability over a certain horizon In plain English: VaR is  the amount  that indicates how much a financial institution i.e. bank could lose in normal market conditions with probability  α  over a given time horizon if the worst case scenario happened Example VaR 95  =  1.000.000 € There is 95% of chances that in normal market conditions company will not suffer on the investment loses greater than  1.000.000 € - or - There is only  5%  of chances that in normal market conditions company will loose on the investment more than  1.000.000 €
What are VaR  main advantages? Conceptual simplicity and thus transparency Risk is associated with just one number  and  presented in currency Loss is associated with given probability What are VaR main limits? It does not define what could be the scale of losses when VaR is exceeded It is based on the assumption of normal market conditions which means that it does fail in cases  which have fundamental nature (i.e. economical crisis)
Let’s see  VaR  in action So what does it mean for you? In normal market conditions if you invested 1.000.000 € in EURPLN trading than with 95% confidence your daily loss would not exceed  9600  € (0,96%) and with 99% confidence the loss  would  not be greater than  13200  € (1,32%) Date EURPLN Daily changes 2010-01-03 4,1070   2010-01-04 4,0736 -0,81% 2010-01-05 4,0865 0,32% 2010-01-06 4,0840 -0,06% 2010-01-07 4,0985 0,36% 2010-01-08 4,0573 -1,01% 2010-01-10 4,0584 0,03% 2010-01-11 4,0595 0,03% 2010-01-12 4,0656 0,15% 2010-01-13 4,0468 -0,46% 2010-01-14 4,0431 -0,09% 2010-01-15 4,0429 0,00% 2010-01-17 4,0429 0,00% 2010-01-18 4,0092 -0,83% 2010-01-19 3,9973 -0,30% 2010-01-20 4,0444 1,18% 2010-01-21 4,0849 1,00% 2010-01-22 4,0880 0,08% 2010-01-24 4,0831 -0,12% 2010-01-25 4,0650 -0,44% 2010-01-26 4,0685 0,09% 2010-01-27 4,0908 0,55% 2010-01-28 4,0719 -0,46% 2010-01-29 4,0419 -0,74% 2010-01-31 4,0290 -0,32% Assumptions Period 1 day Investment 1.000.000 € α s 5% / 1% Confidence levels 95% / 99% Risk exposition Mean - 0,08 % 800 € Standard deviation 0,53 % 5300 € VaR 95 - 0,96 % 9600  € VaR 99 - 1,32 % - 13200  €
Let’s see  VaR  in action α  = 5% α  = 1% Mean  = - 0,08% StdDev  = 0,53%
Value at Risk

Value at Risk

  • 1.
  • 2.
    What is Valueat Risk? According to European Central Bank definition: VaR is the maximum potential change in value of a portfolio of financial instruments with a given probability over a certain horizon In plain English: VaR is the amount that indicates how much a financial institution i.e. bank could lose in normal market conditions with probability α over a given time horizon if the worst case scenario happened Example VaR 95 = 1.000.000 € There is 95% of chances that in normal market conditions company will not suffer on the investment loses greater than 1.000.000 € - or - There is only 5% of chances that in normal market conditions company will loose on the investment more than 1.000.000 €
  • 3.
    What are VaR main advantages? Conceptual simplicity and thus transparency Risk is associated with just one number and presented in currency Loss is associated with given probability What are VaR main limits? It does not define what could be the scale of losses when VaR is exceeded It is based on the assumption of normal market conditions which means that it does fail in cases which have fundamental nature (i.e. economical crisis)
  • 4.
    Let’s see VaR in action So what does it mean for you? In normal market conditions if you invested 1.000.000 € in EURPLN trading than with 95% confidence your daily loss would not exceed 9600 € (0,96%) and with 99% confidence the loss would not be greater than 13200 € (1,32%) Date EURPLN Daily changes 2010-01-03 4,1070   2010-01-04 4,0736 -0,81% 2010-01-05 4,0865 0,32% 2010-01-06 4,0840 -0,06% 2010-01-07 4,0985 0,36% 2010-01-08 4,0573 -1,01% 2010-01-10 4,0584 0,03% 2010-01-11 4,0595 0,03% 2010-01-12 4,0656 0,15% 2010-01-13 4,0468 -0,46% 2010-01-14 4,0431 -0,09% 2010-01-15 4,0429 0,00% 2010-01-17 4,0429 0,00% 2010-01-18 4,0092 -0,83% 2010-01-19 3,9973 -0,30% 2010-01-20 4,0444 1,18% 2010-01-21 4,0849 1,00% 2010-01-22 4,0880 0,08% 2010-01-24 4,0831 -0,12% 2010-01-25 4,0650 -0,44% 2010-01-26 4,0685 0,09% 2010-01-27 4,0908 0,55% 2010-01-28 4,0719 -0,46% 2010-01-29 4,0419 -0,74% 2010-01-31 4,0290 -0,32% Assumptions Period 1 day Investment 1.000.000 € α s 5% / 1% Confidence levels 95% / 99% Risk exposition Mean - 0,08 % 800 € Standard deviation 0,53 % 5300 € VaR 95 - 0,96 % 9600 € VaR 99 - 1,32 % - 13200 €
  • 5.
    Let’s see VaR in action α = 5% α = 1% Mean = - 0,08% StdDev = 0,53%