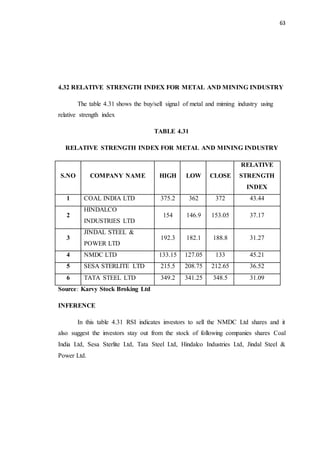
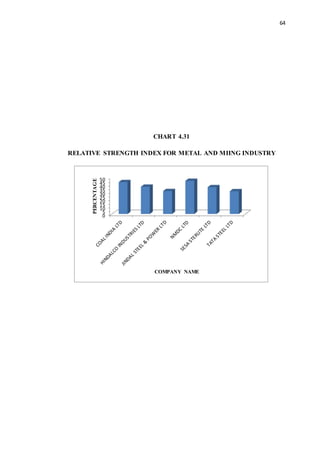
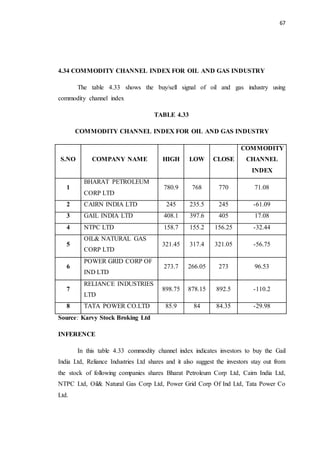
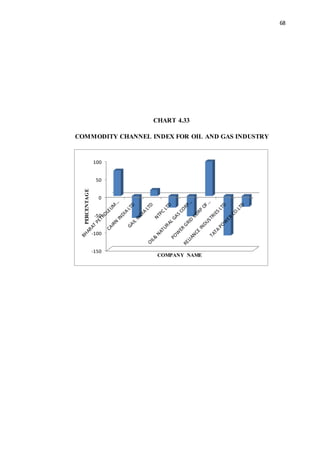
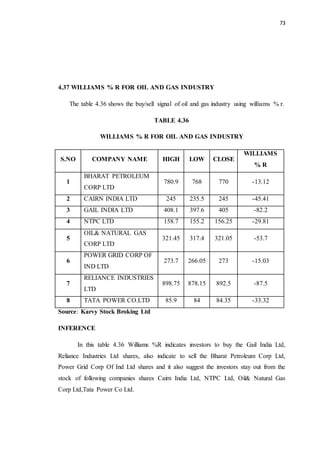
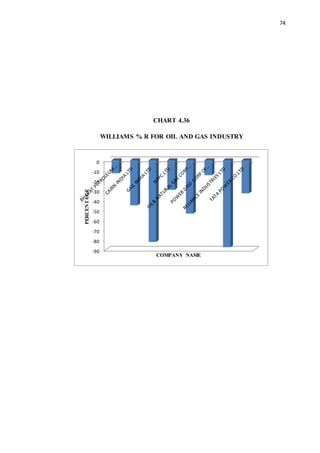
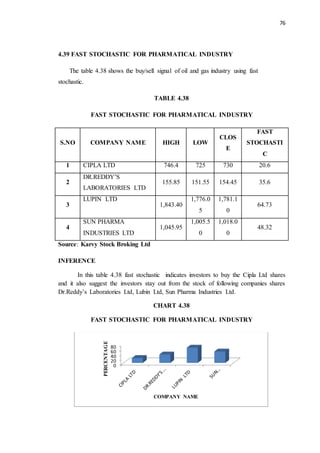
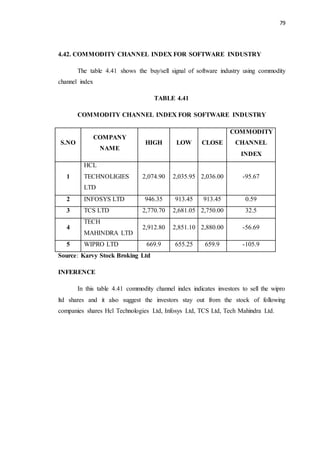
1
CHAPTER 1
INTRODUCTION AND DESIGN OF THE STUDY
1.1 INTRODUCTION
Technical analysis is a method of evaluating securities by analyzing the
statistics generated by market activity, such as past prices and volume.
Technical analysis do not attempt to measure a security’s intrinsic value, but
instead of use charts and other tool to identify patterns that can suggest future
activity. Just as there are many investment styles on the fundamental side, there
are also many different type of technical traders. Some rely on chart patterns;
others use technical indicators and oscillators, and most use some combination
of the two. In any case, technical analysts exclusive use of historical price and
volume data is what separates them from their fundamental counterparts. Unlike
fundamental analysts, technical analysts don’t care whether a stock is
undervalued –the only thing that matters is a security’s past trading data and
what information this data can provide about where the security might move in
the future.
Technical analysis mainly seeks to predict the short term price travels. It
is important criteria for selecting the company to invest. It also provides the
base for decision making in investment. The one of the most frequently used
yardstick to check & analyze underlying price progress. For that matter a
variety of tools was consider. This technical analysis is helpful to general
investor in many ways. It provides important and vital information regarding
the current position of the company.
Technical analysis involves the use of various methods for charting,
calculating, and interpreting graph and chart to assess the performances and
status of the price. It is the tool of financial analysis, which not only studies but
also reflecting the numerical and graphical relationship between the important
financial factors.
The focus of technical analysis is mainly on the internal market data,
i.e., prices and volume data. It appeals mainly to short term traders. It’s the
oldest approach to equity investment dating back to the late 19th century. It uses
2
chart and computer programs to study the stock’s trading volume and price
movements in the hope of identifying a trend.
1.2 STATEMENT OF PROBLEM
In the current scenario, technical analysis plays a vital role in online
trading. It is widely used among traders and financial professionals, and is very
often used by active day traders, market makers, and pit traders. Some rely on
chart patterns; other use technical indicators and oscillators, and most use some
combination of the two. It appeals mainly to short term traders by providing
information on the best entry and exit points for a trade. Frequent fluctuations in
the share market makes difficult to predict the stock price movements. with the
help of 4 technical indicators , RSI, Commodity Channel Index, Williams % R
and Fast Stochastic, the researcher shows effective analysis on the market share
price movements. The researcher selected this topic to create awareness among
the investors and traders regarding the technical indicator to make profitable
investment in future.
1.3 OBJECTIVE OF THE STUDY
 To analyze the perfectness of the indicators on nifty scrip.
 To study the different guidance variation by using different
indicator.
1.4 REVIEW LITERATURE
Taylor and Allen1 in their paper titled, “The Use of Technical Analysis
in the foreign Exchange Market” conducted a UK survey of forex dealers on behalf
of the bank of England, ad found that at least 90% of the respondents placed some
weight on technical analysis for decision making. It has been suggested that due to
its high usage , technical analysis may, in fact, be becoming a self-fulfilling
methodology. In other words, if enough people follow the principles, then those
principles can be expected to become manifest in the character of price time series.
To complete the discussion regarding technical analysis, it is occasionally stated
that as technical rules become more widely known, the abnormal returns they
attempt to identify will be reduced and the usefulness of the technical rule itself
will be destroyed.
3
Fama. E2 in his paper titled “The Behaviour of Stock Market Prices”
explained that the random-walk theory has held sway. This theory state that successive
price changes in stock price are independent, identically distributed random variables.
The important implication of this hypothesis is that it implies that a series of price
changes has no memory, which further implies that the study of past prices
cannot provide useful contribution to predicting future prices. As the majority of
technical analysis focuses on forecasts based on past price behavior , the natural
conclusion is that Technical Analysis cannot work.
Levich and Thomas3 in their paper titled “ The significance of Technical
Trading Rule Profits in the Foreign Exchange Markets” A Bootstrap approach
examined currency futures contracts in five currencies over the period 1976 to 1990.
They report persistent trading profits over the 15 year period using a variety of
commonly reached moving average rules. Levich and Thomas concluded “the
profitability of trend following rules strongly suggest some form of serial dependency
in the data, but the nature of the dependency remains unclear”.
Fern`andez- rodr`iguez, Gonz` alez-Martel and Sosvilla-Rivero4 in their
project titled “Profitability of Technical Trading Rules Based on Artificial Neural
Networks” Evidence from the Madrid Stock Market: reviewed that in the absence of
trading costs, the technical trading rule is always superior to a buy and hold strategy for
both ‘bear’ market and ‘stable’ market episodes, but not in a ‘bull’ market. One critism
they have is that beating the market in the absence of costs seems of little significance
unless one is interested in finding a signal which will later be incorporated into a full
system. Secondly, it is perhaps naïve to work on the premise that ‘bull’ and ‘bear’
markets exist.
Jenni L.Bettman, Stephen J.Sault, Emma L.Schultz5 in their paper titled
“Applying Fundamental Analysis and Neural Networks in the Australian
Stock market” reviewed although the fundamental and technical analysis literatures
invest considerable effort in assessing their respective ability to explain share price,
they invariably do so without reference to each other. In this context, they propose an
equity valuation model integrating both fundamental and technical analysis and in
doing so, recognize their potential as complements rather than as substitutes. Testing
4
confirms the complementary nature of fundamental and technical analysis by showing
that, although each performs well in isolation, models integrating both have superior
explanatory power. While their findings relate to the valuation of shares, they also have
implications for other valuation exercises.
1.5 SCOPE OF THE STUDY
 In current scenario technical analysis is a proven method for stock trading.
 This study is confined only to the indicators analysis of technical analysis
 The study focuses on the technical analysis to participate in the investment
decision.
 The buy / sell signals are generated by the indicators based on the volume,
trend, oscillation and volatility.
1.6 LIMITATION OF THE STUDY
 The indicators analysis has been used to identify only the nifty shares.
 Too much of fluctuations in the share price.
 More importance as been given to the subject matter of technical analysis
only.
 The wide range of chart-patterns and trends may create confusion while
going through these.
1.7 RESEARCH METHODOLOGY
1.7.1 RESEARCH DESIGN
The research design is Analytical Research. It includes surveys and fact –
finding enquiries of different kinds. The major purpose of descriptive research is
description of the state of affairs as it exists at present.
1.7.2 DATA COLLECTION
The data collection is done through the Secondary Data. It means data are
collected from internet, daily news papers, television, and magazines and so on.
5
1.7.3 TOOLS USED
1. Williams %R
2. Commodity Channel Index [CCI]
3. Relative Strength Index [RSI]
4. Stochastic Oscillator [Fast]
1.8 CHAPTERIZATION
The project title “ A STUDY ON TECHNICAL ANALYSIS ON NIFTY
SCRIP USING TECHNICAL INDICTORS WITH SPECIAL REFERENCE TO
KARVY STOCK BROKING LIMIED.” The report is organized into five chapters as
mentioned below.
Chapter-1
It consists of Introduction, Statement of problem, Objectives of the study,
review of literature, Scope of the study, Limitation of the study, Research
methodology, and Chapterisation
Chapter-2
It consists of Industry profile and company profile.
Chapter-3
It consists of theoretical view of technical analysis.
Chapter-4
It present the Data analysis and Interpretation.
Chapter-5
It consists of Findings ,Suggestions, and Conclusion.
6
FOOD NOTES
1.Taylor, M.P. and H. Allen, “The use of Technical Analysis in the Foreign Exchange
Market,” Journal of International Money and Finance, Volume 11, 1992, Pp.304-314
2.Fama,E., “The Behaviour of Stock Market Prices,” Journal of Business, volume 11,
1992,Pp . 34-105
3.Fern`Andez- Rodr`Iguez, Fernando,. “Profitability of Technical Trading Rules
based on Artificial Neural Networks: Evidence from the Madrid stock market.”
Economic Letters ,Volume 69(1), 2000Pp. 89-94.
4.Levich, R. and L.Thomas, “The significance of Technical Trading Rule Profits in
the Foreign Exchange Market: A Bootstrap Approach, Journal of International Money
and Finance, Volume 12, 1993 Pp .451-474.
5.Jenni L.Bettman, Stephen j.Sault , Emma L. Schultz, “Applying Fundamental
Analysis and Neural Networks in the Australian Stock market” . International
Conference on Artificial Intelligence in Science and Technology (AISAT) September
2008.
7
CHAPTER – 2
INDUSTRIAL PROFILE & COMPANY PROFILE
2.1 INDUSTRIAL PROFILE
2.1.1 INTRODUCTION
A Stock brokerage firm, or simply brokerage, is a financial institution that
facilitates the buying and selling of financial securities between a buyer and a seller.
Brokerage firms serve a clientele of investors who trade public stocks and other
securities, usually through the firm's agent stockbrokers. A traditional, or "full service,"
brokerage firm usually undertakes more than simply carrying out a stock or bond trade.
The staff of this type of brokerage firm is entrusted with the responsibility of
researching the markets to provide appropriate recommendations and in so doing they
direct the actions of pension fund managers and portfolio managers alike. These firms
also offer margin loans for certain approved clients to purchase investments on credit,
subject to agreed terms and conditions. Traditional brokerage firms have also become a
source of up-to-date stock prices and quotes.
The Securities Brokerage Industry is cyclical and comprised of two distinct types
of business. Brokerages, also known as financial services companies, strive to meet the
investing needs of their clients, and exchanges facilitate securities trading. Net profits
correlate to the performance of the broader equity market. Some hold up better than
their peers during bear markets.
2.1.2 EVOLUTION OF SHARE MARKET INDUSTRY
The stock markets in India are one of the oldest in the world and have a strong
presence and network of domestic and local intermediaries. Owing to the high
incidence of indigenous equity broking, India got a Native Share Brokers’ Association
as early as 1875; this association later came to be known as the Bombay Stock
Exchange (BSE). In 1864, there were more than 1,000 brokers in Mumbai who traded
in stocks; high premium was also a familiar concept during that time. One of the
earliest stock market booms that occurred in 1860s after the American Civil War led to
8
the creation of many joint stock cotton/ginning mills and this phenomena stirred an
equity culture that saw share prices touch stratospheric levels.
In the 1970s the Foreign Exchange Regulation Act (FERA) was introduced that
encouraged multinational companies to divest their foreign equity; this phenomenon
gave a fresh impetus to retail investing.
The Securities and Exchange Board of India (SEBI), which was set up in 1988
as an administrative arrangement, was given statutory powers after the enactment of
the SEBI Act in 1992. The main function of SEBI was to protect investor interests in
securities, to promote the development of securities markets and to regulate the
securities markets.
Early Years
The equity brokerage industry in India is one of the oldest in the Asia region.
India had an active stock market for about 150 years that played a significant role in
developing risk markets as also promoting enterprise and supporting the growth of
industry.The roots of a stock market in India began in the 1860s during the American
Civil War that led to a sudden surge in the demand for cotton from India resulting in
setting up of a number of joint stock companies that issued securities to raise finance.
This trend was akin to the rapid growth of securities markets in Europe and the North
America in the background of”.
A unique feature of the stock market development in India was that that it was
entirely driven by local enterprise, unlike the banks which during the pre-independence
period were owned and run by the British. Following the establishment of the first
stock exchange in Mumbai, other stock exchanges came into being in major cities in
India, namely Ahmedabad (1894), Calcutta (1908), Madras (1937), Uttar Pradesh and
Nagpur (1940) and Hyderabad (1944). The stock markets gained from surge and boom
in several industries such as jute (1870s), tea (1880s and 1890s), coal (1904 and 1908)
etc, at different points of time.
9
Beginning of a new equity culture
A new phase in the Indian stock markets began in the 1970s, with the
introduction of Foreign Exchange Regulation Act (FERA) that led to divestment of
foreign equity by the multinational companies, which created a surge in retail
investing. The early 1980s witnessed another surge in stock markets when major
companies such as Reliance accessed equity markets for resource mobilization that
evinced huge interest from retail investors.
Rapid Growth
The last decade has been exceptionally good for the stock markets in India. In
the back of wide ranging reforms in regulation and market practice as also the growing
participation of foreign institutional investment, stock markets in India have showed
phenomenal growth in the early 1990s. The stock market capitalization in mid-2007 is
nearly the same size as that of the gross domestic product as compared to about 25
percent of the latter in the early 2000s. Investor base continued to grow from domestic
and international markets. The value of share trading witnessed a sharp jump too.
2.1.3 FINANCIAL MARKET
Capital Market
The capital market is a market for financial assets which have a long or
indefinite maturity. Generally, it deals with long term securities which have a period of
above one year. In the widest sense, it consists of a series of channels through which
the savings of the community are made available for industrial and commercial
enterprises and public authorities.
Capital market consists of primary market and secondary market.
• Primary market
Primary market is a market for new issues or new financial claims. Hence it is
also called as New Issue Market. It basically deals with those securities which are
issued to the public for the first time. The market, therefore, makes available a new
block of securities for public subscription. In other words, it deals with raising of fresh
10
capital by companies either for cash or for consideration other than cash. The best
example could be Initial Public Offering (IPO) where a firm offers shares to the public
for the first time.
• Secondary market:
Secondary market is a market where existing securities are traded. In other
words, securities which have already passed through new issue market are traded in
this market. Generally, such securities are quoted in the stock exchange and it provides
a continuous and regular market for buying and selling of securities. This market
consists of all stock exchanges recognized by the government of India.
Money Market
Money markets are the markets for short-term, highly liquid debt securities.
Money market securities are generally very safe investment and relatively low interest
rate that is most appropriate for temporary cash storage or short term time needs.
It consists of a number of sub-markets which collectively constitute the money market
namely call money market, commercial bills market, acceptance market, and Treasury
bill market.
Derivatives Market
The derivatives market is the financial market for derivatives, financial
instruments like futures contracts or options, which are derived from other forms
of assets. A derivative is a security whose price is dependent upon
or derived from one or more underlying assets. The derivative itself is merely a
contract between two or more parties. Its value is determined by fluctuations in the
underlying asset. The important financial derivatives are the following:
Forwards:
Forwards are the oldest of all the derivatives. A forward contract refers to an
agreement between two parties to exchange an agreed quantity of an asset for cash at a
certain date in future at a predetermined price specified in that agreement. The
promised asset may be currency, commodity, instrument etc.
11
Futures:
Future contract is very similar to a forward contract in all respects excepting the
fact that it is completely a standardized one. It is nothing but a standardized forward
contract which is legally enforceable and always traded on an organized exchange.
Options:
A financial derivative that represents a contract sold by one party(option writer)
to another party (option holder). The contract offers the buyer the right, but not the
obligation, to buy (call) or sell (put) a security or other financial asset at an agreed-
upon price (the strike price) during a certain period of time or on a specific date
(exercise date). Call options give the option to buy at certain price, so the buyer would
want the stock to go up. Put options give the option to sell at a certain price, so the
buyer would want the stock to go down.
Swaps:
It is yet another exciting trading instrument. In fact, it is the combination of
forwards by two counterparties. It is arranged to reap the benefits arising from the
fluctuations in the market – either currency market or interest rate market or any other
market for that matter.
Foreign Exchange Market
It is a market in which participants are able to buy, sell, exchange and speculate
on currencies. The forex market is considered to be the largest financial market in the
world. It is a worldwide decentralized over-the-counter financial market for the trading
of currencies. Because the currency markets are large and liquid, they are believed to
be the most efficient financial markets.
Commodities Market
It is a physical or virtual marketplace for buying, selling and trading raw or
primary products. Commodities are split into two types: hard and soft commodities.
Hard commodities are typically natural resources that must be mined or extracted
12
(gold, rubber, oil, etc.), whereas soft commodities are agricultural products or livestock
(corn, wheat, coffee, sugar, soybeans, pork, etc.)
2.1.4 INDIAN STOCK EXCHANGE
Bombay stock exchange (BSE)
Bombay Stock Exchange is the oldest stock exchange in Asia with a rich
heritage, now spanning three centuries in its 133 years of existence. What is now
popularly known as BSE was established as "The Native Share & Stock Brokers'
Association" in 1875.
Over the past 133 years, BSE has facilitated the growth of the Indian corporate
sector by providing it with an efficient access to resources. There is perhaps no major
corporate in India which has not sourced BSE's services in raising resources from the
capital market.BSE also has a wide range of services to empower investors and
facilitate smooth transactions:
Investor Services: The Department of Investor Services redresses grievances
of investors. BSE was the first exchange in the country to provide an amount of Rs.1
million towards the investor protection fund; it is an amount higher than that of any
exchange in the country. BSE launched a nationwide investor awareness programme-
'Safe Investing in the Stock Market' under which 264 programmes were held in more
than 200 cities. .
The BSE On-line Trading (BOLT): BSE On-line Trading (BOLT) facilitates on-line
screen based trading in securities. BOLT is currently operating in 25,000 Trader
Workstations located across over 450 cities in India
BSEWEBX.com: In February 2001, BSE introduced the world's first centralized
exchange-based Internet trading system, BSEWEBX.com. This initiative enables
investors anywhere in the world to trade on the BSE platform
Surveillance: BSE's On-Line Surveillance System (BOSS) monitors on a real-time
basis the price movements, volume positions and members' positions and real-time
measurement of default risk, market reconstruction and generation of cross market
alerts.
BSE Training Institute: BTI imparts capital market training and certification, in
13
collaboration with reputed management institutes and universities. It offers over 40
courses on various aspects of the capital market and financial sector. More than 20,000
people have attended the BTI programmes.
2.1.5 NATIONAL STOCK EXCHANGE (NSE)
National Stock Exchange (NSE) is considered to be leader in the stock
exchange scenario in terms of the total volume traded. The National Stock Exchange
received the recognition of a stock exchange in July 1993 under Securities Contracts
(Regulation) Act 1956. The products that are traded in the National Exchange are:-
 Equity or Share
 Future (both index and stock )
 Options (Call and put )
 Wholesale Debt Market
 Retail Debt Market
NSE has a fully automated screen based traded system which is known as the
NEAT system. The transactions are carried on with speed, efficiency, and are all
transparent. The risk management system of the National Stock Exchange is world
class and can be considered as the benchmark for other bourses. The leading index of
NSE is known as Nifty 50 or just Nifty. It comprises of 50 diversified benchmark
Indian company scrip and is constructed on the basis of weighted average market
capitalization method.
2.1.6 THE FUNCTION OF EXCHANGES
Exchanges provide a marketplace for traders to buy and sell securities. In
years past, trading took place on large open floors, where buyers and sellers engaged in
face-to-face transactions. Today, most exchanges utilize electronic systems, which
allow for fast, efficient trading. A few still use traditional trading floors, but in
conjunction with an electronic system.
Exchanges generate revenue in several ways. Those that concentrate on the
equities market collect fees from listed companies. Both equity and derivative
exchanges receive a payment for each trade that takes place on their platform. The top
14
lines of these companies perform quite well during volatile markets. Another source of
revenue comes from supplying market data to financial information providers. Too,
revenue may be produced from developing, marketing and distributing technology used
in trading and information processing. Among other means of generating revenue, an
exchange may clear third-party or in-house trades.
This sector of the industry has, indeed, undergone consolidation. Domestic
exchanges have merged with foreign bourses to gain diversification. Also, many have
acquired small competitors that offer attractive market niches complementing existing
operations. For instance, companies that focus on equity trading have expanded the
scope of business by acquiring options exchanges.
2.1.7 TOP 10 BROKING HOUSES
Here we are giving list of India’s top 10 Broking House on base of survey of
investor and trader of many cities. In their views following Broking Houses gives best
and reliable services
1. ICICI direct.com
2. India Infoline
3. Kotak Securities Ltd.
4. Share Khan
5. India bulls
6. Motilal Oswal
7. Bajaj Capital
8. Karvy stock broking ltd
9. Angel Broking
10. Reliance Money
15
2.2 COMPANY PROFILE - KARVY STOCK BROKING LTD
2.2.1 INTRODUCTON TO KARVY
KARVY, is a premier integrated financial services provider, and ranked among
the top five in the country in all its business segments, services over 16 million
individual investors in various capacities, and provides investor services to over 300
corporate, comprising the who is who of Corporate India. KARVY covers the entire
spectrum of financial services such as Stock broking, Depository Participants,
Distribution of financial products - mutual funds, bonds, fixed deposit, equities,
Insurance Broking, Commodities Broking, Personal Finance Advisory Services,
Merchant Banking & Corporate Finance, placement of equity, IPO’s, among others.
Karvy has a professional management team and ranks among the best in technology,
operations and research of various industrial segments.
2.2.2 EARLY DAYS
The birth of Karvy was on a modest scale in 1981. It began with the vision and
enterprise of a small group of practicing Chartered Accountants who founded the
flagship company, Karvy Consultants Limited. They started with consulting and
financial accounting automation, and carved inroads into the field of registry and share
accounting by 1985. Since then, they have utilized their experience and superlative
expertise to go from strength to strength to better their services, to provide new ones, to
innovate, diversify and in the process, evolved Karvy as one of India’s premier
integrated financial service enterprise.
Thus over the last 20 years Karvy has traveled the success route, towards
building a reputation as an integrated financial services provider, offering a wide
spectrum of services. And they have made this journey by taking the route of quality
service, path breaking innovations in service, versatility in service and finally, totality
in service.
Their highly qualified manpower, cutting-edge technology, comprehensive
infrastructure and total customer-focus has secured for them the position of an
emerging financial services giant enjoying the confidence and support of an enviable
clientele across diverse fields in the financial world.
Their values and vision of attaining total competence in their servicing has
served as the building block for creating a great financial enterprise, which stands solid
16
on their fortresses of financial strength - their various companies.
With the experience of years of holistic financial servicing behind them and
years of complete expertise in the industry to look forward to, they have now emerged
as a premier integrated financial services provider.
And today, they can look with pride at the fruits of our mastery and experience
– comprehensive financial services that are competently segregated to service and
manage a diverse range of customer requirements.
2.2.3 KARVY ACHIEVEMENTS
 Among the top 5 stock brokers in India (4% of NSE volumes)
 India's No. 1 Registrar & Securities Transfer Agents
 Among the to top 3 Depository Participants
 Largest Network of Branches & Business Associates
 ISO 9002 certified operations by DNV
 Among top 10 Investment bankers
 Largest Distributor of Financial Products
 Adjudged as one of the top 50 IT uses in India by MIS Asia
 Full Fledged IT driven operation
2.2.4 KARVY QUALITY POLICY
To achieve and retain leadership, Karvy shall aim for complete customer
satisfaction, by combining its human and technological resources, to provide superior
quality financial services. In the process, Karvy will strive to exceed Customer's
expectations.
2.2.5 QUALITY OBJECTIVES
As per the Quality Policy, Karvy will:
 Life for all its employees and equip them with adequate knowledge &
skills so as to respond to customer's needs
 Continue to uphold the values of honesty & integrity and strive to
establish unparalleled standards in business ethics.
 Use state-of-the art information technology in developing new and
17
innovative financial products and services to meet the changing needs
of investors and clients.
 Strive to be a reliable source of value-added financial products and
services and constantly guide the individuals and institutions in making
a judicious choice of it.
 Strive to keep all stake-holders (shareholders, clients, investors,
employees, suppliers and regulatory authorities) proud and satisfied.
2.2.6 KARVY Group companies
Karvy Consultants Limited
They are the first securities registry to receive ISO 9002 certification in India.
Registered with SEBI as Category I Registrar, is Number 1 Registrar in the Country.
The award of being ‘Most Admired’ Registrar is one among many of the
acknowledgements they received for their customer friendly and competent services.
Karvy Stock Broking Limited
The company, Member of National Stock Exchange (NSE), offers a
comprehensive range of services in the stock market through the benefits of in-depth
research on crucial market dynamics, done by qualified team of experts. Apart from
stock broking activities, the company also provides Depository Participant Services to
its corporate and retail customers.
Karvy Investor Services Limited
Registered with SEBI as a Category I Merchant Banker and ranked among the
top 10 merchant bankers in the country, the company has built a reputation as a
professional advisor in structuring IPO’s take over assignments and buy back exercises.
Karvy Computer share Private Limited
Services is the global services arm of the Karvy Group of Companies engaged
in the business of offshore business process outsourcing in the areas of human resource
outsourcing, finance and accounting operations outsourcing, research and analytics and
back office processing operations.
Karvy Comtrade Limited
The company provides investment, advisory and brokerage services in Indian
Commodities Markets. And most importantly, they offer a wide reach through their
18
branch network of over 225 branches located across 180 cities.The company is into
distribution of Financial Products. It distributes a wide range of financial products and
services from insurance to credit cards and loans. The company provides sound
advisory services to suit the different investment needs of customers.
Karvy Commodities Broking Pvt Limited
At Karvy Commodities, they are focused on taking commodities trading to new
dimensons of reliability and profitability. They have made commodities trading, an
essentially age-old practice, into a sophisticated and scientific investment option.Here
they enable trade in all goods and products of agricultural and mineral origin that
include lucrative commodities like gold and silver and popular items like oil, pulses
and cotton through a well-systematized trading platform.
Their technological and infrastructural strengths and especially our street-smart
skills make us an ideal broker. Their service matrix is holistic with a gamut of
advantages, the first and foremost being their legacy of human resources, technology
and infrastructure that comes from being part of the Karvy Group.
Their wide national network, spanning the length and breadth of India, further
supports these advantages. Regular trading workshops and seminars are conducted to
hone trading strategies to perfection. Every move made is a calculated one, based on
reliable research that is converted into valuable information through daily, weekly and
monthly newsletters, calls and intraday alerts. A dedicated team committed to giving
hassle-free service while the brokerage rates offered are extremely competitive
provides further, personalized service here.
Their commitment to excel in this sector stems from the immense importance
those commodities broking has to a cross-section of investors – farmers, exporters,
importers, manufacturers and the Government of India itself.
About Karvy Commodities Broking Private Limited
Commodities market, contrary to the beliefs of many people, has been in
existence in India through the ages. However the recent attempt by the Government to
permit Multi-commodity National levels exchanges has indeed given it, a shot in the
arm. As a result two exchanges Multi Commodity Exchange (MCX) and National
Commodity and derivatives Exchange (NCDEX) have come into being. These
exchanges, by virtue of their high profile promoters and stakeholders, bundle in
19
themselves, online trading facilities, robust surveillance measures and a hassle-free
settlement system. The futures contracts available on a wide spectrum of commodities
like Gold, Silver, Cotton, Steel, Soya oil, Soya beans, Wheat, Sugar, Channa etc.,
provide excellent opportunities for hedging the risks of the farmers, importers,
exporters, traders and large scale consumers. They also make open an avenue for
quality investments in precious metals. The commodities market, as the movements of
the stock market or debt market do not affect it provides tremendous opportunities for
better diversification of risk. Realizing this fact, even mutual funds are contemplating
of entering into this market.
Karvy Commodities Broking Private Limited is another venture of the
prestigious Karvy group. With their well established presence in the multifarious facets
of the modern Financial services industry from stock broking to registry services, it is
indeed a pleasure for us to make foray into the commodities derivatives market which
opens yet another door for them to deliver their service to our beloved customers and
the investor public at large.
With the high quality infrastructure already in place and a committed
Government providing continuous impetus, it is the responsibility of them, the
intermediaries to deliver these benefits at the doorsteps of their esteemed customers.
With their expertise in financial services, existence across the lengths and breadths of
the country and an enviable technological edge, they are all set to bring to you, the
pleasure of investing in this burgeoning market.
which can touch upon the lives of a vast majority of the population from the
farmer to the corporate alike? They are confident that the commodity futures can be
good.The Company provides investment, advisory and brokerage services in Indian
Commodities Markets. And most importantly, they offer a wide reach through their
branch network of over 225 branches located across 180 cities.
THE KARVY CREDO.
 Clients are the reason for our being.
Personalized service, professional care; pro-activeness are the values
that help them nurture enduring relationships with their clients Respect for the
individual. They are the kilns that hone individuals to perfection. Be they their
employees, shareholders or investors. They do so by upholding their dignity & pride,
20
inculcating trust and achieving a sensitive balance of their professional and personal
lives.
 Teamwork.
Each team member is the face of Karvy. Together they offer diverse
services with speed, accuracy and quality to deliver only one product: excellence.
Transparency, co-operation, invaluable individual contributions for a collective goal,
and respecting individual uniqueness within a corporate whole, are how they deliver
again and again.
 Responsible Citizenship.
As a responsible corporate citizen, their duty is to foster a better
environment in the society where they live and work. Abiding by its norms, and
behaving responsibly towards the environment, is some of their growing initiatives
towards realizing it.
 Integrity.
Professional and personal ethics are their bedrock. They take pride in an
environment that encourages honesty and the opportunity to learn from failures than
camouflage them. They insist on consistency between works and actions.
21
CHAPTER 3
THEORETICAL VIEW OF TECHNICAL ANALYSIS
3.1 INTRODUCTION
“Technical analysis refers to the study of market generated data like
prices & volume to determine the future direction of prices movements.”
3.2 BASIC PRICES FOR TECHNICAL ANALYSIS
 Market prices are determined by the interaction of supply & demand
forces.
 Supply & demand are influenced by variety of supply & demand affiliated
factors both rational and irrational.
 These include fundamental factors as well as psychological factors.
 Minor deviations stock prices tend to move in fairly persistent trend.
 Shifts in demand & supply bring about change in trends.
 This shift can be detected with the help of charts of mutual and
computerized action, because of the persistence of trends and patterns
analysis of past market data can be used to predict future prices behaviors.
3.3 DRAWBACKS / LIMITATION OF TECHNICAL ANALYSIS
 Technical analysis does not able to explain the rezones behind the
employment or selection of specific tool of technical analysis.
 The technical analysis failed to signal an uptrend to downtrend in time.
 The technical analysis must be a self defeating proposition .As more &
more people use, employ it the value of such analysis trends to reduce.
3.4 FUNDAMENTAL VS. TECHNICAL ANALYSIS
Technical analysis and fundamental analysis are the two main schools of
thought in the financial markets. As we have mentioned, technical analysis looks at
the price movement of a security and uses this data to predict its future price
movements. Fundamental analysis, on the other hand, looks at economic factors,
known as fundamentals.
Fundamental analysis takes a relatively long-term approach to analyzing the
market compared to technical analysis. While technical analysis can be used on a
22
timeframe of weeks, days or even minutes, fundamental analysis often looks at data
over a number of years.
3.5 Tools & instruments used for technical analysis
Price fields:
Technical analysis is based almost entirely on the analysis of price and volume.
The fields which define a security’s price and volume are explained below.
Open
This is the price of the trade for the period (e.g., the first trade of the day).
When analyzing daily data the open is especially important as it is the consensus price
after all interested parties were able to “sleep on it”.
High
This is the highest price that the security traded during the period . It is the point
at which there were more sellers than buyers (e.g., there are always sellers willing to
sell at higher prices , but the high represents the highest price buyers were willing to
pay)
Low
This is the lowest price that the security traded during the period. It is the point
at which there were more buyers than sellers (e.g., there are always buyers willing to
buy at lower price , but the low represents the lowest price sellers were willing to
accept).
Close
This is the last price that the security traded during the period. Due to its
availability, the close is the most often used price for analysis. The relationship
between the open (the first price) and the close (the last price) are considered
significant by most technicians. This relationship is emphasized in candlestick charts.
23
Volume
This is the number of shares that were traded during the period. The relationship
between price and volume (e.g., increasing prices accompanied with increasing
volume) is important.
Open interest
This is the total number of outstanding contracts (e.g., those that have not been
exercised, closed, or expired) of a future or option. Open interest is often used as an
indicator.
Bid
This is the price a market maker is willing to pay for a security (e.g., the price
you will receive if you sell).
Ask
This is the price a market maker is willing to accept (e.g., the price you will pay
to buy the security)
3.6 TECHNICAL INDICATORS
3.6.1 Commodity Channel Index (CCI)
An oscillator used in technical analysis to help determine when an investment
vehicle has been overbought and oversold. The Commodity Channel Index, first
developed by Donald Lambert , quantifies the relationship between the assets price, a
moving average (MA) of the assets price , and normal deviations from the average
The Commodity Channel Index (“CCI”) measures the variations of the
security’s price from its statistical mean . High values show that prices are unusually
high compared to average prices whereas low values indicates that price are unusually
low.
Formula
CCI = (Typical price – 20 period of TP) / ( 0.158 x Mean Deviation)
24
Typical price ( TP ) =(High + low + close ) / 3
Constant = 0.15
The Commodity Channel Index is a very popular indicator that gives easy to use
Buy and Sell signal ; the CCI also used to identify overbought and oversold areas of
price actions. The CCI is calculated so that roughly 75% of price movement should be
between +100 (overbought) and -100 (oversold)
3.6.2 RELATIVE STRENGTH INDEX (RSI)
A technical momentum indicator that compares the magnitude of recent gains to
recent losses in an attempt to determine overbought and oversold conditions of
an asset.
Formula
RSI = Average of x days` up closes / Average of x days down closes
the RSI ranges from 0 to 100. An asset is deemed to be overbought once the
RSI approaches the 70 level , meaning that it may be getting overvalued and is a good
candidate for a pullback. Likewise ,if the RSI approaches 30, it is an indication that the
asset may be getting oversold and therefore likely become undervalued.
One of the most popular technical analysis indictors, the relative strength index
(RSI) is an oscillator that measures current price strength in relation to previous prices
3.6.3 STOCHASTIC FAST
Developed by George C Lane in the late 1950s, the Stochastic Oscillator is a
momentum indicator that shows the location of the current close relative to the high/
low range over a set number of periods. Closing levels that are consistently near the top
of the range indicate accumulation (buying pressure) and those near the bottom of the
range indicate distribution(selling pressure)
Formula
%K = 100*[Recent close-Lowest low(n) highest High(n)-Lowest low (n)
25
%D = 3- period moving average of % K
(n) = Number of periods used in calculation
Stochastic Fast plots the location of the current price I n relation to the
range of a certain number of prior bars (dependent upon user –input, usually 14-
periods). In general , stochastic are used to measure overbought and oversold
conditions. Above 80 is generally considered overbought and below 20 is considered
oversold.
a) Stochastic Buy Signal
When the stochastic is below the 20 oversold line and the %K line crosses
over the %D line, buy.
b) Stochastic Sell Signal
When the stochastic is above the 80 overbought line and the %K line
crosses below the %D line, sell.
3.6.4 WILLIAMS %R
Williams %R is a technical analysis oscillator showing the current closing price
in relation to the high and low of the past N days(for a given N). It was
developed by a publisher and promoter of trading materials, Larry Williams. Its
purpose is to tell whether a stock or commodity market is trading near the high
or the low , or somewhere in between, of its recent trading range.
Formula
%R= CLOSE today-HIGH n days x 100
HIGH n days- LOW n days
Williams %R is an overbought and oversold technical indicator that can give
easy to interpret buy and sell signals
26
CHAPTER 4
DATA ANALYSIS AND INTERPRETATION
4.1 INTRODUCTION
In this chapter the data were collected from karvy stock broking ltd and analysis
is made by the four indicators like, Relative strength index, Commodity channel index,
Williams %R and Fast stochastic. Nifty 50 scrip companies are chosen for analysis.
4.1.1. TOOLS USED FOR ANALYSIS
 RSI calculation was done for 14 days, in this calculation RSI limits are
between 20 and 80. If share price movement touches 70, the indicator’s
recommendation is overbought and if it touches 30, the indicator’s
recommendation is oversold and the price movements are between these two
levels the suggestion is to hold the stock.
 Commodity channel index calculation was done for 20days, in this
calculation CCI limits are between – 100 and 100. If share price movement
touches 100, the indicator’s recommendation are overbought and if it touches
– 100, the indicator’s recommendation is oversold and the price movements
are between these two levels the suggestion is to hold the stock.
 Fast stochastic calculation was done for 14 days. In this calculation this
limits are between 20 days 80. If share price movement touches 80, the
indicator’s recommendation is overbought and if it touches 20, the indicator’s
recommendation is oversold and the price movements are between these two
levels the suggestion is to hold the stock.
 Williams % R calculation was done for 14 days, in this calculation Williams
%R limits are between -20 and -80. If share price movement touches -20, the
indicator’s recommendation is overbought and if it touches -80, the
indicator’s recommendation is oversold and the price movements are between
these twos levels the suggestion is to hold the stock.
27
4.2 COMMODITY CHANNEL INDEX FOR AUTOMOBILE INDUSTRY
The table 4.1 shows the buy/sell signal of automobile industry using commodity
channel index..
TABLE 4.1
COMMODITY CHANNEL INDEX FOR AUTOMOBILE INDUSTRY
S.NO COMPANY NAME
HIGH
VALUE
LOW
VALUE
CLOSE
VALUE
COMMODITY
CHANNEL INDEX
1 Hero Motocorp Ltd 3,449.90 3,388.10 3,388.10 -38.22
2 Mahindra and Mahindra 2,636.75 2,584.60 2,631.00 61.17
3 Maruti Suzuki India ltd 1,233.55 1,204.00 1,219.00 -119.8
4 Tata Motors ltd 3,711.25 3,641.35 3,677.00 -30.55
5 Bajaj Auto ltd 577.8 567.7 576 -67.42
Source: Karvy Stock Broking Ltd
INFERENCE
In this table 4.1 shows commodity channel index indicates investors to buy
Maruti Suzuki India ltd shares and it also suggest the investors stay out from the stock
of following companies like Hero Motocorp Ltd, Mahindra and Mahindra, Tata Motors
ltd, Bajaj Auto ltd.
CHART 4.1
COMMODITY CHANNEL INDEX FOR AUTOMOBILE INDUSTRY
-150
-100
-50
0
50
100
Hero
Motocorp
Ltd
Mahindra
and
Mahindra
Maruti
Suzuki
India ltd
Tata
Motors
ltd
Bajaj
Auto ltd
PERCENTAGE
COMPANY NAME
28
4.3.FAST STOCHASTIC FOR AUTOMOBILE INDUSTRY
Table 4.2 shows the buy/sell signal of automobile industry using fast stochastic.
TABLE 4.2
FAST STOCHASTIC FOR AUTOMOBILE INDUSTRY
S.NO COMPANY NAME
HIGH
VALUE
LOW
VALUE
CLOSE
VALUE
FAST
STOCHASTIC
1 Hero Motocorp Ltd 3,449.90 3,388.10 3,388.10 58.45
2
Mahindra and
Mahindra
2,636.75 2,584.60 2,631.00 63.23
3 Maruti Suzuki India ltd 1,233.55 1,204.00 1,219.00 23.11
4 Tata Motors ltd 3,711.25 3,641.35 3,677.00 53.96
5 Bajaj Auto ltd 577.8 567.7 576 55.6
Source: Karvy Stock Broking Ltd
INFERENCE
In this table 4.2 fast stochastic indicates investors to buy Maruti Suzuki India ltd
shares and it also suggest the investors stay out from the stock of following companies
shares Hero Motocorp Ltd, Mahindra and Mahindra, Tata Motors ltd, Bajaj Auto ltd
CHART 4.2
FAST STOCHASTIC FOR AUTOMOBILE INDUSTRY
0
10
20
30
40
50
60
70
Hero
Motocorp
Ltd
Mahindra
and
Mahindra
Maruti
Suzuki
India ltd
Tata
Motors ltd
Bajaj Auto
ltd
PERCENTAGE
COMPANY NAME
29
4.4 RELATIVE STRENGTH INDEX FOR AUTOMOBILE INDUSTRY
The table 4.3 shows the buy/sell signal of automobile industry using relative
strength index..
TABLE 4.3
RELATIVE STRENGTH INDEX FOR AUTOMOBILE INDUSTRY
S.NO COMPANY
NAME
HIGH
VALUE
LOW
VALUE
CLOSE
VALUE
RELATIVE
STRENGTH
INDEX
1 Hero Motocorp Ltd 3,449.90 3,388.10 3,388.10 43.75
2 Mahindra and
Mahindra
2,636.75 2,584.60 2,631.00 65.32
3 Maruti Suzuki India
ltd
1,233.55 1,204.00 1,219.00 36.6
4 Tata Motors ltd 3,711.25 3,641.35 3,677.00 47.54
5 Bajaj Auto ltd 577.8 567.7 576 47.78
Source: Karvy Stock Broking Ltd
INFERENCE
In this table 4.3, RSI indicates investors to sell Tata Motors ltd shares and it also
suggest the investors stay out from the stock of following companies shares Hero
Motocorp Ltd, Mahindra and Mahindra, Bajaj Auto ltd, Maruti Suzuki India ltd
CHART 4.3
RELATIVE STRENGTH INDEX FOR AUTOMOBILE INDUSTRY
0
50
100
PERCENTAGE
COMPANY NAME
30
4.5 WILLIAMS % R FOR AUTOMOBILE INDUSTRY
The table 4.4 shows the buy/sell signal of automobile industry using Williams% r
TABLE 4.4
WILLIAMS % R FOR AUTOMOBILE INDUSTRY
S.NO
COMPANY
NAME
HIGH
VALUE
LOW
VALUE
CLOSE
VALUE
WILLIAMS % R
1 Hero Motocorp Ltd 3,449.90 3,388.10 3,388.10 -41.65
2
Mahindra and
Mahindra
2,636.75 2,584.60 2,631.00 -38.8
3
Maruti Suzuki India
ltd
1,233.55 1,204.00 1,219.00 -79.9
4 Tata Motors ltd 3,711.25 3,641.35 3,677.00 47.05
5 Bajaj Auto ltd 577.8 567.7 576 -47.22
Source: Karvy Stock Broking Ltd
INFERENCE
In this table 4.4 Williams %R indicates investors to buy Maruti Suzuki India
ltd shares, also indicates investors to sell the Bajaj Auto ltd shares and it also suggest
the investors stay out from the stock of following companies shares Hero Motocorp
Ltd, Mahindra and Mahindra, Tata Motors ltd,
CHART 4.4
WILLIAMS % R FOR AUTOMOBILE INDUSTRY
-100
-50
0
50
PERCENTAGE
COMPANY NAME
31
4.6 COMMODITY CHANNEL INDEX FOR BANKING INDUSTRY
The table 4.5 shows the buy/sell signal of Banking industry using commodity
channel index.
TABLE 4.5
COMMODITY CHANNEL INDEX FOR BANKING INDUSTRY
Source: Karvy Stock Broking Ltd
INFERENCE
In this table 4.5 commodity channel index indicates investors to buy HDFC
bank ltd, Kotak Mahindra bank ltd shares and it also suggest the investors stay out from
the stock of following companies shares Axis Bank Ltd, Bank of Baroda, ICICI Bank
Ltd, IDFC Ltd, Indusland Bank Ltd, Punjab National Bank Ltd, State Bank of India..
S.NO COMPANY HIGH LOW CLOSE
COMMODITY
CHANNEL
INDEX
1 Axis Bank Ltd 622 603.5 613 -109.7
2 Bank Of Baroda 184.95 178.7 181 -24.05
3 Hdfc Bank Ltd 1,090.00 1,062.50 1,065.00 -139.8
4 Icici Bank Ltd 349.9 340.1 346.4 22.14
5 Idfc Ltd 180.4 176.5 179 -78.86
6 Indusland Bank Ltd 917.85 893.15 909.8 -77.99
7 Kotak Mahindra Bank
Ltd
1,422.00 1,402.00 1,404.00 -100.4
8 Punjab National Bank Ltd 165.2 162.1 164.8 -94.63
9 State Bank Of India 296.25 289.75 294.75 98.25
32
CHART 4.5
COMMODITY CHANNEL INDEX FOR BANKING INDUSTRY
-150
-100
-50
0
50
100
PERCENTAGE
COMPANY NAME
33
4.7 FAST STOCHASTIC FOR BANKING INDUSTRY
The table 4.6. shows the buy/sell signal of banking industry using fast stochastic.
TABLE 4.6
FAST STOCHASTIC FOR BANKING INDUSTRY
Source: Karvy Stock Broking Ltd
INFERENCE
In this table 4.6 fast stochastic indicates investors to buy Axis Bank Ltd, HDFC
bank ltd, Indusland Bank Ltd, Punjab National Bank Ltd, Kotak Mahindra bank ltd
shares and it also suggest the investors stay out from the stock of following companies
shares Bank of Baroda, ICICI Bank Ltd, IDFC Ltd, State Bank of India..
S.NO COMPANY HIGH LOW CLOSE
FAST
STOCHASTIC
1 Axis Bank Ltd 622 603.5 613 2.91
2 Bank Of Baroda 184.95 178.7 181 28.14
3 Hdfc Bank Ltd 1,090.00 1,062.50 1,065.00 1.88
4 Icici Bank Ltd 349.9 340.1 346.4 67.54
5 Idfc Ltd 180.4 176.5 179 32.66
6 Indusind Bank Ltd 917.85 893.15 909.8 41.99
7
Kotak Mahindra Bank
Ltd
1,422.00 1,402.00 1,404.00 9.5
8 Punjab National Bank Ltd 165.2 162.1 164.8 15.12
9 State Bank Of India 296.25 289.75 294.75 65.82
34
CHART 4.6
FAST STOCHASTIC FOR BANKING INDUSTRY
0
10
20
30
40
50
60
70
PERCENTAGE
COMPANY NAME
35
4.8 RELATIVE STRENGTH INDEX FOR BANKING INDUSTRY
The table 4.7 shows the buy/sell signal of banking industry using relative
strength index.
TABLE 4.7
RELATIVE STRENGTH INDEX FOR BANKING INDUSTRY
Source: Karvy Stock Broking Ltd
INFERENCE
In this table 4.7 RSI indicates investors to buy Axis Bank Ltd, HDFC bank ltd,
Kotak Mahindra bank ltd shares, also indicate investors sell the ICICI Bank Ltd shares
and it also suggest the investors stay out from the stock of following companies shares
Bank of Baroda, IDFC Ltd, Indusland Bank Ltd, Punjab National Bank Ltd, State Bank
of India.
S.NO COMPANY HIGH LOW CLOSE
RELATIVE
STRENGTH
INDEX
1 Axis Bank Ltd 622 603.5 613 27.8
2 Bank Of Baroda 184.95 178.7 181 42.33
3 Hdfc Bank Ltd 1,090.00 1,062.50 1,065.00 18.14
4 Icici Bank Ltd 349.9 340.1 346.4 50.15
5 Idfc Ltd 180.4 176.5 179 42.57
6 Indusind Bank Ltd 917.85 893.15 909.8 47.2
7
Kotak Mahindra Bank
Ltd
1,422.00 1,402.00 1,404.00 29.91
8 Punjab National Bank Ltd 165.2 162.1 164.8 38.89
9 State Bank Of India 296.25 289.75 294.75 56.78
36
CHART 4.7
RELATIVE STRENGTH INDEX FOR BANKING INDUSTRY
0
10
20
30
40
50
60
PERCENTAGE
COMPANY NAME
37
4.9 WILLIAMS % R FOR BANKING INDUSTRY
The table 4.8 shows the buy/sell signal of banking industry using williams %R
TABLE 4.8
WILLIAMS % R FOR BANKING INDUSTRY
Source: Karvy Stock Broking Ltd
INFERENCE
In this table 4.8 Williams %R indicates investors to buy Axis Bank Ltd, HDFC
bank ltd, Kotak Mahindra bank ltd, Indusland Bank Ltd, Punjab National Bank Ltd
shares and it also suggest the investors stay out from the stock of following companies
shares Bank of Baroda, ICICI Bank Ltd, IDFC Ltd, State Bank of India..
S.NO COMPANY HIGH LOW CLOSE
WILLIAMS
% R
1 Axis Bank Ltd 622 603.5 613 -97.3
2 Bank Of Baroda 184.95 178.7 181 -69.86
3 Hdfc Bank Ltd 1,090.00 1,062.50 1,065.00 -99.22
4 Icici Bank Ltd 349.9 340.1 346.4 -31.46
5 Idfc Ltd 180.4 176.5 179 -64.32
6 Indusind Bank Ltd 917.85 893.15 909.8 -56.05
7 Kotak Mahindra Bank
Ltd
1,422.00 1,402.00 1,404.00
-90.86
8 Punjab National Bank Ltd 165.2 162.1 164.8 -84.98
9 State Bank Of India 296.25 289.75 294.75 -34.17
38
CHART 4.8
WILLIAMS % R FOR BANKING INDUSTRY
-100
-90
-80
-70
-60
-50
-40
-30
-20
-10
0
PERCENTAGE
COMPANY NAME
39
4.10. COMMODITY CHANNEL INDEX FOR CEMENT INDUSTRY
The table 4.9 shows the buy/sell signal of Cement industry using commodity
channel index ..
TABLE 4.9
COMMODITY CHANNEL INDEX FOR CEMENT INDUSTRY
S.NO COMPANY NAME HIGH LOW CLOSE
COMMODITY
CHANNEL
INDEX
1 ACC 1,729.00 1,675.00 1,725.60 -162.45
2 Ambuja Cement 276 269.05 275 -77.29
3 Grasim Industry 3,910.00 3,757.65 3,886.00 26.92
4 Ultratech Cement Ltd 3,330.00 3,152.35 3,315.00 -87.78
Source: Karvy Stock Broking Ltd
INFERENCE
In this table 4.9 commodity channel index indicates investors to buy ACC ltd
shares and it also suggest the investors stay out from the stock of following companies
shares Ambuja Cement, Grasim Industry, Ultratech Cement Ltd.
CHART 4.9
COMMODITY CHANNEL INDEX FOR CEMENT INDUSTRY
-200
-150
-100
-50
0
50
PERCENTAGE
COMPANY NAME
40
4.11.FAST STOCHASTIC FOR CEMENT INDUSTRY
The table 4.10 shows the buy/sell signal of cement industry using fast stochastic
TABLE 4.10
FAST STOCHASTIC FOR CEMENT INDUSTRY
S.NO COMPANY NAME HIGH LOW CLOSE
FAST
STOCHASTIC
1 ACC 1,729.00 1,675.00 1,725.60 19.54
2 AMBUJA CEMENT 276 269.05 275 20.65
3 GRASIMINDUSTRY 3,910.00 3,757.65 3,886.00 71.76
4
ULTRATECH
CEMENT LTD
3,330.00 3,152.35 3,315.00 13.83
Source: Karvy Stock Broking Ltd
INFERENCE
In this table 4.10 Fast Stochastic indicates investors to buy following companies
shares ACC ltd, Ultratech Cement Ltd, Ambuja Cement shares and it also suggest the
investors stay out from the stock of Grasim Industry shares.
CHART 4.10
FAST STOCHASTIC FOR CEMENT INDUSTRY
0
20
40
60
80
PERCENTAGE
COMPANY NAME
41
4.12. RELATIVE STRENGTH INDEX FOR CEMENT INDUSTRY
The table 4.11 shows the buy/sell signal of cement industry using relative
strength index
TABLE 4.11
RELATIVE STRENGTH INDEX FOR CEMENT INDUSTRY
S.NO COMPANY NAME HIGH LOW CLOSE
RELATIVE
STRENGTH
INDEX
1 ACC 1,729.00 1,675.00 1,725.60 42.45
2 AMBUJA CEMENT 276 269.05 275 33.59
3 GRASIMINDUSTRY 3,910.00 3,757.65 3,886.00 53.29
4 ULTRATECH
CEMENT LTD
3,330.00 3,152.35 3,315.00 30.32
Source: Karvy Stock Broking Ltd
INFERENCE
In this table 4.11 RSI indicates investors to buy Ultratech Cement Ltd shares,
also indicates to sell the Grasim Industry shares and it also suggest the investors stay
out from the stock of following companies shares Ambuja Cement, ACC ltd.
CHART 4.11
RELATIVE STRENGTH INDEX FOR CEMENT INDUSTRY
0
20
40
60
PERCENTAGE
COMPANY NAME
42
4.13.WILLIAMS % R FOR CEMENT INDUSTRY
The table 4.12 shows the buy/sell signal of cement industry using williams % r .
TABLE 4.12
WILLIAMS % R FOR CEMENT INDUSTRY
S.NO COMPANY NAME HIGH LOW CLOSE
WILLIAMS
% R
1 ACC 1,729.00 1,675.00 1,725.60 -84.49
2 AMBUJA CEMENT 276 269.05 275 -83.3
3 GRASIMINDUSTRY 3,910.00 3,757.65 3,886.00 -26.24
4 ULTRATECH
CEMENT LTD
3,330.00 3,152.35 3,315.00 -89.17
Source: Karvy Stock Broking Ltd
INFERENCE
In this table 4.12 Williams %R indicates investors to buy following companies
shares ACC ltd, Ambuja Cement, Ultratech Cement Ltd shares and it also suggest the
investors stay out from the stock of Grasim Industry shares.
CHART 4.12
WILLIAMS % R FOR CEMENT INDUSTRY
-100
-80
-60
-40
-20
0
PERCENTAGE
COMPANY NAME
43
4.14 COMMODITY CHANNEL INDEX FOR CONSTRUCTION INDUSTRY
The table 4.13 shows the buy/sell signal of construction industry using
commodity channel index..
TABLE 4.13
COMMODITY CHANNEL INDEX FOR CONSTRUCTION INDUSTRY
S.NO COMPANY HIGH LOW CLOSE
COMMODITY
CHANNEL
INDEX
1 Larsen And
Toubro
1,846.45 1,795.00 1,842.25 -185.9
2 Dlf Ltd 155.85 151.55 154.45 -12.92
Source: Karvy Stock Broking Ltd
INFERENCE
In this table 4.13 commodity channel index indicates investors to buy the
Larsen And Toubro shares and it also suggest the investors stay out from the stock of
DLF Ltd shares.
CHART 4.13
COMMODITY CHANNEL INDEX FOR CONSTRUCTION INDUSTRY
-200
-150
-100
-50
0
LARSEN AND TOUBRO DLF LTD
PERCENTAGE
COMPANY NAME
44
4.15. FAST STOCHASTIC FOR CONSTRUCTION INDUSTRY
The table 4.14 shows the buy/sell signal of construction industry using fast
stochastic
TABLE 4.14
FAST STOCHASTIC FOR CONSTRUCTION INDUSTRY
S.NO COMPANY HIGH LOW CLOSE
FAST
STOCHASTIC
1 LARSEN AND
TOUBRO
1,846.45 1,795.00 1,842.25 12.45
2 DLF LTD 155.85 151.55 154.45 60.16
Source: Karvy Stock Broking Ltd
INFERENCE
In this table 4.14 fast stochastic indicates investors to buy the Larsen And
Toubro shares and it also suggest the investors stay out from the stock of DLF Ltd
shares.
CHART 4.14
FAST STOCHASTIC FOR CONSTRUCTION INDUSTRY
0
10
20
30
40
50
60
70
LARSEN AND TOUBRO DLF LTD
PERCENTAGE
COMPANY NAME
45
4.16 RELATIVE STRENGTH INDEX FOR CONSTRUCTION INDUSTRY
The table 4.15 shows the buy/sell signal of construction industry using relative
strength index
TABLE 4.15
RELATIVE STRENGTH INDEX FOR CONSTRUCTION INDUSTRY
S.NO COMPANY HIGH LOW CLOSE
RELATIVE
STRENGTH
INDEX
1 LARSEN AND
TOUBRO
1,846.45 1,795.00 1,842.25 33.31
2 DLF LTD 155.85 151.55 154.45 53.58
Source: Karvy Stock Broking Ltd
INFERENCE
In this table 4.15 RSI indicates investors to buy the DLF Ltd shares and it also
suggest the investors stay out from the stock of Larsen And Toubro shares.
CHART 4.15
RELATIVE STRENGTH INDEX FOR CONSTRUCTION INDUSTRY
0
10
20
30
40
50
60
LARSEN AND TOUBRO DLF LTD
PERCENTAGE
COMPANY NAME
46
4.17. WILLIAMS % R FOR CONSTRUCTION INDUSTRY
The table 4.16 shows the buy/sell signal of construction industry using williams
% R
TABLE 4.16
WILLIAMS % R FOR CONSTRUCTION INDUSTRY
S.NO COMPANY HIGH LOW CLOSE
WILLIAMS
% R
1 LARSEN AND
TOUBRO
1,846.45 1,795.00 1,842.25 -37.84
2 DLF LTD 155.85 151.55 154.45 -88.67
Source: Karvy Stock Broking Ltd
INFERENCE
In this table 4.16 Williams %R indicates investors to buy the Larsen And
Toubro shares and it also suggest the investors stay out from the stock of DLF Ltd
shares.
CHART 4.16
WILLIAMS % R FOR CONSTRUCTION INDUSTRY
-100
-80
-60
-40
-20
0
LARSEN AND TOUBRO DLF LTD
PERCENTAGE
COMPANY NAME
47
4.18 COMMODITY CHANNEL INDEX FOR CONSUMER GOODS INDUSTRY
The table 4.17 shows the buy/sell signal of consumer industry using commodity
channel index
TABLE 4.17
COMMODITY CHANNEL INDEX FOR CONSUMER GOODS INDUSTRY
S.NO COMPANY NAME HIGH LOW CLOSE
COMMODITY
CHANNEL
INDEX
1 ASIAN PAINTS LTD 841.55 828 837 12.58
2 HINDUSTAN
UNILIVER LTD
946.35 913.45 913.45 218.5
3 ITC LTD 349.1 341.7 347 75.22
Source: Karvy Stock Broking Ltd
INFERENCE
In this table 4.18 commodity channel index indicates investors to sell the Asian
paints ltd shares and it also suggest the investors stay out from the stock of Hindustan
Uniliver Ltd, Itc Ltd shares.
CHART 4.17
COMMODITY CHANNEL INDEX FOR CONSUMER GOODS INDUSTRY
0
50
100
150
200
250
ASIAN PAINTS
LTD
HINDUSTAN
UNILIVER LTD
ITC LTD
PERCENTAGE
COMPANY NAME
48
4.19 FAST STOCHASTIC FOR CONSUMER GOODS INDUSTRY
The table 4.18 shows the buy/sell signal of consumer industry using fast
stochastic
TABLE 4.18
FAST STOCHASTIC FOR CONSUMER GOODS INDUSTRY
S.NO COMPANY NAME HIGH LOW CLOSE
FAST
STOCHASTIC
1 ASIAN PAINTS LTD 841.55 828 837 37
2 HINDUSTAN
UNILIVER LTD 946.35 913.45 913.45 68.54
3 ITC LTD 349.1 341.7 347 64.67
Source: Karvy Stock Broking Ltd
INFERENCE
In this table 4.18 fast stochastic suggest the investors stay out from the stock of
following companies shares Asian paints ltd, Hindustan Uniliver Ltd, ITC Ltd.
CHART 4.18
FAST STOCHASTIC FOR CONSUMER GOODS INDUSTRY
0
10
20
30
40
50
60
70
ASIAN PAINTS LTD HINDUSTAN
UNILIVER LTD
ITC LTD
PERCENTAGE
COMPANY NAME
49
4.20. RELATIVE STRENGTH INDEX FOR CONSUMER GOODS INDUSTRY
The table 4.19 shows the buy/sell signal of consumer industry using relative
strength index
TABLE 4.19
RELATIVE STRENGTH INDEX FOR CONSUMER GOODS INDUSTRY
S.NO COMPANY NAME HIGH LOW CLOSE
RELATIVE
STRENGTH
INDEX
1 ASIAN PAINTS LTD 841.55 828 837 58.67
2 HINDUSTAN
UNILIVER LTD
946.35 913.45 913.45 59.03
3 ITC LTD 349.1 341.7 347 53.83
Source: Karvy Stock Broking Ltd
INFERENCE
In this table 4.19 RSI indicates investors to buy the Itc Ltd shares and it also
suggest the investors stay out from the stock of following shares Hindustan Uniliver
Ltd, Asian paints ltd.
CHART 4.19
RELATIVE STRENGTH INDEX FOR CONSUMER GOODS INDUSTRY
50
52
54
56
58
60
ASIAN PAINTS
LTD
HINDUSTAN
UNILIVER LTD
ITC LTD
PERCENTAGE
COMPANY NAME
50
4.21 WILLIAMS % R FOR CONSUMER GOODS INDUSTRY
The table 4.20 shows the buy/sell signal of consumer goods industry using
williams % R
TABLE 4.20
WILLIAMS % R FOR CONSUMER GOODS INDUSTRY
S.NO COMPANY NAME HIGH LOW CLOSE
WILLIAMS
% R
1 ASIAN PAINTS LTD 841.55 828 837 -67.9
2
HINDUSTAN
UNILIVER LTD
946.35 913.45 913.45 -35.4
3 ITC LTD 349.1 341.7 347 -35.31
Source: Karvy Stock Broking Ltd
INFERENCE
In this table 4.20 Williams %R suggest the investors stay out from the stock of
following companies shares Asian paints ltd, Hindustan Uniliver Ltd, ITC Ltd.
CHART 4.20
WILLIAMS % R FOR CONSUMER GOODS INDUSTRY
-70
-60
-50
-40
-30
-20
-10
0
ASIAN PAINTS LTD HINDUSTAN
UNILIVER LTD
ITC LTD
PERCENTAGE
COMPANY NAME
51
4.22 COMMODITY CHANNEL INDEX FOR ENTERTAINMENT INDUSTRY
The table 4.21 shows the buy/sell signal of entertainment industry using
commodity channel index
TABLE 4.21
COMMODITY CHANNEL INDEX FOR ENTERTAINMENT INDUSTRY
S.NO COMPANY NAME HIGH LOW CLOSE
COMMODITY
CHANNEL
INDEX
1 ZEE ENTERTAINMENT
ENTERPRICE LTD
345.1 335 342 -112.5
Source: Karvy Stock Broking Ltd
INFERENCE
In this table 4.21 Commodity Channel Index suggests the investors to buy the
stock.
CHART 4.21
COMMODITY CHANNEL INDEX FOR ENTERTAINMENT INDUSTRY
-120
-100
-80
-60
-40
-20
0
-112.5
PERCENTAGE
COMPANY NAME
ZEE ENTERTAINMENT
ENTERPRICE LTD
52
4.23 FAST STOCHASTIC FOR ENTERTAINMENT INDUSTRY
The table 4.22 shows the buy/sell signal of entertainment industry using fast
stochastic
TABLE 4.22
FAST STOCHASTIC FOR ENTERTAINMENT INDUSTRY
S.NO COMPANY NAME HIGH LOW
CLOS
E
FAST
STOCHASTI
C
1
ZEE ENTERTAINMENT
ENTERPRICE LTD
345.1 335 342 13.21
Source: Karvy Stock Broking Ltd
INFERENCE
In this table 4.22 Fast Stochastic suggests the investors to buy the stock
CHART 4.22
FAST STOCHATIC FOR ENTERTAINMENT INDUSTRY
0
2
4
6
8
10
12
14
PERCENTAGE
COMPANY NAME
ZEE ENTERTAINMENT
ENTERPRICE LTD
53
4.24 RELATIVE STRENGTH INDEX FOR ENTERTAINMENT INDUSTRY
The table 4.23 shows the buy/sell signal of entertainment industry using relative
strength index
TABLE 4.23
RELATIVE STRENGTH INDEX FOR ENTERTAINMENT INDUSTRY
S.NO COMPANY NAME HIGH LOW
CLOS
E
RELATIVE
STRENGTH
INDEX
1
ZEE ENTERTAINMENT
ENTERPRISE LTD
345.1 335 342 30.1
Source: Karvy Stock Broking Ltd
INFERENCE
In this table 4.23 RSI suggests the investors to buy the stock.
CHART 4.23
RELATIVE STRENGTH INDEX FOR ENTERTAINMENT INDUSTRY
0
5
10
15
20
25
30
35
PERCENTAGE
COMPANY NAME
ZEE ENTERTAINMENT
ENTERPRICE LTD
54
4.25 WILLIAMS % R FOR ENTERTAINMENT INDUSTRY
The table 4.24 shows the buy/sell signal of entertainment industry using
williams % R
TABLE 4.24
WILLIAMS % R FOR ENTERTAINMENT INDUSTRY
S.NO COMPANY NAME HIGH LOW
CLOS
E
WILLIAMS
%R
1
ZEE ENTERTAINMENT
ENTERPRISE LTD
345.1 335 342 -87.96
Source: Karvy Stock Broking Ltd
INFERENCE
In this table 4.24 Williams %R suggests the investors to buy the stock.
CHART 4.24
WILLIAMS % R FOR ENTERTAINMENT INDUSTRY
-100
-80
-60
-40
-20
0
PERCENTAGE
COMPANY NAME
ZEE ENTERTAINMENT
ENTERPRICE LTD
55
4.26. COMMODITY CHANNEL INDEX FOR INDUSTRIAL
MANUFACTURING
The table 4.25 shows the buy/sell signal of industrial manufacturing industry
using commodity channel index
TABLE 4.25
COMMODITY CHANNEL INDEX FOR INDUSTRIAL MANUFACTURING
S.NO
COMPANY
NAME
HIGH LOW CLOSE
COMMODIT
Y CHANNEL
INDEX
1
BHARTI HEAVY
ELECTRICAL
LTD
273.7 266.05 273 60.45
Source: Karvy Stock Broking Ltd
INFERENCE
In this table 4.25 Commodity Channel Index suggest the investors to stay out
from the stock.
CHART 4.25
COMMODITY CHANNEL INDEX FOR INDUSTRIAL MANUFACTURING
0
10
20
30
40
50
60
70
PERCENTAGE
COMPANY NAME
BHARTI HEAVY
ELECTRICAL LTD
56
4.27 FAST STOCHASTIC FOR INDUSTRIAL MANUFACTURING
The table 4.26 shows the buy/sell signal of industrial manufacturing industry
using fast stochastic.
TABLE 4.26
FAST STOCHASTIC FOR INDUSTRIAL MANUFACTURING
S.NO
COMPANY
NAME
HIGH LOW CLOSE
FAST
STOCHASTI
C
1
BHARTI HEAVY
ELECTRICAL
LTD
273.7 266.05 273 41.26
Source: Karvy Stock Broking Ltd
INFERENCE
In this table 4.26 Fast Stochastic suggest the investors to stay out from the
stock.
CHART 4.26
FAST STOCHASTIC FOR INDUSTRIAL MANUFACTURING
0
10
20
30
40
50
PERCENTAGE
COMPANY NAME
BHARTI HEAVY
ELECTRICAL LTD
57
4.28 RELATIVE STRENGTH INDEX FOR INDUSTRIAL MANUFACTURING
The table 4.27 shows the buy/sell signal of industrial manufacturing industry
using relative strength index
TABLE 4.27
RELATIVE STRENGTH INDEX FOR INDUSTRIAL MANUFACTURING
S.NO
COMPANY
NAME
HIGH LOW CLOSE
RELATIVE
STRENGTH
INDEX
1 BHARTI HEAVY
ELECTRICAL
LTD
273.7 266.05 273 52.8
Source: Karvy Stock Broking Ltd
INFERENCE
In this table 4.27 RSI indicate sell signal.
CHART 4.27
RELATIVE STRENGTH INDEX FOR INDUSTRIAL MANUFACTURING
0
10
20
30
40
50
60
PERCENTAGE
COMPANY NAME
BHARTI HEAVY
ELECTRICAL LTD
58
4.29 WILLIAMS % R FOR INDUSTRIAL MANUFACTURING
The table 4.28 shows the buy/sell signal of industrial manufacturing industry
using williams % R
TABLE 4.28
WILLIAMS % R FOR INDUSTRIAL MANUFACTURING
S.NO
COMPANY
NAME
HIGH LOW CLOSE
WILLIAMS
% R
1
BHARTI HEAVY
ELECTRICAL
LTD
273.7 266.05 273 52.8
Source: Karvy Stock Broking Ltd
INFERENCE
In this table 4.28 Williams %R suggest the investors to stay out from the stock.
CHART 4.28
WILLIAMS % R FOR INDUSTRIAL MANUFACTURING
0
10
20
30
40
50
60
PERCENTAGE
COMPANY NAME
BHARTI HEAVY
ELECTRICAL LTD
59
4.30 COMMODITY CHANNEL INDEX FOR METAL AND MINING
INDUSTRY
The table 4.29 shows the buy/sell signal of metal and miming industry using
commodity channel index
TABLE 4.29
COMMODITY CHANNEL INDEX FOR METAL AND MINING INDUSTRY
S.NO COMPANY NAME HIGH LOW CLOSE
COMMODITY
CHANNEL
INDEX
1 COAL INDIA LTD 375.2 362 372 -55.79
2
HINDALCO
INDUSTRIES LTD
154 146.9 153.05 -128.9
3
JINDAL STEEL &
POWER LTD
192.3 182.1 188.8 -159.6
4 NMDC LTD 133.15 127.05 133 12.54
5 SESA STERLITE LTD 215.5 208.75 212.65 -78.32
6 TATA STEEL LTD 349.2 341.25 348.5 -107.3
Source: Karvy Stock Broking Ltd
INFERENCE
In this table 4.29 commodity channel index indicates investors to buy Hindalco
Industries Ltd, Jindal Steel & Power Ltd shares , also indicates to sell the NMDC Ltd
shares and it also suggest the investors stay out from the stock of following companies
shares Coal India Ltd, Sesa Sterlite Ltd, Tata Steel Ltd.
60
CHART 4.29
COMMODITY CHANNEL INDEX FOR METAL AND MINING INDUSTRY
-160
-140
-120
-100
-80
-60
-40
-20
0
20
PERCENTAGE
COMPANY NAME
61
4.31 FAST STOCHASTIC FOR METAL AND MINING INDUSTRY
The table 4.30 shows the buy/sell signal of metal and miming industry using
fast stochastic
TABLE 4.30
FAST STOCHASTIC FOR METAL AND MINING INDUSTRY
S.NO COMPANY NAME HIGH LOW CLOSE
FAST
STOCHASTIC
1 COAL INDIA LTD 375.2 362 372 50.35
2
HINDALCO
INDUSTRIES LTD
154 146.9 153.05 7.12
3
JINDAL STEEL &
POWER LTD
192.3 182.1 188.8 18.85
4 NMDC LTD 133.15 127.05 133 85.34
5 SESA STERLITE LTD 215.5 208.75 212.65 25.76
6 TATA STEEL LTD 349.2 341.25 348.5 4.51
Source: Karvy Stock Broking Ltd
INFERENCE
In this table 4.30 Fast stochastic indicates investors to buy Hindalco Industries
Ltd, Jindal Steel & Power Ltd shares also indicates to sell the NMDC Ltd shares and it
also suggest the investors stay out from the stock of following companies shares Coal
India Ltd, Sesa Sterlite Ltd, Tata Steel Ltd.
62
CHART 4.30
FAST STOCHASTIC FOR METAL AND MINING INDUSTRY
0
10
20
30
40
50
60
70
80
90
PERCENTAGE
COMPANY NAME
63
4.32 RELATIVE STRENGTH INDEX FOR METAL AND MINING INDUSTRY
The table 4.31 shows the buy/sell signal of metal and miming industry using
relative strength index
TABLE 4.31
RELATIVE STRENGTH INDEX FOR METAL AND MINING INDUSTRY
S.NO COMPANY NAME HIGH LOW CLOSE
RELATIVE
STRENGTH
INDEX
1 COAL INDIA LTD 375.2 362 372 43.44
2
HINDALCO
INDUSTRIES LTD
154 146.9 153.05 37.17
3
JINDAL STEEL &
POWER LTD
192.3 182.1 188.8 31.27
4 NMDC LTD 133.15 127.05 133 45.21
5 SESA STERLITE LTD 215.5 208.75 212.65 36.52
6 TATA STEEL LTD 349.2 341.25 348.5 31.09
Source: Karvy Stock Broking Ltd
INFERENCE
In this table 4.31 RSI indicates investors to sell the NMDC Ltd shares and it
also suggest the investors stay out from the stock of following companies shares Coal
India Ltd, Sesa Sterlite Ltd, Tata Steel Ltd, Hindalco Industries Ltd, Jindal Steel &
Power Ltd.
64
CHART 4.31
RELATIVE STRENGTH INDEX FOR METAL AND MIING INDUSTRY
0
5
10
15
20
25
30
35
40
45
50
PERCENTAGE
COMPANY NAME
65
4.33 WILLIAMS % R FOR METAL AND MINING INDUSTRY
The table 4.32 shows the buy/sell signal of metal and miming industry using
williams % R
TABLE 4.32
WILLIAMS % R FOR METAL AND MINING INDUSTRY
S.NO COMPANY NAME HIGH LOW CLOSE
WILLIAMS%
R
1 COAL INDIA LTD 375.2 362 372 -49.65
2
HINDALCO
INDUSTRIES LTD
154 146.9 153.05 -95.53
3
JINDAL STEEL &
POWER LTD
192.3 182.1 188.8 -80.57
4 NMDC LTD 133.15 127.05 133 -10.74
5 SESA STERLITE LTD 215.5 208.75 212.65 -75.17
6 TATA STEEL LTD 349.2 341.25 348.5 -98.79
Source: Karvy Stock Broking Ltd
INFERENCE
In this table 4.32 Williams %R indicates investors to buy Hindalco Industries
Ltd, Jindal Steel & Power Ltd shares also indicates to sell the Coal India Ltd, NMDC
Ltd shares and it also suggest the investors stay out from the stock of following
companies shares Sesa Sterlite Ltd, Tata Steel Ltd.
66
CHART 4.32
WILLIAMS% R FOR METAL AND MINING INDUSTRY
-100
-90
-80
-70
-60
-50
-40
-30
-20
-10
0
PERCENTAGE
COMPANY NAME
67
4.34 COMMODITY CHANNEL INDEX FOR OIL AND GAS INDUSTRY
The table 4.33 shows the buy/sell signal of oil and gas industry using
commodity channel index
TABLE 4.33
COMMODITY CHANNEL INDEX FOR OIL AND GAS INDUSTRY
S.NO COMPANY NAME HIGH LOW CLOSE
COMMODITY
CHANNEL
INDEX
1
BHARAT PETROLEUM
CORP LTD
780.9 768 770 71.08
2 CAIRN INDIA LTD 245 235.5 245 -61.09
3 GAIL INDIA LTD 408.1 397.6 405 17.08
4 NTPC LTD 158.7 155.2 156.25 -32.44
5
OIL& NATURAL GAS
CORP LTD
321.45 317.4 321.05 -56.75
6
POWER GRID CORP OF
IND LTD
273.7 266.05 273 96.53
7
RELIANCE INDUSTRIES
LTD
898.75 878.15 892.5 -110.2
8 TATA POWER CO.LTD 85.9 84 84.35 -29.98
Source: Karvy Stock Broking Ltd
INFERENCE
In this table 4.33 commodity channel index indicates investors to buy the Gail
India Ltd, Reliance Industries Ltd shares and it also suggest the investors stay out from
the stock of following companies shares Bharat Petroleum Corp Ltd, Cairn India Ltd,
NTPC Ltd, Oil& Natural Gas Corp Ltd, Power Grid Corp Of Ind Ltd, Tata Power Co
Ltd.
68
CHART 4.33
COMMODITY CHANNEL INDEX FOR OIL AND GAS INDUSTRY
-150
-100
-50
0
50
100
PERCENTAGE
COMPANY NAME
69
4.35 FAST STOCHASTIC FOR OIL AND GAS INDUSTRY
The table 4.34 shows the buy/sell signal of oil and gas industry using stochastic
fast stochastic
TABLE 4.34
FAST STOCHASTIC FOR OIL AND GAS INDUSTRY
S.NO COMPANY NAME HIGH LOW CLOSE
FAST
STOCHASTIC
1
BHARAT PETROLEUM
CORP LTD
780.9 768 770 86.88
2 CAIRN INDIA LTD 245 235.5 245 54.59
3 GAIL INDIA LTD 408.1 397.6 405 17.8
4 NTPC LTD 158.7 155.2 156.25 70.19
5
OIL& NATURAL GAS
CORP LTD
321.45 317.4 321.05 47.28
6
POWER GRID CORP OF
IND LTD
273.7 266.05 273 82.98
7
RELIANCE INDUSTRIES
LTD
898.75 878.15 892.5 12.76
8 TATA POWER CO.LTD 85.9 84 84.35 69.68
Source: Karvy Stock Broking Ltd
INFERENCE
In this table 4.34 fast stochastic indicates investors to buy the Gail India Ltd,
Reliance Industries Ltd shares, also indicate to sell the Power Grid Corp Of Ind Ltd
shares and it also suggest the investors stay out from the stock of following companies
shares Bharat Petroleum Corp Ltd, Cairn India Ltd, NTPC Ltd, Oil& Natural Gas Corp
Ltd, Tata Power Co Ltd.
70
CHART 4.34
FAST STOCHASTIC FOR OIL AND GAS INDUSTRY
0
10
20
30
40
50
60
70
80
90
PERCENTAGE
COMPANY NAME
71
4.36 RELATIVE STRENGTH INDEX FOR OIL AND GAS INDUSTRY
The table 4.35 shows the buy/sell signal of oil and gas industry using relative
strength index.
TABLE 4.35
RELATIVE STRENGTH INDEX FOR OIL AND GAS INDUSTRY
Source: Karvy Stock Broking Ltd
INFERENCE
In this table 4.35 RSI indicates investors to buy the Tata Power Co Ltd shares,
also indicate to sell the Bharat Petroleum Corp Ltd shares and it also suggest the
investors stay out from the stock of following companies shares Cairn India Ltd, NTPC
Ltd, Oil& Natural Gas Corp Ltd, Gail India Ltd, Reliance Industries Ltd, Power Grid
Corp Of Ind Ltd.
S.NO COMPANY NAME HIGH LOW CLOSE
RELATIVE
STRENGTH
INDEX
1
BHARAT PETROLEUM
CORP LTD
780.9 768 770 51.41
2 CAIRN INDIA LTD 245 235.5 245 43.91
3 GAIL INDIA LTD 408.1 397.6 405 34.71
4 NTPC LTD 158.7 155.2 156.25 42.76
5
OIL& NATURAL GAS
CORP LTD
321.45 317.4 321.05 42.33
6
POWER GRID CORP OF
IND LTD
273.7 266.05 273 63.86
7
RELIANCE INDUSTRIES
LTD
898.75 878.15 892.5 31.88
8 TATA POWER CO.LTD 85.9 84 84.35 48.5
72
CHART 4.35
RELATIVE STRENGTH INDEX FOR OIL AND GAS INDUSTRY
0
10
20
30
40
50
60
70
PERCENTAGE
COMPANY NAME
73
4.37 WILLIAMS % R FOR OIL AND GAS INDUSTRY
The table 4.36 shows the buy/sell signal of oil and gas industry using williams % r.
TABLE 4.36
WILLIAMS % R FOR OIL AND GAS INDUSTRY
S.NO COMPANY NAME HIGH LOW CLOSE
WILLIAMS
% R
1
BHARAT PETROLEUM
CORP LTD
780.9 768 770 -13.12
2 CAIRN INDIA LTD 245 235.5 245 -45.41
3 GAIL INDIA LTD 408.1 397.6 405 -82.2
4 NTPC LTD 158.7 155.2 156.25 -29.81
5
OIL& NATURAL GAS
CORP LTD
321.45 317.4 321.05 -53.7
6
POWER GRID CORP OF
IND LTD
273.7 266.05 273 -15.03
7
RELIANCE INDUSTRIES
LTD
898.75 878.15 892.5 -87.5
8 TATA POWER CO.LTD 85.9 84 84.35 -33.32
Source: Karvy Stock Broking Ltd
INFERENCE
In this table 4.36 Williams %R indicates investors to buy the Gail India Ltd,
Reliance Industries Ltd shares, also indicate to sell the Bharat Petroleum Corp Ltd,
Power Grid Corp Of Ind Ltd shares and it also suggest the investors stay out from the
stock of following companies shares Cairn India Ltd, NTPC Ltd, Oil& Natural Gas
Corp Ltd,Tata Power Co Ltd.
74
CHART 4.36
WILLIAMS % R FOR OIL AND GAS INDUSTRY
-90
-80
-70
-60
-50
-40
-30
-20
-10
0
PERCENTAGE
COMPANY NAME
75
4.38 COMMODITY CHANNEL INDEX FOR PHARMATICAL INDUSTRY
The table 4.37 shows the buy/sell signal of oil and gas industry using
commodity channel index
TABLE 4.37
COMMODITY CHANNEL INDEX FOR PHARMATICAL INDUSTRY
S.NO COMPANY NAME HIGH LOW CLOSE
COMMODITY
CHANNEL
INDEX
1 CIPLA LTD 746.4 725 730 -145
2
DR.REDDY’S
LABORATORIES
LTD
155.85 151.55 154.45 -0.22
3 LUPIN LTD 1,843.40 1,776.05 1,781.10 140.3
4
SUN PHARMA
INDUSTRIES LTD
1,045.95 1,005.50 1,018.00 -43.72
Source: Karvy Stock Broking Ltd
INFERENCE
In this table 4.37 commodity channel index indicates investors to buy the Cipla
Ltd shares, also indicate to sell the Lupin Ltd shares and it also suggest the investors
stay out from the stock of following companies shares Dr.Reddy’s Laboratories Ltd,
Sun Pharma Industries Ltd.
CHART 4.37
COMMODITY CHANNEL INDEX FOR PHARMATICAL INDUSTRY
-200
0
200
PERCENTAGE
COMPANY NAME
76
4.39 FAST STOCHASTIC FOR PHARMATICAL INDUSTRY
The table 4.38 shows the buy/sell signal of oil and gas industry using fast
stochastic.
TABLE 4.38
FAST STOCHASTIC FOR PHARMATICAL INDUSTRY
S.NO COMPANY NAME HIGH LOW
CLOS
E
FAST
STOCHASTI
C
1 CIPLA LTD 746.4 725 730 20.6
2
DR.REDDY’S
LABORATORIES LTD
155.85 151.55 154.45 35.6
3
LUPIN LTD
1,843.40
1,776.0
5
1,781.1
0
64.73
4
SUN PHARMA
INDUSTRIES LTD
1,045.95
1,005.5
0
1,018.0
0
48.32
Source: Karvy Stock Broking Ltd
INFERENCE
In this table 4.38 fast stochastic indicates investors to buy the Cipla Ltd shares
and it also suggest the investors stay out from the stock of following companies shares
Dr.Reddy’s Laboratories Ltd, Lubin Ltd, Sun Pharma Industries Ltd.
CHART 4.38
FAST STOCHASTIC FOR PHARMATICAL INDUSTRY
0
20
40
60
80
PERCENTAGE
COMPANY NAME
77
4.40 RELATIVE STRENGTH INDEX FOR PHARMATICAL INDUSTRY
The table 4.39 shows the buy/sell signal of pharmacy industry using relative
strength index..
TABLE 4.39
RELATIVE STRENGTH INDEX FOR PHARMATICAL INDUSTRY
S.NO COMPANY NAME HIGH LOW CLOSE
RELATIVE
STRENGTH
INDEX
1 CIPLA LTD 746.4 725 730 46.75
2
DR.REDDY’S
LABORATORIES LTD
155.85 151.55 154.45 50.73
3
LUPIN LTD
1,843.40
1,776.0
5
1,781.1
0
55.81
4
SUN PHARMA
INDUSTRIES LTD
1,045.95
1,005.5
0
1,018.0
0
42.41
Source: Karvy Stock Broking Ltd
INFERENCE
In this table 4.39 RSI indicates investors to buy the Dr.Reddy’s Laboratories
Ltd, Lubin Ltd shares and it also suggest the investors stay out from the stock of
following companies shares Cipla Ltd, Sun Pharma Industries Ltd.
CHART 4.39
RELATIVE STRENGTH INDEX FOR PHARMATICAL INDUSTRY
0
20
40
60
PERCENTAGE
COMPANY NAME
78
4.41 WILLIAMS % R FOR PHARMATICAL INDUSTRY
The table 4.40 shows the buy/sell signal of pharmacy industry using williams % r.
TABLE 4.40
WILLIAMS % R FOR PHARMATICAL INDUSTRY
S.NO COMPANY NAME HIGH LOW CLOSE
WILLIAMS
% R
1 CIPLA LTD 746.4 725 730 -82.4
2
DR.REDDY’S
LABORATORIES LTD
155.85 151.55 154.45 -67.4
3
LUPIN LTD
1,843.40
1,776.0
5
1,781.1
0
-35.45
4
SUN PHARMA
INDUSTRIES LTD
1,045.95
1,005.5
0
1,018.0
0
-34.33
Source: Karvy Stock Broking Ltd
INFERENCE
In this table 4.40 Williams % R indicates investors to buy the Cipla Ltd, Sun
Pharma Industries Ltd shares and it also suggest the investors stay out from the stock of
following companies shares Dr.Reddy’s Laboratories Ltd, Lubin Ltd.
CHART 4.40
WILLIAMS % R FOR PHARMATICAL INDUSTRY
-100
-80
-60
-40
-20
0
PERCENTAGE
COMPANY NAME
79
4.42. COMMODITY CHANNEL INDEX FOR SOFTWARE INDUSTRY
The table 4.41 shows the buy/sell signal of software industry using commodity
channel index
TABLE 4.41
COMMODITY CHANNEL INDEX FOR SOFTWARE INDUSTRY
S.NO
COMPANY
NAME
HIGH LOW CLOSE
COMMODITY
CHANNEL
INDEX
1
HCL
TECHNOLIGIES
LTD
2,074.90 2,035.95 2,036.00 -95.67
2 INFOSYS LTD 946.35 913.45 913.45 0.59
3 TCS LTD 2,770.70 2,681.05 2,750.00 32.5
4
TECH
MAHINDRA LTD
2,912.80 2,851.10 2,880.00 -56.69
5 WIPRO LTD 669.9 655.25 659.9 -105.9
Source: Karvy Stock Broking Ltd
INFERENCE
In this table 4.41 commodity channel index indicates investors to sell the wipro
ltd shares and it also suggest the investors stay out from the stock of following
companies shares Hcl Technologies Ltd, Infosys Ltd, TCS Ltd, Tech Mahindra Ltd.
80
CHART 4.41
COMMODITY CHANNEL INDEX FOR SOFTWARE INDUSTRY
-120
-100
-80
-60
-40
-20
0
20
40
PERCENTAGE
COMPANY NAME
81
4.43 FAST STOCHASTIC FOR SOFTWARE INDUSTRY
The table 4.42 shows the buy/sell signal of software industry using fast
stochastic
TABLE 4.42
FAST STOCHASTIC FOR SOFTWARE INDUSTRY
S.NO
COMPANY
NAME
HIGH LOW CLOSE
FAST
STOCHASTIC
1
HCL
TECHNOLIGIES
LTD
2,074.90 2,035.95 2,036.00 18.09
2 INFOSYS LTD 946.35 913.45 913.45 57.56
3 TCS LTD 2,770.70 2,681.05 2,750.00 50.65
4
TECH
MAHINDRA LTD
2,912.80 2,851.10 2,880.00 24.34
5 WIPRO LTD 669.9 655.25 659.9 75.4
Source: Karvy Stock Broking Ltd
INFERENCE
In this table 4.42 fast stochastic indicates investors to buy the HCL
Technologies Ltd shares and it also suggest the investors stay out from the stock of
following companies shares Wipro ltd, Infosys Ltd, TCS Ltd, Tech Mahindra Ltd.
82
CHART 4.42
FAST STOCHASTIC FOR SOFTWARE INDUSTRY
0
10
20
30
40
50
60
70
80
PERCENTAGE
COMPANY NAME
83
4.44 RELATIVE STRENGTH INDEX FOR SOFTWARE INDUSTRY
The table 4.43 shows the buy/sell signal of software industry using relative
strength index
TABLE 4.43
RELATIVE STRENGTH INDEX FOR SOFTWARE INDUSTRY
S.NO
COMPANY
NAME
HIGH LOW CLOSE
RELATIVE
STRENGTH
INDEX
1
HCL
TECHNOLIGIES
LTD
2,074.90 2,035.95 2,036.00 40.87
2 INFOSYS LTD 946.35 913.45 913.45 54.45
3 TCS LTD 2,770.70 2,681.05 2,750.00 47.98
4
TECH
MAHINDRA LTD
2,912.80 2,851.10 2,880.00 52.18
5 WIPRO LTD 669.9 655.25 659.9 55.63
Source: Karvy Stock Broking Ltd
INFERENCE
In this table 4.43 RSI indicates investors to sell the TCS Ltd, Tech Mahindra
Ltd shares and it also suggest the investors stay out from the stock of following
companies shares Wipro ltd, Infosys Ltd, HCL Technologies Ltd.
84
CHART 4.43
RELATIVE STRENGTH INDEX FOR SOFTWARE INDUSTRY
0
10
20
30
40
50
60
PERCENTAGE
COMPANY NAME
85
4.45 WILLIAMS %R FOR SOFTWARE INDUSTRY
The table 4.44 shows the buy/sell signal of software industry using williams %R
TABLE 4.44
WILLIAMS %R FOR SOFTWARE INDUSTRY
S.NO
COMPANY
NAME
HIGH LOW CLOSE
WILLIAMS
% R
1
HCL
TECHNOLIGIES
LTD
2,074.90 2,035.95 2,036.00 -85.86
2 INFOSYS LTD 946.35 913.45 913.45 -43.94
3 TCS LTD 2,770.70 2,681.05 2,750.00 -48.64
4
TECH
MAHINDRA LTD
2,912.80 2,851.10 2,880.00 -75.89
5 WIPRO LTD 669.9 655.25 659.9 -23.65
Source: Karvy Stock Broking Ltd
INFERENCE
In this table 4.44 Williams %R indicates investors to sell the TCS Ltd shares,
also indicates to buy the HCL Technologies Ltd shares and it also suggest the investors
stay out from the stock of following companies shares Wipro ltd, Infosys Ltd, Tech
Mahindra Ltd..
CHART 4.44
WILLIAMS % R FOR SOFTWARE INDUSTRY
-100
-50
0
PERCENTAGE
COMPANY NAME
86
4.46 COMMODITY CHANNEL INDEX FOR TELECOMMUNICATION
INDUSTRY
The table 4.45 shows the buy/sell signal of telecom industry using commodity
channel index.
TABLE 4.45
COMMODITY CHANNEL INDEX FOR TELECOMMUNICATION
INDUSTRY
S.NO
COMPANY
NAME
HIGH LOW CLOSE
COMMODITY
CHANNEL
INDEX
1
BHARTI
AIRTEL LTD
351.9 344.05 351.4 -10.72
Source: Karvy Stock Broking Ltd
INFERENCE
In this table 4.45 Commodity Channel Index suggest the investors to stay out
from the stock
CHART 4.45
COMMODITY CHANNEL INDEX FOR TELECOMMUNICATION
INDUSTRY
-12
-10
-8
-6
-4
-2
0
PERCENTAGE
COMPANY NAME
BHARTI AIRTEL LTD
87
4.47 FAST STOCHASTIC FOR TELECOMMUNICATION INDUSTRY
The table 4.46 shows the buy/sell signal of telecom industry using fast stochastic
TABLE 4.46
FAST STOCHASTIC FOR TELECOMMUNICATION INDUSTRY
S.NO
COMPANY
NAME
HIGH LOW CLOSE
FAST
STOCHASTIC
1
BHARTI
AIRTEL LTD
351.9 344.05 351.4
67.67
Source: Karvy Stock Broking Ltd
INFERENCE
In this table 4.46 Fast Stochastic suggest the investors to stay out from the stock
CHART 4.46
FAST STOCHASTIC FOR TELECOMMUNICATION INDUSTRY
0
10
20
30
40
50
60
70
PERCENTAGE
COMPANY NAME
BHARTI AIRTEL LTD
88
4.48 RELATIVE STRENGTH INDEX FOR TELECOM INDUSTRY
The table 4.47 shows the buy/sell signal of telecom industry using relative
strength index
TABLE 4.47
RELATIVE STRENGTH INDEX FOR TELECOM INDUSTRY
S.NO
COMPANY
NAME
HIGH LOW CLOSE
RELATIVE
STRENGTH
INDEX
1
BHARTI
AIRTEL LTD
351.9 344.05 351.4 42.06
Source: Karvy Stock Broking Ltd
INFERENCE
In this table 4.47 RSI suggest the investors to stay out from the stock
CHART 4.47
RELATIVE STRENGTH INDEX FOR TELECOMMUNICATION INDUSTRY
0
10
20
30
40
50
PERCENTAGE
COMPANY NAME
BHARTI AIRTEL LTD
89
4.49 WILLIAMS %R FOR TELECOM INDUSTRY
The table 4.48 shows the buy/sell signal of telecom industry using williams %R
TABLE 4.48
WILLIAMS %R FOR TELECOM INDUSTRY
S.NO
COMPANY
NAME
HIGH LOW CLOSE
WILLIAMS
% R
1
BHARTI
AIRTEL LTD
351.9 344.05 351.4 -34.33
Source: Karvy Stock Broking Ltd
INFERENCE
In this table 4.48 Williams %R suggest the investors to stay out from the stock.
CHART 4.48
WILLIAMS %R FOR TELECOMMUNICATION INDUSTRY
-35
-30
-25
-20
-15
-10
-5
0
PERCENTAGE
COMPANY NAME
BHARTI AIRTEL LTD
90
CHAPTER V
FINDINGS, SUGGESTIONS AND CONCLUSION
5.1 INTRODUCTION
In this study an attempt is made to analyze the nifty 50 scrip in karvy stock
broking ltd using technical indicators. This study is based on secondary data.
Secondary data were collected from website, books, news papers, television, and
magazines. The study is undertaken during the period from January to February 2015.
The collected data were analysed with the help of Commodity Channel Index, Fast
Stochastic ,Williams %R and RSI . The summary of findings of the study based on the
analysis is presented in this part.
5.2 FINDINGS
5.2.1.AUTO MOBILE INDUSTRY
HERO MOTOCORP LTD
Commodity Channel Index, Fast stochastic, RSI, Williams %R suggest the
investor the investors to stay out from the stock.
MAHNDRA AND MAHINDRA
Commodity Channel Index, Fast stochastic, RSI, Williams %R suggest the
investor the investors to stay out from the stock.
MARUTI SUZUKI INDIA LTD
Commodity Channel Index, Fast stochastic, Williams %R indicates buy signal
and RSI suggests the investors to stay out from the stock.
TATA MOTORS LTD
Commodity Channel Index, Fast stochastic, Williams %R suggests the investors
to stay out from the stock and RSI indicates sell signal.
BAJAJ AUTO LTD
Commodity Channel Index, Fast stochastic, RSI suggests the investors to stay
out from the stock and Williams %R indicates sell signal.
91
5.2.2.BANKING INDUSTRY
AXIS BANK
Commodity Channel Index, Fast stochastic, RSI, Williams %R suggests the
investors to buy the stock
BANK OF BARODA
Commodity Channel Index, Fast stochastic, RSI, Williams %R suggests the
investors to stay out from the stock.
HDFC BANK LTD
Commodity Channel Index, Fast stochastic, RSI, Williams %R suggests the
investors to buy the stock.
ICICI BANK LTD
Commodity Channel Index, Fast stochastic, Williams %R suggests the
investors to stay out from the stock and RSI suggests the investors to sell the stock
IDFC LTD
Commodity Channel Index, Fast stochastic, Williams %R, RSI suggests the
investors to stay out from the stock.
INDUSLAND BANK LTD
Commodity Channel Index, RSI suggests the investors to stay out from the
stock and Fast stochastic and Williams %R suggest to buy the stock.
KOTAK MAHINDRA BANK LTD
Commodity Channel Index, RSI, Fast stochastic and Williams %R suggest to
buy the stock.
PUNJAB NATIONAL BANK
Commodity Channel Index, RSI suggests the investor to stay out from the
stock,Fast stochastic and Williams %R suggests the investors to buy the stock
STATE BANK OF INDIA
Commodity Channel Index, RSI, Fast stochastic and Williams %R suggests the
investors to stay out from the stock.
92
5.2.3.CEMENT INDUSTRY
ACC LTD
Commodity Channel Index, Fast stochastic and Williams %R indicates buy
signal and RSI suggests the investors to stay out from the stock.
AMBUJA CEMENTS LTD
Commodity Channel Index, RSI suggests the investors to stay out from the
stock,Fast Stochastic and Williams %R indicates buy signal.
GRASIM INDUSTRY LTD
Commodity Channel Index, ,Fast Stochastic and Williams %R suggests the
investors to stay out from the stock and RSI indicates sell signal.
ULTRATECH CEMENT LTD
Commodity Channel Index suggests the investors to stay out from the stock and
Fast Stochastic, Williams %R and RSI indicates buy signal
TORRENT POWER COMPANY LTD
Channel Index, RSI suggests the investors to stay out from the stock, Fast
Stochastic and Williams %R indicates sell signal.
5.2.4.CONSTRUCTION INDUSTRY
DLF LTD
Commodity Channel Index ,Fast Stochastic and Williams %R indicates buy
signal, RSI suggests the investors to stay out from the stock
LARSEN &TOUBRO LTD
Commodity Channel Index, Fast Stochastic and Williams %R suggests the
investors to stay out from the stock and RSI indicate buy signal
5.2.5.CONSUMER GOODS INDUSTRY
ASIAN PAINTS LTD
Commodity Channel Index indicate sell signal, Fast Stochastic ,Williams %R
and RSI suggests the investors to stay out from the stock
93
HINDUSTAN UNILIVER LTD
Commodity Channel Index, Fast Stochastic ,Williams %R and RSI suggests the
investors to stay out from the stock
ITC LTD
Commodity Channel Index, Fast Stochastic ,Williams %R suggests the
investors to stay out from the stock and RSI indicates buy signal.
5.2.6.ENTERTAINMENT INDUSTRY
ZEE ENTERTAINMENT ENTERPRICE LTD
Commodity Channel Index, Fast Stochastic ,Williams %R, RSI suggests the
investors to buy the stock.
5.2.7. INDUSTRIAL MANUFACTURING INDUSTRY
BHARAT HEAVY ELETRICAL LTD
Commodity Channel Index, Fast Stochastic ,Williams %R suggest the investors
to stay out from the stock and RSI indicate sell signal
5.2.8. METAL AND MIMING INDUSTRY
COAL INDIA LTD
Commodity Channel Index, Fast Stochastic ,RSI suggest the investors to stay
out from the stock and Williams %R indicate sell signal.
HINDALCO INDUSTRIES LTD
Commodity Channel Index, Fast Stochastic and Williams %R indicate buy
signal and RSI suggest the investors to stay out from the stock
JINDAL STEEL AND POWER LTD
Commodity Channel Index, Fast Stochastic and Williams %R indicate buy
signal and RSI suggest the investors to stay out from the stock
94
NMDC LTD
Commodity Channel Index, Fast Stochastic, Williams %R and RSI suggest the
investors to sell the stock
SESA STERLITE LTD
Commodity Channel Index, Fast Stochastic, Williams %R and RSI suggest the
investors to stay out from the stock.
TATA STEEL LTD
Commodity Channel Index, Fast Stochastic, Williams %R and RSI suggest the
investors to stay out from the stock.
5.2.9.OIL AND GAS INDUSTRY
BHARAT PETROLIAM CORP LTD
Commodity Channel Index suggest investors to stay out from the stock, Fast
Stochastic, Williams %R and RSI indicate sell the stock
CAIRN INDIA LTD
Commodity Channel Index, Fast Stochastic, Williams %R and RSI suggest
investors to stay out from the stock.
GAIL INDIA LTD
Commodity Channel Index, Fast Stochastic, Williams %R indicate buy signal
and RSI suggest investors to stay out from the stock
NTPC LTD
Commodity Channel Index, Fast Stochastic, Williams %R and RSI suggest
investors to stay out from the stock.
OIL AND NATURAL GAS CORP LTD
Commodity Channel Index, Fast Stochastic, Williams %R and RSI suggest
investors to stay out from the stock
POWER GRID CORP OF INDIA LTD
Commodity Channel Index, RSI suggest investors to stay out from the stock,
Fast Stochastic and Williams %R indicate sell signal
95
RELIANCE INDUSTRIES LTD
Commodity Channel Index, Fast Stochastic, Williams %R indicate buy signal
and RSI suggest investors to stay out from the stock.
TATA POWER CO
Commodity Channel Index, Fast Stochastic, Williams %R suggest the investors
to stay out from the stock and RSI indicate buy signal
5.2.10.PHARMACY INDUSTRY
CIPLA LTD
Commodity Channel Index, Fast Stochastic, Williams %R indicate buy signal
and RSI suggest the investors to stay out from the stock
DR.REDDY LAB LTD
Commodity Channel Index, Fast Stochastic, Williams %R suggest the investors
to stay out from the stock and RSI indicate buy signal
LUBIN LTD
Commodity Channel Index indicates sell signal, Fast Stochastic, Williams %R
suggest the investors to stay out from the stock and RSI indicate buy signal
SUN PHARMA INDUSTRIES LTD
Commodity Channel Index, Fast Stochastic, RSI suggest the investors to stay
out from the stock and Williams %R indicate buy signal
5.2.11 .SOFTWARE INDUSTRY
HCL TECHNOLOGIES LTD
Commodity Channel Index, RSI suggest the investors to stay out from the stock
and Fast Stochastic , Williams %R indicate buy signal.
INFOSYS LTD.
Commodity Channel Index, RSI, Fast Stochastic and Williams %R suggest the
investors to stay out from the stock .
96
TCS LTD
Commodity Channel Index, Fast Stochastic suggest the investors to stay out
from the stock and RSI, Williams %R indicates sell signal.
TECH MAHINDRA LTD
Commodity Channel Index, Fast Stochastic, Williams %R suggest the investors
to stay out from the stock and RSI indicates sell signal
WIPRO LTD
Fast Stochastic, RSI, Williams %R suggest the investors to stay out from the
stock and Commodity Channel Index indicates sell signal
5.2.12.TELECOME INDUSTRY
BHARTI AIRTEL LTD.
Commodity Channel Index ,Fast Stochastic, RSI, Williams %R suggest the
investors to stay out from the stock
97
5.3 SUGGESTION
 While evaluating the shares fluctuation in nifty, traders and investors
can predict the investors capital through the volume based indicators.
 By analyzing the four indicators , it is found that RSI and Commodity
Channel Index are provide a reliable suggestion while compared to other
indicators. Therefore both the traders and investors can follow these
indicators..
 Each indicators provides different type of suggestion . for example while
RSI shows the stock to hold for long term, other one that stochastic
show to sell for short term. Therefore the investors should not always
follow the same indicators.
 The indicators are using by traders/ investors to make money in stock
market as it shows the trend of a specific stock or an index by helping
them to predict the future movement of share price. therefore ,it is
essential for the investors and watching market. But sometime its fail to
predict the future accurately.
 Hence its vital to the investors to follow fundamental analysis and
company analysis. Then only they can make money in a profitable
manner.
98
5.3 CONCLUSION
The study “A technical analysis on nifty scrip using technical indicators in
Karvy stock broking ltd” analyses the price movement of 12 industries under nifty by 4
indicators namely commodity Channel Index, Fast stochastic , RSI and Williams % R
and 14 leave days effect of karvy stock broking ltd on the share price.
The study reveals that there will be a frequent fluctuation in the share market, so
its difficulty to predict the stock price movement. In order to avoid such difficulties the
company has to make constant research and the investors has to do regular market
watch. It is concluded that there is a lack of perfectness in guidance of technical
indicators. Thus the investor get different guidance while making investment. So they
should aware about the indicators strength and drawbacks. For this purpose the
company can conduct awareness program regarding the effectiveness of technical
indicators to the both the traders and investors. And the leave days create the good
opportunity for the investors to make investment in the stock by offering the possibility
for the growth in the share price. Technical analysis help the investor and trader to add
the stocks in their portfolio. Even though the technical indicators help to know the
trend, it becomes to be failed when the fundamental news suddenly get strong.
99
BIBLIOGRAPHY
JOURNAL & MAGAZINE
1.Taylor, M.P. and H. Allen, “The use of Technical Analysis in the Foreign Exchange
Market,” Journal of International Money and Finance, Volume 11, 1992,
2.fama,E., “The Behaviour of Stock Market Prices,” Journal of Business, volume 11,
1992,Pp . 34-105
3.fern`Andez- Rodr`Iguez, Fernando,. “on the profitability of Technical Trading
Rules based on Artificial Neural Networks: Evidence from the Madrid stock market.”
Economic Letters ,Volume 69(1), 2000Pp. 89-94.
4.Levich, R. and L.Thomas, the significance of Technical Trading Rule Profits in the
Foreign Exchange Market: A Bootstrap Approach, Journal of International Money and
Finance, Volume 12, 1993 Pp .451-474.
5.Jenni L.Bettman, Stephen j.Sault , Emma L. Schultz, “Applying Fundamental
Analysis and Neural Networks in the Australian Stock market” . International
Conference on Artificial Intelligence in Science and Technology (AISAT) September
2008.
100
WEBSITES
www.nseindia.com
www.icharts.com
www.karvy.com
www.investopedia.com
www.day-trading.com
www.oninetradingconcepts.com
www.stockcharts.com
www.incrediblecharts.com
www.traderji.com
www.buzzingstocks.com
www.answers.com

using technical indicator to analyse NIFTY scrip withspecial reference of karvy stock broking ltd.

  • 1.
    1 CHAPTER 1 INTRODUCTION ANDDESIGN OF THE STUDY 1.1 INTRODUCTION Technical analysis is a method of evaluating securities by analyzing the statistics generated by market activity, such as past prices and volume. Technical analysis do not attempt to measure a security’s intrinsic value, but instead of use charts and other tool to identify patterns that can suggest future activity. Just as there are many investment styles on the fundamental side, there are also many different type of technical traders. Some rely on chart patterns; others use technical indicators and oscillators, and most use some combination of the two. In any case, technical analysts exclusive use of historical price and volume data is what separates them from their fundamental counterparts. Unlike fundamental analysts, technical analysts don’t care whether a stock is undervalued –the only thing that matters is a security’s past trading data and what information this data can provide about where the security might move in the future. Technical analysis mainly seeks to predict the short term price travels. It is important criteria for selecting the company to invest. It also provides the base for decision making in investment. The one of the most frequently used yardstick to check & analyze underlying price progress. For that matter a variety of tools was consider. This technical analysis is helpful to general investor in many ways. It provides important and vital information regarding the current position of the company. Technical analysis involves the use of various methods for charting, calculating, and interpreting graph and chart to assess the performances and status of the price. It is the tool of financial analysis, which not only studies but also reflecting the numerical and graphical relationship between the important financial factors. The focus of technical analysis is mainly on the internal market data, i.e., prices and volume data. It appeals mainly to short term traders. It’s the oldest approach to equity investment dating back to the late 19th century. It uses
  • 2.
    2 chart and computerprograms to study the stock’s trading volume and price movements in the hope of identifying a trend. 1.2 STATEMENT OF PROBLEM In the current scenario, technical analysis plays a vital role in online trading. It is widely used among traders and financial professionals, and is very often used by active day traders, market makers, and pit traders. Some rely on chart patterns; other use technical indicators and oscillators, and most use some combination of the two. It appeals mainly to short term traders by providing information on the best entry and exit points for a trade. Frequent fluctuations in the share market makes difficult to predict the stock price movements. with the help of 4 technical indicators , RSI, Commodity Channel Index, Williams % R and Fast Stochastic, the researcher shows effective analysis on the market share price movements. The researcher selected this topic to create awareness among the investors and traders regarding the technical indicator to make profitable investment in future. 1.3 OBJECTIVE OF THE STUDY  To analyze the perfectness of the indicators on nifty scrip.  To study the different guidance variation by using different indicator. 1.4 REVIEW LITERATURE Taylor and Allen1 in their paper titled, “The Use of Technical Analysis in the foreign Exchange Market” conducted a UK survey of forex dealers on behalf of the bank of England, ad found that at least 90% of the respondents placed some weight on technical analysis for decision making. It has been suggested that due to its high usage , technical analysis may, in fact, be becoming a self-fulfilling methodology. In other words, if enough people follow the principles, then those principles can be expected to become manifest in the character of price time series. To complete the discussion regarding technical analysis, it is occasionally stated that as technical rules become more widely known, the abnormal returns they attempt to identify will be reduced and the usefulness of the technical rule itself will be destroyed.
  • 3.
    3 Fama. E2 inhis paper titled “The Behaviour of Stock Market Prices” explained that the random-walk theory has held sway. This theory state that successive price changes in stock price are independent, identically distributed random variables. The important implication of this hypothesis is that it implies that a series of price changes has no memory, which further implies that the study of past prices cannot provide useful contribution to predicting future prices. As the majority of technical analysis focuses on forecasts based on past price behavior , the natural conclusion is that Technical Analysis cannot work. Levich and Thomas3 in their paper titled “ The significance of Technical Trading Rule Profits in the Foreign Exchange Markets” A Bootstrap approach examined currency futures contracts in five currencies over the period 1976 to 1990. They report persistent trading profits over the 15 year period using a variety of commonly reached moving average rules. Levich and Thomas concluded “the profitability of trend following rules strongly suggest some form of serial dependency in the data, but the nature of the dependency remains unclear”. Fern`andez- rodr`iguez, Gonz` alez-Martel and Sosvilla-Rivero4 in their project titled “Profitability of Technical Trading Rules Based on Artificial Neural Networks” Evidence from the Madrid Stock Market: reviewed that in the absence of trading costs, the technical trading rule is always superior to a buy and hold strategy for both ‘bear’ market and ‘stable’ market episodes, but not in a ‘bull’ market. One critism they have is that beating the market in the absence of costs seems of little significance unless one is interested in finding a signal which will later be incorporated into a full system. Secondly, it is perhaps naïve to work on the premise that ‘bull’ and ‘bear’ markets exist. Jenni L.Bettman, Stephen J.Sault, Emma L.Schultz5 in their paper titled “Applying Fundamental Analysis and Neural Networks in the Australian Stock market” reviewed although the fundamental and technical analysis literatures invest considerable effort in assessing their respective ability to explain share price, they invariably do so without reference to each other. In this context, they propose an equity valuation model integrating both fundamental and technical analysis and in doing so, recognize their potential as complements rather than as substitutes. Testing
  • 4.
    4 confirms the complementarynature of fundamental and technical analysis by showing that, although each performs well in isolation, models integrating both have superior explanatory power. While their findings relate to the valuation of shares, they also have implications for other valuation exercises. 1.5 SCOPE OF THE STUDY  In current scenario technical analysis is a proven method for stock trading.  This study is confined only to the indicators analysis of technical analysis  The study focuses on the technical analysis to participate in the investment decision.  The buy / sell signals are generated by the indicators based on the volume, trend, oscillation and volatility. 1.6 LIMITATION OF THE STUDY  The indicators analysis has been used to identify only the nifty shares.  Too much of fluctuations in the share price.  More importance as been given to the subject matter of technical analysis only.  The wide range of chart-patterns and trends may create confusion while going through these. 1.7 RESEARCH METHODOLOGY 1.7.1 RESEARCH DESIGN The research design is Analytical Research. It includes surveys and fact – finding enquiries of different kinds. The major purpose of descriptive research is description of the state of affairs as it exists at present. 1.7.2 DATA COLLECTION The data collection is done through the Secondary Data. It means data are collected from internet, daily news papers, television, and magazines and so on.
  • 5.
    5 1.7.3 TOOLS USED 1.Williams %R 2. Commodity Channel Index [CCI] 3. Relative Strength Index [RSI] 4. Stochastic Oscillator [Fast] 1.8 CHAPTERIZATION The project title “ A STUDY ON TECHNICAL ANALYSIS ON NIFTY SCRIP USING TECHNICAL INDICTORS WITH SPECIAL REFERENCE TO KARVY STOCK BROKING LIMIED.” The report is organized into five chapters as mentioned below. Chapter-1 It consists of Introduction, Statement of problem, Objectives of the study, review of literature, Scope of the study, Limitation of the study, Research methodology, and Chapterisation Chapter-2 It consists of Industry profile and company profile. Chapter-3 It consists of theoretical view of technical analysis. Chapter-4 It present the Data analysis and Interpretation. Chapter-5 It consists of Findings ,Suggestions, and Conclusion.
  • 6.
    6 FOOD NOTES 1.Taylor, M.P.and H. Allen, “The use of Technical Analysis in the Foreign Exchange Market,” Journal of International Money and Finance, Volume 11, 1992, Pp.304-314 2.Fama,E., “The Behaviour of Stock Market Prices,” Journal of Business, volume 11, 1992,Pp . 34-105 3.Fern`Andez- Rodr`Iguez, Fernando,. “Profitability of Technical Trading Rules based on Artificial Neural Networks: Evidence from the Madrid stock market.” Economic Letters ,Volume 69(1), 2000Pp. 89-94. 4.Levich, R. and L.Thomas, “The significance of Technical Trading Rule Profits in the Foreign Exchange Market: A Bootstrap Approach, Journal of International Money and Finance, Volume 12, 1993 Pp .451-474. 5.Jenni L.Bettman, Stephen j.Sault , Emma L. Schultz, “Applying Fundamental Analysis and Neural Networks in the Australian Stock market” . International Conference on Artificial Intelligence in Science and Technology (AISAT) September 2008.
  • 7.
    7 CHAPTER – 2 INDUSTRIALPROFILE & COMPANY PROFILE 2.1 INDUSTRIAL PROFILE 2.1.1 INTRODUCTION A Stock brokerage firm, or simply brokerage, is a financial institution that facilitates the buying and selling of financial securities between a buyer and a seller. Brokerage firms serve a clientele of investors who trade public stocks and other securities, usually through the firm's agent stockbrokers. A traditional, or "full service," brokerage firm usually undertakes more than simply carrying out a stock or bond trade. The staff of this type of brokerage firm is entrusted with the responsibility of researching the markets to provide appropriate recommendations and in so doing they direct the actions of pension fund managers and portfolio managers alike. These firms also offer margin loans for certain approved clients to purchase investments on credit, subject to agreed terms and conditions. Traditional brokerage firms have also become a source of up-to-date stock prices and quotes. The Securities Brokerage Industry is cyclical and comprised of two distinct types of business. Brokerages, also known as financial services companies, strive to meet the investing needs of their clients, and exchanges facilitate securities trading. Net profits correlate to the performance of the broader equity market. Some hold up better than their peers during bear markets. 2.1.2 EVOLUTION OF SHARE MARKET INDUSTRY The stock markets in India are one of the oldest in the world and have a strong presence and network of domestic and local intermediaries. Owing to the high incidence of indigenous equity broking, India got a Native Share Brokers’ Association as early as 1875; this association later came to be known as the Bombay Stock Exchange (BSE). In 1864, there were more than 1,000 brokers in Mumbai who traded in stocks; high premium was also a familiar concept during that time. One of the earliest stock market booms that occurred in 1860s after the American Civil War led to
  • 8.
    8 the creation ofmany joint stock cotton/ginning mills and this phenomena stirred an equity culture that saw share prices touch stratospheric levels. In the 1970s the Foreign Exchange Regulation Act (FERA) was introduced that encouraged multinational companies to divest their foreign equity; this phenomenon gave a fresh impetus to retail investing. The Securities and Exchange Board of India (SEBI), which was set up in 1988 as an administrative arrangement, was given statutory powers after the enactment of the SEBI Act in 1992. The main function of SEBI was to protect investor interests in securities, to promote the development of securities markets and to regulate the securities markets. Early Years The equity brokerage industry in India is one of the oldest in the Asia region. India had an active stock market for about 150 years that played a significant role in developing risk markets as also promoting enterprise and supporting the growth of industry.The roots of a stock market in India began in the 1860s during the American Civil War that led to a sudden surge in the demand for cotton from India resulting in setting up of a number of joint stock companies that issued securities to raise finance. This trend was akin to the rapid growth of securities markets in Europe and the North America in the background of”. A unique feature of the stock market development in India was that that it was entirely driven by local enterprise, unlike the banks which during the pre-independence period were owned and run by the British. Following the establishment of the first stock exchange in Mumbai, other stock exchanges came into being in major cities in India, namely Ahmedabad (1894), Calcutta (1908), Madras (1937), Uttar Pradesh and Nagpur (1940) and Hyderabad (1944). The stock markets gained from surge and boom in several industries such as jute (1870s), tea (1880s and 1890s), coal (1904 and 1908) etc, at different points of time.
  • 9.
    9 Beginning of anew equity culture A new phase in the Indian stock markets began in the 1970s, with the introduction of Foreign Exchange Regulation Act (FERA) that led to divestment of foreign equity by the multinational companies, which created a surge in retail investing. The early 1980s witnessed another surge in stock markets when major companies such as Reliance accessed equity markets for resource mobilization that evinced huge interest from retail investors. Rapid Growth The last decade has been exceptionally good for the stock markets in India. In the back of wide ranging reforms in regulation and market practice as also the growing participation of foreign institutional investment, stock markets in India have showed phenomenal growth in the early 1990s. The stock market capitalization in mid-2007 is nearly the same size as that of the gross domestic product as compared to about 25 percent of the latter in the early 2000s. Investor base continued to grow from domestic and international markets. The value of share trading witnessed a sharp jump too. 2.1.3 FINANCIAL MARKET Capital Market The capital market is a market for financial assets which have a long or indefinite maturity. Generally, it deals with long term securities which have a period of above one year. In the widest sense, it consists of a series of channels through which the savings of the community are made available for industrial and commercial enterprises and public authorities. Capital market consists of primary market and secondary market. • Primary market Primary market is a market for new issues or new financial claims. Hence it is also called as New Issue Market. It basically deals with those securities which are issued to the public for the first time. The market, therefore, makes available a new block of securities for public subscription. In other words, it deals with raising of fresh
  • 10.
    10 capital by companieseither for cash or for consideration other than cash. The best example could be Initial Public Offering (IPO) where a firm offers shares to the public for the first time. • Secondary market: Secondary market is a market where existing securities are traded. In other words, securities which have already passed through new issue market are traded in this market. Generally, such securities are quoted in the stock exchange and it provides a continuous and regular market for buying and selling of securities. This market consists of all stock exchanges recognized by the government of India. Money Market Money markets are the markets for short-term, highly liquid debt securities. Money market securities are generally very safe investment and relatively low interest rate that is most appropriate for temporary cash storage or short term time needs. It consists of a number of sub-markets which collectively constitute the money market namely call money market, commercial bills market, acceptance market, and Treasury bill market. Derivatives Market The derivatives market is the financial market for derivatives, financial instruments like futures contracts or options, which are derived from other forms of assets. A derivative is a security whose price is dependent upon or derived from one or more underlying assets. The derivative itself is merely a contract between two or more parties. Its value is determined by fluctuations in the underlying asset. The important financial derivatives are the following: Forwards: Forwards are the oldest of all the derivatives. A forward contract refers to an agreement between two parties to exchange an agreed quantity of an asset for cash at a certain date in future at a predetermined price specified in that agreement. The promised asset may be currency, commodity, instrument etc.
  • 11.
    11 Futures: Future contract isvery similar to a forward contract in all respects excepting the fact that it is completely a standardized one. It is nothing but a standardized forward contract which is legally enforceable and always traded on an organized exchange. Options: A financial derivative that represents a contract sold by one party(option writer) to another party (option holder). The contract offers the buyer the right, but not the obligation, to buy (call) or sell (put) a security or other financial asset at an agreed- upon price (the strike price) during a certain period of time or on a specific date (exercise date). Call options give the option to buy at certain price, so the buyer would want the stock to go up. Put options give the option to sell at a certain price, so the buyer would want the stock to go down. Swaps: It is yet another exciting trading instrument. In fact, it is the combination of forwards by two counterparties. It is arranged to reap the benefits arising from the fluctuations in the market – either currency market or interest rate market or any other market for that matter. Foreign Exchange Market It is a market in which participants are able to buy, sell, exchange and speculate on currencies. The forex market is considered to be the largest financial market in the world. It is a worldwide decentralized over-the-counter financial market for the trading of currencies. Because the currency markets are large and liquid, they are believed to be the most efficient financial markets. Commodities Market It is a physical or virtual marketplace for buying, selling and trading raw or primary products. Commodities are split into two types: hard and soft commodities. Hard commodities are typically natural resources that must be mined or extracted
  • 12.
    12 (gold, rubber, oil,etc.), whereas soft commodities are agricultural products or livestock (corn, wheat, coffee, sugar, soybeans, pork, etc.) 2.1.4 INDIAN STOCK EXCHANGE Bombay stock exchange (BSE) Bombay Stock Exchange is the oldest stock exchange in Asia with a rich heritage, now spanning three centuries in its 133 years of existence. What is now popularly known as BSE was established as "The Native Share & Stock Brokers' Association" in 1875. Over the past 133 years, BSE has facilitated the growth of the Indian corporate sector by providing it with an efficient access to resources. There is perhaps no major corporate in India which has not sourced BSE's services in raising resources from the capital market.BSE also has a wide range of services to empower investors and facilitate smooth transactions: Investor Services: The Department of Investor Services redresses grievances of investors. BSE was the first exchange in the country to provide an amount of Rs.1 million towards the investor protection fund; it is an amount higher than that of any exchange in the country. BSE launched a nationwide investor awareness programme- 'Safe Investing in the Stock Market' under which 264 programmes were held in more than 200 cities. . The BSE On-line Trading (BOLT): BSE On-line Trading (BOLT) facilitates on-line screen based trading in securities. BOLT is currently operating in 25,000 Trader Workstations located across over 450 cities in India BSEWEBX.com: In February 2001, BSE introduced the world's first centralized exchange-based Internet trading system, BSEWEBX.com. This initiative enables investors anywhere in the world to trade on the BSE platform Surveillance: BSE's On-Line Surveillance System (BOSS) monitors on a real-time basis the price movements, volume positions and members' positions and real-time measurement of default risk, market reconstruction and generation of cross market alerts. BSE Training Institute: BTI imparts capital market training and certification, in
  • 13.
    13 collaboration with reputedmanagement institutes and universities. It offers over 40 courses on various aspects of the capital market and financial sector. More than 20,000 people have attended the BTI programmes. 2.1.5 NATIONAL STOCK EXCHANGE (NSE) National Stock Exchange (NSE) is considered to be leader in the stock exchange scenario in terms of the total volume traded. The National Stock Exchange received the recognition of a stock exchange in July 1993 under Securities Contracts (Regulation) Act 1956. The products that are traded in the National Exchange are:-  Equity or Share  Future (both index and stock )  Options (Call and put )  Wholesale Debt Market  Retail Debt Market NSE has a fully automated screen based traded system which is known as the NEAT system. The transactions are carried on with speed, efficiency, and are all transparent. The risk management system of the National Stock Exchange is world class and can be considered as the benchmark for other bourses. The leading index of NSE is known as Nifty 50 or just Nifty. It comprises of 50 diversified benchmark Indian company scrip and is constructed on the basis of weighted average market capitalization method. 2.1.6 THE FUNCTION OF EXCHANGES Exchanges provide a marketplace for traders to buy and sell securities. In years past, trading took place on large open floors, where buyers and sellers engaged in face-to-face transactions. Today, most exchanges utilize electronic systems, which allow for fast, efficient trading. A few still use traditional trading floors, but in conjunction with an electronic system. Exchanges generate revenue in several ways. Those that concentrate on the equities market collect fees from listed companies. Both equity and derivative exchanges receive a payment for each trade that takes place on their platform. The top
  • 14.
    14 lines of thesecompanies perform quite well during volatile markets. Another source of revenue comes from supplying market data to financial information providers. Too, revenue may be produced from developing, marketing and distributing technology used in trading and information processing. Among other means of generating revenue, an exchange may clear third-party or in-house trades. This sector of the industry has, indeed, undergone consolidation. Domestic exchanges have merged with foreign bourses to gain diversification. Also, many have acquired small competitors that offer attractive market niches complementing existing operations. For instance, companies that focus on equity trading have expanded the scope of business by acquiring options exchanges. 2.1.7 TOP 10 BROKING HOUSES Here we are giving list of India’s top 10 Broking House on base of survey of investor and trader of many cities. In their views following Broking Houses gives best and reliable services 1. ICICI direct.com 2. India Infoline 3. Kotak Securities Ltd. 4. Share Khan 5. India bulls 6. Motilal Oswal 7. Bajaj Capital 8. Karvy stock broking ltd 9. Angel Broking 10. Reliance Money
  • 15.
    15 2.2 COMPANY PROFILE- KARVY STOCK BROKING LTD 2.2.1 INTRODUCTON TO KARVY KARVY, is a premier integrated financial services provider, and ranked among the top five in the country in all its business segments, services over 16 million individual investors in various capacities, and provides investor services to over 300 corporate, comprising the who is who of Corporate India. KARVY covers the entire spectrum of financial services such as Stock broking, Depository Participants, Distribution of financial products - mutual funds, bonds, fixed deposit, equities, Insurance Broking, Commodities Broking, Personal Finance Advisory Services, Merchant Banking & Corporate Finance, placement of equity, IPO’s, among others. Karvy has a professional management team and ranks among the best in technology, operations and research of various industrial segments. 2.2.2 EARLY DAYS The birth of Karvy was on a modest scale in 1981. It began with the vision and enterprise of a small group of practicing Chartered Accountants who founded the flagship company, Karvy Consultants Limited. They started with consulting and financial accounting automation, and carved inroads into the field of registry and share accounting by 1985. Since then, they have utilized their experience and superlative expertise to go from strength to strength to better their services, to provide new ones, to innovate, diversify and in the process, evolved Karvy as one of India’s premier integrated financial service enterprise. Thus over the last 20 years Karvy has traveled the success route, towards building a reputation as an integrated financial services provider, offering a wide spectrum of services. And they have made this journey by taking the route of quality service, path breaking innovations in service, versatility in service and finally, totality in service. Their highly qualified manpower, cutting-edge technology, comprehensive infrastructure and total customer-focus has secured for them the position of an emerging financial services giant enjoying the confidence and support of an enviable clientele across diverse fields in the financial world. Their values and vision of attaining total competence in their servicing has served as the building block for creating a great financial enterprise, which stands solid
  • 16.
    16 on their fortressesof financial strength - their various companies. With the experience of years of holistic financial servicing behind them and years of complete expertise in the industry to look forward to, they have now emerged as a premier integrated financial services provider. And today, they can look with pride at the fruits of our mastery and experience – comprehensive financial services that are competently segregated to service and manage a diverse range of customer requirements. 2.2.3 KARVY ACHIEVEMENTS  Among the top 5 stock brokers in India (4% of NSE volumes)  India's No. 1 Registrar & Securities Transfer Agents  Among the to top 3 Depository Participants  Largest Network of Branches & Business Associates  ISO 9002 certified operations by DNV  Among top 10 Investment bankers  Largest Distributor of Financial Products  Adjudged as one of the top 50 IT uses in India by MIS Asia  Full Fledged IT driven operation 2.2.4 KARVY QUALITY POLICY To achieve and retain leadership, Karvy shall aim for complete customer satisfaction, by combining its human and technological resources, to provide superior quality financial services. In the process, Karvy will strive to exceed Customer's expectations. 2.2.5 QUALITY OBJECTIVES As per the Quality Policy, Karvy will:  Life for all its employees and equip them with adequate knowledge & skills so as to respond to customer's needs  Continue to uphold the values of honesty & integrity and strive to establish unparalleled standards in business ethics.  Use state-of-the art information technology in developing new and
  • 17.
    17 innovative financial productsand services to meet the changing needs of investors and clients.  Strive to be a reliable source of value-added financial products and services and constantly guide the individuals and institutions in making a judicious choice of it.  Strive to keep all stake-holders (shareholders, clients, investors, employees, suppliers and regulatory authorities) proud and satisfied. 2.2.6 KARVY Group companies Karvy Consultants Limited They are the first securities registry to receive ISO 9002 certification in India. Registered with SEBI as Category I Registrar, is Number 1 Registrar in the Country. The award of being ‘Most Admired’ Registrar is one among many of the acknowledgements they received for their customer friendly and competent services. Karvy Stock Broking Limited The company, Member of National Stock Exchange (NSE), offers a comprehensive range of services in the stock market through the benefits of in-depth research on crucial market dynamics, done by qualified team of experts. Apart from stock broking activities, the company also provides Depository Participant Services to its corporate and retail customers. Karvy Investor Services Limited Registered with SEBI as a Category I Merchant Banker and ranked among the top 10 merchant bankers in the country, the company has built a reputation as a professional advisor in structuring IPO’s take over assignments and buy back exercises. Karvy Computer share Private Limited Services is the global services arm of the Karvy Group of Companies engaged in the business of offshore business process outsourcing in the areas of human resource outsourcing, finance and accounting operations outsourcing, research and analytics and back office processing operations. Karvy Comtrade Limited The company provides investment, advisory and brokerage services in Indian Commodities Markets. And most importantly, they offer a wide reach through their
  • 18.
    18 branch network ofover 225 branches located across 180 cities.The company is into distribution of Financial Products. It distributes a wide range of financial products and services from insurance to credit cards and loans. The company provides sound advisory services to suit the different investment needs of customers. Karvy Commodities Broking Pvt Limited At Karvy Commodities, they are focused on taking commodities trading to new dimensons of reliability and profitability. They have made commodities trading, an essentially age-old practice, into a sophisticated and scientific investment option.Here they enable trade in all goods and products of agricultural and mineral origin that include lucrative commodities like gold and silver and popular items like oil, pulses and cotton through a well-systematized trading platform. Their technological and infrastructural strengths and especially our street-smart skills make us an ideal broker. Their service matrix is holistic with a gamut of advantages, the first and foremost being their legacy of human resources, technology and infrastructure that comes from being part of the Karvy Group. Their wide national network, spanning the length and breadth of India, further supports these advantages. Regular trading workshops and seminars are conducted to hone trading strategies to perfection. Every move made is a calculated one, based on reliable research that is converted into valuable information through daily, weekly and monthly newsletters, calls and intraday alerts. A dedicated team committed to giving hassle-free service while the brokerage rates offered are extremely competitive provides further, personalized service here. Their commitment to excel in this sector stems from the immense importance those commodities broking has to a cross-section of investors – farmers, exporters, importers, manufacturers and the Government of India itself. About Karvy Commodities Broking Private Limited Commodities market, contrary to the beliefs of many people, has been in existence in India through the ages. However the recent attempt by the Government to permit Multi-commodity National levels exchanges has indeed given it, a shot in the arm. As a result two exchanges Multi Commodity Exchange (MCX) and National Commodity and derivatives Exchange (NCDEX) have come into being. These exchanges, by virtue of their high profile promoters and stakeholders, bundle in
  • 19.
    19 themselves, online tradingfacilities, robust surveillance measures and a hassle-free settlement system. The futures contracts available on a wide spectrum of commodities like Gold, Silver, Cotton, Steel, Soya oil, Soya beans, Wheat, Sugar, Channa etc., provide excellent opportunities for hedging the risks of the farmers, importers, exporters, traders and large scale consumers. They also make open an avenue for quality investments in precious metals. The commodities market, as the movements of the stock market or debt market do not affect it provides tremendous opportunities for better diversification of risk. Realizing this fact, even mutual funds are contemplating of entering into this market. Karvy Commodities Broking Private Limited is another venture of the prestigious Karvy group. With their well established presence in the multifarious facets of the modern Financial services industry from stock broking to registry services, it is indeed a pleasure for us to make foray into the commodities derivatives market which opens yet another door for them to deliver their service to our beloved customers and the investor public at large. With the high quality infrastructure already in place and a committed Government providing continuous impetus, it is the responsibility of them, the intermediaries to deliver these benefits at the doorsteps of their esteemed customers. With their expertise in financial services, existence across the lengths and breadths of the country and an enviable technological edge, they are all set to bring to you, the pleasure of investing in this burgeoning market. which can touch upon the lives of a vast majority of the population from the farmer to the corporate alike? They are confident that the commodity futures can be good.The Company provides investment, advisory and brokerage services in Indian Commodities Markets. And most importantly, they offer a wide reach through their branch network of over 225 branches located across 180 cities. THE KARVY CREDO.  Clients are the reason for our being. Personalized service, professional care; pro-activeness are the values that help them nurture enduring relationships with their clients Respect for the individual. They are the kilns that hone individuals to perfection. Be they their employees, shareholders or investors. They do so by upholding their dignity & pride,
  • 20.
    20 inculcating trust andachieving a sensitive balance of their professional and personal lives.  Teamwork. Each team member is the face of Karvy. Together they offer diverse services with speed, accuracy and quality to deliver only one product: excellence. Transparency, co-operation, invaluable individual contributions for a collective goal, and respecting individual uniqueness within a corporate whole, are how they deliver again and again.  Responsible Citizenship. As a responsible corporate citizen, their duty is to foster a better environment in the society where they live and work. Abiding by its norms, and behaving responsibly towards the environment, is some of their growing initiatives towards realizing it.  Integrity. Professional and personal ethics are their bedrock. They take pride in an environment that encourages honesty and the opportunity to learn from failures than camouflage them. They insist on consistency between works and actions.
  • 21.
    21 CHAPTER 3 THEORETICAL VIEWOF TECHNICAL ANALYSIS 3.1 INTRODUCTION “Technical analysis refers to the study of market generated data like prices & volume to determine the future direction of prices movements.” 3.2 BASIC PRICES FOR TECHNICAL ANALYSIS  Market prices are determined by the interaction of supply & demand forces.  Supply & demand are influenced by variety of supply & demand affiliated factors both rational and irrational.  These include fundamental factors as well as psychological factors.  Minor deviations stock prices tend to move in fairly persistent trend.  Shifts in demand & supply bring about change in trends.  This shift can be detected with the help of charts of mutual and computerized action, because of the persistence of trends and patterns analysis of past market data can be used to predict future prices behaviors. 3.3 DRAWBACKS / LIMITATION OF TECHNICAL ANALYSIS  Technical analysis does not able to explain the rezones behind the employment or selection of specific tool of technical analysis.  The technical analysis failed to signal an uptrend to downtrend in time.  The technical analysis must be a self defeating proposition .As more & more people use, employ it the value of such analysis trends to reduce. 3.4 FUNDAMENTAL VS. TECHNICAL ANALYSIS Technical analysis and fundamental analysis are the two main schools of thought in the financial markets. As we have mentioned, technical analysis looks at the price movement of a security and uses this data to predict its future price movements. Fundamental analysis, on the other hand, looks at economic factors, known as fundamentals. Fundamental analysis takes a relatively long-term approach to analyzing the market compared to technical analysis. While technical analysis can be used on a
  • 22.
    22 timeframe of weeks,days or even minutes, fundamental analysis often looks at data over a number of years. 3.5 Tools & instruments used for technical analysis Price fields: Technical analysis is based almost entirely on the analysis of price and volume. The fields which define a security’s price and volume are explained below. Open This is the price of the trade for the period (e.g., the first trade of the day). When analyzing daily data the open is especially important as it is the consensus price after all interested parties were able to “sleep on it”. High This is the highest price that the security traded during the period . It is the point at which there were more sellers than buyers (e.g., there are always sellers willing to sell at higher prices , but the high represents the highest price buyers were willing to pay) Low This is the lowest price that the security traded during the period. It is the point at which there were more buyers than sellers (e.g., there are always buyers willing to buy at lower price , but the low represents the lowest price sellers were willing to accept). Close This is the last price that the security traded during the period. Due to its availability, the close is the most often used price for analysis. The relationship between the open (the first price) and the close (the last price) are considered significant by most technicians. This relationship is emphasized in candlestick charts.
  • 23.
    23 Volume This is thenumber of shares that were traded during the period. The relationship between price and volume (e.g., increasing prices accompanied with increasing volume) is important. Open interest This is the total number of outstanding contracts (e.g., those that have not been exercised, closed, or expired) of a future or option. Open interest is often used as an indicator. Bid This is the price a market maker is willing to pay for a security (e.g., the price you will receive if you sell). Ask This is the price a market maker is willing to accept (e.g., the price you will pay to buy the security) 3.6 TECHNICAL INDICATORS 3.6.1 Commodity Channel Index (CCI) An oscillator used in technical analysis to help determine when an investment vehicle has been overbought and oversold. The Commodity Channel Index, first developed by Donald Lambert , quantifies the relationship between the assets price, a moving average (MA) of the assets price , and normal deviations from the average The Commodity Channel Index (“CCI”) measures the variations of the security’s price from its statistical mean . High values show that prices are unusually high compared to average prices whereas low values indicates that price are unusually low. Formula CCI = (Typical price – 20 period of TP) / ( 0.158 x Mean Deviation)
  • 24.
    24 Typical price (TP ) =(High + low + close ) / 3 Constant = 0.15 The Commodity Channel Index is a very popular indicator that gives easy to use Buy and Sell signal ; the CCI also used to identify overbought and oversold areas of price actions. The CCI is calculated so that roughly 75% of price movement should be between +100 (overbought) and -100 (oversold) 3.6.2 RELATIVE STRENGTH INDEX (RSI) A technical momentum indicator that compares the magnitude of recent gains to recent losses in an attempt to determine overbought and oversold conditions of an asset. Formula RSI = Average of x days` up closes / Average of x days down closes the RSI ranges from 0 to 100. An asset is deemed to be overbought once the RSI approaches the 70 level , meaning that it may be getting overvalued and is a good candidate for a pullback. Likewise ,if the RSI approaches 30, it is an indication that the asset may be getting oversold and therefore likely become undervalued. One of the most popular technical analysis indictors, the relative strength index (RSI) is an oscillator that measures current price strength in relation to previous prices 3.6.3 STOCHASTIC FAST Developed by George C Lane in the late 1950s, the Stochastic Oscillator is a momentum indicator that shows the location of the current close relative to the high/ low range over a set number of periods. Closing levels that are consistently near the top of the range indicate accumulation (buying pressure) and those near the bottom of the range indicate distribution(selling pressure) Formula %K = 100*[Recent close-Lowest low(n) highest High(n)-Lowest low (n)
  • 25.
    25 %D = 3-period moving average of % K (n) = Number of periods used in calculation Stochastic Fast plots the location of the current price I n relation to the range of a certain number of prior bars (dependent upon user –input, usually 14- periods). In general , stochastic are used to measure overbought and oversold conditions. Above 80 is generally considered overbought and below 20 is considered oversold. a) Stochastic Buy Signal When the stochastic is below the 20 oversold line and the %K line crosses over the %D line, buy. b) Stochastic Sell Signal When the stochastic is above the 80 overbought line and the %K line crosses below the %D line, sell. 3.6.4 WILLIAMS %R Williams %R is a technical analysis oscillator showing the current closing price in relation to the high and low of the past N days(for a given N). It was developed by a publisher and promoter of trading materials, Larry Williams. Its purpose is to tell whether a stock or commodity market is trading near the high or the low , or somewhere in between, of its recent trading range. Formula %R= CLOSE today-HIGH n days x 100 HIGH n days- LOW n days Williams %R is an overbought and oversold technical indicator that can give easy to interpret buy and sell signals
  • 26.
    26 CHAPTER 4 DATA ANALYSISAND INTERPRETATION 4.1 INTRODUCTION In this chapter the data were collected from karvy stock broking ltd and analysis is made by the four indicators like, Relative strength index, Commodity channel index, Williams %R and Fast stochastic. Nifty 50 scrip companies are chosen for analysis. 4.1.1. TOOLS USED FOR ANALYSIS  RSI calculation was done for 14 days, in this calculation RSI limits are between 20 and 80. If share price movement touches 70, the indicator’s recommendation is overbought and if it touches 30, the indicator’s recommendation is oversold and the price movements are between these two levels the suggestion is to hold the stock.  Commodity channel index calculation was done for 20days, in this calculation CCI limits are between – 100 and 100. If share price movement touches 100, the indicator’s recommendation are overbought and if it touches – 100, the indicator’s recommendation is oversold and the price movements are between these two levels the suggestion is to hold the stock.  Fast stochastic calculation was done for 14 days. In this calculation this limits are between 20 days 80. If share price movement touches 80, the indicator’s recommendation is overbought and if it touches 20, the indicator’s recommendation is oversold and the price movements are between these two levels the suggestion is to hold the stock.  Williams % R calculation was done for 14 days, in this calculation Williams %R limits are between -20 and -80. If share price movement touches -20, the indicator’s recommendation is overbought and if it touches -80, the indicator’s recommendation is oversold and the price movements are between these twos levels the suggestion is to hold the stock.
  • 27.
    27 4.2 COMMODITY CHANNELINDEX FOR AUTOMOBILE INDUSTRY The table 4.1 shows the buy/sell signal of automobile industry using commodity channel index.. TABLE 4.1 COMMODITY CHANNEL INDEX FOR AUTOMOBILE INDUSTRY S.NO COMPANY NAME HIGH VALUE LOW VALUE CLOSE VALUE COMMODITY CHANNEL INDEX 1 Hero Motocorp Ltd 3,449.90 3,388.10 3,388.10 -38.22 2 Mahindra and Mahindra 2,636.75 2,584.60 2,631.00 61.17 3 Maruti Suzuki India ltd 1,233.55 1,204.00 1,219.00 -119.8 4 Tata Motors ltd 3,711.25 3,641.35 3,677.00 -30.55 5 Bajaj Auto ltd 577.8 567.7 576 -67.42 Source: Karvy Stock Broking Ltd INFERENCE In this table 4.1 shows commodity channel index indicates investors to buy Maruti Suzuki India ltd shares and it also suggest the investors stay out from the stock of following companies like Hero Motocorp Ltd, Mahindra and Mahindra, Tata Motors ltd, Bajaj Auto ltd. CHART 4.1 COMMODITY CHANNEL INDEX FOR AUTOMOBILE INDUSTRY -150 -100 -50 0 50 100 Hero Motocorp Ltd Mahindra and Mahindra Maruti Suzuki India ltd Tata Motors ltd Bajaj Auto ltd PERCENTAGE COMPANY NAME
  • 28.
    28 4.3.FAST STOCHASTIC FORAUTOMOBILE INDUSTRY Table 4.2 shows the buy/sell signal of automobile industry using fast stochastic. TABLE 4.2 FAST STOCHASTIC FOR AUTOMOBILE INDUSTRY S.NO COMPANY NAME HIGH VALUE LOW VALUE CLOSE VALUE FAST STOCHASTIC 1 Hero Motocorp Ltd 3,449.90 3,388.10 3,388.10 58.45 2 Mahindra and Mahindra 2,636.75 2,584.60 2,631.00 63.23 3 Maruti Suzuki India ltd 1,233.55 1,204.00 1,219.00 23.11 4 Tata Motors ltd 3,711.25 3,641.35 3,677.00 53.96 5 Bajaj Auto ltd 577.8 567.7 576 55.6 Source: Karvy Stock Broking Ltd INFERENCE In this table 4.2 fast stochastic indicates investors to buy Maruti Suzuki India ltd shares and it also suggest the investors stay out from the stock of following companies shares Hero Motocorp Ltd, Mahindra and Mahindra, Tata Motors ltd, Bajaj Auto ltd CHART 4.2 FAST STOCHASTIC FOR AUTOMOBILE INDUSTRY 0 10 20 30 40 50 60 70 Hero Motocorp Ltd Mahindra and Mahindra Maruti Suzuki India ltd Tata Motors ltd Bajaj Auto ltd PERCENTAGE COMPANY NAME
  • 29.
    29 4.4 RELATIVE STRENGTHINDEX FOR AUTOMOBILE INDUSTRY The table 4.3 shows the buy/sell signal of automobile industry using relative strength index.. TABLE 4.3 RELATIVE STRENGTH INDEX FOR AUTOMOBILE INDUSTRY S.NO COMPANY NAME HIGH VALUE LOW VALUE CLOSE VALUE RELATIVE STRENGTH INDEX 1 Hero Motocorp Ltd 3,449.90 3,388.10 3,388.10 43.75 2 Mahindra and Mahindra 2,636.75 2,584.60 2,631.00 65.32 3 Maruti Suzuki India ltd 1,233.55 1,204.00 1,219.00 36.6 4 Tata Motors ltd 3,711.25 3,641.35 3,677.00 47.54 5 Bajaj Auto ltd 577.8 567.7 576 47.78 Source: Karvy Stock Broking Ltd INFERENCE In this table 4.3, RSI indicates investors to sell Tata Motors ltd shares and it also suggest the investors stay out from the stock of following companies shares Hero Motocorp Ltd, Mahindra and Mahindra, Bajaj Auto ltd, Maruti Suzuki India ltd CHART 4.3 RELATIVE STRENGTH INDEX FOR AUTOMOBILE INDUSTRY 0 50 100 PERCENTAGE COMPANY NAME
  • 30.
    30 4.5 WILLIAMS %R FOR AUTOMOBILE INDUSTRY The table 4.4 shows the buy/sell signal of automobile industry using Williams% r TABLE 4.4 WILLIAMS % R FOR AUTOMOBILE INDUSTRY S.NO COMPANY NAME HIGH VALUE LOW VALUE CLOSE VALUE WILLIAMS % R 1 Hero Motocorp Ltd 3,449.90 3,388.10 3,388.10 -41.65 2 Mahindra and Mahindra 2,636.75 2,584.60 2,631.00 -38.8 3 Maruti Suzuki India ltd 1,233.55 1,204.00 1,219.00 -79.9 4 Tata Motors ltd 3,711.25 3,641.35 3,677.00 47.05 5 Bajaj Auto ltd 577.8 567.7 576 -47.22 Source: Karvy Stock Broking Ltd INFERENCE In this table 4.4 Williams %R indicates investors to buy Maruti Suzuki India ltd shares, also indicates investors to sell the Bajaj Auto ltd shares and it also suggest the investors stay out from the stock of following companies shares Hero Motocorp Ltd, Mahindra and Mahindra, Tata Motors ltd, CHART 4.4 WILLIAMS % R FOR AUTOMOBILE INDUSTRY -100 -50 0 50 PERCENTAGE COMPANY NAME
  • 31.
    31 4.6 COMMODITY CHANNELINDEX FOR BANKING INDUSTRY The table 4.5 shows the buy/sell signal of Banking industry using commodity channel index. TABLE 4.5 COMMODITY CHANNEL INDEX FOR BANKING INDUSTRY Source: Karvy Stock Broking Ltd INFERENCE In this table 4.5 commodity channel index indicates investors to buy HDFC bank ltd, Kotak Mahindra bank ltd shares and it also suggest the investors stay out from the stock of following companies shares Axis Bank Ltd, Bank of Baroda, ICICI Bank Ltd, IDFC Ltd, Indusland Bank Ltd, Punjab National Bank Ltd, State Bank of India.. S.NO COMPANY HIGH LOW CLOSE COMMODITY CHANNEL INDEX 1 Axis Bank Ltd 622 603.5 613 -109.7 2 Bank Of Baroda 184.95 178.7 181 -24.05 3 Hdfc Bank Ltd 1,090.00 1,062.50 1,065.00 -139.8 4 Icici Bank Ltd 349.9 340.1 346.4 22.14 5 Idfc Ltd 180.4 176.5 179 -78.86 6 Indusland Bank Ltd 917.85 893.15 909.8 -77.99 7 Kotak Mahindra Bank Ltd 1,422.00 1,402.00 1,404.00 -100.4 8 Punjab National Bank Ltd 165.2 162.1 164.8 -94.63 9 State Bank Of India 296.25 289.75 294.75 98.25
  • 32.
    32 CHART 4.5 COMMODITY CHANNELINDEX FOR BANKING INDUSTRY -150 -100 -50 0 50 100 PERCENTAGE COMPANY NAME
  • 33.
    33 4.7 FAST STOCHASTICFOR BANKING INDUSTRY The table 4.6. shows the buy/sell signal of banking industry using fast stochastic. TABLE 4.6 FAST STOCHASTIC FOR BANKING INDUSTRY Source: Karvy Stock Broking Ltd INFERENCE In this table 4.6 fast stochastic indicates investors to buy Axis Bank Ltd, HDFC bank ltd, Indusland Bank Ltd, Punjab National Bank Ltd, Kotak Mahindra bank ltd shares and it also suggest the investors stay out from the stock of following companies shares Bank of Baroda, ICICI Bank Ltd, IDFC Ltd, State Bank of India.. S.NO COMPANY HIGH LOW CLOSE FAST STOCHASTIC 1 Axis Bank Ltd 622 603.5 613 2.91 2 Bank Of Baroda 184.95 178.7 181 28.14 3 Hdfc Bank Ltd 1,090.00 1,062.50 1,065.00 1.88 4 Icici Bank Ltd 349.9 340.1 346.4 67.54 5 Idfc Ltd 180.4 176.5 179 32.66 6 Indusind Bank Ltd 917.85 893.15 909.8 41.99 7 Kotak Mahindra Bank Ltd 1,422.00 1,402.00 1,404.00 9.5 8 Punjab National Bank Ltd 165.2 162.1 164.8 15.12 9 State Bank Of India 296.25 289.75 294.75 65.82
  • 34.
    34 CHART 4.6 FAST STOCHASTICFOR BANKING INDUSTRY 0 10 20 30 40 50 60 70 PERCENTAGE COMPANY NAME
  • 35.
    35 4.8 RELATIVE STRENGTHINDEX FOR BANKING INDUSTRY The table 4.7 shows the buy/sell signal of banking industry using relative strength index. TABLE 4.7 RELATIVE STRENGTH INDEX FOR BANKING INDUSTRY Source: Karvy Stock Broking Ltd INFERENCE In this table 4.7 RSI indicates investors to buy Axis Bank Ltd, HDFC bank ltd, Kotak Mahindra bank ltd shares, also indicate investors sell the ICICI Bank Ltd shares and it also suggest the investors stay out from the stock of following companies shares Bank of Baroda, IDFC Ltd, Indusland Bank Ltd, Punjab National Bank Ltd, State Bank of India. S.NO COMPANY HIGH LOW CLOSE RELATIVE STRENGTH INDEX 1 Axis Bank Ltd 622 603.5 613 27.8 2 Bank Of Baroda 184.95 178.7 181 42.33 3 Hdfc Bank Ltd 1,090.00 1,062.50 1,065.00 18.14 4 Icici Bank Ltd 349.9 340.1 346.4 50.15 5 Idfc Ltd 180.4 176.5 179 42.57 6 Indusind Bank Ltd 917.85 893.15 909.8 47.2 7 Kotak Mahindra Bank Ltd 1,422.00 1,402.00 1,404.00 29.91 8 Punjab National Bank Ltd 165.2 162.1 164.8 38.89 9 State Bank Of India 296.25 289.75 294.75 56.78
  • 36.
    36 CHART 4.7 RELATIVE STRENGTHINDEX FOR BANKING INDUSTRY 0 10 20 30 40 50 60 PERCENTAGE COMPANY NAME
  • 37.
    37 4.9 WILLIAMS %R FOR BANKING INDUSTRY The table 4.8 shows the buy/sell signal of banking industry using williams %R TABLE 4.8 WILLIAMS % R FOR BANKING INDUSTRY Source: Karvy Stock Broking Ltd INFERENCE In this table 4.8 Williams %R indicates investors to buy Axis Bank Ltd, HDFC bank ltd, Kotak Mahindra bank ltd, Indusland Bank Ltd, Punjab National Bank Ltd shares and it also suggest the investors stay out from the stock of following companies shares Bank of Baroda, ICICI Bank Ltd, IDFC Ltd, State Bank of India.. S.NO COMPANY HIGH LOW CLOSE WILLIAMS % R 1 Axis Bank Ltd 622 603.5 613 -97.3 2 Bank Of Baroda 184.95 178.7 181 -69.86 3 Hdfc Bank Ltd 1,090.00 1,062.50 1,065.00 -99.22 4 Icici Bank Ltd 349.9 340.1 346.4 -31.46 5 Idfc Ltd 180.4 176.5 179 -64.32 6 Indusind Bank Ltd 917.85 893.15 909.8 -56.05 7 Kotak Mahindra Bank Ltd 1,422.00 1,402.00 1,404.00 -90.86 8 Punjab National Bank Ltd 165.2 162.1 164.8 -84.98 9 State Bank Of India 296.25 289.75 294.75 -34.17
  • 38.
    38 CHART 4.8 WILLIAMS %R FOR BANKING INDUSTRY -100 -90 -80 -70 -60 -50 -40 -30 -20 -10 0 PERCENTAGE COMPANY NAME
  • 39.
    39 4.10. COMMODITY CHANNELINDEX FOR CEMENT INDUSTRY The table 4.9 shows the buy/sell signal of Cement industry using commodity channel index .. TABLE 4.9 COMMODITY CHANNEL INDEX FOR CEMENT INDUSTRY S.NO COMPANY NAME HIGH LOW CLOSE COMMODITY CHANNEL INDEX 1 ACC 1,729.00 1,675.00 1,725.60 -162.45 2 Ambuja Cement 276 269.05 275 -77.29 3 Grasim Industry 3,910.00 3,757.65 3,886.00 26.92 4 Ultratech Cement Ltd 3,330.00 3,152.35 3,315.00 -87.78 Source: Karvy Stock Broking Ltd INFERENCE In this table 4.9 commodity channel index indicates investors to buy ACC ltd shares and it also suggest the investors stay out from the stock of following companies shares Ambuja Cement, Grasim Industry, Ultratech Cement Ltd. CHART 4.9 COMMODITY CHANNEL INDEX FOR CEMENT INDUSTRY -200 -150 -100 -50 0 50 PERCENTAGE COMPANY NAME
  • 40.
    40 4.11.FAST STOCHASTIC FORCEMENT INDUSTRY The table 4.10 shows the buy/sell signal of cement industry using fast stochastic TABLE 4.10 FAST STOCHASTIC FOR CEMENT INDUSTRY S.NO COMPANY NAME HIGH LOW CLOSE FAST STOCHASTIC 1 ACC 1,729.00 1,675.00 1,725.60 19.54 2 AMBUJA CEMENT 276 269.05 275 20.65 3 GRASIMINDUSTRY 3,910.00 3,757.65 3,886.00 71.76 4 ULTRATECH CEMENT LTD 3,330.00 3,152.35 3,315.00 13.83 Source: Karvy Stock Broking Ltd INFERENCE In this table 4.10 Fast Stochastic indicates investors to buy following companies shares ACC ltd, Ultratech Cement Ltd, Ambuja Cement shares and it also suggest the investors stay out from the stock of Grasim Industry shares. CHART 4.10 FAST STOCHASTIC FOR CEMENT INDUSTRY 0 20 40 60 80 PERCENTAGE COMPANY NAME
  • 41.
    41 4.12. RELATIVE STRENGTHINDEX FOR CEMENT INDUSTRY The table 4.11 shows the buy/sell signal of cement industry using relative strength index TABLE 4.11 RELATIVE STRENGTH INDEX FOR CEMENT INDUSTRY S.NO COMPANY NAME HIGH LOW CLOSE RELATIVE STRENGTH INDEX 1 ACC 1,729.00 1,675.00 1,725.60 42.45 2 AMBUJA CEMENT 276 269.05 275 33.59 3 GRASIMINDUSTRY 3,910.00 3,757.65 3,886.00 53.29 4 ULTRATECH CEMENT LTD 3,330.00 3,152.35 3,315.00 30.32 Source: Karvy Stock Broking Ltd INFERENCE In this table 4.11 RSI indicates investors to buy Ultratech Cement Ltd shares, also indicates to sell the Grasim Industry shares and it also suggest the investors stay out from the stock of following companies shares Ambuja Cement, ACC ltd. CHART 4.11 RELATIVE STRENGTH INDEX FOR CEMENT INDUSTRY 0 20 40 60 PERCENTAGE COMPANY NAME
  • 42.
    42 4.13.WILLIAMS % RFOR CEMENT INDUSTRY The table 4.12 shows the buy/sell signal of cement industry using williams % r . TABLE 4.12 WILLIAMS % R FOR CEMENT INDUSTRY S.NO COMPANY NAME HIGH LOW CLOSE WILLIAMS % R 1 ACC 1,729.00 1,675.00 1,725.60 -84.49 2 AMBUJA CEMENT 276 269.05 275 -83.3 3 GRASIMINDUSTRY 3,910.00 3,757.65 3,886.00 -26.24 4 ULTRATECH CEMENT LTD 3,330.00 3,152.35 3,315.00 -89.17 Source: Karvy Stock Broking Ltd INFERENCE In this table 4.12 Williams %R indicates investors to buy following companies shares ACC ltd, Ambuja Cement, Ultratech Cement Ltd shares and it also suggest the investors stay out from the stock of Grasim Industry shares. CHART 4.12 WILLIAMS % R FOR CEMENT INDUSTRY -100 -80 -60 -40 -20 0 PERCENTAGE COMPANY NAME
  • 43.
    43 4.14 COMMODITY CHANNELINDEX FOR CONSTRUCTION INDUSTRY The table 4.13 shows the buy/sell signal of construction industry using commodity channel index.. TABLE 4.13 COMMODITY CHANNEL INDEX FOR CONSTRUCTION INDUSTRY S.NO COMPANY HIGH LOW CLOSE COMMODITY CHANNEL INDEX 1 Larsen And Toubro 1,846.45 1,795.00 1,842.25 -185.9 2 Dlf Ltd 155.85 151.55 154.45 -12.92 Source: Karvy Stock Broking Ltd INFERENCE In this table 4.13 commodity channel index indicates investors to buy the Larsen And Toubro shares and it also suggest the investors stay out from the stock of DLF Ltd shares. CHART 4.13 COMMODITY CHANNEL INDEX FOR CONSTRUCTION INDUSTRY -200 -150 -100 -50 0 LARSEN AND TOUBRO DLF LTD PERCENTAGE COMPANY NAME
  • 44.
    44 4.15. FAST STOCHASTICFOR CONSTRUCTION INDUSTRY The table 4.14 shows the buy/sell signal of construction industry using fast stochastic TABLE 4.14 FAST STOCHASTIC FOR CONSTRUCTION INDUSTRY S.NO COMPANY HIGH LOW CLOSE FAST STOCHASTIC 1 LARSEN AND TOUBRO 1,846.45 1,795.00 1,842.25 12.45 2 DLF LTD 155.85 151.55 154.45 60.16 Source: Karvy Stock Broking Ltd INFERENCE In this table 4.14 fast stochastic indicates investors to buy the Larsen And Toubro shares and it also suggest the investors stay out from the stock of DLF Ltd shares. CHART 4.14 FAST STOCHASTIC FOR CONSTRUCTION INDUSTRY 0 10 20 30 40 50 60 70 LARSEN AND TOUBRO DLF LTD PERCENTAGE COMPANY NAME
  • 45.
    45 4.16 RELATIVE STRENGTHINDEX FOR CONSTRUCTION INDUSTRY The table 4.15 shows the buy/sell signal of construction industry using relative strength index TABLE 4.15 RELATIVE STRENGTH INDEX FOR CONSTRUCTION INDUSTRY S.NO COMPANY HIGH LOW CLOSE RELATIVE STRENGTH INDEX 1 LARSEN AND TOUBRO 1,846.45 1,795.00 1,842.25 33.31 2 DLF LTD 155.85 151.55 154.45 53.58 Source: Karvy Stock Broking Ltd INFERENCE In this table 4.15 RSI indicates investors to buy the DLF Ltd shares and it also suggest the investors stay out from the stock of Larsen And Toubro shares. CHART 4.15 RELATIVE STRENGTH INDEX FOR CONSTRUCTION INDUSTRY 0 10 20 30 40 50 60 LARSEN AND TOUBRO DLF LTD PERCENTAGE COMPANY NAME
  • 46.
    46 4.17. WILLIAMS %R FOR CONSTRUCTION INDUSTRY The table 4.16 shows the buy/sell signal of construction industry using williams % R TABLE 4.16 WILLIAMS % R FOR CONSTRUCTION INDUSTRY S.NO COMPANY HIGH LOW CLOSE WILLIAMS % R 1 LARSEN AND TOUBRO 1,846.45 1,795.00 1,842.25 -37.84 2 DLF LTD 155.85 151.55 154.45 -88.67 Source: Karvy Stock Broking Ltd INFERENCE In this table 4.16 Williams %R indicates investors to buy the Larsen And Toubro shares and it also suggest the investors stay out from the stock of DLF Ltd shares. CHART 4.16 WILLIAMS % R FOR CONSTRUCTION INDUSTRY -100 -80 -60 -40 -20 0 LARSEN AND TOUBRO DLF LTD PERCENTAGE COMPANY NAME
  • 47.
    47 4.18 COMMODITY CHANNELINDEX FOR CONSUMER GOODS INDUSTRY The table 4.17 shows the buy/sell signal of consumer industry using commodity channel index TABLE 4.17 COMMODITY CHANNEL INDEX FOR CONSUMER GOODS INDUSTRY S.NO COMPANY NAME HIGH LOW CLOSE COMMODITY CHANNEL INDEX 1 ASIAN PAINTS LTD 841.55 828 837 12.58 2 HINDUSTAN UNILIVER LTD 946.35 913.45 913.45 218.5 3 ITC LTD 349.1 341.7 347 75.22 Source: Karvy Stock Broking Ltd INFERENCE In this table 4.18 commodity channel index indicates investors to sell the Asian paints ltd shares and it also suggest the investors stay out from the stock of Hindustan Uniliver Ltd, Itc Ltd shares. CHART 4.17 COMMODITY CHANNEL INDEX FOR CONSUMER GOODS INDUSTRY 0 50 100 150 200 250 ASIAN PAINTS LTD HINDUSTAN UNILIVER LTD ITC LTD PERCENTAGE COMPANY NAME
  • 48.
    48 4.19 FAST STOCHASTICFOR CONSUMER GOODS INDUSTRY The table 4.18 shows the buy/sell signal of consumer industry using fast stochastic TABLE 4.18 FAST STOCHASTIC FOR CONSUMER GOODS INDUSTRY S.NO COMPANY NAME HIGH LOW CLOSE FAST STOCHASTIC 1 ASIAN PAINTS LTD 841.55 828 837 37 2 HINDUSTAN UNILIVER LTD 946.35 913.45 913.45 68.54 3 ITC LTD 349.1 341.7 347 64.67 Source: Karvy Stock Broking Ltd INFERENCE In this table 4.18 fast stochastic suggest the investors stay out from the stock of following companies shares Asian paints ltd, Hindustan Uniliver Ltd, ITC Ltd. CHART 4.18 FAST STOCHASTIC FOR CONSUMER GOODS INDUSTRY 0 10 20 30 40 50 60 70 ASIAN PAINTS LTD HINDUSTAN UNILIVER LTD ITC LTD PERCENTAGE COMPANY NAME
  • 49.
    49 4.20. RELATIVE STRENGTHINDEX FOR CONSUMER GOODS INDUSTRY The table 4.19 shows the buy/sell signal of consumer industry using relative strength index TABLE 4.19 RELATIVE STRENGTH INDEX FOR CONSUMER GOODS INDUSTRY S.NO COMPANY NAME HIGH LOW CLOSE RELATIVE STRENGTH INDEX 1 ASIAN PAINTS LTD 841.55 828 837 58.67 2 HINDUSTAN UNILIVER LTD 946.35 913.45 913.45 59.03 3 ITC LTD 349.1 341.7 347 53.83 Source: Karvy Stock Broking Ltd INFERENCE In this table 4.19 RSI indicates investors to buy the Itc Ltd shares and it also suggest the investors stay out from the stock of following shares Hindustan Uniliver Ltd, Asian paints ltd. CHART 4.19 RELATIVE STRENGTH INDEX FOR CONSUMER GOODS INDUSTRY 50 52 54 56 58 60 ASIAN PAINTS LTD HINDUSTAN UNILIVER LTD ITC LTD PERCENTAGE COMPANY NAME
  • 50.
    50 4.21 WILLIAMS %R FOR CONSUMER GOODS INDUSTRY The table 4.20 shows the buy/sell signal of consumer goods industry using williams % R TABLE 4.20 WILLIAMS % R FOR CONSUMER GOODS INDUSTRY S.NO COMPANY NAME HIGH LOW CLOSE WILLIAMS % R 1 ASIAN PAINTS LTD 841.55 828 837 -67.9 2 HINDUSTAN UNILIVER LTD 946.35 913.45 913.45 -35.4 3 ITC LTD 349.1 341.7 347 -35.31 Source: Karvy Stock Broking Ltd INFERENCE In this table 4.20 Williams %R suggest the investors stay out from the stock of following companies shares Asian paints ltd, Hindustan Uniliver Ltd, ITC Ltd. CHART 4.20 WILLIAMS % R FOR CONSUMER GOODS INDUSTRY -70 -60 -50 -40 -30 -20 -10 0 ASIAN PAINTS LTD HINDUSTAN UNILIVER LTD ITC LTD PERCENTAGE COMPANY NAME
  • 51.
    51 4.22 COMMODITY CHANNELINDEX FOR ENTERTAINMENT INDUSTRY The table 4.21 shows the buy/sell signal of entertainment industry using commodity channel index TABLE 4.21 COMMODITY CHANNEL INDEX FOR ENTERTAINMENT INDUSTRY S.NO COMPANY NAME HIGH LOW CLOSE COMMODITY CHANNEL INDEX 1 ZEE ENTERTAINMENT ENTERPRICE LTD 345.1 335 342 -112.5 Source: Karvy Stock Broking Ltd INFERENCE In this table 4.21 Commodity Channel Index suggests the investors to buy the stock. CHART 4.21 COMMODITY CHANNEL INDEX FOR ENTERTAINMENT INDUSTRY -120 -100 -80 -60 -40 -20 0 -112.5 PERCENTAGE COMPANY NAME ZEE ENTERTAINMENT ENTERPRICE LTD
  • 52.
    52 4.23 FAST STOCHASTICFOR ENTERTAINMENT INDUSTRY The table 4.22 shows the buy/sell signal of entertainment industry using fast stochastic TABLE 4.22 FAST STOCHASTIC FOR ENTERTAINMENT INDUSTRY S.NO COMPANY NAME HIGH LOW CLOS E FAST STOCHASTI C 1 ZEE ENTERTAINMENT ENTERPRICE LTD 345.1 335 342 13.21 Source: Karvy Stock Broking Ltd INFERENCE In this table 4.22 Fast Stochastic suggests the investors to buy the stock CHART 4.22 FAST STOCHATIC FOR ENTERTAINMENT INDUSTRY 0 2 4 6 8 10 12 14 PERCENTAGE COMPANY NAME ZEE ENTERTAINMENT ENTERPRICE LTD
  • 53.
    53 4.24 RELATIVE STRENGTHINDEX FOR ENTERTAINMENT INDUSTRY The table 4.23 shows the buy/sell signal of entertainment industry using relative strength index TABLE 4.23 RELATIVE STRENGTH INDEX FOR ENTERTAINMENT INDUSTRY S.NO COMPANY NAME HIGH LOW CLOS E RELATIVE STRENGTH INDEX 1 ZEE ENTERTAINMENT ENTERPRISE LTD 345.1 335 342 30.1 Source: Karvy Stock Broking Ltd INFERENCE In this table 4.23 RSI suggests the investors to buy the stock. CHART 4.23 RELATIVE STRENGTH INDEX FOR ENTERTAINMENT INDUSTRY 0 5 10 15 20 25 30 35 PERCENTAGE COMPANY NAME ZEE ENTERTAINMENT ENTERPRICE LTD
  • 54.
    54 4.25 WILLIAMS %R FOR ENTERTAINMENT INDUSTRY The table 4.24 shows the buy/sell signal of entertainment industry using williams % R TABLE 4.24 WILLIAMS % R FOR ENTERTAINMENT INDUSTRY S.NO COMPANY NAME HIGH LOW CLOS E WILLIAMS %R 1 ZEE ENTERTAINMENT ENTERPRISE LTD 345.1 335 342 -87.96 Source: Karvy Stock Broking Ltd INFERENCE In this table 4.24 Williams %R suggests the investors to buy the stock. CHART 4.24 WILLIAMS % R FOR ENTERTAINMENT INDUSTRY -100 -80 -60 -40 -20 0 PERCENTAGE COMPANY NAME ZEE ENTERTAINMENT ENTERPRICE LTD
  • 55.
    55 4.26. COMMODITY CHANNELINDEX FOR INDUSTRIAL MANUFACTURING The table 4.25 shows the buy/sell signal of industrial manufacturing industry using commodity channel index TABLE 4.25 COMMODITY CHANNEL INDEX FOR INDUSTRIAL MANUFACTURING S.NO COMPANY NAME HIGH LOW CLOSE COMMODIT Y CHANNEL INDEX 1 BHARTI HEAVY ELECTRICAL LTD 273.7 266.05 273 60.45 Source: Karvy Stock Broking Ltd INFERENCE In this table 4.25 Commodity Channel Index suggest the investors to stay out from the stock. CHART 4.25 COMMODITY CHANNEL INDEX FOR INDUSTRIAL MANUFACTURING 0 10 20 30 40 50 60 70 PERCENTAGE COMPANY NAME BHARTI HEAVY ELECTRICAL LTD
  • 56.
    56 4.27 FAST STOCHASTICFOR INDUSTRIAL MANUFACTURING The table 4.26 shows the buy/sell signal of industrial manufacturing industry using fast stochastic. TABLE 4.26 FAST STOCHASTIC FOR INDUSTRIAL MANUFACTURING S.NO COMPANY NAME HIGH LOW CLOSE FAST STOCHASTI C 1 BHARTI HEAVY ELECTRICAL LTD 273.7 266.05 273 41.26 Source: Karvy Stock Broking Ltd INFERENCE In this table 4.26 Fast Stochastic suggest the investors to stay out from the stock. CHART 4.26 FAST STOCHASTIC FOR INDUSTRIAL MANUFACTURING 0 10 20 30 40 50 PERCENTAGE COMPANY NAME BHARTI HEAVY ELECTRICAL LTD
  • 57.
    57 4.28 RELATIVE STRENGTHINDEX FOR INDUSTRIAL MANUFACTURING The table 4.27 shows the buy/sell signal of industrial manufacturing industry using relative strength index TABLE 4.27 RELATIVE STRENGTH INDEX FOR INDUSTRIAL MANUFACTURING S.NO COMPANY NAME HIGH LOW CLOSE RELATIVE STRENGTH INDEX 1 BHARTI HEAVY ELECTRICAL LTD 273.7 266.05 273 52.8 Source: Karvy Stock Broking Ltd INFERENCE In this table 4.27 RSI indicate sell signal. CHART 4.27 RELATIVE STRENGTH INDEX FOR INDUSTRIAL MANUFACTURING 0 10 20 30 40 50 60 PERCENTAGE COMPANY NAME BHARTI HEAVY ELECTRICAL LTD
  • 58.
    58 4.29 WILLIAMS %R FOR INDUSTRIAL MANUFACTURING The table 4.28 shows the buy/sell signal of industrial manufacturing industry using williams % R TABLE 4.28 WILLIAMS % R FOR INDUSTRIAL MANUFACTURING S.NO COMPANY NAME HIGH LOW CLOSE WILLIAMS % R 1 BHARTI HEAVY ELECTRICAL LTD 273.7 266.05 273 52.8 Source: Karvy Stock Broking Ltd INFERENCE In this table 4.28 Williams %R suggest the investors to stay out from the stock. CHART 4.28 WILLIAMS % R FOR INDUSTRIAL MANUFACTURING 0 10 20 30 40 50 60 PERCENTAGE COMPANY NAME BHARTI HEAVY ELECTRICAL LTD
  • 59.
    59 4.30 COMMODITY CHANNELINDEX FOR METAL AND MINING INDUSTRY The table 4.29 shows the buy/sell signal of metal and miming industry using commodity channel index TABLE 4.29 COMMODITY CHANNEL INDEX FOR METAL AND MINING INDUSTRY S.NO COMPANY NAME HIGH LOW CLOSE COMMODITY CHANNEL INDEX 1 COAL INDIA LTD 375.2 362 372 -55.79 2 HINDALCO INDUSTRIES LTD 154 146.9 153.05 -128.9 3 JINDAL STEEL & POWER LTD 192.3 182.1 188.8 -159.6 4 NMDC LTD 133.15 127.05 133 12.54 5 SESA STERLITE LTD 215.5 208.75 212.65 -78.32 6 TATA STEEL LTD 349.2 341.25 348.5 -107.3 Source: Karvy Stock Broking Ltd INFERENCE In this table 4.29 commodity channel index indicates investors to buy Hindalco Industries Ltd, Jindal Steel & Power Ltd shares , also indicates to sell the NMDC Ltd shares and it also suggest the investors stay out from the stock of following companies shares Coal India Ltd, Sesa Sterlite Ltd, Tata Steel Ltd.
  • 60.
    60 CHART 4.29 COMMODITY CHANNELINDEX FOR METAL AND MINING INDUSTRY -160 -140 -120 -100 -80 -60 -40 -20 0 20 PERCENTAGE COMPANY NAME
  • 61.
    61 4.31 FAST STOCHASTICFOR METAL AND MINING INDUSTRY The table 4.30 shows the buy/sell signal of metal and miming industry using fast stochastic TABLE 4.30 FAST STOCHASTIC FOR METAL AND MINING INDUSTRY S.NO COMPANY NAME HIGH LOW CLOSE FAST STOCHASTIC 1 COAL INDIA LTD 375.2 362 372 50.35 2 HINDALCO INDUSTRIES LTD 154 146.9 153.05 7.12 3 JINDAL STEEL & POWER LTD 192.3 182.1 188.8 18.85 4 NMDC LTD 133.15 127.05 133 85.34 5 SESA STERLITE LTD 215.5 208.75 212.65 25.76 6 TATA STEEL LTD 349.2 341.25 348.5 4.51 Source: Karvy Stock Broking Ltd INFERENCE In this table 4.30 Fast stochastic indicates investors to buy Hindalco Industries Ltd, Jindal Steel & Power Ltd shares also indicates to sell the NMDC Ltd shares and it also suggest the investors stay out from the stock of following companies shares Coal India Ltd, Sesa Sterlite Ltd, Tata Steel Ltd.
  • 62.
    62 CHART 4.30 FAST STOCHASTICFOR METAL AND MINING INDUSTRY 0 10 20 30 40 50 60 70 80 90 PERCENTAGE COMPANY NAME
  • 63.
    63 4.32 RELATIVE STRENGTHINDEX FOR METAL AND MINING INDUSTRY The table 4.31 shows the buy/sell signal of metal and miming industry using relative strength index TABLE 4.31 RELATIVE STRENGTH INDEX FOR METAL AND MINING INDUSTRY S.NO COMPANY NAME HIGH LOW CLOSE RELATIVE STRENGTH INDEX 1 COAL INDIA LTD 375.2 362 372 43.44 2 HINDALCO INDUSTRIES LTD 154 146.9 153.05 37.17 3 JINDAL STEEL & POWER LTD 192.3 182.1 188.8 31.27 4 NMDC LTD 133.15 127.05 133 45.21 5 SESA STERLITE LTD 215.5 208.75 212.65 36.52 6 TATA STEEL LTD 349.2 341.25 348.5 31.09 Source: Karvy Stock Broking Ltd INFERENCE In this table 4.31 RSI indicates investors to sell the NMDC Ltd shares and it also suggest the investors stay out from the stock of following companies shares Coal India Ltd, Sesa Sterlite Ltd, Tata Steel Ltd, Hindalco Industries Ltd, Jindal Steel & Power Ltd.
  • 64.
    64 CHART 4.31 RELATIVE STRENGTHINDEX FOR METAL AND MIING INDUSTRY 0 5 10 15 20 25 30 35 40 45 50 PERCENTAGE COMPANY NAME
  • 65.
    65 4.33 WILLIAMS %R FOR METAL AND MINING INDUSTRY The table 4.32 shows the buy/sell signal of metal and miming industry using williams % R TABLE 4.32 WILLIAMS % R FOR METAL AND MINING INDUSTRY S.NO COMPANY NAME HIGH LOW CLOSE WILLIAMS% R 1 COAL INDIA LTD 375.2 362 372 -49.65 2 HINDALCO INDUSTRIES LTD 154 146.9 153.05 -95.53 3 JINDAL STEEL & POWER LTD 192.3 182.1 188.8 -80.57 4 NMDC LTD 133.15 127.05 133 -10.74 5 SESA STERLITE LTD 215.5 208.75 212.65 -75.17 6 TATA STEEL LTD 349.2 341.25 348.5 -98.79 Source: Karvy Stock Broking Ltd INFERENCE In this table 4.32 Williams %R indicates investors to buy Hindalco Industries Ltd, Jindal Steel & Power Ltd shares also indicates to sell the Coal India Ltd, NMDC Ltd shares and it also suggest the investors stay out from the stock of following companies shares Sesa Sterlite Ltd, Tata Steel Ltd.
  • 66.
    66 CHART 4.32 WILLIAMS% RFOR METAL AND MINING INDUSTRY -100 -90 -80 -70 -60 -50 -40 -30 -20 -10 0 PERCENTAGE COMPANY NAME
  • 67.
    67 4.34 COMMODITY CHANNELINDEX FOR OIL AND GAS INDUSTRY The table 4.33 shows the buy/sell signal of oil and gas industry using commodity channel index TABLE 4.33 COMMODITY CHANNEL INDEX FOR OIL AND GAS INDUSTRY S.NO COMPANY NAME HIGH LOW CLOSE COMMODITY CHANNEL INDEX 1 BHARAT PETROLEUM CORP LTD 780.9 768 770 71.08 2 CAIRN INDIA LTD 245 235.5 245 -61.09 3 GAIL INDIA LTD 408.1 397.6 405 17.08 4 NTPC LTD 158.7 155.2 156.25 -32.44 5 OIL& NATURAL GAS CORP LTD 321.45 317.4 321.05 -56.75 6 POWER GRID CORP OF IND LTD 273.7 266.05 273 96.53 7 RELIANCE INDUSTRIES LTD 898.75 878.15 892.5 -110.2 8 TATA POWER CO.LTD 85.9 84 84.35 -29.98 Source: Karvy Stock Broking Ltd INFERENCE In this table 4.33 commodity channel index indicates investors to buy the Gail India Ltd, Reliance Industries Ltd shares and it also suggest the investors stay out from the stock of following companies shares Bharat Petroleum Corp Ltd, Cairn India Ltd, NTPC Ltd, Oil& Natural Gas Corp Ltd, Power Grid Corp Of Ind Ltd, Tata Power Co Ltd.
  • 68.
    68 CHART 4.33 COMMODITY CHANNELINDEX FOR OIL AND GAS INDUSTRY -150 -100 -50 0 50 100 PERCENTAGE COMPANY NAME
  • 69.
    69 4.35 FAST STOCHASTICFOR OIL AND GAS INDUSTRY The table 4.34 shows the buy/sell signal of oil and gas industry using stochastic fast stochastic TABLE 4.34 FAST STOCHASTIC FOR OIL AND GAS INDUSTRY S.NO COMPANY NAME HIGH LOW CLOSE FAST STOCHASTIC 1 BHARAT PETROLEUM CORP LTD 780.9 768 770 86.88 2 CAIRN INDIA LTD 245 235.5 245 54.59 3 GAIL INDIA LTD 408.1 397.6 405 17.8 4 NTPC LTD 158.7 155.2 156.25 70.19 5 OIL& NATURAL GAS CORP LTD 321.45 317.4 321.05 47.28 6 POWER GRID CORP OF IND LTD 273.7 266.05 273 82.98 7 RELIANCE INDUSTRIES LTD 898.75 878.15 892.5 12.76 8 TATA POWER CO.LTD 85.9 84 84.35 69.68 Source: Karvy Stock Broking Ltd INFERENCE In this table 4.34 fast stochastic indicates investors to buy the Gail India Ltd, Reliance Industries Ltd shares, also indicate to sell the Power Grid Corp Of Ind Ltd shares and it also suggest the investors stay out from the stock of following companies shares Bharat Petroleum Corp Ltd, Cairn India Ltd, NTPC Ltd, Oil& Natural Gas Corp Ltd, Tata Power Co Ltd.
  • 70.
    70 CHART 4.34 FAST STOCHASTICFOR OIL AND GAS INDUSTRY 0 10 20 30 40 50 60 70 80 90 PERCENTAGE COMPANY NAME
  • 71.
    71 4.36 RELATIVE STRENGTHINDEX FOR OIL AND GAS INDUSTRY The table 4.35 shows the buy/sell signal of oil and gas industry using relative strength index. TABLE 4.35 RELATIVE STRENGTH INDEX FOR OIL AND GAS INDUSTRY Source: Karvy Stock Broking Ltd INFERENCE In this table 4.35 RSI indicates investors to buy the Tata Power Co Ltd shares, also indicate to sell the Bharat Petroleum Corp Ltd shares and it also suggest the investors stay out from the stock of following companies shares Cairn India Ltd, NTPC Ltd, Oil& Natural Gas Corp Ltd, Gail India Ltd, Reliance Industries Ltd, Power Grid Corp Of Ind Ltd. S.NO COMPANY NAME HIGH LOW CLOSE RELATIVE STRENGTH INDEX 1 BHARAT PETROLEUM CORP LTD 780.9 768 770 51.41 2 CAIRN INDIA LTD 245 235.5 245 43.91 3 GAIL INDIA LTD 408.1 397.6 405 34.71 4 NTPC LTD 158.7 155.2 156.25 42.76 5 OIL& NATURAL GAS CORP LTD 321.45 317.4 321.05 42.33 6 POWER GRID CORP OF IND LTD 273.7 266.05 273 63.86 7 RELIANCE INDUSTRIES LTD 898.75 878.15 892.5 31.88 8 TATA POWER CO.LTD 85.9 84 84.35 48.5
  • 72.
    72 CHART 4.35 RELATIVE STRENGTHINDEX FOR OIL AND GAS INDUSTRY 0 10 20 30 40 50 60 70 PERCENTAGE COMPANY NAME
  • 73.
    73 4.37 WILLIAMS %R FOR OIL AND GAS INDUSTRY The table 4.36 shows the buy/sell signal of oil and gas industry using williams % r. TABLE 4.36 WILLIAMS % R FOR OIL AND GAS INDUSTRY S.NO COMPANY NAME HIGH LOW CLOSE WILLIAMS % R 1 BHARAT PETROLEUM CORP LTD 780.9 768 770 -13.12 2 CAIRN INDIA LTD 245 235.5 245 -45.41 3 GAIL INDIA LTD 408.1 397.6 405 -82.2 4 NTPC LTD 158.7 155.2 156.25 -29.81 5 OIL& NATURAL GAS CORP LTD 321.45 317.4 321.05 -53.7 6 POWER GRID CORP OF IND LTD 273.7 266.05 273 -15.03 7 RELIANCE INDUSTRIES LTD 898.75 878.15 892.5 -87.5 8 TATA POWER CO.LTD 85.9 84 84.35 -33.32 Source: Karvy Stock Broking Ltd INFERENCE In this table 4.36 Williams %R indicates investors to buy the Gail India Ltd, Reliance Industries Ltd shares, also indicate to sell the Bharat Petroleum Corp Ltd, Power Grid Corp Of Ind Ltd shares and it also suggest the investors stay out from the stock of following companies shares Cairn India Ltd, NTPC Ltd, Oil& Natural Gas Corp Ltd,Tata Power Co Ltd.
  • 74.
    74 CHART 4.36 WILLIAMS %R FOR OIL AND GAS INDUSTRY -90 -80 -70 -60 -50 -40 -30 -20 -10 0 PERCENTAGE COMPANY NAME
  • 75.
    75 4.38 COMMODITY CHANNELINDEX FOR PHARMATICAL INDUSTRY The table 4.37 shows the buy/sell signal of oil and gas industry using commodity channel index TABLE 4.37 COMMODITY CHANNEL INDEX FOR PHARMATICAL INDUSTRY S.NO COMPANY NAME HIGH LOW CLOSE COMMODITY CHANNEL INDEX 1 CIPLA LTD 746.4 725 730 -145 2 DR.REDDY’S LABORATORIES LTD 155.85 151.55 154.45 -0.22 3 LUPIN LTD 1,843.40 1,776.05 1,781.10 140.3 4 SUN PHARMA INDUSTRIES LTD 1,045.95 1,005.50 1,018.00 -43.72 Source: Karvy Stock Broking Ltd INFERENCE In this table 4.37 commodity channel index indicates investors to buy the Cipla Ltd shares, also indicate to sell the Lupin Ltd shares and it also suggest the investors stay out from the stock of following companies shares Dr.Reddy’s Laboratories Ltd, Sun Pharma Industries Ltd. CHART 4.37 COMMODITY CHANNEL INDEX FOR PHARMATICAL INDUSTRY -200 0 200 PERCENTAGE COMPANY NAME
  • 76.
    76 4.39 FAST STOCHASTICFOR PHARMATICAL INDUSTRY The table 4.38 shows the buy/sell signal of oil and gas industry using fast stochastic. TABLE 4.38 FAST STOCHASTIC FOR PHARMATICAL INDUSTRY S.NO COMPANY NAME HIGH LOW CLOS E FAST STOCHASTI C 1 CIPLA LTD 746.4 725 730 20.6 2 DR.REDDY’S LABORATORIES LTD 155.85 151.55 154.45 35.6 3 LUPIN LTD 1,843.40 1,776.0 5 1,781.1 0 64.73 4 SUN PHARMA INDUSTRIES LTD 1,045.95 1,005.5 0 1,018.0 0 48.32 Source: Karvy Stock Broking Ltd INFERENCE In this table 4.38 fast stochastic indicates investors to buy the Cipla Ltd shares and it also suggest the investors stay out from the stock of following companies shares Dr.Reddy’s Laboratories Ltd, Lubin Ltd, Sun Pharma Industries Ltd. CHART 4.38 FAST STOCHASTIC FOR PHARMATICAL INDUSTRY 0 20 40 60 80 PERCENTAGE COMPANY NAME
  • 77.
    77 4.40 RELATIVE STRENGTHINDEX FOR PHARMATICAL INDUSTRY The table 4.39 shows the buy/sell signal of pharmacy industry using relative strength index.. TABLE 4.39 RELATIVE STRENGTH INDEX FOR PHARMATICAL INDUSTRY S.NO COMPANY NAME HIGH LOW CLOSE RELATIVE STRENGTH INDEX 1 CIPLA LTD 746.4 725 730 46.75 2 DR.REDDY’S LABORATORIES LTD 155.85 151.55 154.45 50.73 3 LUPIN LTD 1,843.40 1,776.0 5 1,781.1 0 55.81 4 SUN PHARMA INDUSTRIES LTD 1,045.95 1,005.5 0 1,018.0 0 42.41 Source: Karvy Stock Broking Ltd INFERENCE In this table 4.39 RSI indicates investors to buy the Dr.Reddy’s Laboratories Ltd, Lubin Ltd shares and it also suggest the investors stay out from the stock of following companies shares Cipla Ltd, Sun Pharma Industries Ltd. CHART 4.39 RELATIVE STRENGTH INDEX FOR PHARMATICAL INDUSTRY 0 20 40 60 PERCENTAGE COMPANY NAME
  • 78.
    78 4.41 WILLIAMS %R FOR PHARMATICAL INDUSTRY The table 4.40 shows the buy/sell signal of pharmacy industry using williams % r. TABLE 4.40 WILLIAMS % R FOR PHARMATICAL INDUSTRY S.NO COMPANY NAME HIGH LOW CLOSE WILLIAMS % R 1 CIPLA LTD 746.4 725 730 -82.4 2 DR.REDDY’S LABORATORIES LTD 155.85 151.55 154.45 -67.4 3 LUPIN LTD 1,843.40 1,776.0 5 1,781.1 0 -35.45 4 SUN PHARMA INDUSTRIES LTD 1,045.95 1,005.5 0 1,018.0 0 -34.33 Source: Karvy Stock Broking Ltd INFERENCE In this table 4.40 Williams % R indicates investors to buy the Cipla Ltd, Sun Pharma Industries Ltd shares and it also suggest the investors stay out from the stock of following companies shares Dr.Reddy’s Laboratories Ltd, Lubin Ltd. CHART 4.40 WILLIAMS % R FOR PHARMATICAL INDUSTRY -100 -80 -60 -40 -20 0 PERCENTAGE COMPANY NAME
  • 79.
    79 4.42. COMMODITY CHANNELINDEX FOR SOFTWARE INDUSTRY The table 4.41 shows the buy/sell signal of software industry using commodity channel index TABLE 4.41 COMMODITY CHANNEL INDEX FOR SOFTWARE INDUSTRY S.NO COMPANY NAME HIGH LOW CLOSE COMMODITY CHANNEL INDEX 1 HCL TECHNOLIGIES LTD 2,074.90 2,035.95 2,036.00 -95.67 2 INFOSYS LTD 946.35 913.45 913.45 0.59 3 TCS LTD 2,770.70 2,681.05 2,750.00 32.5 4 TECH MAHINDRA LTD 2,912.80 2,851.10 2,880.00 -56.69 5 WIPRO LTD 669.9 655.25 659.9 -105.9 Source: Karvy Stock Broking Ltd INFERENCE In this table 4.41 commodity channel index indicates investors to sell the wipro ltd shares and it also suggest the investors stay out from the stock of following companies shares Hcl Technologies Ltd, Infosys Ltd, TCS Ltd, Tech Mahindra Ltd.
  • 80.
    80 CHART 4.41 COMMODITY CHANNELINDEX FOR SOFTWARE INDUSTRY -120 -100 -80 -60 -40 -20 0 20 40 PERCENTAGE COMPANY NAME
  • 81.
    81 4.43 FAST STOCHASTICFOR SOFTWARE INDUSTRY The table 4.42 shows the buy/sell signal of software industry using fast stochastic TABLE 4.42 FAST STOCHASTIC FOR SOFTWARE INDUSTRY S.NO COMPANY NAME HIGH LOW CLOSE FAST STOCHASTIC 1 HCL TECHNOLIGIES LTD 2,074.90 2,035.95 2,036.00 18.09 2 INFOSYS LTD 946.35 913.45 913.45 57.56 3 TCS LTD 2,770.70 2,681.05 2,750.00 50.65 4 TECH MAHINDRA LTD 2,912.80 2,851.10 2,880.00 24.34 5 WIPRO LTD 669.9 655.25 659.9 75.4 Source: Karvy Stock Broking Ltd INFERENCE In this table 4.42 fast stochastic indicates investors to buy the HCL Technologies Ltd shares and it also suggest the investors stay out from the stock of following companies shares Wipro ltd, Infosys Ltd, TCS Ltd, Tech Mahindra Ltd.
  • 82.
    82 CHART 4.42 FAST STOCHASTICFOR SOFTWARE INDUSTRY 0 10 20 30 40 50 60 70 80 PERCENTAGE COMPANY NAME
  • 83.
    83 4.44 RELATIVE STRENGTHINDEX FOR SOFTWARE INDUSTRY The table 4.43 shows the buy/sell signal of software industry using relative strength index TABLE 4.43 RELATIVE STRENGTH INDEX FOR SOFTWARE INDUSTRY S.NO COMPANY NAME HIGH LOW CLOSE RELATIVE STRENGTH INDEX 1 HCL TECHNOLIGIES LTD 2,074.90 2,035.95 2,036.00 40.87 2 INFOSYS LTD 946.35 913.45 913.45 54.45 3 TCS LTD 2,770.70 2,681.05 2,750.00 47.98 4 TECH MAHINDRA LTD 2,912.80 2,851.10 2,880.00 52.18 5 WIPRO LTD 669.9 655.25 659.9 55.63 Source: Karvy Stock Broking Ltd INFERENCE In this table 4.43 RSI indicates investors to sell the TCS Ltd, Tech Mahindra Ltd shares and it also suggest the investors stay out from the stock of following companies shares Wipro ltd, Infosys Ltd, HCL Technologies Ltd.
  • 84.
    84 CHART 4.43 RELATIVE STRENGTHINDEX FOR SOFTWARE INDUSTRY 0 10 20 30 40 50 60 PERCENTAGE COMPANY NAME
  • 85.
    85 4.45 WILLIAMS %RFOR SOFTWARE INDUSTRY The table 4.44 shows the buy/sell signal of software industry using williams %R TABLE 4.44 WILLIAMS %R FOR SOFTWARE INDUSTRY S.NO COMPANY NAME HIGH LOW CLOSE WILLIAMS % R 1 HCL TECHNOLIGIES LTD 2,074.90 2,035.95 2,036.00 -85.86 2 INFOSYS LTD 946.35 913.45 913.45 -43.94 3 TCS LTD 2,770.70 2,681.05 2,750.00 -48.64 4 TECH MAHINDRA LTD 2,912.80 2,851.10 2,880.00 -75.89 5 WIPRO LTD 669.9 655.25 659.9 -23.65 Source: Karvy Stock Broking Ltd INFERENCE In this table 4.44 Williams %R indicates investors to sell the TCS Ltd shares, also indicates to buy the HCL Technologies Ltd shares and it also suggest the investors stay out from the stock of following companies shares Wipro ltd, Infosys Ltd, Tech Mahindra Ltd.. CHART 4.44 WILLIAMS % R FOR SOFTWARE INDUSTRY -100 -50 0 PERCENTAGE COMPANY NAME
  • 86.
    86 4.46 COMMODITY CHANNELINDEX FOR TELECOMMUNICATION INDUSTRY The table 4.45 shows the buy/sell signal of telecom industry using commodity channel index. TABLE 4.45 COMMODITY CHANNEL INDEX FOR TELECOMMUNICATION INDUSTRY S.NO COMPANY NAME HIGH LOW CLOSE COMMODITY CHANNEL INDEX 1 BHARTI AIRTEL LTD 351.9 344.05 351.4 -10.72 Source: Karvy Stock Broking Ltd INFERENCE In this table 4.45 Commodity Channel Index suggest the investors to stay out from the stock CHART 4.45 COMMODITY CHANNEL INDEX FOR TELECOMMUNICATION INDUSTRY -12 -10 -8 -6 -4 -2 0 PERCENTAGE COMPANY NAME BHARTI AIRTEL LTD
  • 87.
    87 4.47 FAST STOCHASTICFOR TELECOMMUNICATION INDUSTRY The table 4.46 shows the buy/sell signal of telecom industry using fast stochastic TABLE 4.46 FAST STOCHASTIC FOR TELECOMMUNICATION INDUSTRY S.NO COMPANY NAME HIGH LOW CLOSE FAST STOCHASTIC 1 BHARTI AIRTEL LTD 351.9 344.05 351.4 67.67 Source: Karvy Stock Broking Ltd INFERENCE In this table 4.46 Fast Stochastic suggest the investors to stay out from the stock CHART 4.46 FAST STOCHASTIC FOR TELECOMMUNICATION INDUSTRY 0 10 20 30 40 50 60 70 PERCENTAGE COMPANY NAME BHARTI AIRTEL LTD
  • 88.
    88 4.48 RELATIVE STRENGTHINDEX FOR TELECOM INDUSTRY The table 4.47 shows the buy/sell signal of telecom industry using relative strength index TABLE 4.47 RELATIVE STRENGTH INDEX FOR TELECOM INDUSTRY S.NO COMPANY NAME HIGH LOW CLOSE RELATIVE STRENGTH INDEX 1 BHARTI AIRTEL LTD 351.9 344.05 351.4 42.06 Source: Karvy Stock Broking Ltd INFERENCE In this table 4.47 RSI suggest the investors to stay out from the stock CHART 4.47 RELATIVE STRENGTH INDEX FOR TELECOMMUNICATION INDUSTRY 0 10 20 30 40 50 PERCENTAGE COMPANY NAME BHARTI AIRTEL LTD
  • 89.
    89 4.49 WILLIAMS %RFOR TELECOM INDUSTRY The table 4.48 shows the buy/sell signal of telecom industry using williams %R TABLE 4.48 WILLIAMS %R FOR TELECOM INDUSTRY S.NO COMPANY NAME HIGH LOW CLOSE WILLIAMS % R 1 BHARTI AIRTEL LTD 351.9 344.05 351.4 -34.33 Source: Karvy Stock Broking Ltd INFERENCE In this table 4.48 Williams %R suggest the investors to stay out from the stock. CHART 4.48 WILLIAMS %R FOR TELECOMMUNICATION INDUSTRY -35 -30 -25 -20 -15 -10 -5 0 PERCENTAGE COMPANY NAME BHARTI AIRTEL LTD
  • 90.
    90 CHAPTER V FINDINGS, SUGGESTIONSAND CONCLUSION 5.1 INTRODUCTION In this study an attempt is made to analyze the nifty 50 scrip in karvy stock broking ltd using technical indicators. This study is based on secondary data. Secondary data were collected from website, books, news papers, television, and magazines. The study is undertaken during the period from January to February 2015. The collected data were analysed with the help of Commodity Channel Index, Fast Stochastic ,Williams %R and RSI . The summary of findings of the study based on the analysis is presented in this part. 5.2 FINDINGS 5.2.1.AUTO MOBILE INDUSTRY HERO MOTOCORP LTD Commodity Channel Index, Fast stochastic, RSI, Williams %R suggest the investor the investors to stay out from the stock. MAHNDRA AND MAHINDRA Commodity Channel Index, Fast stochastic, RSI, Williams %R suggest the investor the investors to stay out from the stock. MARUTI SUZUKI INDIA LTD Commodity Channel Index, Fast stochastic, Williams %R indicates buy signal and RSI suggests the investors to stay out from the stock. TATA MOTORS LTD Commodity Channel Index, Fast stochastic, Williams %R suggests the investors to stay out from the stock and RSI indicates sell signal. BAJAJ AUTO LTD Commodity Channel Index, Fast stochastic, RSI suggests the investors to stay out from the stock and Williams %R indicates sell signal.
  • 91.
    91 5.2.2.BANKING INDUSTRY AXIS BANK CommodityChannel Index, Fast stochastic, RSI, Williams %R suggests the investors to buy the stock BANK OF BARODA Commodity Channel Index, Fast stochastic, RSI, Williams %R suggests the investors to stay out from the stock. HDFC BANK LTD Commodity Channel Index, Fast stochastic, RSI, Williams %R suggests the investors to buy the stock. ICICI BANK LTD Commodity Channel Index, Fast stochastic, Williams %R suggests the investors to stay out from the stock and RSI suggests the investors to sell the stock IDFC LTD Commodity Channel Index, Fast stochastic, Williams %R, RSI suggests the investors to stay out from the stock. INDUSLAND BANK LTD Commodity Channel Index, RSI suggests the investors to stay out from the stock and Fast stochastic and Williams %R suggest to buy the stock. KOTAK MAHINDRA BANK LTD Commodity Channel Index, RSI, Fast stochastic and Williams %R suggest to buy the stock. PUNJAB NATIONAL BANK Commodity Channel Index, RSI suggests the investor to stay out from the stock,Fast stochastic and Williams %R suggests the investors to buy the stock STATE BANK OF INDIA Commodity Channel Index, RSI, Fast stochastic and Williams %R suggests the investors to stay out from the stock.
  • 92.
    92 5.2.3.CEMENT INDUSTRY ACC LTD CommodityChannel Index, Fast stochastic and Williams %R indicates buy signal and RSI suggests the investors to stay out from the stock. AMBUJA CEMENTS LTD Commodity Channel Index, RSI suggests the investors to stay out from the stock,Fast Stochastic and Williams %R indicates buy signal. GRASIM INDUSTRY LTD Commodity Channel Index, ,Fast Stochastic and Williams %R suggests the investors to stay out from the stock and RSI indicates sell signal. ULTRATECH CEMENT LTD Commodity Channel Index suggests the investors to stay out from the stock and Fast Stochastic, Williams %R and RSI indicates buy signal TORRENT POWER COMPANY LTD Channel Index, RSI suggests the investors to stay out from the stock, Fast Stochastic and Williams %R indicates sell signal. 5.2.4.CONSTRUCTION INDUSTRY DLF LTD Commodity Channel Index ,Fast Stochastic and Williams %R indicates buy signal, RSI suggests the investors to stay out from the stock LARSEN &TOUBRO LTD Commodity Channel Index, Fast Stochastic and Williams %R suggests the investors to stay out from the stock and RSI indicate buy signal 5.2.5.CONSUMER GOODS INDUSTRY ASIAN PAINTS LTD Commodity Channel Index indicate sell signal, Fast Stochastic ,Williams %R and RSI suggests the investors to stay out from the stock
  • 93.
    93 HINDUSTAN UNILIVER LTD CommodityChannel Index, Fast Stochastic ,Williams %R and RSI suggests the investors to stay out from the stock ITC LTD Commodity Channel Index, Fast Stochastic ,Williams %R suggests the investors to stay out from the stock and RSI indicates buy signal. 5.2.6.ENTERTAINMENT INDUSTRY ZEE ENTERTAINMENT ENTERPRICE LTD Commodity Channel Index, Fast Stochastic ,Williams %R, RSI suggests the investors to buy the stock. 5.2.7. INDUSTRIAL MANUFACTURING INDUSTRY BHARAT HEAVY ELETRICAL LTD Commodity Channel Index, Fast Stochastic ,Williams %R suggest the investors to stay out from the stock and RSI indicate sell signal 5.2.8. METAL AND MIMING INDUSTRY COAL INDIA LTD Commodity Channel Index, Fast Stochastic ,RSI suggest the investors to stay out from the stock and Williams %R indicate sell signal. HINDALCO INDUSTRIES LTD Commodity Channel Index, Fast Stochastic and Williams %R indicate buy signal and RSI suggest the investors to stay out from the stock JINDAL STEEL AND POWER LTD Commodity Channel Index, Fast Stochastic and Williams %R indicate buy signal and RSI suggest the investors to stay out from the stock
  • 94.
    94 NMDC LTD Commodity ChannelIndex, Fast Stochastic, Williams %R and RSI suggest the investors to sell the stock SESA STERLITE LTD Commodity Channel Index, Fast Stochastic, Williams %R and RSI suggest the investors to stay out from the stock. TATA STEEL LTD Commodity Channel Index, Fast Stochastic, Williams %R and RSI suggest the investors to stay out from the stock. 5.2.9.OIL AND GAS INDUSTRY BHARAT PETROLIAM CORP LTD Commodity Channel Index suggest investors to stay out from the stock, Fast Stochastic, Williams %R and RSI indicate sell the stock CAIRN INDIA LTD Commodity Channel Index, Fast Stochastic, Williams %R and RSI suggest investors to stay out from the stock. GAIL INDIA LTD Commodity Channel Index, Fast Stochastic, Williams %R indicate buy signal and RSI suggest investors to stay out from the stock NTPC LTD Commodity Channel Index, Fast Stochastic, Williams %R and RSI suggest investors to stay out from the stock. OIL AND NATURAL GAS CORP LTD Commodity Channel Index, Fast Stochastic, Williams %R and RSI suggest investors to stay out from the stock POWER GRID CORP OF INDIA LTD Commodity Channel Index, RSI suggest investors to stay out from the stock, Fast Stochastic and Williams %R indicate sell signal
  • 95.
    95 RELIANCE INDUSTRIES LTD CommodityChannel Index, Fast Stochastic, Williams %R indicate buy signal and RSI suggest investors to stay out from the stock. TATA POWER CO Commodity Channel Index, Fast Stochastic, Williams %R suggest the investors to stay out from the stock and RSI indicate buy signal 5.2.10.PHARMACY INDUSTRY CIPLA LTD Commodity Channel Index, Fast Stochastic, Williams %R indicate buy signal and RSI suggest the investors to stay out from the stock DR.REDDY LAB LTD Commodity Channel Index, Fast Stochastic, Williams %R suggest the investors to stay out from the stock and RSI indicate buy signal LUBIN LTD Commodity Channel Index indicates sell signal, Fast Stochastic, Williams %R suggest the investors to stay out from the stock and RSI indicate buy signal SUN PHARMA INDUSTRIES LTD Commodity Channel Index, Fast Stochastic, RSI suggest the investors to stay out from the stock and Williams %R indicate buy signal 5.2.11 .SOFTWARE INDUSTRY HCL TECHNOLOGIES LTD Commodity Channel Index, RSI suggest the investors to stay out from the stock and Fast Stochastic , Williams %R indicate buy signal. INFOSYS LTD. Commodity Channel Index, RSI, Fast Stochastic and Williams %R suggest the investors to stay out from the stock .
  • 96.
    96 TCS LTD Commodity ChannelIndex, Fast Stochastic suggest the investors to stay out from the stock and RSI, Williams %R indicates sell signal. TECH MAHINDRA LTD Commodity Channel Index, Fast Stochastic, Williams %R suggest the investors to stay out from the stock and RSI indicates sell signal WIPRO LTD Fast Stochastic, RSI, Williams %R suggest the investors to stay out from the stock and Commodity Channel Index indicates sell signal 5.2.12.TELECOME INDUSTRY BHARTI AIRTEL LTD. Commodity Channel Index ,Fast Stochastic, RSI, Williams %R suggest the investors to stay out from the stock
  • 97.
    97 5.3 SUGGESTION  Whileevaluating the shares fluctuation in nifty, traders and investors can predict the investors capital through the volume based indicators.  By analyzing the four indicators , it is found that RSI and Commodity Channel Index are provide a reliable suggestion while compared to other indicators. Therefore both the traders and investors can follow these indicators..  Each indicators provides different type of suggestion . for example while RSI shows the stock to hold for long term, other one that stochastic show to sell for short term. Therefore the investors should not always follow the same indicators.  The indicators are using by traders/ investors to make money in stock market as it shows the trend of a specific stock or an index by helping them to predict the future movement of share price. therefore ,it is essential for the investors and watching market. But sometime its fail to predict the future accurately.  Hence its vital to the investors to follow fundamental analysis and company analysis. Then only they can make money in a profitable manner.
  • 98.
    98 5.3 CONCLUSION The study“A technical analysis on nifty scrip using technical indicators in Karvy stock broking ltd” analyses the price movement of 12 industries under nifty by 4 indicators namely commodity Channel Index, Fast stochastic , RSI and Williams % R and 14 leave days effect of karvy stock broking ltd on the share price. The study reveals that there will be a frequent fluctuation in the share market, so its difficulty to predict the stock price movement. In order to avoid such difficulties the company has to make constant research and the investors has to do regular market watch. It is concluded that there is a lack of perfectness in guidance of technical indicators. Thus the investor get different guidance while making investment. So they should aware about the indicators strength and drawbacks. For this purpose the company can conduct awareness program regarding the effectiveness of technical indicators to the both the traders and investors. And the leave days create the good opportunity for the investors to make investment in the stock by offering the possibility for the growth in the share price. Technical analysis help the investor and trader to add the stocks in their portfolio. Even though the technical indicators help to know the trend, it becomes to be failed when the fundamental news suddenly get strong.
  • 99.
    99 BIBLIOGRAPHY JOURNAL & MAGAZINE 1.Taylor,M.P. and H. Allen, “The use of Technical Analysis in the Foreign Exchange Market,” Journal of International Money and Finance, Volume 11, 1992, 2.fama,E., “The Behaviour of Stock Market Prices,” Journal of Business, volume 11, 1992,Pp . 34-105 3.fern`Andez- Rodr`Iguez, Fernando,. “on the profitability of Technical Trading Rules based on Artificial Neural Networks: Evidence from the Madrid stock market.” Economic Letters ,Volume 69(1), 2000Pp. 89-94. 4.Levich, R. and L.Thomas, the significance of Technical Trading Rule Profits in the Foreign Exchange Market: A Bootstrap Approach, Journal of International Money and Finance, Volume 12, 1993 Pp .451-474. 5.Jenni L.Bettman, Stephen j.Sault , Emma L. Schultz, “Applying Fundamental Analysis and Neural Networks in the Australian Stock market” . International Conference on Artificial Intelligence in Science and Technology (AISAT) September 2008.
  • 100.