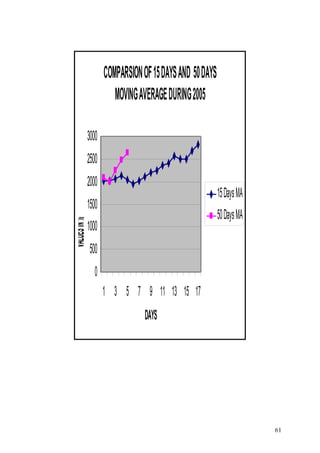
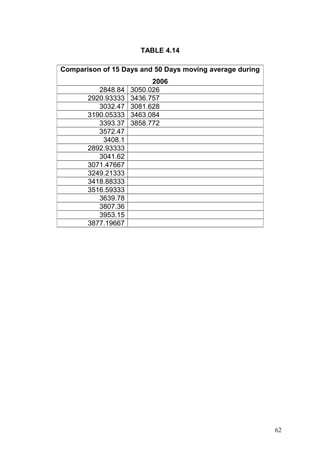
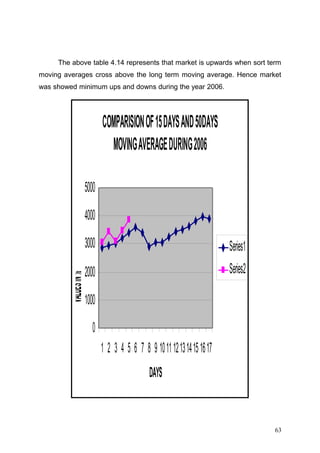
Downloaded 65 times

![US$ 1.46 trillion, making it the second largest stock exchange in [South
Asia].Which stand as a hub for the world investors, that is the reason why we
face lots of volatility in the market.
The interest in studying the movement of S&PCNX NIFTY Index
considerable momentum following the early study of Ms.Shalini Batia (2007)
Indicated that trader can profit from the discrepancy in the prices of NIFTY.
Mr.Saumitra N Bhaduri (2007) indicated hedging return gives better
performance in long time horizons only. Dr.Srinivas, S.S.Kumar (2005)
observed that the stock prices, on average increase and decrease significantly
on the effective day for the NIFTY Index. In this connection the researcher
would like to make on attempt to study on Technical Analysis on S&P CNX
NIFTY Index in India.
2](https://image.slidesharecdn.com/technical-analysisprojectreport-140204041315-phpapp02/85/Technical-analysis-project-report-2-320.jpg)
![1.2.
ABOUT STOCK EXCHANGE :
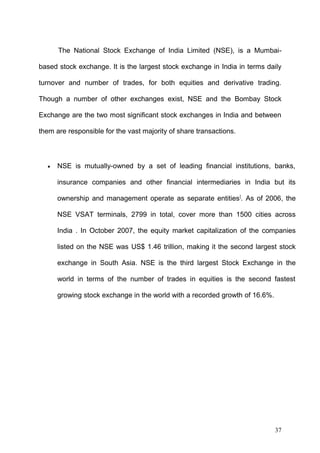
The National Stock Exchange of India Limited (NSE) is a Mumbai-based
stock exchange. It is the largest stock exchange in India and the third largest
in the world in terms of volume of transactions. Though a number of other
exchanges exist, NSE and the Bombay Stock Exchange are the two most
significant stock exchanges in India, and between them are responsible for the
vast majority of share transactions.NSE is mutually-owned by a set of leading
financial institutions, banks, insurance companies and other financial
intermediaries in India but its ownership and management operate as
separate entities. As of 2006, the NSE VSAT terminals, 2799 in total, cover
more than 1500 cities across India. In October 2007, the equity market
capitalization of the companies listed on the NSE was US$ 1.46 trillion,
making it the second largest stock exchange in [[South Asia]. NSE is the third
largest Stock Exchange in the world in terms of the number of trades in
equities. It is the second fastest growing stock exchange in the world with a
recorded growth of 16.6
3](https://image.slidesharecdn.com/technical-analysisprojectreport-140204041315-phpapp02/85/Technical-analysis-project-report-3-320.jpg)


Index Effects on Stock Prices: Evidence from India, Bid-Ask Spreads in Emerging Markets: Evidence from The document discusses a study on the technical analysis of the S&P CNX Nifty Index in India. It introduces the Nifty Index and the importance of studying its price movements. It outlines the objectives to compare Nifty prices from 2003-2007 and analyze short and long term moving averages. The methodology involves using secondary data from the National Stock Exchange and statistical tools like trend analysis and moving averages. The study aims to help investors better understand market trends and determine when to buy and sell securities.


