Download to read offline
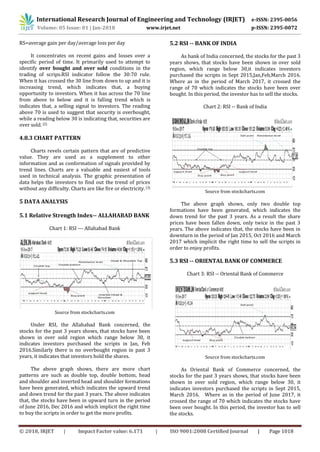
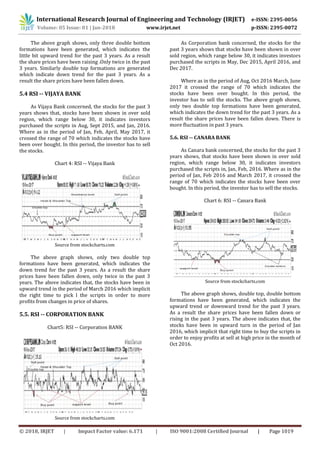
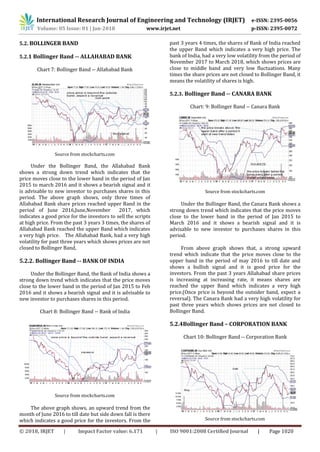
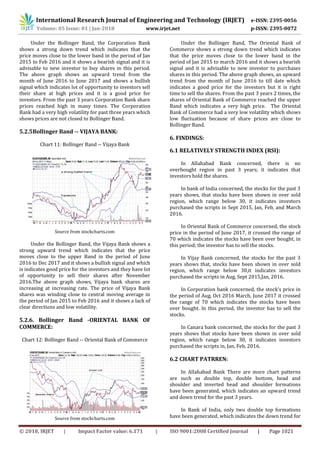
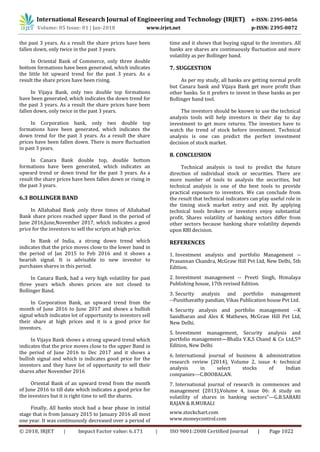

This document discusses a study on analyzing the volatility of stocks in the Indian banking sector using technical analysis tools. It aims to determine which banks perform better based on price fluctuations. The study uses tools like Bollinger bands and Relative Strength Index (RSI) to analyze weekly share price movements of six banks (Allahabad Bank, Bank of India, Oriental Bank of Commerce, Vijaya Bank, Corporation Bank, and Canara Bank) over three years. The results show that Canara Bank and Vijaya Bank exhibited the highest volatility and returns compared to other banks during the period. The analysis of technical indicators can help investors identify optimal times to buy and sell bank stocks and predict market movements.