Download as PDF, PPTX
![USING NEURAL NETWORKS TO EXPLORE
REGIONAL CLIMATE PATTERNS IN
SINGLE-FORCING LARGE ENSEMBLES
@ZLabe
Zachary M. Labe
with Dr. Elizabeth A. Barnes
Department of Atmospheric Science at Colorado State University
17 December 2021
A52E-01 – AGU Fall Meeting
“Large Ensemble Climate Model Simulations as Tools for Exploring
Natural Variability, Change Signals, and Impacts” [Oral Session I]](https://image.slidesharecdn.com/zlabelargeensemblesessionrecording-slides-211207172250/85/Using-neural-networks-to-explore-regional-climate-patterns-in-single-forcing-large-ensembles-1-320.jpg)
![USING NEURAL NETWORKS TO EXPLORE
REGIONAL CLIMATE PATTERNS IN
SINGLE-FORCING LARGE ENSEMBLES
@ZLabe
Zachary M. Labe
with Dr. Elizabeth A. Barnes
Department of Atmospheric Science at Colorado State University
17 December 2021
A52E-01 – AGU Fall Meeting
“Large Ensemble Climate Model Simulations as Tools for Exploring
Natural Variability, Change Signals, and Impacts” [Oral Session I]](https://image.slidesharecdn.com/zlabelargeensemblesessionrecording-slides-211207172250/75/Using-neural-networks-to-explore-regional-climate-patterns-in-single-forcing-large-ensembles-1-2048.jpg)
![----ANN----
2 Hidden Layers
10 Nodes each
Ridge Regularization
Early Stopping
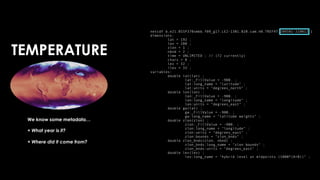
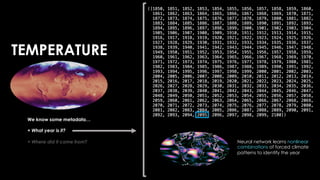
We know some metadata…
+ What year is it?
+ Where did it come from?
[e.g., Barnes et al. 2019, 2020]
[e.g., Labe and Barnes, 2021]
TIMING OF EMERGENCE
(COMBINED VARIABLES)
RESPONSES TO
EXTERNAL CLIMATE
FORCINGS
PATTERNS OF
CLIMATE INDICATORS
[e.g., Rader et al. 2021, drafted]
Surface Temperature Map Precipitation Map
+
TEMPERATURE](https://image.slidesharecdn.com/zlabelargeensemblesessionrecording-slides-211207172250/85/Using-neural-networks-to-explore-regional-climate-patterns-in-single-forcing-large-ensembles-6-320.jpg)
![----ANN----
2 Hidden Layers
10 Nodes each
Ridge Regularization
Early Stopping
We know some metadata…
+ What year is it?
+ Where did it come from?
[e.g., Barnes et al. 2019, 2020]
[e.g., Labe and Barnes, 2021]
TIMING OF EMERGENCE
(COMBINED VARIABLES)
RESPONSES TO
EXTERNAL CLIMATE
FORCINGS
PATTERNS OF
CLIMATE INDICATORS
[e.g., Rader et al. 2021, in prep]
Surface Temperature Map Precipitation Map
+
TEMPERATURE](https://image.slidesharecdn.com/zlabelargeensemblesessionrecording-slides-211207172250/85/Using-neural-networks-to-explore-regional-climate-patterns-in-single-forcing-large-ensembles-7-320.jpg)
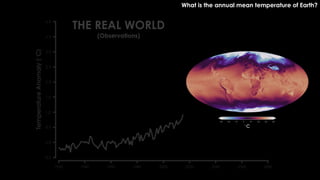
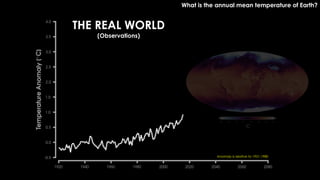
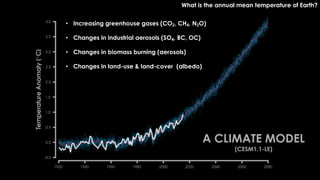
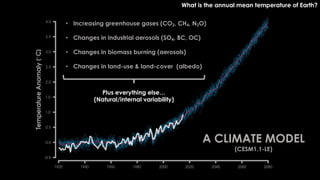
![What is the annual mean temperature of Earth?
[CESM1 "Single Forcing" Large Ensemble Project]](https://image.slidesharecdn.com/zlabelargeensemblesessionrecording-slides-211207172250/85/Using-neural-networks-to-explore-regional-climate-patterns-in-single-forcing-large-ensembles-12-320.jpg)
![Greenhouse gases fixed to 1920 levels
All forcings (CESM-LE)
Industrial aerosols fixed to 1920 levels
[Deser et al. 2020, JCLI]
Fully-coupled CESM1.1
20 Ensemble Members
Run from 1920-2080
Observations](https://image.slidesharecdn.com/zlabelargeensemblesessionrecording-slides-211207172250/85/Using-neural-networks-to-explore-regional-climate-patterns-in-single-forcing-large-ensembles-13-320.jpg)
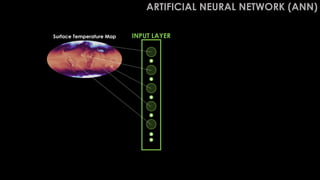
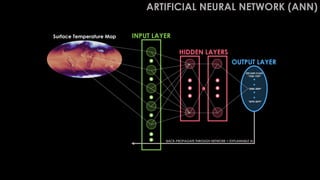
![INPUT LAYER
HIDDEN LAYERS
OUTPUT LAYER
Layer-wise Relevance Propagation
Surface Temperature Map
“2000-2009”
DECADE CLASS
“2070-2079”
“1920-1929”
BACK-PROPAGATE THROUGH NETWORK = EXPLAINABLE AI
ARTIFICIAL NEURAL NETWORK (ANN)
[Barnes et al. 2020, JAMES]
[Labe and Barnes 2021, JAMES]](https://image.slidesharecdn.com/zlabelargeensemblesessionrecording-slides-211207172250/85/Using-neural-networks-to-explore-regional-climate-patterns-in-single-forcing-large-ensembles-19-320.jpg)
![OUTPUT LAYER
Layer-wise Relevance Propagation
“2000-2009”
DECADE CLASS
“2070-2079”
“1920-1929”
BACK-PROPAGATE THROUGH NETWORK = EXPLAINABLE AI
WHY?
= LRP HEAT MAPS
[Labe and Barnes 2021, JAMES]](https://image.slidesharecdn.com/zlabelargeensemblesessionrecording-slides-211207172250/85/Using-neural-networks-to-explore-regional-climate-patterns-in-single-forcing-large-ensembles-20-320.jpg)
![Layer-wise Relevance Propagation
BACK-PROPAGATE THROUGH NETWORK = EXPLAINABLE AI
WHY?
= LRP HEAT MAPS
Machine Learning
Black Box
[Labe and Barnes 2021, JAMES]](https://image.slidesharecdn.com/zlabelargeensemblesessionrecording-slides-211207172250/85/Using-neural-networks-to-explore-regional-climate-patterns-in-single-forcing-large-ensembles-21-320.jpg)
![Layer-wise Relevance Propagation
BACK-PROPAGATE THROUGH NETWORK = EXPLAINABLE AI
WHY?
= LRP HEAT MAPS
Find regions of “relevance”
that contribute to the
neural network’s
decision-making process
[Labe and Barnes 2021, JAMES]](https://image.slidesharecdn.com/zlabelargeensemblesessionrecording-slides-211207172250/85/Using-neural-networks-to-explore-regional-climate-patterns-in-single-forcing-large-ensembles-22-320.jpg)
![Neural
Network
[0] La Niña [1] El Niño
[Toms et al. 2020, JAMES]
Input a map of sea surface temperatures](https://image.slidesharecdn.com/zlabelargeensemblesessionrecording-slides-211207172250/85/Using-neural-networks-to-explore-regional-climate-patterns-in-single-forcing-large-ensembles-24-320.jpg)
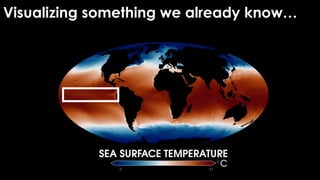
![Visualizing something we already know…
Input maps of sea surface
temperatures to identify
El Niño or La Niña
Use ‘LRP’ to see how the
neural network is making
its decision
[Toms et al. 2020, JAMES]
Layer-wise Relevance Propagation
Composite Observations
LRP [Relevance]
SST Anomaly [°C]
0.00 0.75
0.0 1.5
-1.5](https://image.slidesharecdn.com/zlabelargeensemblesessionrecording-slides-211207172250/85/Using-neural-networks-to-explore-regional-climate-patterns-in-single-forcing-large-ensembles-25-320.jpg)
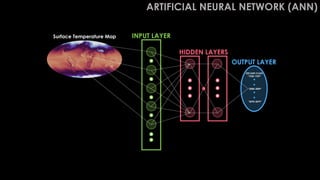
![INPUT LAYER
HIDDEN LAYERS
OUTPUT LAYER
Layer-wise Relevance Propagation
Surface Temperature Map
“2000-2009”
DECADE CLASS
“2070-2079”
“1920-1929”
BACK-PROPAGATE THROUGH NETWORK = EXPLAINABLE AI
ARTIFICIAL NEURAL NETWORK (ANN)
[Barnes et al. 2020, JAMES]
[Labe and Barnes 2021, JAMES]](https://image.slidesharecdn.com/zlabelargeensemblesessionrecording-slides-211207172250/85/Using-neural-networks-to-explore-regional-climate-patterns-in-single-forcing-large-ensembles-26-320.jpg)
![1960-1999: ANNUAL MEAN TEMPERATURE TRENDS
Greenhouse gases fixed
to 1920 levels
[AEROSOLS PREVAIL]
Industrial aerosols fixed
to 1920 levels
[GREENHOUSE GASES PREVAIL]
All forcings
[STANDARD CESM-LE]
DATA
Colder Warmer](https://image.slidesharecdn.com/zlabelargeensemblesessionrecording-slides-211207172250/85/Using-neural-networks-to-explore-regional-climate-patterns-in-single-forcing-large-ensembles-27-320.jpg)
![1960-1999: ANNUAL MEAN TEMPERATURE TRENDS
Greenhouse gases fixed
to 1920 levels
[AEROSOLS PREVAIL]
Industrial aerosols fixed
to 1920 levels
[GREENHOUSE GASES PREVAIL]
All forcings
[STANDARD CESM-LE]
DATA
Colder Warmer](https://image.slidesharecdn.com/zlabelargeensemblesessionrecording-slides-211207172250/85/Using-neural-networks-to-explore-regional-climate-patterns-in-single-forcing-large-ensembles-28-320.jpg)
![1960-1999: ANNUAL MEAN TEMPERATURE TRENDS
Greenhouse gases fixed
to 1920 levels
[AEROSOLS PREVAIL]
Industrial aerosols fixed
to 1920 levels
[GREENHOUSE GASES PREVAIL]
All forcings
[STANDARD CESM-LE]
DATA](https://image.slidesharecdn.com/zlabelargeensemblesessionrecording-slides-211207172250/85/Using-neural-networks-to-explore-regional-climate-patterns-in-single-forcing-large-ensembles-29-320.jpg)
![1960-1999: ANNUAL MEAN TEMPERATURE TRENDS
Greenhouse gases fixed
to 1920 levels
[AEROSOLS PREVAIL]
Industrial aerosols fixed
to 1920 levels
[GREENHOUSE GASES PREVAIL]
All forcings
[STANDARD CESM-LE]
DATA
Colder Warmer](https://image.slidesharecdn.com/zlabelargeensemblesessionrecording-slides-211207172250/85/Using-neural-networks-to-explore-regional-climate-patterns-in-single-forcing-large-ensembles-30-320.jpg)
![CLIMATE MODEL DATA PREDICT THE YEAR FROM MAPS OF TEMPERATURE
AEROSOLS
PREVAIL
GREENHOUSE GASES
PREVAIL
STANDARD
CLIMATE MODEL
[Labe and Barnes 2021, JAMES]](https://image.slidesharecdn.com/zlabelargeensemblesessionrecording-slides-211207172250/85/Using-neural-networks-to-explore-regional-climate-patterns-in-single-forcing-large-ensembles-31-320.jpg)
![OBSERVATIONS PREDICT THE YEAR FROM MAPS OF TEMPERATURE
AEROSOLS
PREVAIL
GREENHOUSE GASES
PREVAIL
STANDARD
CLIMATE MODEL
[Labe and Barnes 2021, JAMES]](https://image.slidesharecdn.com/zlabelargeensemblesessionrecording-slides-211207172250/85/Using-neural-networks-to-explore-regional-climate-patterns-in-single-forcing-large-ensembles-32-320.jpg)
![OBSERVATIONS
SLOPES
PREDICT THE YEAR FROM MAPS OF TEMPERATURE
AEROSOLS
PREVAIL
GREENHOUSE GASES
PREVAIL
STANDARD
CLIMATE MODEL
[Labe and Barnes 2021, JAMES]](https://image.slidesharecdn.com/zlabelargeensemblesessionrecording-slides-211207172250/85/Using-neural-networks-to-explore-regional-climate-patterns-in-single-forcing-large-ensembles-33-320.jpg)
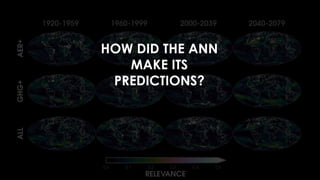
![RESULTS FROM LRP
[Labe and Barnes 2021, JAMES]
Low High](https://image.slidesharecdn.com/zlabelargeensemblesessionrecording-slides-211207172250/85/Using-neural-networks-to-explore-regional-climate-patterns-in-single-forcing-large-ensembles-36-320.jpg)
![RESULTS FROM LRP
[Labe and Barnes 2021, JAMES]
Low High](https://image.slidesharecdn.com/zlabelargeensemblesessionrecording-slides-211207172250/85/Using-neural-networks-to-explore-regional-climate-patterns-in-single-forcing-large-ensembles-37-320.jpg)
![RESULTS FROM LRP
[Labe and Barnes 2021, JAMES]
Low High](https://image.slidesharecdn.com/zlabelargeensemblesessionrecording-slides-211207172250/85/Using-neural-networks-to-explore-regional-climate-patterns-in-single-forcing-large-ensembles-38-320.jpg)
![RESULTS FROM LRP
[Labe and Barnes 2021, JAMES]
Low High](https://image.slidesharecdn.com/zlabelargeensemblesessionrecording-slides-211207172250/85/Using-neural-networks-to-explore-regional-climate-patterns-in-single-forcing-large-ensembles-39-320.jpg)
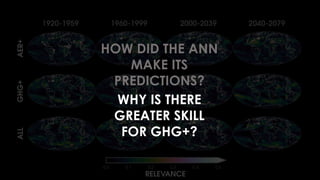
![Higher LRP values indicate greater relevance
for the ANN’s prediction
AVERAGED OVER 1960-2039
Aerosol-driven
Greenhouse gas-driven
All forcings
Low High
[Labe and Barnes 2021, JAMES]](https://image.slidesharecdn.com/zlabelargeensemblesessionrecording-slides-211207172250/85/Using-neural-networks-to-explore-regional-climate-patterns-in-single-forcing-large-ensembles-40-320.jpg)
![Greenhouse gas-driven
Aerosol-driven
All forcings
AVERAGED OVER 1960-2039
[Labe and Barnes 2021, JAMES]](https://image.slidesharecdn.com/zlabelargeensemblesessionrecording-slides-211207172250/85/Using-neural-networks-to-explore-regional-climate-patterns-in-single-forcing-large-ensembles-41-320.jpg)

The document discusses using artificial neural networks (ANN) to analyze climate patterns from large ensemble simulations and explore responses to external climate forcings. It emphasizes the application of explainable AI methods to enhance understanding of climate indicators and improve predictive accuracy. Key findings include a proposed metric for quantifying uncertainty in ANN visualizations and indications that static greenhouse gas levels yield predictions closely aligned with actual observations.


![Polymer [ बहुलक ] Chemistry Notes PDF - Irfanullah Mehar - JJ Sir Chemistry.pdf](https://cdn.slidesharecdn.com/ss_thumbnails/polymerchemistrynotespdf-irfanullahmehar-jjsirchemistry-260210172118-3f9b37f7-thumbnail.jpg?width=640&height=640&fit=bounds)
