Download to read offline

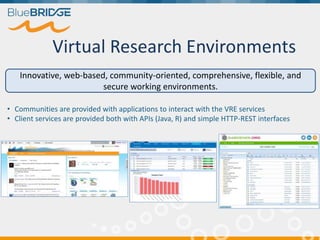
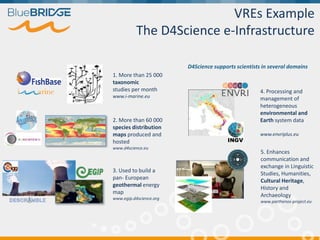
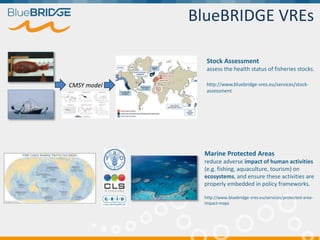
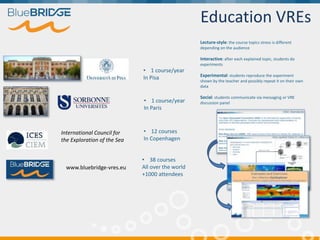


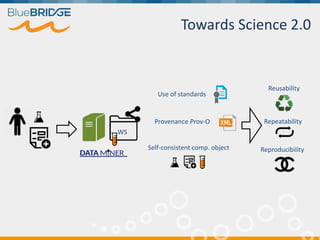


BlueBridge, funded by the EU's Horizon 2020 program, focuses on utilizing e-infrastructures for biodiversity conservation through innovative virtual research environments (VREs). These platforms enable collaborative scientific research, enhance data sharing, and support reproducibility in complex big data contexts. The initiative facilitates diverse applications, including taxonomic studies, stock assessments, and environmental data processing, while promoting open science and collaborative approaches in research.