Download as PDF, PPTX


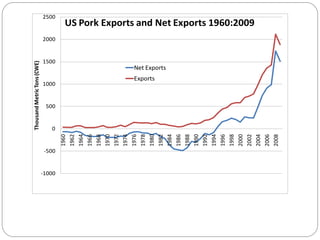
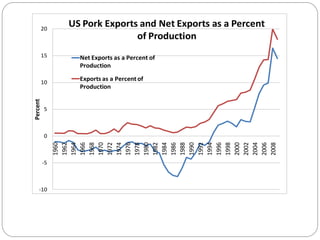
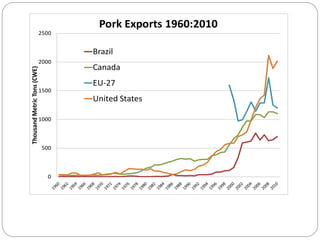
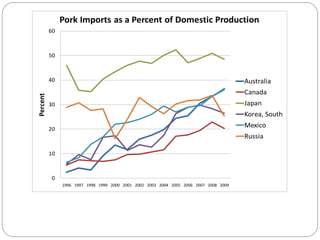
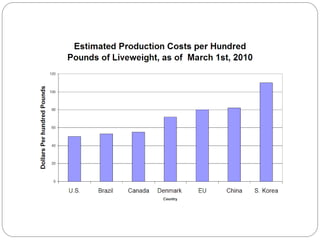
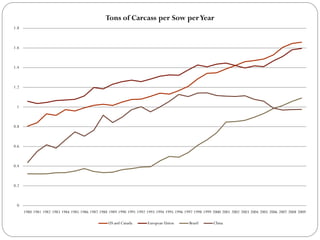
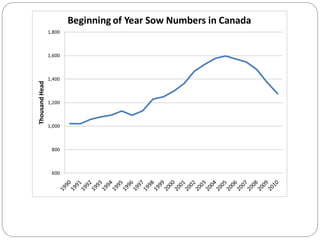


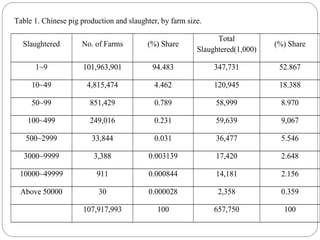
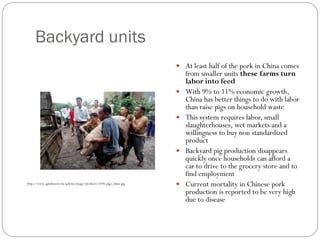


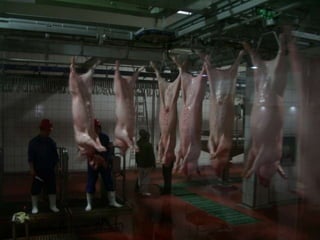
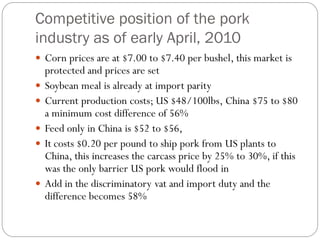
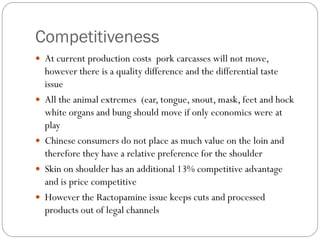

The document discusses the U.S. and China's pork production and trade dynamics, highlighting the rapid growth in China's pork industry compared to the U.S. It outlines production costs, market competitiveness, and the challenges posed by China's import policies and disease prevalence in livestock. Future trends suggest that China may need to open its food market to address food price inflation and growing import demands.


