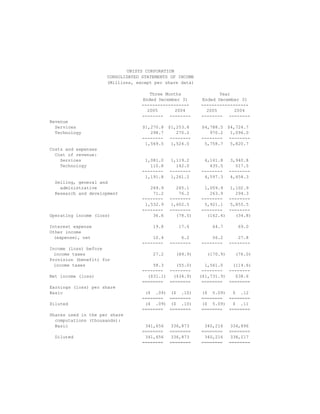
This document provides financial statements and segment results for Unisys Corporation for the three months and year ended December 31, 2005 and 2004. It shows that for the three months ended December 31, 2005, Unisys had revenue of $1.569.5 million and a net loss of $31.1 million. For the year ended December 31, 2005, Unisys had revenue of $5.758.7 million and a net loss of $1,731.9 million. The document also provides balance sheet and cash flow statement information for Unisys as of December 31, 2005 and 2004.
Epsilon Energy Ltd. Announces 2012 Second Quarter ResultsRad Arnold
Epsilon Energy Ltd. Announces 2012 Second Quarter Results
http://at.marketwire.com/accesstracking/AccessTrackingLogServlet?docid=0810503001&sourceType=1http://www.ccnmatthews.com/logos/20071024-main_epsilon.jpg
CONCORD, ONTARIO -- (Marketwire) -- 08/07/12 -- Epsilon Energy Ltd. ("Epsilon") (TSX:EPS) is pleased to announce its second quarter 2012 results. Interim Unaudited Condensed Consolidated Financial Statements and Management Discussion and Analysis for the three and six months ended June 30, 2012 and 2011 are available on Sedar at www.sedar.com or on Epsilon's website at www.epsilonenergyltd.com.
What website can I sell pi coins securely.DOT TECH
Currently there are no website or exchange that allow buying or selling of pi coins..
But you can still easily sell pi coins, by reselling it to exchanges/crypto whales interested in holding thousands of pi coins before the mainnet launch.
Who is a pi merchant?
A pi merchant is someone who buys pi coins from miners and resell to these crypto whales and holders of pi..
This is because pi network is not doing any pre-sale. The only way exchanges can get pi is by buying from miners and pi merchants stands in between the miners and the exchanges.
How can I sell my pi coins?
Selling pi coins is really easy, but first you need to migrate to mainnet wallet before you can do that. I will leave the telegram contact of my personal pi merchant to trade with.
Tele-gram.
@Pi_vendor_247
Turin Startup Ecosystem 2024 - Ricerca sulle Startup e il Sistema dell'Innov...Quotidiano Piemontese
Turin Startup Ecosystem 2024
Una ricerca de il Club degli Investitori, in collaborazione con ToTeM Torino Tech Map e con il supporto della ESCP Business School e di Growth Capital
Falcon stands out as a top-tier P2P Invoice Discounting platform in India, bridging esteemed blue-chip companies and eager investors. Our goal is to transform the investment landscape in India by establishing a comprehensive destination for borrowers and investors with diverse profiles and needs, all while minimizing risk. What sets Falcon apart is the elimination of intermediaries such as commercial banks and depository institutions, allowing investors to enjoy higher yields.
The European Unemployment Puzzle: implications from population agingGRAPE
We study the link between the evolving age structure of the working population and unemployment. We build a large new Keynesian OLG model with a realistic age structure, labor market frictions, sticky prices, and aggregate shocks. Once calibrated to the European economy, we quantify the extent to which demographic changes over the last three decades have contributed to the decline of the unemployment rate. Our findings yield important implications for the future evolution of unemployment given the anticipated further aging of the working population in Europe. We also quantify the implications for optimal monetary policy: lowering inflation volatility becomes less costly in terms of GDP and unemployment volatility, which hints that optimal monetary policy may be more hawkish in an aging society. Finally, our results also propose a partial reversal of the European-US unemployment puzzle due to the fact that the share of young workers is expected to remain robust in the US.
USDA Loans in California: A Comprehensive Overview.pptxmarketing367770
USDA Loans in California: A Comprehensive Overview
If you're dreaming of owning a home in California's rural or suburban areas, a USDA loan might be the perfect solution. The U.S. Department of Agriculture (USDA) offers these loans to help low-to-moderate-income individuals and families achieve homeownership.
Key Features of USDA Loans:
Zero Down Payment: USDA loans require no down payment, making homeownership more accessible.
Competitive Interest Rates: These loans often come with lower interest rates compared to conventional loans.
Flexible Credit Requirements: USDA loans have more lenient credit score requirements, helping those with less-than-perfect credit.
Guaranteed Loan Program: The USDA guarantees a portion of the loan, reducing risk for lenders and expanding borrowing options.
Eligibility Criteria:
Location: The property must be located in a USDA-designated rural or suburban area. Many areas in California qualify.
Income Limits: Applicants must meet income guidelines, which vary by region and household size.
Primary Residence: The home must be used as the borrower's primary residence.
Application Process:
Find a USDA-Approved Lender: Not all lenders offer USDA loans, so it's essential to choose one approved by the USDA.
Pre-Qualification: Determine your eligibility and the amount you can borrow.
Property Search: Look for properties in eligible rural or suburban areas.
Loan Application: Submit your application, including financial and personal information.
Processing and Approval: The lender and USDA will review your application. If approved, you can proceed to closing.
USDA loans are an excellent option for those looking to buy a home in California's rural and suburban areas. With no down payment and flexible requirements, these loans make homeownership more attainable for many families. Explore your eligibility today and take the first step toward owning your dream home.
Introduction to Indian Financial System ()Avanish Goel
The financial system of a country is an important tool for economic development of the country, as it helps in creation of wealth by linking savings with investments.
It facilitates the flow of funds form the households (savers) to business firms (investors) to aid in wealth creation and development of both the parties
The secret way to sell pi coins effortlessly.DOT TECH
Well as we all know pi isn't launched yet. But you can still sell your pi coins effortlessly because some whales in China are interested in holding massive pi coins. And they are willing to pay good money for it. If you are interested in selling I will leave a contact for you. Just telegram this number below. I sold about 3000 pi coins to him and he paid me immediately.
Telegram: @Pi_vendor_247
how to sell pi coins on Bitmart crypto exchangeDOT TECH
Yes. Pi network coins can be exchanged but not on bitmart exchange. Because pi network is still in the enclosed mainnet. The only way pioneers are able to trade pi coins is by reselling the pi coins to pi verified merchants.
A verified merchant is someone who buys pi network coins and resell it to exchanges looking forward to hold till mainnet launch.
I will leave the telegram contact of my personal pi merchant to trade with.
@Pi_vendor_247
how can I sell pi coins after successfully completing KYCDOT TECH
Pi coins is not launched yet in any exchange 💱 this means it's not swappable, the current pi displaying on coin market cap is the iou version of pi. And you can learn all about that on my previous post.
RIGHT NOW THE ONLY WAY you can sell pi coins is through verified pi merchants. A pi merchant is someone who buys pi coins and resell them to exchanges and crypto whales. Looking forward to hold massive quantities of pi coins before the mainnet launch.
This is because pi network is not doing any pre-sale or ico offerings, the only way to get my coins is from buying from miners. So a merchant facilitates the transactions between the miners and these exchanges holding pi.
I and my friends has sold more than 6000 pi coins successfully with this method. I will be happy to share the contact of my personal pi merchant. The one i trade with, if you have your own merchant you can trade with them. For those who are new.
Message: @Pi_vendor_247 on telegram.
I wouldn't advise you selling all percentage of the pi coins. Leave at least a before so its a win win during open mainnet. Have a nice day pioneers ♥️
#kyc #mainnet #picoins #pi #sellpi #piwallet
#pinetwork
Currently pi network is not tradable on binance or any other exchange because we are still in the enclosed mainnet.
Right now the only way to sell pi coins is by trading with a verified merchant.
What is a pi merchant?
A pi merchant is someone verified by pi network team and allowed to barter pi coins for goods and services.
Since pi network is not doing any pre-sale The only way exchanges like binance/huobi or crypto whales can get pi is by buying from miners. And a merchant stands in between the exchanges and the miners.
I will leave the telegram contact of my personal pi merchant. I and my friends has traded more than 6000pi coins successfully
Tele-gram
@Pi_vendor_247
What price will pi network be listed on exchangesDOT TECH
The rate at which pi will be listed is practically unknown. But due to speculations surrounding it the predicted rate is tends to be from 30$ — 50$.
So if you are interested in selling your pi network coins at a high rate tho. Or you can't wait till the mainnet launch in 2026. You can easily trade your pi coins with a merchant.
A merchant is someone who buys pi coins from miners and resell them to Investors looking forward to hold massive quantities till mainnet launch.
I will leave the telegram contact of my personal pi vendor to trade with.
@Pi_vendor_247
If you are looking for a pi coin investor. Then look no further because I have the right one he is a pi vendor (he buy and resell to whales in China). I met him on a crypto conference and ever since I and my friends have sold more than 10k pi coins to him And he bought all and still want more. I will drop his telegram handle below just send him a message.
@Pi_vendor_247
Financial Assets: Debit vs Equity Securities.pptxWrito-Finance
financial assets represent claim for future benefit or cash. Financial assets are formed by establishing contracts between participants. These financial assets are used for collection of huge amounts of money for business purposes.
Two major Types: Debt Securities and Equity Securities.
Debt Securities are Also known as fixed-income securities or instruments. The type of assets is formed by establishing contracts between investor and issuer of the asset.
• The first type of Debit securities is BONDS. Bonds are issued by corporations and government (both local and national government).
• The second important type of Debit security is NOTES. Apart from similarities associated with notes and bonds, notes have shorter term maturity.
• The 3rd important type of Debit security is TRESURY BILLS. These securities have short-term ranging from three months, six months, and one year. Issuer of such securities are governments.
• Above discussed debit securities are mostly issued by governments and corporations. CERTIFICATE OF DEPOSITS CDs are issued by Banks and Financial Institutions. Risk factor associated with CDs gets reduced when issued by reputable institutions or Banks.
Following are the risk attached with debt securities: Credit risk, interest rate risk and currency risk
There are no fixed maturity dates in such securities, and asset’s value is determined by company’s performance. There are two major types of equity securities: common stock and preferred stock.
Common Stock: These are simple equity securities and bear no complexities which the preferred stock bears. Holders of such securities or instrument have the voting rights when it comes to select the company’s board of director or the business decisions to be made.
Preferred Stock: Preferred stocks are sometime referred to as hybrid securities, because it contains elements of both debit security and equity security. Preferred stock confers ownership rights to security holder that is why it is equity instrument
<a href="https://www.writofinance.com/equity-securities-features-types-risk/" >Equity securities </a> as a whole is used for capital funding for companies. Companies have multiple expenses to cover. Potential growth of company is required in competitive market. So, these securities are used for capital generation, and then uses it for company’s growth.
Concluding remarks
Both are employed in business. Businesses are often established through debit securities, then what is the need for equity securities. Companies have to cover multiple expenses and expansion of business. They can also use equity instruments for repayment of debits. So, there are multiple uses for securities. As an investor, you need tools for analysis. Investment decisions are made by carefully analyzing the market. For better analysis of the stock market, investors often employ financial analysis of companies.
BYD SWOT Analysis and In-Depth Insights 2024.pptxmikemetalprod
Indepth analysis of the BYD 2024
BYD (Build Your Dreams) is a Chinese automaker and battery manufacturer that has snowballed over the past two decades to become a significant player in electric vehicles and global clean energy technology.
This SWOT analysis examines BYD's strengths, weaknesses, opportunities, and threats as it competes in the fast-changing automotive and energy storage industries.
Founded in 1995 and headquartered in Shenzhen, BYD started as a battery company before expanding into automobiles in the early 2000s.
Initially manufacturing gasoline-powered vehicles, BYD focused on plug-in hybrid and fully electric vehicles, leveraging its expertise in battery technology.
Today, BYD is the world’s largest electric vehicle manufacturer, delivering over 1.2 million electric cars globally. The company also produces electric buses, trucks, forklifts, and rail transit.
On the energy side, BYD is a major supplier of rechargeable batteries for cell phones, laptops, electric vehicles, and energy storage systems.
Even tho Pi network is not listed on any exchange yet.
Buying/Selling or investing in pi network coins is highly possible through the help of vendors. You can buy from vendors[ buy directly from the pi network miners and resell it]. I will leave the telegram contact of my personal vendor.
@Pi_vendor_247
3. UNISYS CORPORATION
CONSOLIDATED BALANCE SHEETS
(Millions)
December 31, December 31,
2005 2004
---------- ----------
Assets
Current assets
Cash and cash equivalents $642.5 $660.5
Accounts and notes receivable, net 1,111.5 1,136.8
Inventories
Parts and finished equipment 103.4 93.7
Work in process and materials 90.7 122.4
Deferred income taxes 68.2 291.8
Prepaid expense and other
current assets 137.0 112.4
---------- ----------
Total 2,153.3 2,417.6
---------- ----------
Properties 1,320.8 1,305.5
Less accumulated depreciation
and amortization 934.4 881.4
---------- ----------
Properties, net 386.4 424.1
---------- ----------
Outsourcing assets, net 416.0 431.9
Marketable software, net 327.6 336.8
Investments at equity 207.8 197.1
Prepaid pension cost 66.1 52.5
Deferred income taxes 138.4 1,394.6
Goodwill 192.0 189.9
Other long-term assets 141.3 176.4
---------- ----------
Total $4,028.9 $5,620.9
========== ==========
Liabilities and stockholders' equity
Current liabilities
Notes payable $18.1 $1.0
Current maturities of long-term debt 58.8 151.7
Accounts payable 444.6 487.4
Other accrued liabilities 1,293.3 1,382.7
---------- ----------
Total 1,814.8 2,022.8
---------- ----------
Long-term debt 1,049.0 898.4
Accrued pension liabilities 506.9 537.9
Other long-term liabilities 690.8 655.3
Stockholders' equity (deficit)
Common stock 3.4 3.4
Accumulated deficit (2,108.1) (376.2)
Other capital 3,917.0 3,883.8
Accumulated other comprehensive loss (1,844.9) (2,004.5)
---------- ----------
Stockholders' equity (deficit) (32.6) 1,506.5
---------- ----------
Total $4,028.9 $5,620.9
========== ==========
4. UNISYS CORPORATION
CONSOLIDATED STATEMENTS OF CASH FLOWS
(Millions)
Year Ended
December 31
-------------------
2005 2004
------- -------
Cash flows from operating activities
Net income (loss) ($1,731.9) $38.6
Add (deduct) items to reconcile
net income (loss) to net cash
provided by operating activities:
Equity income (9.2) (16.1)
Depreciation and amortization of properties 120.7 136.5
Depreciation and amortization of
outsourcing assets 128.8 123.3
Amortization of marketable software 124.7 134.2
Impairment charge related to
outsourcing assets 125.6
Gain on sale of facility (15.8)
Loss on the tender of debt 10.7
Decrease (increase) in deferred
income taxes, net 1,491.2 (41.2)
Decrease (increase) in receivables, net 34.8 (61.8)
Decrease in inventories 20.9 23.0
Decrease in accounts payable and
other accrued liabilities (61.4) (122.1)
Increase in other liabilities 149.4 111.3
Increase in other assets (34.3) (16.2)
Other 53.4 34.7
------- -------
Net cash provided by operating activities 282.0 469.8
------- -------
Cash flows from investing activities
Proceeds from investments 7,726.2 6,026.5
Purchases of investments (7,709.6) (6,054.3)
Investment in marketable software (125.7) (119.6)
Capital additions of properties (112.0) (137.0)
Capital additions of outsourcing assets (143.8) (177.5)
Purchases of businesses (1.5) (19.4)
Proceeds from sales of properties
and businesses 23.4 1.7
------- -------
Net cash used for investing activities (343.0) (479.6)
------- -------
Cash flows from financing activities
Net proceeds from (reduction in)
short-term borrowings 17.2 (20.0)
Proceeds from employee stock plans 12.8 38.8
Payments of long-term debt (509.1) (3.5)
Proceeds from issuance of long-term debt 541.5
------- -------
Net cash provided by financing activities 62.4 15.3
------- -------
Effect of exchange rate changes on cash
and cash equivalents (19.4) 19.1
------- -------
(Decrease) increase in cash
and cash equivalents (18.0) 24.6
Cash and cash equivalents, beginning of
period 660.5 635.9
------- -------
Cash and cash equivalents, end of period $642.5 $660.5
======= =======
5. Reconciliation of GAAP to Non-GAAP
Financial Information
The preceding release presents information with and
without pension expense. Unisys believes that this
information will enhance an overall understanding
of its financial performance due to the significant
change in pension expense from period to period
and the non-operational nature of pension expense.
The presentation of non-GAAP information is not
meant to be considered in isolation or as a substitute
for results prepared in accordance with accounting
principles generally accepted in the United States.
6. UNISYS CORPORATION
RECONCILIATION OF GAAP TO NON-GAAP
CONSOLIDATED STATEMENTS OF INCOME
(Millions, except per share data)
Three Months Ended
December 31, 2005
----------------------------
US GAAP Less Without
as Pension Pension
Reported Expense Expense
-------- -------- --------
Revenue $1,569.5 $1,569.5
Costs and expenses
Cost of revenue 1,191.8 ($30.8) 1,161.0
Selling, general and
administrative 269.9 (8.7) 261.2
Research and development 71.2 (4.8) 66.4
-------- -------- --------
1,532.9 (44.3) 1,488.6
-------- -------- --------
Operating income 36.6 44.3 80.9
Interest expense 19.8 19.8
Other income
(expense), net 10.4 10.4
-------- -------- --------
Income before
income taxes 27.2 44.3 71.5
Provision for
income taxes 58.3 5.1 63.4
-------- -------- --------
Net income (loss) ($31.1) $39.2 $8.1
======== ======== ========
Earnings (loss) per share ($ .09) $ .11 $ .02
======== ======== ========
Three Months Ended
December 31, 2004
----------------------------
US GAAP Less Without
as Pension Pension
Reported Expense Expense
-------- -------- --------
Revenue $1,524.0 $1,524.0
Costs and expenses
Cost of revenue 1,261.2 ($16.8) 1,244.4
Selling, general and
administrative 265.1 (4.2) 260.9
Research and development 76.2 (2.1) 74.1
-------- -------- --------
1,602.5 (23.1) 1,579.4
-------- -------- --------
Operating income (loss) (78.5) 23.1 (55.4)
Interest expense 17.6 17.6
Other income
(expense), net 6.2 6.2
-------- -------- --------
Income (loss) before
income taxes (89.9) 23.1 (66.8)
Provision (benefit) for
income taxes (55.0) 7.4 (47.6)
-------- -------- --------
Net income (loss) ($34.9) $15.7 ($19.2)
======== ======== ========
Earnings (loss) per share ($ .10) $ .05 ($ .05)
======== ======== ========
7. UNISYS CORPORATION
RECONCILIATION OF GAAP TO NON-GAAP
CONSOLIDATED STATEMENTS OF INCOME
(Millions, except per share data)
Year Ended
December 31, 2005
----------------------------
US GAAP Less Without
as Pension Pension
Reported Expense Expense
-------- -------- --------
Revenue $5,758.7 $5,758.7
Costs and expenses
Cost of revenue 4,597.3 ($125.8) 4,471.5
Selling, general and
administrative 1,059.9 (35.8) 1,024.1
Research and development 263.9 (19.5) 244.4
-------- -------- --------
5,921.1 (181.1) 5,740.0
-------- -------- --------
Operating income (loss) (162.4) 181.1 18.7
Interest expense 64.7 64.7
Other income
(expense), net 56.2 56.2
-------- -------- --------
Income (loss) before
income taxes (170.9) 181.1 10.2
Provision (benefit) for
income taxes 1,561.0 21.7 1,582.7
-------- -------- --------
Net income (loss) ($1,731.9) $159.4 ($1,572.5)
======== ======== ========
Earnings (loss) per share ($ 5.09) $ .47 ($ 4.62)
======== ======== ========
Year Ended
December 31, 2004
----------------------------
US GAAP Less Without
as Pension Pension
Reported Income Income
-------- -------- --------
Revenue $5,820.7 $5,820.7
Costs and expenses
Cost of revenue 4,458.3 ($67.2) 4,391.1
Selling, general and
administrative 1,102.9 (18.3) 1,084.6
Research and development 294.3 (8.1) 286.2
-------- -------- --------
5,855.5 (93.6) 5,761.9
-------- -------- --------
Operating income (loss) (34.8) 93.6 58.8
Interest expense 69.0 69.0
Other income
(expense), net 27.8 27.8
-------- -------- --------
Income (loss) before
income taxes (76.0) 93.6 17.6
Provision (benefit) for
income taxes (114.6) 30.0 (84.6)
-------- -------- --------
Net income $38.6 $63.6 $102.2
======== ======== ========
Earnings per share $ .11 $ .19 $ .30
======== ======== ========
8. UNISYS CORPORATION
RECONCILIATION OF GAAP TO NON-GAAP
SEGMENT RESULTS OF OPERATIONS
(Millions)
Three Months Ended
December 31, 2005
----------------------------
Less Without
As Pension Pension
Reported Expense Expense
-------- -------- --------
Services Segment
Total revenue $1,275.3 $1,275.3
Gross profit 173.9 ($29.8) 203.7
% of revenue 13.6% 16.0%
Operating income (loss) (25.3) (37.0) 11.7
% of revenue -2.0% 0.9%
Technology Segment
Total revenue 361.1 361.1
Gross profit 202.9 (1.0) 203.9
% of revenue 56.2% 56.5%
Operating income 60.2 (7.3) 67.5
% of revenue 16.7% 18.7%
Total Company
Total revenue 1,569.5 1,569.5
Gross profit 377.7 (30.8) 408.5
% of revenue 24.1% 26.0%
Operating income 36.6 (44.3) 80.9
% of revenue 2.3% 5.2%
Three Months Ended
December 31, 2004
----------------------------
Less Without
As Pension Pension
Reported Expense Expense
-------- -------- --------
Services Segment *
Total revenue $1,257.4 $1,257.4
Gross profit 78.2 ($16.4) 94.6
% of revenue 6.2% 7.5%
Operating income (loss) (118.0) (20.1) (97.9)
% of revenue -9.4% -7.8%
Technology Segment *
Total revenue 351.8 351.8
Gross profit 190.6 (0.4) 191.0
% of revenue 54.2% 54.3%
Operating income 42.0 (3.0) 45.0
% of revenue 12.0% 12.8%
Total Company
Total revenue 1,524.0 1,524.0
Gross profit 262.8 (16.8) 279.6
% of revenue 17.2% 18.3%
Operating income (loss) (78.5) (23.1) (55.4)
% of revenue -5.2% -3.6%
* 2004 results exclude charges for cost reductions
and related actions as announced on October 6, 2004
9. UNISYS CORPORATION
RECONCILIATION OF GAAP TO NON-GAAP
SEGMENT RESULTS OF OPERATIONS
(Millions)
Year Ended
December 31, 2005
----------------------------
Less Without
As Pension Pension
Reported Expense Expense
-------- -------- --------
Services Segment
Total revenue $4,807.2 $4,807.2
Gross profit 580.5 ($121.9) 702.4
% of revenue 12.1% 14.6%
Operating income (loss) (207.0) (151.6) (55.4)
% of revenue -4.3% -1.2%
Technology Segment
Total revenue 1,211.1 1,211.1
Gross profit 585.7 (3.9) 589.6
% of revenue 48.4% 48.7%
Operating income 51.0 (29.5) 80.5
% of revenue 4.2% 6.6%
Total Company
Total revenue 5,758.7 5,758.7
Gross profit 1,161.4 (125.8) 1,287.2
% of revenue 20.2% 22.4%
Operating income (loss) (162.4) (181.1) 18.7
% of revenue -2.8% 0.3%
Year Ended
December 31, 2004
----------------------------
Less Without
As Pension Pension
Reported Income Income
-------- -------- --------
Services Segment *
Total revenue $4,742.8 $4,742.8
Gross profit 702.2 ($65.7) 767.9
% of revenue 14.8% 16.2%
Operating income (loss) (82.8) (81.1) (1.7)
% of revenue -1.7% 0.0%
Technology Segment *
Total revenue 1,329.7 1,329.7
Gross profit 686.8 (1.5) 688.3
% of revenue 51.7% 51.8%
Operating income 136.0 (12.5) 148.5
% of revenue 10.2% 11.2%
Total Company
Total revenue 5,820.7 5,820.7
Gross profit 1,362.4 (67.2) 1,429.6
% of revenue 23.4% 24.6%
Operating income (loss) (34.8) (93.6) 58.8
% of revenue -0.6% 1.0%
* 2004 results exclude charges for cost reductions
and related actions as announced on October 6, 2004