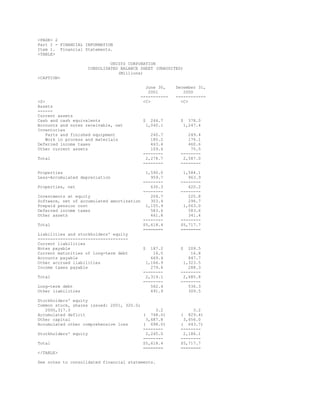
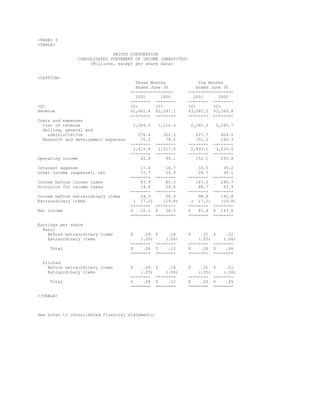
This document is a Form 10-Q quarterly report filed by Unisys Corporation with the SEC for the quarter ended June 30, 2001. The report includes Unisys' consolidated balance sheet, statement of income, statement of cash flows, and notes to the financial statements. It summarizes Unisys' financial performance and position, including reporting a net income of $12.1 million on revenue of $1.46 billion for the quarter.
when officially can i withdraw my pi Network coins.
unisys 2001_2Q_10Q
1. SECURITIES AND EXCHANGE COMMISSION
WASHINGTON, D.C. 20549
__________________________________
FORM 10-Q
(Mark One)
[X] QUARTERLY REPORT PURSUANT TO SECTION 13 OR 15(d) OF THE SECURITIES
EXCHANGE ACT OF 1934
For the quarterly period ended June 30, 2001
[] TRANSITION REPORT PURSUANT TO SECTION 13 OR 15(d) OF THE
SECURITIES EXCHANGE ACT OF 1934
For the transition period from _________ to _________.
Commission file number 1-8729
UNISYS CORPORATION
(Exact name of registrant as specified in its charter)
Delaware 38-0387840
(State or other jurisdiction (I.R.S. Employer
of incorporation or organization) Identification No.)
Unisys Way
Blue Bell, Pennsylvania 19424
(Address of principal executive offices) (Zip Code)
Registrant's telephone number, including area code: (215) 986-4011
Indicate by check mark whether the registrant (1) has filed all reports
required to be filed by Section 13 or 15(d) of the Securities Exchange Act
of 1934 during the preceding 12 months (or for such shorter period that the
registrant was required to file such reports), and (2) has been subject
to such filing requirements for the past 90 days. YES [X] NO [ ]
Number of shares of Common Stock outstanding as of June 30, 2001:
318,095,904.
2. <PAGE> 2
Part I - FINANCIAL INFORMATION
Item 1. Financial Statements.
<TABLE>
UNISYS CORPORATION
CONSOLIDATED BALANCE SHEET (UNAUDITED)
(Millions)
<CAPTION>
June 30, December 31,
2001 2000
----------- ------------
<S> <C> <C>
Assets
------
Current assets
Cash and cash equivalents $ 244.7 $ 378.0
Accounts and notes receivable, net 1,040.1 1,247.4
Inventories
Parts and finished equipment 240.7 249.4
Work in process and materials 180.2 176.1
Deferred income taxes 463.4 460.6
Other current assets 109.6 75.5
-------- --------
Total 2,278.7 2,587.0
-------- --------
Properties 1,590.0 1,584.1
Less-Accumulated depreciation 959.7 963.9
-------- --------
Properties, net 630.3 620.2
-------- --------
Investments at equity 204.7 225.8
Software, net of accumulated amortization 303.4 296.7
Prepaid pension cost 1,155.9 1,063.0
Deferred income taxes 583.6 583.6
Other assets 461.8 341.4
-------- --------
Total $5,618.4 $5,717.7
======== ========
Liabilities and stockholders' equity
------------------------------------
Current liabilities
Notes payable $ 187.2 $ 209.5
Current maturities of long-term debt 16.0 16.8
Accounts payable 669.4 847.7
Other accrued liabilities 1,166.9 1,323.5
Income taxes payable 279.6 288.3
-------- --------
Total 2,319.1 2,685.8
-------- --------
Long-term debt 562.4 536.3
Other liabilities 491.9 309.5
Stockholders' equity
Common stock, shares issued: 2001, 320.0;
2000,317.3 3.2 3.2
Accumulated deficit ( 748.0) ( 829.4)
Other capital 3,687.8 3,656.0
Accumulated other comprehensive loss ( 698.0) ( 643.7)
-------- --------
Stockholders' equity 2,245.0 2,186.1
-------- --------
Total $5,618.4 $5,717.7
======== ========
</TABLE>
See notes to consolidated financial statements.
3. <PAGE> 3
<TABLE>
UNISYS CORPORATION
CONSOLIDATED STATEMENT OF INCOME (UNAUDITED)
(Millions, except per share data)
<CAPTION>
Three Months Six Months
Ended June 30 Ended June 30
----------------- ------------------
2001 2000 2001 2000
-------- -------- -------- --------
<S> <C> <C> <C> <C>
Revenue $1,461.4 $1,597.1 $3,085.2 $3,265.8
-------- -------- -------- --------
Costs and expenses
Cost of revenue 1,064.0 1,116.3 2,260.2 2,245.7
Selling, general and
administrative 276.4 322.5 521.7 604.0
Research and development expenses 75.2 78.2 151.2 160.3
-------- -------- -------- --------
1,415.6 1,517.0 2,933.1 3,010.0
-------- -------- -------- --------
Operating income 45.8 80.1 152.1 255.8
Interest expense 17.6 18.7 33.5 39.2
Other income (expense), net 15.7 23.9 28.7 30.1
-------- -------- -------- --------
Income before income taxes 43.9 85.3 147.3 246.7
Provision for income taxes 14.6 29.0 48.7 83.9
-------- -------- -------- --------
Income before extraordinary items 29.3 56.3 98.6 162.8
Extraordinary items ( 17.2) (19.8) ( 17.2) (19.8)
-------- -------- -------- --------
Net income $ 12.1 $ 36.5 $ 81.4 $ 143.0
======== ======== ======== ========
Earnings per share
Basic
Before extraordinary items $ .09 $ .18 $ .31 $ .52
Extraordinary items (.05) (.06) (.05) (.06)
-------- -------- -------- --------
Total $ .04 $ .12 $ .26 $ .46
======== ======== ======== ========
Diluted
Before extraordinary items $ .09 $ .18 $ .31 $ .51
Extraordinary items (.05) (.06) (.05) (.06)
-------- -------- -------- --------
Total $ .04 $ .12 $ .26 $ .45
======== ======== ======== ========
</TABLE>
See notes to consolidated financial statements.
4. <PAGE> 4
<TABLE>
UNISYS CORPORATION
CONSOLIDATED STATEMENT OF CASH FLOWS (UNAUDITED)
(Millions)
<CAPTION>
Six Months Ended
June 30
-----------------
2001 2000
-------- -------
<S> <C> <C>
Cash flows from operating activities
Income before extraordinary items $ 98.6 $ 162.8
Add(deduct) items to reconcile income before
extraordinary items to net cash provided by
(used for) operating activities:
Extraordinary items ( 17.2) (19.8)
Depreciation 68.7 71.6
Amortization:
Marketable software 61.0 59.0
Goodwill 4.1 5.4
(Increase) in deferred income taxes, net ( 2.8) ( 8.7)
Decrease in receivables, net 100.2 94.4
Decrease(increase) in inventories 4.7 ( 26.5)
(Decrease) in accounts payable and
other accrued liabilities (352.9) (397.4)
(Decrease) increase in income taxes payable ( 8.7) 4.2
Increase(decrease) in other liabilities 186.4 ( 2.6)
(Increase) in other assets (145.4) ( 60.6)
Other 13.3 8.3
------- ------
Net cash provided by (used for) operating
activities 10.0 (109.9)
------- ------
Cash flows from investing activities
Proceeds from investments 1,056.6 343.5
Purchases of investments (1,042.6) (296.8)
Investment in marketable software ( 67.8) ( 67.6)
Capital additions of properties ( 84.5) ( 83.1)
Purchases of businesses ( 2.2) ( 10.9)
Proceeds from sales of properties 11.3
------- ------
Net cash used for investing activities (140.5) (103.6)
------- ------
Cash flows from financing activities
Proceeds from issuance of long-term debt 341.2
Payments of long-term debt (342.3) (444.6)
Net (reduction in)proceeds from short-term
borrowings ( 22.3) 354.3
Proceeds from employee stock plans 19.0 33.7
------- ------
Net cash used for financing activities ( 4.4) ( 56.6)
------- ------
Effect of exchange rate changes on
cash and cash equivalents 1.6 ( 11.4)
------- ------
Decrease in cash and cash equivalents (133.3) (281.5)
Cash and cash equivalents, beginning of period 378.0 464.0
------- -------
Cash and cash equivalents, end of period $ 244.7 $ 182.5
======= =======
</TABLE>
See notes to consolidated financial statements.
5. <PAGE> 5
NOTES TO CONSOLIDATED FINANCIAL STATEMENTS
In the opinion of management, the financial information furnished
herein reflects all adjustments necessary for a fair presentation of
the financial position, results of operations and cash flows for the
interim periods specified. These adjustments consist only of normal
recurring accruals. Because of seasonal and other factors, results
for interim periods are not necessarily indicative of the results to
be expected for the full year.
a. The following table shows how earnings per share were computed for the
three and six months ended June 30, 2001 and 2000 (dollars in millions,
shares in thousands):
Three Months Ended Six Months Ended
June 30 June 30
------------------ ------------------
2001 2000 2001 2000
------- ------- ------- -------
Basic Earnings Per Share
Income before
extraordinary items $ 29.3 $ 56.3 $ 98.6 $ 162.8
Extraordinary items ( 17.2) ( 19.8) ( 17.2) (19.8)
------- ------- ------- -------
Net income $ 12.1 $ 36.5 $ 81.4 $ 143.0
======= ======= ======= =======
Weighted average shares 317,658 312,515 316,984 311,838
======= ======= ======= =======
Basic earnings per share
Before extraordinary
items $ .09 $ .18 $ .31 $ .52
Extraordinary items (.05) (.06) (.05) (.06)
------- ------- ------- -------
Total $ .04 $ .12 $ .26 $ .46
======= ======= ======= =======
Diluted Earnings Per Share
Income before
extraordinary items $ 29.3 $ 56.3 $ 98.6 $ 162.8
Extraordinary items ( 17.2) ( 19.8) ( 17.2) ( 19.8)
------- ------- ------- -------
Net income $ 12.1 $ 36.5 $ 81.4 $ 143.0
======= ======= ======= =======
Weighted average shares 317,658 312,515 316,984 311,838
Plus incremental shares
from assumed exercise
of employee stock plans 1,738 4,506 2,228 5,212
------- ------- ------- -------
Adjusted weighted average
shares 319,396 317,021 319,212 317,050
======= ======= ======= =======
Diluted earnings per share
Before extraordinary
items $ .09 $ .18 $ .31 $ .51
Extraordinary items (.05) (.06) (.05) (.06)
------- ------- ------- -------
Total $ .04 $ .12 $ .26 $ .45
======= ======= ======= =======
During the six months ended June 30, 2001, 23.3 million shares related to
employee stock plans were not included in the computation of diluted
earnings per share because the option prices are above the average market
price of the company's common stock.
6. <PAGE> 6
b. Effective January 1, 2001, the company adopted Statement of Financial
Accounting Standards (quot;SFASquot;) No. 133 quot;Accounting for Derivative
Instruments and Hedging Activities.quot; This statement establishes accounting
and reporting standards for derivative instruments and hedging activities.
SFAS No. 133 requires a company to recognize all derivatives as either assets
or liabilities in the statement of financial position and measure those
instruments at fair value. Derivatives that are not hedges must be adjusted
to fair value through income. If the derivative is a hedge, depending on the
nature of the hedge, changes in the fair value of derivatives are either
offset against the change in fair value of assets, liabilities, or firm
commitments through earnings or recognized in other comprehensive income
until the hedged item is recognized in earnings. The ineffective portion of
a derivative's change in fair value will be immediately recognized in
earnings. The cumulative effect of the change in accounting principle due to
the adoption of SFAS NO. 133 resulted in the recognition of income of $3.3
million (net of $1.8 million of tax) in other comprehensive income.
c. A summary of the company’s operations by business segment for the three and
six month periods ended June 30, 2001 and 2000 is presented below (in
millions of dollars):
Total Corporate Services Technology
Three Months Ended ----- --------- -------- ----------
June 30, 2001
------------------
Customer revenue $1,461.4 $1,084.7 $ 376.7
Intersegment $( 82.9) 18.2 64.7
-------- ------- -------- --------
Total revenue $1,461.4 $( 82.9) $1,102.9 $ 441.4
======== ======= ======== ========
Operating income(loss) $ 45.8 $( 10.2) $ 9.8 $ 46.2
======== ======= ======== ========
Three Months Ended
June 30, 2000
------------------
Customer revenue $1,597.1 $1,128.9 $ 468.2
Intersegment $(109.8) 13.6 96.2
-------- ------- -------- --------
Total revenue $1,597.1 $(109.8) $1,142.5 $ 564.4
======== ======= ======== ========
Operating income $ 80.1 $ 4.2 $ .3 $ 75.6
======== ======= ======== ========
Six Months Ended
June 30, 2001
------------------
Customer revenue $3,085.2 $2,260.4 $ 824.8
Intersegment $(165.0) 31.5 133.5
-------- ------- -------- --------
Total revenue $3,085.2 $(165.0) $2,291.9 $ 958.3
======== ======= ======== ========
Operating income $ 152.1 $( 19.5) $ 36.9 $ 134.7
======== ======= ======== ========
Six Months Ended
June 30, 2000
----------------
Customer revenue $3,265.8 $2,253.9 $1,011.9
Intersegment $(233.9) 24.6 209.3
-------- ------- -------- --------
Total revenue $3,265.8 $(233.9) $2,278.5 $1,221.2
======== ======= ======== ========
Operating income $ 255.8 $ 17.6 $ 19.4 $ 218.8
======== ======= ======== ========
7. <PAGE> 7
Presented below is a reconciliation of total business segment operating
income to consolidated income before taxes (in millions of dollars):
Three Months Ended Six Months Ended
June 30, June 30,
------------------ ----------------
2001 2000 2001 2000
---- ---- ---- ----
Total segment operating income $ 56.0 $ 75.9 $171.6 $238.2
Interest expense (17.6) (18.7) (33.5) (39.2)
Other income (expense), net 15.7 23.9 28.7 30.1
Corporate and eliminations (10.2) 4.2 (19.5) 17.6
------ ------ ------ ------
Total income before income taxes $ 43.9 $ 85.3 $147.3 $246.7
====== ====== ====== ======
d. Comprehensive income for the three and six months ended June 30, 2001 and
2000 includes the following components (in millions of dollars):
Three Months Ended Six Months Ended
June 30, June 30,
------------------ ----------------
2001 2000 2001 2000
---- ---- ---- ----
Net income $ 12.1 $ 36.5 $ 81.4 $143.0
Other comprehensive income (loss)
Cumulative effect of change in
accounting principle (SFAS
No. 133), net of tax of $1.8 3.3
Cash flow hedges
Income (loss), net of tax of $.7
and $4.4 1.2 8.1
Reclassification adjustments,
net of tax of $(1.3) and $(2.6) (2.3) (4.9)
Foreign currency translation
adjustments, net of tax of
$1.7, $5.7, $0, and $8.6 (59.3) (35.0) (60.8) (32.1)
------ ------ ------ ------
Total other comprehensive
income (loss) (60.4) (35.0) (54.3) (32.1)
------ ------ ------ ------
Comprehensive income (loss) $(48.3) $ 1.5 $ 27.1 $110.9
====== ====== ====== ======
Accumulated other comprehensive income (loss) as of December 31, 2000 and
June 30, 2001 is as follows (in millions of dollars):
Cash
Translation Flow
Total Adjustments Hedges
----- ----------- ------
Balance at December 31, 1999 $(570.4) $(570.4) $ -
Current-period change ( 73.3) ( 73.3)
------- ------- ------
Balance as December 31, 2000 (643.7) (643.7) -
Current-period change ( 54.3) ( 60.8) 6.5
------- ------- ------
Balance at June 30, 2001 $(698.0) $(704.5) $ 6.5
======= ======= ======
e. The amount credited to stockholders' equity for the income tax benefit
related to the company's stock plans for the six months ended June 30,
2001 and 2000 was $3.2 million and $9.3 million, respectively. The company
expects to realize these tax benefits on future Federal income tax returns.
8. <PAGE> 8
Item 2. Management’s Discussion and Analysis of Financial
Condition and Results of Operations.
Overview
--------
The company continues to manage its business profitability in a very challenging economic
environment. As customers delayed planned IT projects and reduced expenses, the company saw weak
demand and pricing pressures in key areas of its business, particularly for high-end enterprise
servers and systems integration projects, which impacted revenue and margins in the quarter.
The following discussion of results of operations compares the results for the three and six
months ended June 30, 2001 with both the as reported and pro forma results for the comparable
periods of 2000. The pro forma results exclude low-margin commodity hardware business that the
company has de-emphasized as a result of its focus on higher value-added business areas. For the
three and six months ended June 30, 2000, financial highlights on an as reported and on a pro
forma basis are as follows (in millions of dollars, except per share data):
Three Months Ended Six Months Ended
June 30, 2000 June 30, 2000
---------------------- --------------------
As Pro As Pro
Reported Forma Reported Forma
-------- ------- -------- -------
Revenue $1,597.1 $1,423.8 $3,265.8 $2,953.6
Cost of revenue 1,116.3 950.6 2,245.7 1,947.6
Gross profit % 30.1% 33.2% 31.2% 34.1%
S,G&A 322.5 314.7 604.0 589.1
S,G&A as a % of revenue 20.2% 22.1% 18.5% 19.9%
Operating income 80.1 83.1 255.8 261.4
Operating income as a %
of revenue 5.0% 5.8% 7.8% 8.9%
Income before extraordinary
items 56.3 59.4 162.8 166.8
Diluted earnings per share -
before extraordinary items .18 .19 .51 .53
Results of Operations
---------------------
For the three months ended June 30, 2001, the company reported net income of $12.1 million, or
$.04 per diluted share, compared to $36.5 million, or $.12 per diluted share, for the three
months ended June 30, 2000. Both periods include an extraordinary item for the early
extinguishment of debt. The extraordinary charge was $17.2 million or $.05 per diluted share in
the June 2001 quarter and $19.8 million or $.06 per diluted share in the June 2000 quarter.
Excluding these items, income in the current period was $29.3 million, or $.09 per diluted share
compared to $56.3 million, or $.18 per share in the year-ago period.
Total revenue for the quarter ended June 30, 2001 was $1.46 billion, down 8% from revenue of
$1.60 billion for the quarter ended June 30, 2000. The decrease in revenue was principally due
to lower sales of commodity products (discussed above) and enterprise servers. Excluding the
negative impact of foreign currency translations, revenue in the quarter was down 3% when
compared to the year-ago period. When compared to pro forma revenue of $1.42 billion for the
second quarter of 2000, revenue for the current quarter increased 3% (8% on a constant currency
basis).
Total gross profit was 27.2% in the second quarter of 2001 compared to 30.1% in the year-ago
period, principally due to a lower mix of higher-margin products and services than in the year-
ago quarter as well as pricing pressures.
9. <PAGE> 9
For the three months ended June 30, 2001, selling, general and administrative expenses were
$276.4 million (18.9% of revenue) compared to $322.5 million (20.2% of revenue) for the three
months ended June 30, 2000. Research and development expense was $75.2 million compared to $78.2
million a year earlier. The decrease in these expenses reflected tight controls placed on
discretionary spending during the quarter as well as the benefits of the restructuring actions
announced in the fourth quarter of 2000.
For the second quarter of 2001, the company reported an operating income percent of 3.1% compared
to 5.0% (5.8% on a pro forma basis) for the second quarter of 2000.
Information by business segment is presented below (in millions):
Elimi-
Total nations Services Technology
------- ------- -------- ----------
Three Months Ended
June 30, 2001
------------------
Customer revenue $1,461.4 $1,084.7 $376.7
Intersegment $( 82.9) 18.2 64.7
-------- ------- -------- ------
Total revenue $1,461.4 $( 82.9) $1,102.9 $441.4
======== ======= ======== ======
Gross profit percent 27.2% 19.2% 43.5%
======== ======== ======
Operating income
percent 3.1% 0.9% 10.5%
======== ======== ======
Three Months Ended
June 30, 2000 – As Reported
----------------------------
Customer revenue $1,597.1 $1,128.9 $468.2
Intersegment $(109.8) 13.6 96.2
-------- ------- -------- ------
Total revenue $1,597.1 $(109.8) $1,142.5 $564.4
======== ======= ======== ======
Gross profit percent 30.1% 20.5% 44.1%
======== ======== ======
Operating income
percent 5.0% 0.0% 13.4%
======== ======== ======
Three Months Ended
June 30, 2000 – Pro Forma
--------------------------
Customer revenue $1,423.8 $1,013.3 $410.5
Intersegment $(107.5) 17.0 90.5
-------- ------- -------- ------
Total revenue $1,423.8 $(107.5) $1,030.3 $501.0
======== ======= ======== ======
Gross profit percent 33.2% 22.2% 49.3%
======== ======== ======
Operating income
percent 5.8% 0.0% 15.2%
======== ======== ======
In the Services segment, customer revenue was $1.08 billion, down 4% from $1.13 billion in the
year-ago period, principally due to a decline in proprietary maintenance and lower sales of
commodity products. The gross profit percent declined to 19.2% in the current quarter compared
to 20.5% in the prior period, principally reflecting the startup of large outsourcing contracts,
and a lower mix of higher-margin proprietary maintenance revenue in the quarter. Operating
income percent increased to 0.9% in the current quarter from break even last year, principally
due to a decline in selling, general and administrative expenses. Customer revenue in the
Services segment increased 7% in the current quarter from pro forma revenue in the year-ago
quarter.
10. <PAGE> 10
In the Technology segment, customer revenue declined 20% to $377 million in the second quarter of
2001 from $468 million in the prior-year period, principally due to declines in ClearPath
enterprise server revenue and lower commodity hardware sales. The gross profit percent was 43.5%
in the current quarter compared to 44.1% in the prior period, reflecting the lower mix of higher-
margin ClearPath server sales in the quarter. Operating profit in this segment declined to 10.5%
in the current quarter from 13.4% in 2000, principally due to the gross profit decline. Customer
revenue in the Technology segment declined 8% in the current period from pro forma revenue in
the year-ago period.
Interest expense for the three months ended June 30, 2001 was $17.6 million compared to $18.7
million for the three months ended June 30, 2000. The decline was principally due to lower
average borrowings.
Other income (expense), net, which can vary from quarter to quarter, was income of $15.7 million
in the current quarter compared to $23.9 million in the year-ago quarter. The decrease was
principally due to lower equity income in the current period compared to the prior-year.
Income before income taxes was $43.9 million in the second quarter of 2001 compared to $85.3
million last year. The provision for income taxes was $14.6 million in the current period (33%
effective rate)compared to $29.0 million in the year-ago period (34% effective rate). The
decline in the effective tax rate was principally due to tax planning strategies.
For the six months ended June 30, 2001, net income was $81.4 million, or $.26 per diluted share,
compared to net income of $143.0 million, or $.45 per diluted share, last year. Both periods
include an extraordinary item for the early extinguishment of debt, $17.2 million, or $.05 per
share for the six months ended June 30, 2001, and $19.8 million, or $.06 per share for the six
months ended June 30, 2000. Excluding these items, income in the current period was $98.6
million, or $.31 per share compared to $162.8 million, or $.51 per share in the year-ago period.
In September 2000, the Financial Accounting Standards Board issued SFAS No. 140, quot;Accounting for
Transfers and Servicing of Financial Assets and Extinguishments of Liabilities.quot; This statement
revises the accounting standards for securitizations and other transfers of financial assets and
collateral and requires certain disclosures. This statement is effective for transfers and
servicing of financial assets occurring after March 31, 2001. Adoption of SFAS No. 140 had no
effect on the company's consolidated financial position, consolidated results of operations, or
liquidity.
Financial Condition
-------------------
Cash and cash equivalents at June 30, 2001 were $244.7 million compared to $378.0 million at
December 31, 2000.
During the six months ended June 30, 2001, cash provided by operations was $10.0 million compared
to a cash usage of $109.9 million for the six months ended June, 2000, principally reflecting an
improvement in working capital management, mainly a higher level of advance payments under long-
term contracts. Cash expenditures in the six months ended June 30, 2001 related to prior-year
restructuring charges (which are included in operating activities) were $30 million compared to
$14 million for the prior-year period, and are expected to be approximately $29 million for the
remainder of 2001 and $22 million in total for all subsequent years, principally for work-force
reductions and facility costs. Personnel reductions in the six months ended June 30, 2001
related to these restructuring actions were approximately 440 and are expected to be
approximately 486 for the remainder of the year.
Cash used for investing activities for the six months ended June 30, 2001 was $140.5 million
compared to $103.6 million during the six months ended June 30, 2000 principally due to lower net
proceeds from investments.
Cash used for financing activities during the first half of 2001 was $4.4 million compared to
cash used of $56.6 million in the prior year. The current period includes net proceeds from
long-term debt of $341.2 million and payments of long-term debt of $342.3 million, as described
below. Included in the prior period were payments of long-term debt of $444.6 million and net
proceeds of $354.3 million from short-term borrowings.
At June 30, 2001, total debt was $765.6 million, an increase of $3.0 million from December 31,
2000.
11. <PAGE> 11
In May 2001, the company issued $350 million of 8 1/8% senior notes due 2006. In June 2001, the
company completed a cash tender offer for $319.2 million principal amount of its 11 ¾% senior
notes due 2004. As a result of the tender, the company recorded an extraordinary after-tax
charge of $17.2 million, net of $9.3 million tax benefit, or $.05 per diluted share, in the
second quarter of 2001 for the premium paid, unamortized debt-related expenses and transaction
costs of the tender offer.
In March 2001, the company entered into a new three-year $450 million unsecured credit agreement
which replaced the $400 million three-year facility that was to expire in June 2001. As of June
30, 2001, $90.0 million was borrowed under this agreement at a rate of 5.6%. In addition, $20.0
million was borrowed under unsecured U.S. credit lines at a rate of 4.4%.
In April 2000, the company redeemed all of its $399.5 million outstanding
12% senior notes. The redemption was funded through a combination of cash and short-term
borrowings. In March 2000, the company entered into an additional $150 million credit agreement
expiring April 2001 for the purpose of funding this redemption. On April 12, 2001, the then
outstanding balance was repaid at maturity and the agreement expired.
The company may, from time to time, redeem, tender for, or repurchase its debt securities in the
open market or in privately negotiated transactions depending upon availability, market
conditions, and other factors.
The company has on file with the Securities and Exchange Commission an effective registration
statement covering $350 million of debt or equity securities, which enables the company to be
prepared for future market opportunities.
At June 30, 2001, the company had deferred tax assets in excess of deferred tax liabilities of
$1,301 million. For the reasons cited below, management determined that it is more likely than
not that $992 million of such assets will be realized, therefore resulting in a valuation
allowance of $309 million.
The company evaluates quarterly the realizability of its deferred tax assets and adjusts the
amount of the related valuation allowance, if necessary. The factors used to assess the
likelihood of realization are the company’s forecast of future taxable income, and available tax
planning strategies that could be implemented to realize deferred tax assets. Approximately $3.0
billion of future taxable income (predominantly U.S.) is needed to realize all of the net
deferred tax assets. Failure to achieve forecasted taxable income might affect the ultimate
realization of the net deferred tax assets. See “Factors that may affect future results” below.
Stockholders’ equity increased $58.9 million during the six months ended June 30, 2001,
principally reflecting net income of $81.4 million, $28.4 million for issuance of stock under
stock option and other plans and $3.2 million of tax benefits related to employee stock plans,
offset in part by currency translation of $54.3 million.
Conversion to the Euro Currency
-------------------------------
On January 1, 1999, certain member countries of the European Union established fixed conversion
rates between their existing currencies and the European Union’s common currency (the “euro”).
The transition period for the introduction of the euro began on January 1, 1999. The company is
addressing the issues involved with the introduction of the euro. The more important issues
facing the company include converting information technology systems, reassessing currency risk,
and negotiating and amending agreements.
Based on progress to date, the company believes that the use of the euro will not have a
significant impact on the manner in which it conducts its business.
Accordingly, conversion to the euro is not expected to have a material effect on the company’s
consolidated financial position, consolidated results of operations, or liquidity.
12. <PAGE> 12
Factors That May Affect Future Results
--------------------------------------
From time to time, the company provides information containing “forward-looking” statements, as
defined in the Private Securities Litigation Reform Act of 1995. All forward-looking statements
rely on assumptions and are subject to risks, uncertainties, and other factors that could cause
the company’s actual results to differ materially from expectations. In addition to changes in
general economic and business conditions and natural disasters, these include, but are not
limited to, the factors discussed below.
The company operates in an industry characterized by aggressive competition, rapid technological
change, evolving technology standards, and short product life-cycles.
Future operating results will depend on the company’s ability to design, develop, introduce,
deliver, or obtain new products and services on a timely and cost-effective basis; the success of
the actions taken to focus on higher growth, e-business opportunities; on its ability to
effectively manage the shift in its technology business into higher growth, standards-based
server products; on its ability to mitigate the effects of competitive pressures and volatility
in the information technology and services industry on revenues, pricing and margins; and on its
ability to successfully attract and retain highly skilled people. In addition, future operating
results could be impacted by market demand for and acceptance of the company’s service and
product offerings.
A number of the company's contracts are long-term contracts for network services, outsourcing,
help desk and similar services, for which volumes are not guaranteed. Future results will depend
upon the company's ability to meet performance levels over the terms of these contracts.
Certain of the company’s systems integration contracts are fixed-price contracts under which the
company assumes the risk for delivery of the contracted services at an agreed-upon price. Future
results will depend on the company’s ability to profitably perform these services contracts and
bid and obtain new contracts.
The company frequently enters into contracts with governmental entities. Associated risks and
uncertainties include the availability of appropriated funds and contractual provisions allowing
governmental entities to terminate agreements in their discretion before the end of their terms.
The company has commercial relationships with suppliers, channel partners and other parties that
have complementary products, services, or skills. Future results will depend in part on the
performance and capabilities of these third parties. Future results will also depend upon the
ability of external suppliers to deliver components at reasonable prices and in a timely manner
and on the financial condition of, and the company’s relationship with, distributors and other
indirect channel partners.
Approximately 57% of the company’s total revenue derives from international operations. The
risks of doing business internationally include foreign currency exchange rate fluctuations,
changes in political or economic conditions, trade protection measures, and import or export
licensing requirements.
13. <PAGE> 13
Part II - OTHER INFORMATION
------- -----------------
Item 1. Legal Proceedings
------- -----------------
The company has previously reported, most recently in its Quarterly Report on
Form 10-Q for the period ended March 31, 2001, its involvement in a
consolidated class action lawsuit captioned In re: Unisys Corporation
Securities Litigation, filed in the U.S. District Court for the Eastern
District of Pennsylvania. The parties have executed a memorandum of
understanding to settle this matter, the terms of which would not have a
material adverse effect on the company's consolidated financial position,
consolidated results of operations or liquidity. The settlement is subject
to the execution of a definitive settlement agreement and approval of the
court.
Item 4. Submission of Matters to a Vote of Security Holders
------- ---------------------------------------------------
(a) The company's 2001 Annual Meeting of Stockholders (the quot;Annual
Meetingquot;) was held on April 26, 2001 in Philadelphia, Pennsylvania.
(b) The following matters were voted upon at the Annual Meeting and
received the following votes:
1. Election of Directors as follows:
Henry C. Duques – 262,591,091 votes for; 3,817,701 votes withheld
Theodore E. Martin – 262,705,797 votes for; 3,702,995 votes withheld
Lawrence A. Weinbach – 262,727,266 votes for; 3,681,526 votes withheld
2. A proposal to ratify the selection of the company's independent
auditors – 256,239,167 votes for; 10,169,625 votes against;
1,540,483 abstentions
Item 6. Exhibits and Reports on Form 8-K
------- --------------------------------
(a) Exhibits
See Exhibit Index
(b) Reports on Form 8-K
During the quarter ended June 30, 2001, the company filed a Current
Report on Form 8-K, dated May 10, 2001, to report under items 5 and 7 of such
Form.
14. <PAGE> 14
SIGNATURES
----------
Pursuant to the requirements of the Securities Exchange Act of
1934, the registrant has duly caused this report to be signed on its
behalf by the undersigned thereunto duly authorized.
UNISYS CORPORATION
Date: July 19, 2001 By: /s/ Janet M. Brutschea Haugen
-----------------------------
Janet M. Brutschea Haugen
Senior Vice President and
Chief Financial Officer
(Principal Financial and
Accounting Officer)
15. <PAGE>
EXHIBIT INDEX
Exhibit
Number Description
------- -----------
12 Statement of Computation of Ratio of Earnings to Fixed Charges
16. <TABLE>
Exhibit 12
UNISYS CORPORATION
COMPUTATION OF RATIO OF EARNINGS TO FIXED CHARGES (UNAUDITED)
($ in millions)
<CAPTION>
Six
Months
Ended Years Ended December 31
June 30, -----------------------------------
2001 2000 1999 1998 1997 1996
--------- ---- ---- ---- ---- ----
<S> <C> <C> <C> <C> <C> <C>
Fixed charges
Interest expense $ 33.5 $ 79.8 $127.8 $171.7 $233.2 $249.7
Interest capitalized during
the period 5.8 11.4 3.6 - - -
Amortization of debt issuance
expenses 1.3 3.2 4.1 4.6 6.7 6.3
Portion of rental expense
representative of interest 21.1 42.2 46.3 49.1 51.8 59.8
------ ------ ----- ----- ----- -----
Total Fixed Charges 61.7 136.6 181.8 225.4 291.7 315.8
------ ------ ------ ------ ------ ------
Earnings
Income (loss) from continuing
operations before income taxes 147.3 379.0 770.3 594.2 (748.1) 80.2
Add (deduct) the following:
Share of loss (income) of
associated companies (12.1) (20.5) 8.9 (.3) 5.9 (4.9)
Amortization of capitalized
interest 2.3 2.2 - - - -
------ ------ ------ ------ ------ ------
Subtotal 137.5 360.7 779.2 593.9 (742.2) 75.3
------ ------ ------ ------ ------ ------
Fixed charges per above 61.7 136.6 181.8 225.4 291.7 315.8
Less interest capitalized during
the period (5.8) (11.4) (3.6) - - -
------ ------ ------ ------ ------- ------
Total earnings (loss) $193.4 $485.9 $957.4 $819.3 $(450.5)$391.1
====== ====== ====== ====== ======= ======
Ratio of earnings to fixed
charges 3.13 3.56 5.27 3.63 * 1.24
====== ====== ====== ====== ======= ======
</TABLE>
* Earnings for the year ended December 31, 1997 were inadequate to cover fixed
charges by approximately $742.2 million.