Download to read offline

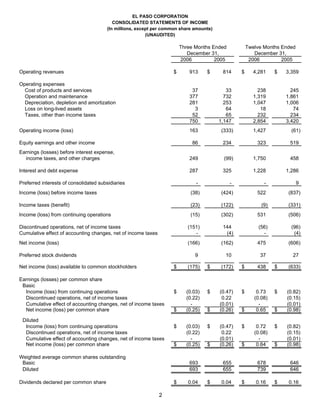
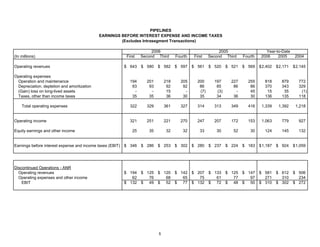
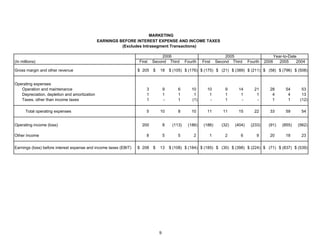
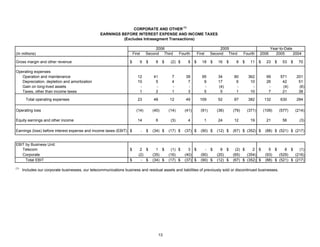
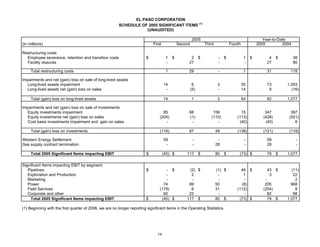
This document provides operating statistics and financial results for El Paso Corporation for the fourth quarter and full year of 2006. Some key details include: - For the fourth quarter of 2006, El Paso reported net income of $166 million compared to a net loss of $162 million for the same period in 2005. - For the full year 2006, net income was $475 million, an improvement from a net loss of $606 million in 2005. - Earnings were positively impacted by higher earnings from the Pipelines, Exploration and Production, and Field Services segments. - The results show improvement in El Paso's overall financial performance in 2006 compared to 2005.


