Download to read offline
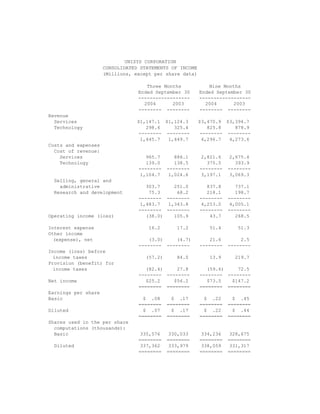
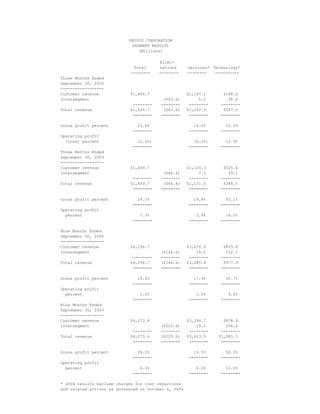
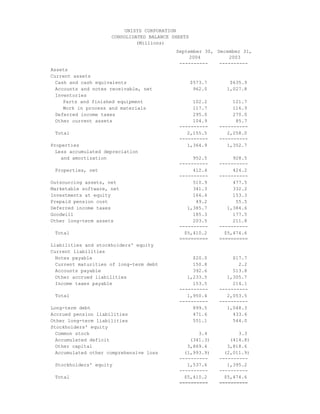
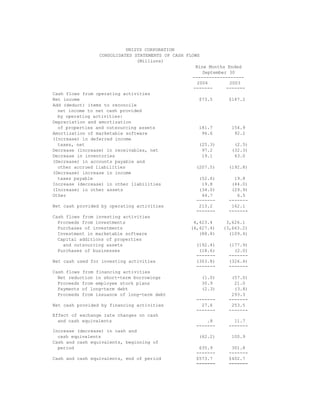
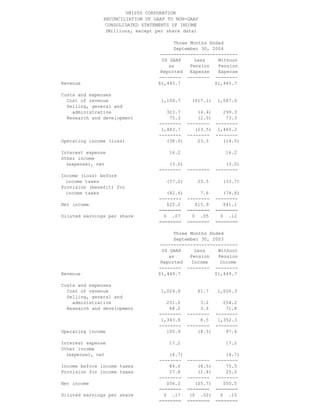
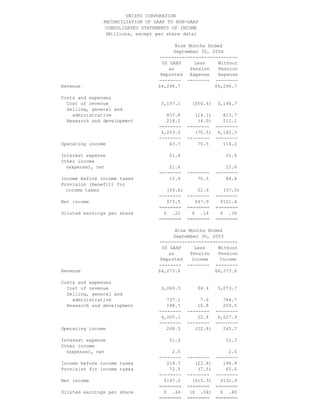
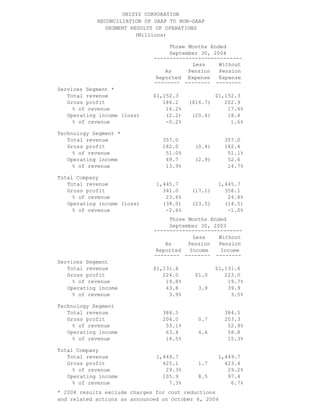
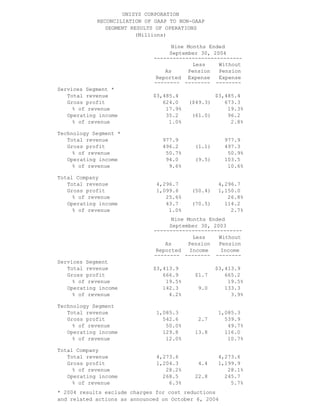
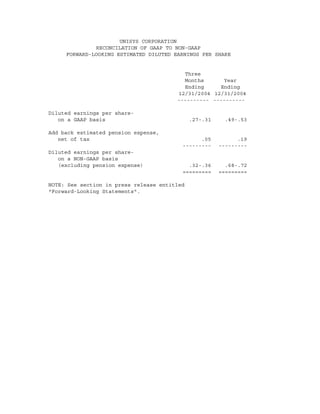
The document provides financial information for Unisys Corporation, including revenue, costs, expenses, operating income, net income, and earnings per share for quarters ending September 30, 2004 and 2003 and year-to-date periods ending September 30, 2004 and 2003. It also includes balance sheet information as of September 30, 2004 and December 31, 2003 and cash flow information for the nine month periods ending September 30, 2004 and 2003.


