Top Rated Pune Call Girls Sinhagad Road ⟟ 6297143586 ⟟ Call Me For Genuine S...
aetna table 2006 4th
1. Aetna/11
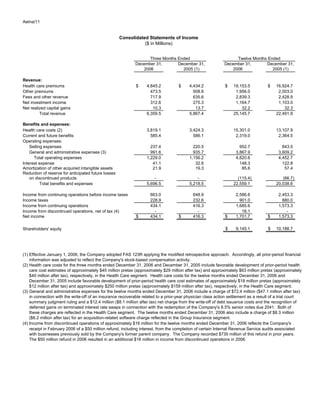
Consolidated Statements of Income
($ in Millions)
Three Months Ended Twelve Months Ended
December 31, December 31, December 31, December 31,
2006 2005 (1) 2006 2005 (1)
Revenue:
Health care premiums $ 4,845.2 $ 4,434.2 $ 19,153.5 $ 16,924.7
Other premiums 473.5 508.6 1,956.0 2,003.0
Fees and other revenue 717.9 635.6 2,839.3 2,428.9
Net investment income 312.6 275.3 1,164.7 1,103.0
Net realized capital gains 10.3 13.7 32.2 32.3
Total revenue 6,359.5 5,867.4 25,145.7 22,491.9
Benefits and expenses:
Health care costs (2) 3,819.1 3,424.3 15,301.0 13,107.9
Current and future benefits 585.4 586.1 2,319.0 2,364.5
Operating expenses:
Selling expenses 237.4 220.5 952.7 843.5
General and administrative expenses (3) 991.6 935.7 3,867.9 3,609.2
Total operating expenses 1,229.0 1,156.2 4,820.6 4,452.7
Interest expense 41.1 32.6 148.3 122.8
Amortization of other acquired intangible assets 21.9 19.3 85.6 57.4
Reduction of reserve for anticipated future losses
on discontinued products - - (115.4) (66.7)
Total benefits and expenses 5,696.5 5,218.5 22,559.1 20,038.6
Income from continuing operations before income taxes 663.0 648.9 2,586.6 2,453.3
Income taxes 228.9 232.6 901.0 880.0
Income from continuing operations 434.1 416.3 1,685.6 1,573.3
Income from discontinued operations, net of tax (4) - - 16.1 -
Net income $ 434.1 $ 416.3 $ 1,701.7 $ 1,573.3
$ 9,145.1 $ 10,188.7
Shareholders' equity
(1) Effective January 1, 2006, the Company adopted FAS 123R applying the modified retrospective approach. Accordingly, all prior-period financial
information was adjusted to reflect the Company's stock-based compensation activity.
(2) Health care costs for the three months ended December 31, 2006 and December 31, 2005 include favorable development of prior-period health
care cost estimates of approximately $45 million pretax (approximately $29 million after tax) and approximately $63 million pretax (approximately
$40 million after tax), respectively, in the Health Care segment. Health care costs for the twelve months ended December 31, 2006 and
December 31, 2005 include favorable development of prior-period health care cost estimates of approximately $18 million pretax (approximately
$12 million after tax) and approximately $250 million pretax (approximately $159 million after tax), respectively, in the Health Care segment.
(3) General and administrative expenses for the twelve months ended December 31, 2006 include a charge of $72.4 million ($47.1 million after tax)
in connection with the write-off of an insurance recoverable related to a prior-year physician class action settlement as a result of a trial court
summary judgment ruling and a $12.4 million ($8.1 million after tax) net charge from the write-off of debt issuance costs and the recognition of
deferred gains on terminated interest rate swaps in connection with the redemption of the Company's 8.5% senior notes due 2041. Both of
these charges are reflected in the Health Care segment. The twelve months ended December 31, 2006 also include a charge of $8.3 million
($6.2 million after tax) for an acquisition-related software charge reflected in the Group Insurance segment.
(4) Income from discontinued operations of approximately $16 million for the twelve months ended December 31, 2006 reflects the Company's
receipt in February 2006 of a $50 million refund, including interest, from the completion of certain Internal Revenue Service audits associated
with businesses previously sold by the Company's former parent company. The Company recorded $735 million of this refund in prior years.
The $50 million refund in 2006 resulted in an additional $16 million in income from discontinued operations in 2006.
2. Aetna/12
Summary of Results
(in Millions)
Three Months Ended Twelve Months Ended
December 31, December 31, December 31, December 31,
2006 2005 (1) 2006 2005 (1)
Operating earnings, excluding favorable development $ 395.2 $ 367.3 $ 1,635.9 $ 1,349.8
Favorable development of prior-period health care cost estimates 29.0 40.0 12.0 159.0
Operating earnings 424.2 407.3 1,647.9 1,508.8
Debt refinancing charge - - (8.1) -
Physician class action settlement insurance-related charge - - (47.1) -
Reduction of reserve for anticipated future losses on
discontinued products - - 75.0 43.4
Acquisition-related software charge - - (6.2) -
Net realized capital gains 9.9 9.0 24.1 21.1
Income from continuing operations (GAAP measure) 434.1 416.3 1,685.6 1,573.3
Income from discontinued operations (2) - - 16.1 -
Net income (GAAP measure) $ 434.1 $ 416.3 $ 1,701.7 $ 1,573.3
Weighted average common shares - basic 520.5 570.8 546.2 579.0
Weighted average common shares - diluted 541.8 596.9 569.1 606.0
Summary of Results Per Common Share
Operating earnings, excluding favorable development (3) $ .73 $ .62 $ 2.87 $ 2.23
Favorable development of prior-period health care cost estimates .05 .06 .03 .26
Operating earnings .78 .68 2.90 2.49
Debt refinancing charge - - (.01) -
Physician class action settlement insurance-related charge - - (.08) -
Reduction of reserve for anticipated future losses on
discontinued products - - .13 .07
Acquisition-related software charge - - (.01) -
Net realized capital gains .02 .02 .03 .04
Income from continuing operations (GAAP measure) .80 .70 2.96 2.60
Income from discontinued operations (2) - - .03 -
Net income (GAAP measure) $ .80 $ .70 $ 2.99 $ 2.60
Shareholders' equity (4) $ 17.72 $ 17.99
(1) Effective January 1, 2006, the Company adopted FAS 123R applying the modified retrospective approach. Accordingly, all prior-period financial
information was adjusted to reflect the Company's stock-based compensation activity. Additionally, results per common share and weighted average
common shares have been adjusted to reflect the February 17, 2006 two-for-one stock split.
(2) Income from discontinued operations of approximately $16 million for the twelve months ended December 31, 2006 reflects the Company's receipt in
February 2006 of a $50 million refund, including interest, from the completion of certain Internal Revenue Service audits associated with businesses
previously sold by the Company's former parent company. The Company recorded $735 million of this refund in prior years. The $50 million refund
in 2006 resulted in an additional $16 million in income from discontinued operations in 2006.
(3) The three and twelve months ended December 31, 2006 includes $.03 per share ($18 million after tax) related to a previously announced fourth
quarter severance charge. Operating earnings, excluding favorable development and the severance charge, for the three months ended
December 31, 2006 is $.76 per share.
(4) Actual common shares outstanding were 516.0 million at December 31, 2006 and 566.5 million at December 31, 2005.
3. Aetna/13
Segment Information (1)
($ in Millions)
Three Months Ended Twelve Months Ended
December 31, December 31, December 31, December 31,
2006 2005 (2) 2006 2005 (2)
Health Care:
Total revenue $ 5,627.9 $ 5,139.2 $ 22,240.5 $ 19,616.1
Selling expenses $ 216.2 $ 200.8 $ 867.4 $ 763.3
General and administrative expenses 923.7 890.4 3,533.8 3,424.9
Operating expenses, excluding other items 1,139.9 1,091.2 4,401.2 4,188.2
Debt refinancing charge - - 12.4 -
Physician class action settlement insurance-related charge - - 72.4 -
Total operating expenses (GAAP measure) $ 1,139.9 $ 1,091.2 $ 4,486.0 $ 4,188.2
Operating earnings, excluding favorable development $ 383.2 $ 341.5 $ 1,560.7 $ 1,268.7
Favorable development of prior-period health care cost estimates 29.0 40.0 12.0 159.0
Operating earnings 412.2 381.5 1,572.7 1,427.7
Debt refinancing charge - - (8.1) -
Physician class action settlement insurance-related charge - - (47.1) -
Net realized capital gains 6.5 2.0 8.0 7.0
Net income (GAAP measure) $ 418.7 $ 383.5 $ 1,525.5 $ 1,434.7
Group Insurance:
Total revenue $ 537.0 $ 554.5 $ 2,152.1 $ 2,141.8
Selling expenses $ 21.2 $ 19.7 $ 85.3 $ 80.2
General and administrative expenses 63.5 40.5 224.0 166.2
Operating expenses, excluding other item 84.7 60.2 309.3 246.4
Acquisition-related software charge - - 8.3 -
Total operating expenses (GAAP measure) $ 84.7 $ 60.2 $ 317.6 $ 246.4
Operating earnings $ 29.9 $ 35.0 $ 132.7 $ 127.7
Acquisition-related software charge - - (6.2) -
Net realized capital gains 4.7 2.1 7.4 8.7
Net income (GAAP measure) $ 34.6 $ 37.1 $ 133.9 $ 136.4
Large Case Pensions:
Total revenue $ 194.6 $ 173.7 $ 753.1 $ 734.0
Operating earnings $ 8.9 $ 12.0 $ 38.9 $ 33.2
Reduction of reserve for anticipated future losses on
discontinued products - - 75.0 43.4
Net realized capital (losses) gains (1.3) 4.9 8.7 5.4
Net income (GAAP measure) $ 7.6 $ 16.9 $ 122.6 $ 82.0
Corporate Interest:
Interest expense, net of tax $ 26.8 $ 21.2 $ 96.4 $ 79.8
Total Company:
Total revenue $ 6,359.5 $ 5,867.4 $ 25,145.7 $ 22,491.9
Selling expenses $ 237.4 $ 220.5 $ 952.7 $ 843.5
General and administrative expenses 991.6 935.7 3,774.8 3,609.2
Operating expenses, excluding other items 1,229.0 1,156.2 4,727.5 4,452.7
Debt refinancing charge - - 12.4 -
Physician class action settlement insurance-related charge - - 72.4 -
Acquisition-related software charge - - 8.3 -
Total operating expenses (GAAP measure) $ 1,229.0 $ 1,156.2 $ 4,820.6 $ 4,452.7
(1) Revenue and operating expense information is presented before income taxes. Operating earnings information is presented net of income taxes.
(2) Effective January 1, 2006, the Company adopted FAS 123R applying the modified retrospective approach. Accordingly, all prior-period financial
information was adjusted to reflect the Company's stock-based compensation activity.
4. Aetna/14
Membership
(Members in Thousands)
December 31, December 31, September 30,
2006 2005 2006
Medical Membership:
Commercial 15,141 14,521 15,122
Medicare Advantage 123 101 124
Medicare Health Support Program 17 19 18
Medicaid 152 114 119
Total Medical Membership 15,433 14,755 15,383
Consumer-Directed Health Plans (1) 676 453 644
Dental Membership 13,472 13,098 13,396
Pharmacy Membership:
Commercial 9,161 8,885 9,138
Medicare PDP (stand-alone) 314 - 319
Medicare Advantage PDP 115 - 115
Total Pharmacy Benefit Management Services 9,590 8,885 9,572
Mail Order (2) 625 560 630
Total Pharmacy Membership 10,215 9,445 10,202
Group Insurance Membership (3) 15,087 13,618 15,309
Health Care Medical Cost Ratios (4)
($ in Millions)
Three Months Ended Twelve Months Ended
December 31, December 31, December 31, December 31,
2006 2005 2006 2005
Health Care Premiums:
Health Care Risk (A) $ 4,845.2 $ 4,434.2 $ 19,153.5 $ 16,924.7
Commercial Risk (B) $ 4,383.9 $ 4,177.6 $ 17,356.5 $ 15,919.6
Medicare (C) $ 453.1 $ 256.6 $ 1,787.7 $ 1,005.1
Health Care Costs:
Health Care Risk
Health care costs (D) (GAAP measure) $ 3,819.1 $ 3,424.3 $ 15,301.0 $ 13,107.9
Favorable development of prior-period health care cost estimates 45.0 63.0 18.0 250.0
Health care costs - Adjusted (E) $ 3,864.1 $ 3,487.3 $ 15,319.0 $ 13,357.9
Commercial Risk
Health care costs (F) (GAAP measure) $ 3,431.9 $ 3,208.8 $ 13,769.1 $ 12,244.1
Favorable development of prior-period health care cost estimates 42.0 54.0 16.0 233.0
Health care costs - Adjusted (G) $ 3,473.9 $ 3,262.8 $ 13,785.1 $ 12,477.1
Medicare
Health care costs (H) (GAAP measure) $ 379.8 $ 215.5 $ 1,523.5 $ 863.9
Favorable development of prior-period health care cost estimates 4.0 9.0 2.0 17.0
Health care costs - Adjusted (I) $ 383.8 $ 224.5 $ 1,525.5 $ 880.9
Health Care Medical Cost Ratios:
Health Care Risk (D)/(A) (GAAP measure) 78.8% 77.2% 79.9% 77.4%
Health Care Risk - Adjusted (E)/(A) 79.8% 78.6% 80.0% 78.9%
Commercial Risk (F)/(B) (GAAP measure) 78.3% 76.8% 79.3% 76.9%
Commercial Risk - Adjusted (G)/(B) 79.2% 78.1% 79.4% 78.4%
Medicare (H)/(C) (GAAP measure) 83.8% 84.0% 85.2% 86.0%
Medicare - Adjusted (I)/(C) 84.7% 87.5% 85.3% 87.6%
(1) Represents members in consumer-directed health plans included in the Company's Commercial medical membership.
Represents members who purchased medications through Aetna Rx Home Delivery ®, the Company's mail order pharmacy, during the quarterly period.
(2)
(3) Beginning June 30, 2006 includes approximately 2.1 million disability members acquired from Broadspire on March 31, 2006.
(4) Health Care Risk includes all medical, dental and other health care risk products. Commercial Risk includes all health care risk products except Medicare and
Medicaid. Risk includes all medical, dental and other health care products for which the Company assumes all or a majority of health care cost, utilization or
other risk.
5. Aetna/15
Operating Margins
($ in Millions)
Three Months Ended Twelve Months Ended
December 31, December 31, December 31, December 31,
2006 2005 (1) 2006 2005 (1)
Reconciliation to Income from continuing operations before income taxes:
Operating earnings before income taxes, excluding interest expense, amortization
of other acquired intangible assets and favorable development (A) $ 670.7 $ 624.1 $ 2,748.0 $ 2,284.5
Favorable development of prior-period health care cost estimates 45.0 63.0 18.0 250.0
Operating earnings before income taxes, excluding interest expense and amortization
of other acquired intangible assets (B) 715.7 687.1 2,766.0 2,534.5
Interest expense (41.1) (32.6) (148.3) (122.8)
Amortization of other acquired intangible assets (21.9) (19.3) (85.6) (57.4)
Debt refinancing charge - - (12.4) -
Physician class action settlement insurance-related charge - - (72.4) -
Reduction of reserve for anticipated future losses on discontinued products - - 115.4 66.7
Acquisition-related software charge - - (8.3) -
Net realized capital gains 10.3 13.7 32.2 32.3
Income from continuing operations before income taxes (C) (GAAP measure) $ 663.0 $ 648.9 $ 2,586.6 $ 2,453.3
Reconciliation to Income from continuing operations:
Operating earnings, excluding interest expense, amortization of other acquired
intangible assets and favorable development (D) $ 436.3 $ 401.0 $ 1,788.0 $ 1,466.9
Favorable development of prior-period health care cost estimates, net of tax 29.0 40.0 12.0 159.0
Operating earnings, excluding interest expense and amortization of other acquired
intangible assets (E) 465.3 441.0 1,800.0 1,625.9
Interest expense, net of tax (26.8) (21.2) (96.4) (79.8)
Amortization of other acquired intangible assets, net of tax (14.3) (12.5) (55.7) (37.3)
Debt refinancing charge, net of tax - - (8.1) -
Physician class action settlement insurance-related charge, net of tax - - (47.1) -
Reduction of reserve for anticipated future losses on discontinued products, net of tax - - 75.0 43.4
Acquisition-related software charge, net of tax - - (6.2) -
Net realized capital gains, net of tax 9.9 9.0 24.1 21.1
Income from continuing operations (F) (GAAP measure) $ 434.1 $ 416.3 $ 1,685.6 $ 1,573.3
Reconciliation of Revenue:
Revenue, excluding net realized capital gains (G) $ 6,349.2 $ 5,853.7 $ 25,113.5 $ 22,459.6
Net realized capital gains 10.3 13.7 32.2 32.3
Total revenue (H) (GAAP measure) $ 6,359.5 $ 5,867.4 $ 25,145.7 $ 22,491.9
Operating Margins:
Pretax operating margin (B)/(G) 11.3% 11.7% 11.0% 11.3%
Pretax operating margin - Adjusted (A)/(G) 10.6% 10.7% 10.9% 10.2%
Pretax operating margin (C)/(H) (GAAP measure) 10.4% 11.1% 10.3% 10.9%
After-tax operating margin (E)/(G) 7.3% 7.5% 7.2% 7.2%
After-tax operating margin - Adjusted (D)/(G) 6.9% 6.9% 7.1% 6.5%
After-tax operating margin (F)/(H) (GAAP measure) 6.8% 7.1% 6.7% 7.0%
Operating Expenses
($ in Millions)
Reconciliation of Operating Expenses:
Operating expenses, excluding other items (I) $ 1,229.0 $ 1,156.2 $ 4,727.5 $ 4,452.7
Debt refinancing charge - - 12.4 -
Physician class action settlement insurance-related charge - - 72.4 -
Acquisition-related software charge - - 8.3 -
Total operating expenses (J) (GAAP measure) $ 1,229.0 $ 1,156.2 $ 4,820.6 $ 4,452.7
Operating Expenses Percentages:
Operating expenses as a % of revenue (I)/(G) (2) 19.4% 19.8% 18.8% 19.8%
Total operating expenses as a % of total revenue (J)/(H) (GAAP measure) 19.3% 19.7% 19.2% 19.8%
(1) Effective January 1, 2006, the Company adopted FAS 123R applying the modified retrospective approach. Accordingly, all prior-period financial
information was adjusted to reflect the Company's stock-based compensation activity.
(2) Excluding the previously announced fourth quarter severance charge of $27 million pretax, operating expenses as a % of revenue for the three
months ended December 31, 2006 is 18.9%.