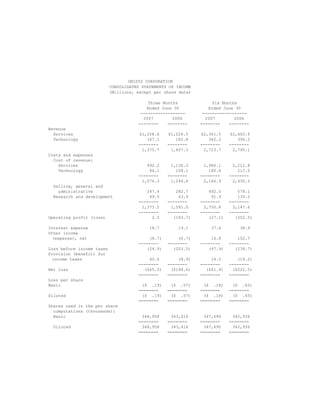
SlideShare a Scribd company logo
UNISYS CORPORATION
                           CONSOLIDATED STATEMENTS OF INCOME
                           (Millions, except per share data)

                                           Three Months              Six Months
                                          Ended June 30            Ended June 30
                                       ------------------       ------------------
                                        2007         2006        2007         2006
                                      --------     --------    --------     --------
Revenue
  Services                            $1,208.6    $1,224.5     $2,361.5    $2,400.9
  Technology                             167.1       182.8        362.2       394.2
                                      --------    --------     --------    --------
                                       1,375.7     1,407.3      2,723.7     2,795.1
Costs and expenses
  Cost of revenue:
    Services                             992.2     1,136.3      1,986.1     2,212.8
    Technology                            84.1       108.1        180.8       217.5
                                      --------    --------     --------    --------
                                       1,076.3     1,244.4      2,166.9     2,430.3
  Selling, general and
    administrative                       247.4       282.7        492.0       578.1
  Research and development                49.5        63.9         91.9       139.2
                                      --------    --------     --------    --------
                                       1,373.2     1,591.0      2,750.8     3,147.6
                                      --------    --------     --------    --------
Operating profit (loss)                    2.5      (183.7)       (27.1)     (352.5)

Interest expense                           18.7        19.1        37.6         38.9
Other income
  (expense), net                          (8.7)       (0.7)        16.8       152.7
                                      --------    --------     --------    --------
Loss before income taxes                 (24.9)     (203.5)       (47.9)     (238.7)
Provision (benefit) for
  income taxes                            40.6        (8.9)        14.0       (16.2)
                                      --------    --------     --------    --------
Net loss                                ($65.5)    ($194.6)      ($61.9)    ($222.5)
                                      ========    ========     ========    ========
Loss per share
Basic                                  ($ .19)     ($ .57)      ($ .18)     ($ .65)
                                      ========    ========     ========    ========
Diluted                                ($ .19)     ($ .57)      ($ .18)     ($ .65)
                                      ========    ========     ========    ========
Shares used in the per share
  computations (thousands):
  Basic                                348,958     343,414      347,690     342,936
                                      ========    ========     ========    ========
  Diluted                              348,958     343,414      347,690     342,936
                                      ========    ========     ========    ========
UNISYS CORPORATION
                             SEGMENT RESULTS

                                (Millions)

                                           Elimi-
                              Total        nations    Services* Technology*
                             --------      --------   --------   ----------
Three Months Ended
June 30, 2007
------------------
Customer revenue            $1,375.7                  $1,208.6      $167.1
Intersegment                                ($47.4)        3.6        43.8
                             --------      --------    --------    --------
Total revenue               $1,375.7        ($47.4)   $1,212.2      $210.9
                             ========      ========    ========    ========

Gross profit percent           21.8%                    17.3%        43.3%
                             ========                 ========     ========
Operating profit
  (loss) percent                0.2%                     2.5%        (0.6%)
                             ========                 ========     ========
Three Months Ended
June 30, 2006
------------------
Customer revenue            $1,407.3                  $1,224.5      $182.8
Intersegment                                ($53.2)        3.8        49.4
                             --------      --------    --------    --------
Total revenue               $1,407.3        ($53.2)   $1,228.3      $232.2
                             ========      ========    ========    ========

Gross profit percent           11.6%                    14.3%        37.6%
                             ========                 ========     ========
Operating loss
  percent                     (13.1%)                   (0.9%)      (12.2%)
                             ========                 ========     ========

Six Months Ended
June 30, 2007
------------------
Customer revenue            $2,723.7                  $2,361.5      $362.2
Intersegment                                ($87.5)        7.5        80.0
                             --------      --------    --------    --------
Total revenue               $2,723.7        ($87.5)   $2,369.0      $442.2
                             ========      ========    ========    ========

Gross profit percent           20.4%                    16.2%        43.3%
                             ========                 ========     ========
Operating profit
  (loss) percent               (1.0%)                    0.8%         1.5%
                             ========                 ========     ========
Six Months Ended
June 30, 2006
------------------
Customer revenue            $2,795.1                  $2,400.9      $394.2
Intersegment                                ($95.8)        7.2        88.6
                             --------      --------    --------    --------
Total revenue               $2,795.1        ($95.8)   $2,408.1      $482.8
                             ========      ========    ========    ========

Gross profit percent           13.1%                    14.7%        39.8%
                             ========                 ========     ========
Operating loss
  percent                     (12.6%)                   (0.9%)       (8.7%)
                             ========                 ========     ========

* Results exclude cost reduction actions
UNISYS CORPORATION
                     CONSOLIDATED BALANCE SHEETS
                              (Millions)
                                              June 30,     December 31,
                                                2007           2006
                                             ----------     ----------
Assets
Current assets
  Cash and cash equivalents                     $520.7         $719.3
  Accounts and notes receivable, net           1,045.2        1,164.6
  Inventories
     Parts and finished equipment                  101.2         95.0
     Work in process and materials                  86.5         81.2
  Deferred income taxes                             30.0         30.0
  Prepaid expense and other
    current assets                                173.1         148.4
                                             ----------    ----------
 Total                                          1,956.7       2,238.5
                                             ----------    ----------
Properties                                      1,294.7       1,233.4
  Less accumulated depreciation
    and amortization                              943.8         892.1
                                             ----------    ----------
  Properties, net                                 350.9         341.3
                                             ----------    ----------
Outsourcing assets, net                           419.2         401.1
Marketable software, net                          286.8         304.3
Prepaid postretirement assets                     308.8         250.1
Deferred income taxes                             191.3         191.3
Goodwill                                          196.8         193.9
Other long-term assets                            121.8         117.4
                                             ----------    ----------
  Total                                        $3,832.3      $4,037.9
                                             ==========    ==========
Liabilities and stockholders' equity (deficit)
Current liabilities
  Notes payable                                    $0.6          $1.2
  Current maturities of long-term debt            200.3           0.5
  Accounts payable                                373.3         460.9
  Other accrued liabilities                     1,342.1       1,469.1
                                             ----------    ----------
  Total                                         1,916.3       1,931.7
                                             ----------    ----------
Long-term debt                                    849.3       1,049.1
Long-term postretirement liabilities              642.7         667.7
Other long-term liabilities                       426.2         453.6
Stockholders' equity (deficit)
  Common stock                                      3.5           3.5
  Accumulated deficit                          (2,448.7)     (2,386.8)
  Other capital                                 3,984.2       3,945.1
  Accumulated other comprehensive loss         (1,541.2)     (1,626.0)
                                             ----------    ----------
  Stockholders' deficit                            (2.2)        (64.2)
                                             ----------    ----------
  Total                                        $3,832.3      $4,037.9
                                             ==========    ==========
UNISYS CORPORATION
                  CONSOLIDATED STATEMENTS OF CASH FLOWS
                                (Millions)
                                                      Six Months Ended
                                                           June 30
                                                    -------------------
                                                     2007           2006
                                                    -------        -------
Cash flows from operating activities
Net loss                                             ($61.9)       ($222.5)
Add (deduct) items to reconcile
  net loss to net cash used for
  operating activities:
Equity loss                                                            4.3
Employee stock compensation expense                      5.5           3.2
Company stock issued for U.S. 401(k) plan               23.0           8.9
Depreciation and amortization
  of properties                                         56.9          58.5
Depreciation and amortization of
  outsourcing assets                                    70.6          66.7
Amortization of marketable software                     62.1          66.2
Gain on sale of assets                                 (23.1)       (153.2)
Increase in deferred
  income taxes, net                                                  (41.9)
Decrease in receivables, net                           136.0          66.7
(Increase) decrease in inventories                      (9.0)         10.2
(Decrease) increase in accounts payable
  and other accrued liabilities                      (250.5)           8.0
Decrease in other liabilities                          (50.9)        (44.5)
(Increase) decrease in other assets                    (39.9)          1.2
Other                                                     .1           2.2
                                                     -------        -------
Net cash used for operating activities                 (81.1)       (166.0)
                                                     -------        -------
Cash flows from investing activities
  Proceeds from investments                         3,942.4        3,729.3
  Purchases of investments                         (3,941.0)     (3,731.3)
  Investment in marketable software                    (48.9)        (55.3)
  Capital additions of properties                      (39.8)        (32.7)
  Capital additions of outsourcing assets              (78.5)        (50.1)
  Purchases of businesses                               (1.6)
  Proceeds from sale of assets                          27.7         380.6
                                                     -------        -------
Net cash (used for) provided by
  investing activities                               (139.7)         240.5
                                                     -------        -------
Cash flows from financing activities
  Net reduction in short-term borrowings                 (.6)         (7.4)
  Proceeds from exercise of stock options               11.3             .9
  Payments of long-term debt                                         (57.9)
  Cost of credit agreement                                            (4.6)
                                                     -------        -------
Net cash provided by (used for) financing
  activities                                            10.7         (69.0)
                                                     -------        -------
Effect of exchange rate changes on cash
  and cash equivalents                                  11.5           7.1
                                                     -------        -------
(Decrease) increase in cash
  and cash equivalents                               (198.6)          12.6
Cash and cash equivalents, beginning of
  period                                               719.3         642.5
                                                     -------        -------
Cash and cash equivalents, end of period             $520.7         $655.1
                                                     =======        =======

More Related Content

What's hot

unisys 4Q06_SPR
unisys 4Q06_SPRunisys 4Q06_SPR
unisys 4Q06_SPRfinance36
 
unisys 3Q04_SPR
unisys 3Q04_SPRunisys 3Q04_SPR
unisys 3Q04_SPRfinance36
 
unisys 4Q05_SPR
unisys 4Q05_SPRunisys 4Q05_SPR
unisys 4Q05_SPRfinance36
 
unisys 3Q05_SPR
unisys 3Q05_SPRunisys 3Q05_SPR
unisys 3Q05_SPRfinance36
 
unisys 4Q04_SPR
unisys 4Q04_SPRunisys 4Q04_SPR
unisys 4Q04_SPRfinance36
 
unisys 1Q08_SPR
unisys 1Q08_SPRunisys 1Q08_SPR
unisys 1Q08_SPRfinance36
 
unisys 1Q07_SPR
unisys 1Q07_SPRunisys 1Q07_SPR
unisys 1Q07_SPRfinance36
 
unisys 1Q06_SPR
unisys 1Q06_SPRunisys 1Q06_SPR
unisys 1Q06_SPRfinance36
 
unisys 1Q04_SPR
unisys 1Q04_SPRunisys 1Q04_SPR
unisys 1Q04_SPRfinance36
 
unisys 1Q05_SPR
unisys 1Q05_SPRunisys 1Q05_SPR
unisys 1Q05_SPRfinance36
 
unisys 2001_2Q_10Q
unisys 2001_2Q_10Qunisys 2001_2Q_10Q
unisys 2001_2Q_10Qfinance36
 
unisys 2001_1Q_10Q
unisys 2001_1Q_10Qunisys 2001_1Q_10Q
unisys 2001_1Q_10Qfinance36
 
unisys 2001_3Q_10Q
unisys 2001_3Q_10Qunisys 2001_3Q_10Q
unisys 2001_3Q_10Qfinance36
 
unisys 2002_2Q_10Q
unisys 2002_2Q_10Qunisys 2002_2Q_10Q
unisys 2002_2Q_10Qfinance36
 
unisys 2002_3Q_10Q
unisys 2002_3Q_10Qunisys 2002_3Q_10Q
unisys 2002_3Q_10Qfinance36
 
Big_Lots_AR2002FSO
Big_Lots_AR2002FSOBig_Lots_AR2002FSO
Big_Lots_AR2002FSOfinance50
 
unisys 2002_1Q_10Q
unisys 2002_1Q_10Qunisys 2002_1Q_10Q
unisys 2002_1Q_10Qfinance36
 
.schering-plough Cash-Flow-Highlights
.schering-plough Cash-Flow-Highlights.schering-plough Cash-Flow-Highlights
.schering-plough Cash-Flow-Highlightsfinance22
 

What's hot (19)

unisys 4Q06_SPR
unisys 4Q06_SPRunisys 4Q06_SPR
unisys 4Q06_SPR
 
unisys 3Q04_SPR
unisys 3Q04_SPRunisys 3Q04_SPR
unisys 3Q04_SPR
 
unisys 4Q05_SPR
unisys 4Q05_SPRunisys 4Q05_SPR
unisys 4Q05_SPR
 
unisys 3Q05_SPR
unisys 3Q05_SPRunisys 3Q05_SPR
unisys 3Q05_SPR
 
unisys 4Q04_SPR
unisys 4Q04_SPRunisys 4Q04_SPR
unisys 4Q04_SPR
 
unisys 1Q08_SPR
unisys 1Q08_SPRunisys 1Q08_SPR
unisys 1Q08_SPR
 
unisys 1Q07_SPR
unisys 1Q07_SPRunisys 1Q07_SPR
unisys 1Q07_SPR
 
unisys 1Q06_SPR
unisys 1Q06_SPRunisys 1Q06_SPR
unisys 1Q06_SPR
 
unisys 1Q04_SPR
unisys 1Q04_SPRunisys 1Q04_SPR
unisys 1Q04_SPR
 
unisys 1Q05_SPR
unisys 1Q05_SPRunisys 1Q05_SPR
unisys 1Q05_SPR
 
unisys 2001_2Q_10Q
unisys 2001_2Q_10Qunisys 2001_2Q_10Q
unisys 2001_2Q_10Q
 
unisys 2001_1Q_10Q
unisys 2001_1Q_10Qunisys 2001_1Q_10Q
unisys 2001_1Q_10Q
 
unisys 2001_3Q_10Q
unisys 2001_3Q_10Qunisys 2001_3Q_10Q
unisys 2001_3Q_10Q
 
unisys 2002_2Q_10Q
unisys 2002_2Q_10Qunisys 2002_2Q_10Q
unisys 2002_2Q_10Q
 
unisys 2002_3Q_10Q
unisys 2002_3Q_10Qunisys 2002_3Q_10Q
unisys 2002_3Q_10Q
 
Big_Lots_AR2002FSO
Big_Lots_AR2002FSOBig_Lots_AR2002FSO
Big_Lots_AR2002FSO
 
Q1 2009 Earning Report of Stockeryale Inc.
Q1 2009 Earning Report of Stockeryale Inc.Q1 2009 Earning Report of Stockeryale Inc.
Q1 2009 Earning Report of Stockeryale Inc.
 
unisys 2002_1Q_10Q
unisys 2002_1Q_10Qunisys 2002_1Q_10Q
unisys 2002_1Q_10Q
 
.schering-plough Cash-Flow-Highlights
.schering-plough Cash-Flow-Highlights.schering-plough Cash-Flow-Highlights
.schering-plough Cash-Flow-Highlights
 

Viewers also liked

Social Media
Social MediaSocial Media
Social Media
Jakub Dąbkowski
 
Spotkanie z klientem w sieci czyli 3 WIELKIE Tajemnice
Spotkanie z klientem w sieci  czyli 3 WIELKIE TajemniceSpotkanie z klientem w sieci  czyli 3 WIELKIE Tajemnice
Spotkanie z klientem w sieci czyli 3 WIELKIE Tajemnice
Jakub Dąbkowski
 
micron technollogy Q1_01_10Q
micron technollogy Q1_01_10Qmicron technollogy Q1_01_10Q
micron technollogy Q1_01_10Qfinance36
 
Portfolio
PortfolioPortfolio
Portfoliosjl5143
 
Za darmo! Czyli czy chronić czy nie?
Za darmo! Czyli czy chronić czy nie?Za darmo! Czyli czy chronić czy nie?
Za darmo! Czyli czy chronić czy nie?
Jakub Dąbkowski
 
unisys 01298854
unisys 01298854unisys 01298854
unisys 01298854finance36
 
HexionAcquisitionJuly07Final
HexionAcquisitionJuly07FinalHexionAcquisitionJuly07Final
HexionAcquisitionJuly07Finalfinance36
 
Compensation Plan
Compensation PlanCompensation Plan
Compensation Plan
sandygehringer
 
Fof Risk Management
Fof Risk ManagementFof Risk Management
Fof Risk Managementguesta79c72
 
Najwazniejsze Pytanie W Projekcie
Najwazniejsze Pytanie W ProjekcieNajwazniejsze Pytanie W Projekcie
Najwazniejsze Pytanie W Projekcie
Jakub Dąbkowski
 
micron technollogy Q1_02_10Q
micron technollogy Q1_02_10Qmicron technollogy Q1_02_10Q
micron technollogy Q1_02_10Qfinance36
 
Prescription For Change
Prescription For ChangePrescription For Change
Prescription For Change
sandygehringer
 
Insider Magazine June 2016
Insider Magazine June 2016Insider Magazine June 2016
Insider Magazine June 2016manobillee50
 
Ale o co Chodzi?
Ale o co Chodzi?Ale o co Chodzi?
Ale o co Chodzi?
Jakub Dąbkowski
 
欣生活事業說明
欣生活事業說明欣生活事業說明
欣生活事業說明cherry27
 
Coldplay media narrative
Coldplay media narrativeColdplay media narrative
Coldplay media narrativepaulmanzi
 
Logging Onto Glogster
Logging Onto GlogsterLogging Onto Glogster
Logging Onto GlogsterMr.Ateach
 
Dagboek Makerskamer Hambaken, Blind Date project 2011
Dagboek Makerskamer Hambaken, Blind Date project 2011 Dagboek Makerskamer Hambaken, Blind Date project 2011
Dagboek Makerskamer Hambaken, Blind Date project 2011 Raimon Sibilo
 
Measurement
MeasurementMeasurement
Measurementgrade5a
 
Informática 2° a 5° colpasy
Informática 2° a 5° colpasyInformática 2° a 5° colpasy
Informática 2° a 5° colpasyJason Carvajal
 

Viewers also liked (20)

Social Media
Social MediaSocial Media
Social Media
 
Spotkanie z klientem w sieci czyli 3 WIELKIE Tajemnice
Spotkanie z klientem w sieci  czyli 3 WIELKIE TajemniceSpotkanie z klientem w sieci  czyli 3 WIELKIE Tajemnice
Spotkanie z klientem w sieci czyli 3 WIELKIE Tajemnice
 
micron technollogy Q1_01_10Q
micron technollogy Q1_01_10Qmicron technollogy Q1_01_10Q
micron technollogy Q1_01_10Q
 
Portfolio
PortfolioPortfolio
Portfolio
 
Za darmo! Czyli czy chronić czy nie?
Za darmo! Czyli czy chronić czy nie?Za darmo! Czyli czy chronić czy nie?
Za darmo! Czyli czy chronić czy nie?
 
unisys 01298854
unisys 01298854unisys 01298854
unisys 01298854
 
HexionAcquisitionJuly07Final
HexionAcquisitionJuly07FinalHexionAcquisitionJuly07Final
HexionAcquisitionJuly07Final
 
Compensation Plan
Compensation PlanCompensation Plan
Compensation Plan
 
Fof Risk Management
Fof Risk ManagementFof Risk Management
Fof Risk Management
 
Najwazniejsze Pytanie W Projekcie
Najwazniejsze Pytanie W ProjekcieNajwazniejsze Pytanie W Projekcie
Najwazniejsze Pytanie W Projekcie
 
micron technollogy Q1_02_10Q
micron technollogy Q1_02_10Qmicron technollogy Q1_02_10Q
micron technollogy Q1_02_10Q
 
Prescription For Change
Prescription For ChangePrescription For Change
Prescription For Change
 
Insider Magazine June 2016
Insider Magazine June 2016Insider Magazine June 2016
Insider Magazine June 2016
 
Ale o co Chodzi?
Ale o co Chodzi?Ale o co Chodzi?
Ale o co Chodzi?
 
欣生活事業說明
欣生活事業說明欣生活事業說明
欣生活事業說明
 
Coldplay media narrative
Coldplay media narrativeColdplay media narrative
Coldplay media narrative
 
Logging Onto Glogster
Logging Onto GlogsterLogging Onto Glogster
Logging Onto Glogster
 
Dagboek Makerskamer Hambaken, Blind Date project 2011
Dagboek Makerskamer Hambaken, Blind Date project 2011 Dagboek Makerskamer Hambaken, Blind Date project 2011
Dagboek Makerskamer Hambaken, Blind Date project 2011
 
Measurement
MeasurementMeasurement
Measurement
 
Informática 2° a 5° colpasy
Informática 2° a 5° colpasyInformática 2° a 5° colpasy
Informática 2° a 5° colpasy
 

Similar to unisys 2Q07_SPR

unisys 2Q04_SPR
unisys 2Q04_SPRunisys 2Q04_SPR
unisys 2Q04_SPRfinance36
 
unisys 2Q04_SPR
unisys 2Q04_SPRunisys 2Q04_SPR
unisys 2Q04_SPRfinance36
 
Q1 2009 Earning Report of Weatherford International
Q1 2009 Earning Report of Weatherford InternationalQ1 2009 Earning Report of Weatherford International
Q1 2009 Earning Report of Weatherford Internationalearningreport earningreport
 
Q1 2009 Earning Report of Weatherford International
Q1 2009 Earning Report of Weatherford InternationalQ1 2009 Earning Report of Weatherford International
Q1 2009 Earning Report of Weatherford Internationalearningreport earningreport
 
qwest communications Q_3Q07_Historical_v2
qwest communications Q_3Q07_Historical_v2qwest communications Q_3Q07_Historical_v2
qwest communications Q_3Q07_Historical_v2finance19
 
qwest communications Q_4Q07_profile
qwest communications Q_4Q07_profileqwest communications Q_4Q07_profile
qwest communications Q_4Q07_profilefinance19
 
8_6_2Q07adjustedopincomeeps2Q2007
8_6_2Q07adjustedopincomeeps2Q20078_6_2Q07adjustedopincomeeps2Q2007
8_6_2Q07adjustedopincomeeps2Q2007finance50
 
alltel 3Q06_Highlightsa
alltel  3Q06_Highlightsaalltel  3Q06_Highlightsa
alltel 3Q06_Highlightsafinance27
 
Maxim 2Q FISCAL 2009 RESULTS
Maxim 2Q FISCAL 2009 RESULTSMaxim 2Q FISCAL 2009 RESULTS
Maxim 2Q FISCAL 2009 RESULTS
earningsreport
 
alltel 2q 07_highlights
alltel  2q 07_highlightsalltel  2q 07_highlights
alltel 2q 07_highlightsfinance27
 
danaher 07_3Q_Release
danaher 07_3Q_Releasedanaher 07_3Q_Release
danaher 07_3Q_Releasefinance24
 
qwest communications Historical Quarterly Results1Q 06_2Q08
qwest communications Historical Quarterly Results1Q 06_2Q08qwest communications Historical Quarterly Results1Q 06_2Q08
qwest communications Historical Quarterly Results1Q 06_2Q08finance19
 
danaher 07_2Q_Release
danaher 07_2Q_Releasedanaher 07_2Q_Release
danaher 07_2Q_Releasefinance24
 
adjusted_opincome_eps3Q2007
adjusted_opincome_eps3Q2007adjusted_opincome_eps3Q2007
adjusted_opincome_eps3Q2007finance50
 
alltel 4q 06_highlights
alltel  4q 06_highlightsalltel  4q 06_highlights
alltel 4q 06_highlightsfinance27
 
qwest communications Historical Quarterly Results1Q 06_3Q08
qwest communications Historical Quarterly Results1Q 06_3Q08qwest communications Historical Quarterly Results1Q 06_3Q08
qwest communications Historical Quarterly Results1Q 06_3Q08finance19
 

Similar to unisys 2Q07_SPR (16)

unisys 2Q04_SPR
unisys 2Q04_SPRunisys 2Q04_SPR
unisys 2Q04_SPR
 
unisys 2Q04_SPR
unisys 2Q04_SPRunisys 2Q04_SPR
unisys 2Q04_SPR
 
Q1 2009 Earning Report of Weatherford International
Q1 2009 Earning Report of Weatherford InternationalQ1 2009 Earning Report of Weatherford International
Q1 2009 Earning Report of Weatherford International
 
Q1 2009 Earning Report of Weatherford International
Q1 2009 Earning Report of Weatherford InternationalQ1 2009 Earning Report of Weatherford International
Q1 2009 Earning Report of Weatherford International
 
qwest communications Q_3Q07_Historical_v2
qwest communications Q_3Q07_Historical_v2qwest communications Q_3Q07_Historical_v2
qwest communications Q_3Q07_Historical_v2
 
qwest communications Q_4Q07_profile
qwest communications Q_4Q07_profileqwest communications Q_4Q07_profile
qwest communications Q_4Q07_profile
 
8_6_2Q07adjustedopincomeeps2Q2007
8_6_2Q07adjustedopincomeeps2Q20078_6_2Q07adjustedopincomeeps2Q2007
8_6_2Q07adjustedopincomeeps2Q2007
 
alltel 3Q06_Highlightsa
alltel  3Q06_Highlightsaalltel  3Q06_Highlightsa
alltel 3Q06_Highlightsa
 
Maxim 2Q FISCAL 2009 RESULTS
Maxim 2Q FISCAL 2009 RESULTSMaxim 2Q FISCAL 2009 RESULTS
Maxim 2Q FISCAL 2009 RESULTS
 
alltel 2q 07_highlights
alltel  2q 07_highlightsalltel  2q 07_highlights
alltel 2q 07_highlights
 
danaher 07_3Q_Release
danaher 07_3Q_Releasedanaher 07_3Q_Release
danaher 07_3Q_Release
 
qwest communications Historical Quarterly Results1Q 06_2Q08
qwest communications Historical Quarterly Results1Q 06_2Q08qwest communications Historical Quarterly Results1Q 06_2Q08
qwest communications Historical Quarterly Results1Q 06_2Q08
 
danaher 07_2Q_Release
danaher 07_2Q_Releasedanaher 07_2Q_Release
danaher 07_2Q_Release
 
adjusted_opincome_eps3Q2007
adjusted_opincome_eps3Q2007adjusted_opincome_eps3Q2007
adjusted_opincome_eps3Q2007
 
alltel 4q 06_highlights
alltel  4q 06_highlightsalltel  4q 06_highlights
alltel 4q 06_highlights
 
qwest communications Historical Quarterly Results1Q 06_3Q08
qwest communications Historical Quarterly Results1Q 06_3Q08qwest communications Historical Quarterly Results1Q 06_3Q08
qwest communications Historical Quarterly Results1Q 06_3Q08
 

More from finance36

unisys 2001_10K
unisys 2001_10Kunisys 2001_10K
unisys 2001_10Kfinance36
 
unisys 2002_10K
unisys 2002_10Kunisys 2002_10K
unisys 2002_10Kfinance36
 
unisys 2003_1Q_10Q
unisys 2003_1Q_10Qunisys 2003_1Q_10Q
unisys 2003_1Q_10Qfinance36
 
unisys 2003_2Q_10Q
unisys 2003_2Q_10Qunisys 2003_2Q_10Q
unisys 2003_2Q_10Qfinance36
 
unisys 2003_3Q_10Q
unisys 2003_3Q_10Qunisys 2003_3Q_10Q
unisys 2003_3Q_10Qfinance36
 
unisys 2003_4Q_10K
unisys 2003_4Q_10Kunisys 2003_4Q_10K
unisys 2003_4Q_10Kfinance36
 
unisys 1Q04_10Q
unisys 1Q04_10Qunisys 1Q04_10Q
unisys 1Q04_10Qfinance36
 
unisys 2Q04_10Q
unisys 2Q04_10Qunisys 2Q04_10Q
unisys 2Q04_10Qfinance36
 
unisys 3Q04_10Q
unisys 3Q04_10Qunisys 3Q04_10Q
unisys 3Q04_10Qfinance36
 
unisys 2004_4Q_10K
unisys 2004_4Q_10Kunisys 2004_4Q_10K
unisys 2004_4Q_10Kfinance36
 
unisys 2005_1Q_10Q
unisys 2005_1Q_10Qunisys 2005_1Q_10Q
unisys 2005_1Q_10Qfinance36
 
unisys 2005_2Q_10Q
unisys 2005_2Q_10Qunisys 2005_2Q_10Q
unisys 2005_2Q_10Qfinance36
 
unisys 2005_3Q_10Q
unisys 2005_3Q_10Qunisys 2005_3Q_10Q
unisys 2005_3Q_10Qfinance36
 
unisys 2005_4Q_10K
unisys 2005_4Q_10Kunisys 2005_4Q_10K
unisys 2005_4Q_10Kfinance36
 

More from finance36 (14)

unisys 2001_10K
unisys 2001_10Kunisys 2001_10K
unisys 2001_10K
 
unisys 2002_10K
unisys 2002_10Kunisys 2002_10K
unisys 2002_10K
 
unisys 2003_1Q_10Q
unisys 2003_1Q_10Qunisys 2003_1Q_10Q
unisys 2003_1Q_10Q
 
unisys 2003_2Q_10Q
unisys 2003_2Q_10Qunisys 2003_2Q_10Q
unisys 2003_2Q_10Q
 
unisys 2003_3Q_10Q
unisys 2003_3Q_10Qunisys 2003_3Q_10Q
unisys 2003_3Q_10Q
 
unisys 2003_4Q_10K
unisys 2003_4Q_10Kunisys 2003_4Q_10K
unisys 2003_4Q_10K
 
unisys 1Q04_10Q
unisys 1Q04_10Qunisys 1Q04_10Q
unisys 1Q04_10Q
 
unisys 2Q04_10Q
unisys 2Q04_10Qunisys 2Q04_10Q
unisys 2Q04_10Q
 
unisys 3Q04_10Q
unisys 3Q04_10Qunisys 3Q04_10Q
unisys 3Q04_10Q
 
unisys 2004_4Q_10K
unisys 2004_4Q_10Kunisys 2004_4Q_10K
unisys 2004_4Q_10K
 
unisys 2005_1Q_10Q
unisys 2005_1Q_10Qunisys 2005_1Q_10Q
unisys 2005_1Q_10Q
 
unisys 2005_2Q_10Q
unisys 2005_2Q_10Qunisys 2005_2Q_10Q
unisys 2005_2Q_10Q
 
unisys 2005_3Q_10Q
unisys 2005_3Q_10Qunisys 2005_3Q_10Q
unisys 2005_3Q_10Q
 
unisys 2005_4Q_10K
unisys 2005_4Q_10Kunisys 2005_4Q_10K
unisys 2005_4Q_10K
 

Recently uploaded

USDA Loans in California: A Comprehensive Overview.pptx
USDA Loans in California: A Comprehensive Overview.pptxUSDA Loans in California: A Comprehensive Overview.pptx
USDA Loans in California: A Comprehensive Overview.pptx
marketing367770
 
Commercial Bank Economic Capsule - May 2024
Commercial Bank Economic Capsule - May 2024Commercial Bank Economic Capsule - May 2024
Commercial Bank Economic Capsule - May 2024
Commercial Bank of Ceylon PLC
 
Scope Of Macroeconomics introduction and basic theories
Scope Of Macroeconomics introduction and basic theoriesScope Of Macroeconomics introduction and basic theories
Scope Of Macroeconomics introduction and basic theories
nomankalyar153
 
Summary of financial results for 1Q2024
Summary of financial  results for 1Q2024Summary of financial  results for 1Q2024
Summary of financial results for 1Q2024
InterCars
 
This assessment plan proposal is to outline a structured approach to evaluati...
This assessment plan proposal is to outline a structured approach to evaluati...This assessment plan proposal is to outline a structured approach to evaluati...
This assessment plan proposal is to outline a structured approach to evaluati...
lamluanvan.net Viết thuê luận văn
 
managementaccountingunitiv-230422140105-dd17d80b.ppt
managementaccountingunitiv-230422140105-dd17d80b.pptmanagementaccountingunitiv-230422140105-dd17d80b.ppt
managementaccountingunitiv-230422140105-dd17d80b.ppt
SuseelaPalanimuthu
 
Empowering the Unbanked: The Vital Role of NBFCs in Promoting Financial Inclu...
Empowering the Unbanked: The Vital Role of NBFCs in Promoting Financial Inclu...Empowering the Unbanked: The Vital Role of NBFCs in Promoting Financial Inclu...
Empowering the Unbanked: The Vital Role of NBFCs in Promoting Financial Inclu...
Vighnesh Shashtri
 
PF-Wagner's Theory of Public Expenditure.pptx
PF-Wagner's Theory of Public Expenditure.pptxPF-Wagner's Theory of Public Expenditure.pptx
PF-Wagner's Theory of Public Expenditure.pptx
GunjanSharma28848
 
how to sell pi coins on Bitmart crypto exchange
how to sell pi coins on Bitmart crypto exchangehow to sell pi coins on Bitmart crypto exchange
how to sell pi coins on Bitmart crypto exchange
DOT TECH
 
Introduction to Indian Financial System ()
Introduction to Indian Financial System ()Introduction to Indian Financial System ()
Introduction to Indian Financial System ()
Avanish Goel
 
What website can I sell pi coins securely.
What website can I sell pi coins securely.What website can I sell pi coins securely.
What website can I sell pi coins securely.
DOT TECH
 
Financial Assets: Debit vs Equity Securities.pptx
Financial Assets: Debit vs Equity Securities.pptxFinancial Assets: Debit vs Equity Securities.pptx
Financial Assets: Debit vs Equity Securities.pptx
Writo-Finance
 
Chương 6. Ancol - phenol - ether (1).pdf
Chương 6. Ancol - phenol - ether (1).pdfChương 6. Ancol - phenol - ether (1).pdf
Chương 6. Ancol - phenol - ether (1).pdf
va2132004
 
Introduction to Value Added Tax System.ppt
Introduction to Value Added Tax System.pptIntroduction to Value Added Tax System.ppt
Introduction to Value Added Tax System.ppt
VishnuVenugopal84
 
when will pi network coin be available on crypto exchange.
when will pi network coin be available on crypto exchange.when will pi network coin be available on crypto exchange.
when will pi network coin be available on crypto exchange.
DOT TECH
 
Which Crypto to Buy Today for Short-Term in May-June 2024.pdf
Which Crypto to Buy Today for Short-Term in May-June 2024.pdfWhich Crypto to Buy Today for Short-Term in May-June 2024.pdf
Which Crypto to Buy Today for Short-Term in May-June 2024.pdf
Kezex (KZX)
 
The WhatsPump Pseudonym Problem and the Hilarious Downfall of Artificial Enga...
The WhatsPump Pseudonym Problem and the Hilarious Downfall of Artificial Enga...The WhatsPump Pseudonym Problem and the Hilarious Downfall of Artificial Enga...
The WhatsPump Pseudonym Problem and the Hilarious Downfall of Artificial Enga...
muslimdavidovich670
 
The Evolution of Non-Banking Financial Companies (NBFCs) in India: Challenges...
The Evolution of Non-Banking Financial Companies (NBFCs) in India: Challenges...The Evolution of Non-Banking Financial Companies (NBFCs) in India: Challenges...
The Evolution of Non-Banking Financial Companies (NBFCs) in India: Challenges...
beulahfernandes8
 
how to sell pi coins at high rate quickly.
how to sell pi coins at high rate quickly.how to sell pi coins at high rate quickly.
how to sell pi coins at high rate quickly.
DOT TECH
 
一比一原版BCU毕业证伯明翰城市大学毕业证成绩单如何办理
一比一原版BCU毕业证伯明翰城市大学毕业证成绩单如何办理一比一原版BCU毕业证伯明翰城市大学毕业证成绩单如何办理
一比一原版BCU毕业证伯明翰城市大学毕业证成绩单如何办理
ydubwyt
 

Recently uploaded (20)

USDA Loans in California: A Comprehensive Overview.pptx
USDA Loans in California: A Comprehensive Overview.pptxUSDA Loans in California: A Comprehensive Overview.pptx
USDA Loans in California: A Comprehensive Overview.pptx
 
Commercial Bank Economic Capsule - May 2024
Commercial Bank Economic Capsule - May 2024Commercial Bank Economic Capsule - May 2024
Commercial Bank Economic Capsule - May 2024
 
Scope Of Macroeconomics introduction and basic theories
Scope Of Macroeconomics introduction and basic theoriesScope Of Macroeconomics introduction and basic theories
Scope Of Macroeconomics introduction and basic theories
 
Summary of financial results for 1Q2024
Summary of financial  results for 1Q2024Summary of financial  results for 1Q2024
Summary of financial results for 1Q2024
 
This assessment plan proposal is to outline a structured approach to evaluati...
This assessment plan proposal is to outline a structured approach to evaluati...This assessment plan proposal is to outline a structured approach to evaluati...
This assessment plan proposal is to outline a structured approach to evaluati...
 
managementaccountingunitiv-230422140105-dd17d80b.ppt
managementaccountingunitiv-230422140105-dd17d80b.pptmanagementaccountingunitiv-230422140105-dd17d80b.ppt
managementaccountingunitiv-230422140105-dd17d80b.ppt
 
Empowering the Unbanked: The Vital Role of NBFCs in Promoting Financial Inclu...
Empowering the Unbanked: The Vital Role of NBFCs in Promoting Financial Inclu...Empowering the Unbanked: The Vital Role of NBFCs in Promoting Financial Inclu...
Empowering the Unbanked: The Vital Role of NBFCs in Promoting Financial Inclu...
 
PF-Wagner's Theory of Public Expenditure.pptx
PF-Wagner's Theory of Public Expenditure.pptxPF-Wagner's Theory of Public Expenditure.pptx
PF-Wagner's Theory of Public Expenditure.pptx
 
how to sell pi coins on Bitmart crypto exchange
how to sell pi coins on Bitmart crypto exchangehow to sell pi coins on Bitmart crypto exchange
how to sell pi coins on Bitmart crypto exchange
 
Introduction to Indian Financial System ()
Introduction to Indian Financial System ()Introduction to Indian Financial System ()
Introduction to Indian Financial System ()
 
What website can I sell pi coins securely.
What website can I sell pi coins securely.What website can I sell pi coins securely.
What website can I sell pi coins securely.
 
Financial Assets: Debit vs Equity Securities.pptx
Financial Assets: Debit vs Equity Securities.pptxFinancial Assets: Debit vs Equity Securities.pptx
Financial Assets: Debit vs Equity Securities.pptx
 
Chương 6. Ancol - phenol - ether (1).pdf
Chương 6. Ancol - phenol - ether (1).pdfChương 6. Ancol - phenol - ether (1).pdf
Chương 6. Ancol - phenol - ether (1).pdf
 
Introduction to Value Added Tax System.ppt
Introduction to Value Added Tax System.pptIntroduction to Value Added Tax System.ppt
Introduction to Value Added Tax System.ppt
 
when will pi network coin be available on crypto exchange.
when will pi network coin be available on crypto exchange.when will pi network coin be available on crypto exchange.
when will pi network coin be available on crypto exchange.
 
Which Crypto to Buy Today for Short-Term in May-June 2024.pdf
Which Crypto to Buy Today for Short-Term in May-June 2024.pdfWhich Crypto to Buy Today for Short-Term in May-June 2024.pdf
Which Crypto to Buy Today for Short-Term in May-June 2024.pdf
 
The WhatsPump Pseudonym Problem and the Hilarious Downfall of Artificial Enga...
The WhatsPump Pseudonym Problem and the Hilarious Downfall of Artificial Enga...The WhatsPump Pseudonym Problem and the Hilarious Downfall of Artificial Enga...
The WhatsPump Pseudonym Problem and the Hilarious Downfall of Artificial Enga...
 
The Evolution of Non-Banking Financial Companies (NBFCs) in India: Challenges...
The Evolution of Non-Banking Financial Companies (NBFCs) in India: Challenges...The Evolution of Non-Banking Financial Companies (NBFCs) in India: Challenges...
The Evolution of Non-Banking Financial Companies (NBFCs) in India: Challenges...
 
how to sell pi coins at high rate quickly.
how to sell pi coins at high rate quickly.how to sell pi coins at high rate quickly.
how to sell pi coins at high rate quickly.
 
一比一原版BCU毕业证伯明翰城市大学毕业证成绩单如何办理
一比一原版BCU毕业证伯明翰城市大学毕业证成绩单如何办理一比一原版BCU毕业证伯明翰城市大学毕业证成绩单如何办理
一比一原版BCU毕业证伯明翰城市大学毕业证成绩单如何办理
 

unisys 2Q07_SPR

  • 1. UNISYS CORPORATION CONSOLIDATED STATEMENTS OF INCOME (Millions, except per share data) Three Months Six Months Ended June 30 Ended June 30 ------------------ ------------------ 2007 2006 2007 2006 -------- -------- -------- -------- Revenue Services $1,208.6 $1,224.5 $2,361.5 $2,400.9 Technology 167.1 182.8 362.2 394.2 -------- -------- -------- -------- 1,375.7 1,407.3 2,723.7 2,795.1 Costs and expenses Cost of revenue: Services 992.2 1,136.3 1,986.1 2,212.8 Technology 84.1 108.1 180.8 217.5 -------- -------- -------- -------- 1,076.3 1,244.4 2,166.9 2,430.3 Selling, general and administrative 247.4 282.7 492.0 578.1 Research and development 49.5 63.9 91.9 139.2 -------- -------- -------- -------- 1,373.2 1,591.0 2,750.8 3,147.6 -------- -------- -------- -------- Operating profit (loss) 2.5 (183.7) (27.1) (352.5) Interest expense 18.7 19.1 37.6 38.9 Other income (expense), net (8.7) (0.7) 16.8 152.7 -------- -------- -------- -------- Loss before income taxes (24.9) (203.5) (47.9) (238.7) Provision (benefit) for income taxes 40.6 (8.9) 14.0 (16.2) -------- -------- -------- -------- Net loss ($65.5) ($194.6) ($61.9) ($222.5) ======== ======== ======== ======== Loss per share Basic ($ .19) ($ .57) ($ .18) ($ .65) ======== ======== ======== ======== Diluted ($ .19) ($ .57) ($ .18) ($ .65) ======== ======== ======== ======== Shares used in the per share computations (thousands): Basic 348,958 343,414 347,690 342,936 ======== ======== ======== ======== Diluted 348,958 343,414 347,690 342,936 ======== ======== ======== ========
  • 2. UNISYS CORPORATION SEGMENT RESULTS (Millions) Elimi- Total nations Services* Technology* -------- -------- -------- ---------- Three Months Ended June 30, 2007 ------------------ Customer revenue $1,375.7 $1,208.6 $167.1 Intersegment ($47.4) 3.6 43.8 -------- -------- -------- -------- Total revenue $1,375.7 ($47.4) $1,212.2 $210.9 ======== ======== ======== ======== Gross profit percent 21.8% 17.3% 43.3% ======== ======== ======== Operating profit (loss) percent 0.2% 2.5% (0.6%) ======== ======== ======== Three Months Ended June 30, 2006 ------------------ Customer revenue $1,407.3 $1,224.5 $182.8 Intersegment ($53.2) 3.8 49.4 -------- -------- -------- -------- Total revenue $1,407.3 ($53.2) $1,228.3 $232.2 ======== ======== ======== ======== Gross profit percent 11.6% 14.3% 37.6% ======== ======== ======== Operating loss percent (13.1%) (0.9%) (12.2%) ======== ======== ======== Six Months Ended June 30, 2007 ------------------ Customer revenue $2,723.7 $2,361.5 $362.2 Intersegment ($87.5) 7.5 80.0 -------- -------- -------- -------- Total revenue $2,723.7 ($87.5) $2,369.0 $442.2 ======== ======== ======== ======== Gross profit percent 20.4% 16.2% 43.3% ======== ======== ======== Operating profit (loss) percent (1.0%) 0.8% 1.5% ======== ======== ======== Six Months Ended June 30, 2006 ------------------ Customer revenue $2,795.1 $2,400.9 $394.2 Intersegment ($95.8) 7.2 88.6 -------- -------- -------- -------- Total revenue $2,795.1 ($95.8) $2,408.1 $482.8 ======== ======== ======== ======== Gross profit percent 13.1% 14.7% 39.8% ======== ======== ======== Operating loss percent (12.6%) (0.9%) (8.7%) ======== ======== ======== * Results exclude cost reduction actions
  • 3. UNISYS CORPORATION CONSOLIDATED BALANCE SHEETS (Millions) June 30, December 31, 2007 2006 ---------- ---------- Assets Current assets Cash and cash equivalents $520.7 $719.3 Accounts and notes receivable, net 1,045.2 1,164.6 Inventories Parts and finished equipment 101.2 95.0 Work in process and materials 86.5 81.2 Deferred income taxes 30.0 30.0 Prepaid expense and other current assets 173.1 148.4 ---------- ---------- Total 1,956.7 2,238.5 ---------- ---------- Properties 1,294.7 1,233.4 Less accumulated depreciation and amortization 943.8 892.1 ---------- ---------- Properties, net 350.9 341.3 ---------- ---------- Outsourcing assets, net 419.2 401.1 Marketable software, net 286.8 304.3 Prepaid postretirement assets 308.8 250.1 Deferred income taxes 191.3 191.3 Goodwill 196.8 193.9 Other long-term assets 121.8 117.4 ---------- ---------- Total $3,832.3 $4,037.9 ========== ========== Liabilities and stockholders' equity (deficit) Current liabilities Notes payable $0.6 $1.2 Current maturities of long-term debt 200.3 0.5 Accounts payable 373.3 460.9 Other accrued liabilities 1,342.1 1,469.1 ---------- ---------- Total 1,916.3 1,931.7 ---------- ---------- Long-term debt 849.3 1,049.1 Long-term postretirement liabilities 642.7 667.7 Other long-term liabilities 426.2 453.6 Stockholders' equity (deficit) Common stock 3.5 3.5 Accumulated deficit (2,448.7) (2,386.8) Other capital 3,984.2 3,945.1 Accumulated other comprehensive loss (1,541.2) (1,626.0) ---------- ---------- Stockholders' deficit (2.2) (64.2) ---------- ---------- Total $3,832.3 $4,037.9 ========== ==========
  • 4. UNISYS CORPORATION CONSOLIDATED STATEMENTS OF CASH FLOWS (Millions) Six Months Ended June 30 ------------------- 2007 2006 ------- ------- Cash flows from operating activities Net loss ($61.9) ($222.5) Add (deduct) items to reconcile net loss to net cash used for operating activities: Equity loss 4.3 Employee stock compensation expense 5.5 3.2 Company stock issued for U.S. 401(k) plan 23.0 8.9 Depreciation and amortization of properties 56.9 58.5 Depreciation and amortization of outsourcing assets 70.6 66.7 Amortization of marketable software 62.1 66.2 Gain on sale of assets (23.1) (153.2) Increase in deferred income taxes, net (41.9) Decrease in receivables, net 136.0 66.7 (Increase) decrease in inventories (9.0) 10.2 (Decrease) increase in accounts payable and other accrued liabilities (250.5) 8.0 Decrease in other liabilities (50.9) (44.5) (Increase) decrease in other assets (39.9) 1.2 Other .1 2.2 ------- ------- Net cash used for operating activities (81.1) (166.0) ------- ------- Cash flows from investing activities Proceeds from investments 3,942.4 3,729.3 Purchases of investments (3,941.0) (3,731.3) Investment in marketable software (48.9) (55.3) Capital additions of properties (39.8) (32.7) Capital additions of outsourcing assets (78.5) (50.1) Purchases of businesses (1.6) Proceeds from sale of assets 27.7 380.6 ------- ------- Net cash (used for) provided by investing activities (139.7) 240.5 ------- ------- Cash flows from financing activities Net reduction in short-term borrowings (.6) (7.4) Proceeds from exercise of stock options 11.3 .9 Payments of long-term debt (57.9) Cost of credit agreement (4.6) ------- ------- Net cash provided by (used for) financing activities 10.7 (69.0) ------- ------- Effect of exchange rate changes on cash and cash equivalents 11.5 7.1 ------- ------- (Decrease) increase in cash and cash equivalents (198.6) 12.6 Cash and cash equivalents, beginning of period 719.3 642.5 ------- ------- Cash and cash equivalents, end of period $520.7 $655.1 ======= =======