Download to read offline
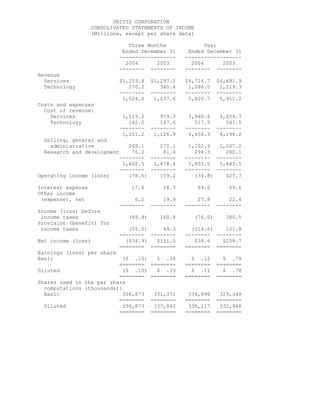

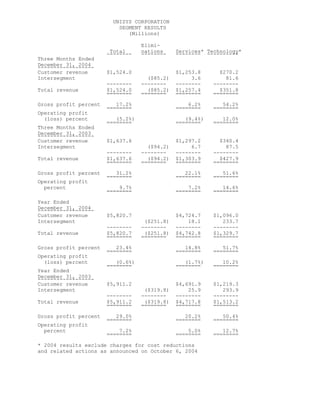
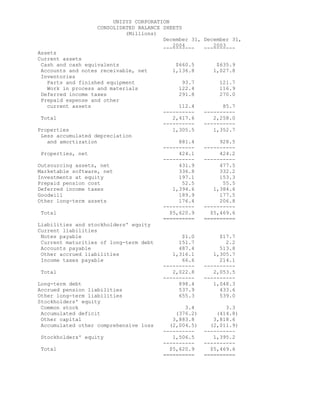
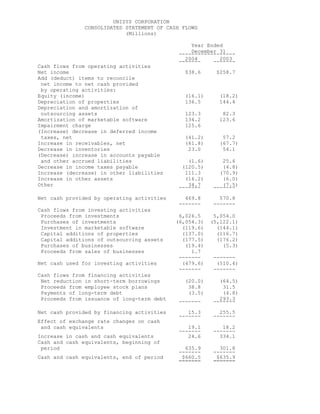
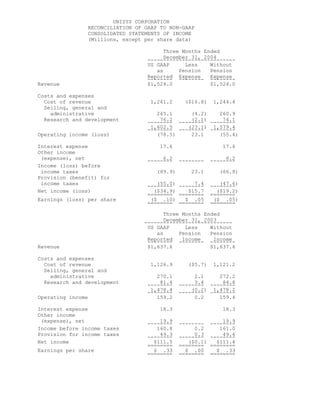

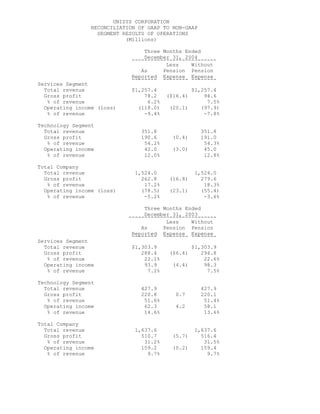
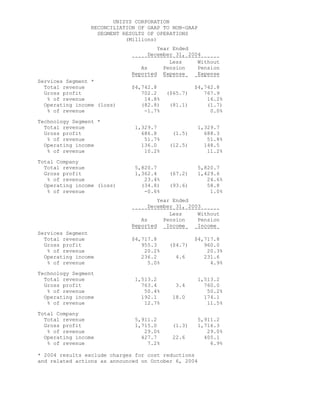
- Unisys Corporation reported revenue of $1.524 billion for Q4 2004, down from $1.637 billion in Q4 2003, and revenue of $5.821 billion for 2004, down from $5.911 billion in 2003. - Net income was $34.9 million loss for Q4 2004 compared to net income of $111.5 million in Q4 2003, and net income was $38.6 million for 2004 compared to $258.7 million in 2003. - Cash and cash equivalents increased to $660.5 million at the end of 2004 from $635.9 million at the end of 2003.


