Epsilon Energy Ltd. Announces 2012 Second Quarter ResultsRad Arnold
Epsilon Energy Ltd. Announces 2012 Second Quarter Results
http://at.marketwire.com/accesstracking/AccessTrackingLogServlet?docid=0810503001&sourceType=1http://www.ccnmatthews.com/logos/20071024-main_epsilon.jpg
CONCORD, ONTARIO -- (Marketwire) -- 08/07/12 -- Epsilon Energy Ltd. ("Epsilon") (TSX:EPS) is pleased to announce its second quarter 2012 results. Interim Unaudited Condensed Consolidated Financial Statements and Management Discussion and Analysis for the three and six months ended June 30, 2012 and 2011 are available on Sedar at www.sedar.com or on Epsilon's website at www.epsilonenergyltd.com.
Even tho Pi network is not listed on any exchange yet.
Buying/Selling or investing in pi network coins is highly possible through the help of vendors. You can buy from vendors[ buy directly from the pi network miners and resell it]. I will leave the telegram contact of my personal vendor.
@Pi_vendor_247
If you are looking for a pi coin investor. Then look no further because I have the right one he is a pi vendor (he buy and resell to whales in China). I met him on a crypto conference and ever since I and my friends have sold more than 10k pi coins to him And he bought all and still want more. I will drop his telegram handle below just send him a message.
@Pi_vendor_247
BYD SWOT Analysis and In-Depth Insights 2024.pptxmikemetalprod
Indepth analysis of the BYD 2024
BYD (Build Your Dreams) is a Chinese automaker and battery manufacturer that has snowballed over the past two decades to become a significant player in electric vehicles and global clean energy technology.
This SWOT analysis examines BYD's strengths, weaknesses, opportunities, and threats as it competes in the fast-changing automotive and energy storage industries.
Founded in 1995 and headquartered in Shenzhen, BYD started as a battery company before expanding into automobiles in the early 2000s.
Initially manufacturing gasoline-powered vehicles, BYD focused on plug-in hybrid and fully electric vehicles, leveraging its expertise in battery technology.
Today, BYD is the world’s largest electric vehicle manufacturer, delivering over 1.2 million electric cars globally. The company also produces electric buses, trucks, forklifts, and rail transit.
On the energy side, BYD is a major supplier of rechargeable batteries for cell phones, laptops, electric vehicles, and energy storage systems.
US Economic Outlook - Being Decided - M Capital Group August 2021.pdfpchutichetpong
The U.S. economy is continuing its impressive recovery from the COVID-19 pandemic and not slowing down despite re-occurring bumps. The U.S. savings rate reached its highest ever recorded level at 34% in April 2020 and Americans seem ready to spend. The sectors that had been hurt the most by the pandemic specifically reduced consumer spending, like retail, leisure, hospitality, and travel, are now experiencing massive growth in revenue and job openings.
Could this growth lead to a “Roaring Twenties”? As quickly as the U.S. economy contracted, experiencing a 9.1% drop in economic output relative to the business cycle in Q2 2020, the largest in recorded history, it has rebounded beyond expectations. This surprising growth seems to be fueled by the U.S. government’s aggressive fiscal and monetary policies, and an increase in consumer spending as mobility restrictions are lifted. Unemployment rates between June 2020 and June 2021 decreased by 5.2%, while the demand for labor is increasing, coupled with increasing wages to incentivize Americans to rejoin the labor force. Schools and businesses are expected to fully reopen soon. In parallel, vaccination rates across the country and the world continue to rise, with full vaccination rates of 50% and 14.8% respectively.
However, it is not completely smooth sailing from here. According to M Capital Group, the main risks that threaten the continued growth of the U.S. economy are inflation, unsettled trade relations, and another wave of Covid-19 mutations that could shut down the world again. Have we learned from the past year of COVID-19 and adapted our economy accordingly?
“In order for the U.S. economy to continue growing, whether there is another wave or not, the U.S. needs to focus on diversifying supply chains, supporting business investment, and maintaining consumer spending,” says Grace Feeley, a research analyst at M Capital Group.
While the economic indicators are positive, the risks are coming closer to manifesting and threatening such growth. The new variants spreading throughout the world, Delta, Lambda, and Gamma, are vaccine-resistant and muddy the predictions made about the economy and health of the country. These variants bring back the feeling of uncertainty that has wreaked havoc not only on the stock market but the mindset of people around the world. MCG provides unique insight on how to mitigate these risks to possibly ensure a bright economic future.
The secret way to sell pi coins effortlessly.DOT TECH
Well as we all know pi isn't launched yet. But you can still sell your pi coins effortlessly because some whales in China are interested in holding massive pi coins. And they are willing to pay good money for it. If you are interested in selling I will leave a contact for you. Just telegram this number below. I sold about 3000 pi coins to him and he paid me immediately.
Telegram: @Pi_vendor_247
how to sell pi coins on Bitmart crypto exchangeDOT TECH
Yes. Pi network coins can be exchanged but not on bitmart exchange. Because pi network is still in the enclosed mainnet. The only way pioneers are able to trade pi coins is by reselling the pi coins to pi verified merchants.
A verified merchant is someone who buys pi network coins and resell it to exchanges looking forward to hold till mainnet launch.
I will leave the telegram contact of my personal pi merchant to trade with.
@Pi_vendor_247
What price will pi network be listed on exchangesDOT TECH
The rate at which pi will be listed is practically unknown. But due to speculations surrounding it the predicted rate is tends to be from 30$ — 50$.
So if you are interested in selling your pi network coins at a high rate tho. Or you can't wait till the mainnet launch in 2026. You can easily trade your pi coins with a merchant.
A merchant is someone who buys pi coins from miners and resell them to Investors looking forward to hold massive quantities till mainnet launch.
I will leave the telegram contact of my personal pi vendor to trade with.
@Pi_vendor_247
The Evolution of Non-Banking Financial Companies (NBFCs) in India: Challenges...beulahfernandes8
Role in Financial System
NBFCs are critical in bridging the financial inclusion gap.
They provide specialized financial services that cater to segments often neglected by traditional banks.
Economic Impact
NBFCs contribute significantly to India's GDP.
They support sectors like micro, small, and medium enterprises (MSMEs), housing finance, and personal loans.
Falcon stands out as a top-tier P2P Invoice Discounting platform in India, bridging esteemed blue-chip companies and eager investors. Our goal is to transform the investment landscape in India by establishing a comprehensive destination for borrowers and investors with diverse profiles and needs, all while minimizing risk. What sets Falcon apart is the elimination of intermediaries such as commercial banks and depository institutions, allowing investors to enjoy higher yields.
how can i use my minded pi coins I need some funds.DOT TECH
If you are interested in selling your pi coins, i have a verified pi merchant, who buys pi coins and resell them to exchanges looking forward to hold till mainnet launch.
Because the core team has announced that pi network will not be doing any pre-sale. The only way exchanges like huobi, bitmart and hotbit can get pi is by buying from miners.
Now a merchant stands in between these exchanges and the miners. As a link to make transactions smooth. Because right now in the enclosed mainnet you can't sell pi coins your self. You need the help of a merchant,
i will leave the telegram contact of my personal pi merchant below. 👇 I and my friends has traded more than 3000pi coins with him successfully.
@Pi_vendor_247
how can I sell pi coins after successfully completing KYCDOT TECH
Pi coins is not launched yet in any exchange 💱 this means it's not swappable, the current pi displaying on coin market cap is the iou version of pi. And you can learn all about that on my previous post.
RIGHT NOW THE ONLY WAY you can sell pi coins is through verified pi merchants. A pi merchant is someone who buys pi coins and resell them to exchanges and crypto whales. Looking forward to hold massive quantities of pi coins before the mainnet launch.
This is because pi network is not doing any pre-sale or ico offerings, the only way to get my coins is from buying from miners. So a merchant facilitates the transactions between the miners and these exchanges holding pi.
I and my friends has sold more than 6000 pi coins successfully with this method. I will be happy to share the contact of my personal pi merchant. The one i trade with, if you have your own merchant you can trade with them. For those who are new.
Message: @Pi_vendor_247 on telegram.
I wouldn't advise you selling all percentage of the pi coins. Leave at least a before so its a win win during open mainnet. Have a nice day pioneers ♥️
#kyc #mainnet #picoins #pi #sellpi #piwallet
#pinetwork
Introduction to Indian Financial System ()Avanish Goel
The financial system of a country is an important tool for economic development of the country, as it helps in creation of wealth by linking savings with investments.
It facilitates the flow of funds form the households (savers) to business firms (investors) to aid in wealth creation and development of both the parties
The European Unemployment Puzzle: implications from population agingGRAPE
We study the link between the evolving age structure of the working population and unemployment. We build a large new Keynesian OLG model with a realistic age structure, labor market frictions, sticky prices, and aggregate shocks. Once calibrated to the European economy, we quantify the extent to which demographic changes over the last three decades have contributed to the decline of the unemployment rate. Our findings yield important implications for the future evolution of unemployment given the anticipated further aging of the working population in Europe. We also quantify the implications for optimal monetary policy: lowering inflation volatility becomes less costly in terms of GDP and unemployment volatility, which hints that optimal monetary policy may be more hawkish in an aging society. Finally, our results also propose a partial reversal of the European-US unemployment puzzle due to the fact that the share of young workers is expected to remain robust in the US.
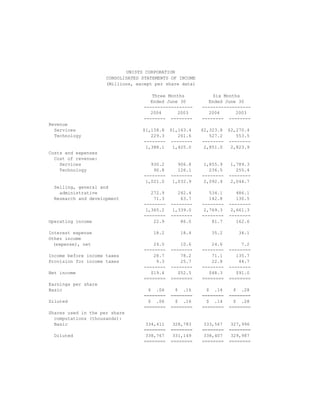
3. UNISYS CORPORATION
CONSOLIDATED BALANCE SHEETS
(Millions)
June 30, December 31,
2004 2003
---------- ----------
Assets
Current assets
Cash and cash equivalents $643.4 $635.9
Accounts and notes receivable, net 885.2 1,027.8
Inventories
Parts and finished equipment 112.7 121.7
Work in process and materials 120.0 116.9
Deferred income taxes 272.4 270.0
Other current assets 106.4 85.7
---------- ----------
Total 2,140.1 2,258.0
---------- ----------
Properties 1,347.4 1,352.7
Less accumulated depreciation
and amortization 924.8 928.5
---------- ----------
Properties, net 422.6 424.2
---------- ----------
Outsourcing assets, net 529.9 477.5
Marketable software, net 329.8 332.2
Investments at equity 183.3 153.3
Prepaid pension cost 49.6 55.5
Deferred income taxes 1,385.7 1,384.6
Goodwill 186.6 177.5
Other long-term assets 189.3 211.8
---------- ----------
Total $5,416.9 $5,474.6
========== ==========
Liabilities and stockholders' equity
Current liabilities
Notes payable $10.4 $17.7
Current maturities of long-term debt 150.7 2.2
Accounts payable 429.8 513.8
Other accrued liabilities 1,240.0 1,305.7
Income taxes payable 192.2 214.1
---------- ----------
Total 2,023.1 2,053.5
---------- ----------
Long-term debt 901.8 1,048.3
Accrued pension liabilities 460.1 433.6
Other long-term liabilities 539.1 544.0
Stockholders' equity
Common stock 3.4 3.3
Accumulated deficit (366.4) (414.8)
Other capital 3,856.9 3,818.6
Accumulated other comprehensive loss (2,001.1) (2,011.9)
---------- ----------
Stockholders' equity 1,492.8 1,395.2
---------- ----------
Total $5,416.9 $5,474.6
========== ==========
4. UNISYS CORPORATION
CONSOLIDATED STATEMENTS OF CASH FLOWS
(Millions)
Six Months Ended
June 30
-----------------
2004 2003
---- ----
Cash flows from operating activities
Net income $48.3 $91.0
Add (deduct) items to reconcile
net income to net cash provided
by operating activities:
Depreciation and amortization
of properties and outsourcing assets 123.1 105.4
Amortization of marketable software 62.9 59.9
(Increase) in deferred income
taxes, net (2.4) (1.5)
Decrease (increase) in receivables, net 185.3 (6.6)
Decrease in inventories 6.4 19.5
(Decrease) in accounts payable and
other accrued liabilities (172.2) (177.5)
(Decrease) increase in income
taxes payable (21.9) 17.5
Increase (decrease) in other liabilities 3.5 (14.8)
(Increase) in other assets (27.8) (39.1)
Other 8.8 (5.6)
------- -------
Net cash provided by operating activities 214.0 48.2
------- -------
Cash flows from investing activities
Proceeds from investments 2,878.8 2,387.5
Purchases of investments (2,879.0) (2,421.7)
Investment in marketable software (60.5) (76.9)
Capital additions of properties
and outsourcing assets (143.5) (112.0)
Purchases of businesses (12.6) (2.0)
------- -------
Net cash used for investing activities (216.8) (225.1)
------- -------
Cash flows from financing activities
Net reduction in short-term borrowings (10.6) (59.6)
Proceeds from employee stock plans 24.0 13.9
Payments of long-term debt (1.7) (3.0)
Proceeds from issuance of long-term debt 293.3
------- -------
Net cash provided by financing activities 11.7 244.6
------- -------
Effect of exchange rate changes on cash
and cash equivalents (1.4) 12.3
------- -------
Increase in cash and cash equivalents 7.5 80.0
Cash and cash equivalents, beginning of
period 635.9 301.8
------- -------
Cash and cash equivalents, end of period $643.4 $381.8
======= =======
5. Reconciliation of GAAP to Non-GAAP
Financial Information
The preceding release presents information with and
without pension expense or income. Unisys believes
that this information will enhance an overall
understanding of its financial performance due to the
significant change in pension expense or income from
period to period and the non-operational nature of
pension expense or income. The presentation of
non-GAAP information is not meant to be considered in
isolation or as a substitute for results prepared in
accordance with accounting principles generally
accepted in the United States.
6. UNISYS CORPORATION
RECONCILIATION OF GAAP TO NON-GAAP
CONSOLIDATED STATEMENTS OF INCOME
(Millions, except per share data)
Three Months Ended
June 30, 2004
----------------------------
US GAAP Less Without
as Pension Pension
Reported Expense Expense
-------- -------- --------
Revenue $1,388.1 $1,388.1
Costs and expenses
Cost of revenue 1,021.0 ($17.8) 1,003.2
Selling, general and
administrative 272.9 (4.8) 268.1
Research and development 71.3 (2.2) 69.1
-------- -------- --------
1,365.2 (24.8) 1,340.4
-------- -------- --------
Operating income 22.9 24.8 47.7
Interest expense 18.2 18.2
Other income
(expense), net 24.0 24.0
-------- -------- --------
Income before income taxes 28.7 24.8 53.5
Provision for income taxes 9.3 7.9 17.2
-------- -------- --------
Net income $19.4 $16.9 $36.3
======== ======== ========
Diluted earnings per share $ .06 $ .05 $ .11
======== ======== ========
Three Months Ended
June 30, 2003
----------------------------
US GAAP Less Without
as Pension Pension
Reported Income Income
-------- -------- --------
Revenue $1,425.0 $1,425.0
Costs and expenses
Cost of revenue 1,032.9 $1.5 1,034.4
Selling, general and
administrative 242.4 2.4 244.8
Research and development 63.7 4.0 67.7
-------- -------- --------
1,339.0 7.9 1,346.9
-------- -------- --------
Operating income 86.0 (7.9) 78.1
Interest expense 18.4 18.4
Other income
(expense), net 10.6 10.6
-------- -------- --------
Income before income taxes 78.2 (7.9) 70.3
Provision for income taxes 25.7 (2.6) 23.1
-------- -------- --------
Net income $52.5 ($5.3) $47.2
======== ======== ========
Diluted earnings per share $ .16 ($ .02) $ .14
======== ======== ========
7. UNISYS CORPORATION
RECONCILIATION OF GAAP TO NON-GAAP
CONSOLIDATED STATEMENTS OF INCOME
(Millions, except per share data)
Six Months Ended
June 30, 2004
----------------------------
US GAAP Less Without
as Pension Pension
Reported Expense Expense
-------- -------- --------
Revenue $2,851.0 $2,851.0
Costs and expenses
Cost of revenue 2,092.4 ($33.3) 2,059.1
Selling, general and
administrative 534.1 (9.7) 524.4
Research and development 142.8 (4.0) 138.8
-------- -------- --------
2,769.3 (47.0) 2,722.3
-------- -------- --------
Operating income 81.7 47.0 128.7
Interest expense 35.2 35.2
Other income
(expense), net 24.6 24.6
-------- -------- --------
Income before income taxes 71.1 47.0 118.1
Provision for income taxes 22.8 15.0 37.8
-------- -------- --------
Net income $48.3 $32.0 $80.3
======== ======== ========
Diluted earnings per share $ .14 $ .10 $ .24
======== ======== ========
Six Months Ended
June 30, 2003
----------------------------
US GAAP Less Without
as Pension Pension
Reported Income Income
-------- -------- --------
Revenue $2,823.9 $2,823.9
Costs and expenses
Cost of revenue 2,044.7 $2.7 2,047.4
Selling, general and
administrative 486.1 4.4 490.5
Research and development 130.5 7.2 137.7
-------- -------- --------
2,661.3 14.3 2,675.6
-------- -------- --------
Operating income 162.6 (14.3) 148.3
Interest expense 34.1 34.1
Other income
(expense), net 7.2 7.2
-------- -------- --------
Income before income taxes 135.7 (14.3) 121.4
Provision for income taxes 44.7 (4.7) 40.0
-------- -------- --------
Net income $91.0 ($9.6) $81.4
======== ======== ========
Diluted earnings per share $ .28 ($ .03) $ .25
======== ======== ========
8. UNISYS CORPORATION
RECONCILIATION OF GAAP TO NON-GAAP
SEGMENT RESULTS OF OPERATIONS
(Millions)
Three Months Ended
June 30, 2004
----------------------------
Less Without
As Pension Pension
Reported Expense Expense
-------- -------- --------
Services Segment
Total revenue $1,163.3 $1,163.3
Gross profit 214.9 ($17.4) 232.3
% of revenue 18.5% 20.0%
Operating income 8.2 (21.1) 29.3
% of revenue 0.7% 2.5%
Technology Segment
Total revenue 282.1 282.1
Gross profit 150.4 (0.4) 150.8
% of revenue 53.3% 53.5%
Operating income 15.1 (3.7) 18.8
% of revenue 5.4% 6.7%
Total Company
Total revenue 1,388.1 1,388.1
Gross profit 367.1 (17.8) 384.9
% of revenue 26.4% 27.7%
Operating income 22.9 (24.8) 47.7
% of revenue 1.6% 3.4%
Three Months Ended
June 30, 2003
----------------------------
Less Without
As Pension Pension
Reported Income Income
-------- -------- --------
Services Segment
Total revenue $1,169.7 $1,169.7
Gross profit 234.5 $0.7 233.8
% of revenue 20.0% 20.0%
Operating income 64.1 3.2 60.9
% of revenue 5.5% 5.2%
Technology Segment
Total revenue 344.5 344.5
Gross profit 160.5 0.8 159.7
% of revenue 46.6% 46.4%
Operating income 26.8 4.7 22.1
% of revenue 7.8% 6.4%
Total Company
Total revenue 1,425.0 1,425.0
Gross profit 392.1 1.5 390.6
% of revenue 27.5% 27.4%
Operating income 86.0 7.9 78.1
% of revenue 6.0% 5.5%
9. UNISYS CORPORATION
RECONCILIATION OF GAAP TO NON-GAAP
SEGMENT RESULTS OF OPERATIONS
(Millions)
Six Months Ended
June 30, 2004
----------------------------
Less Without
As Pension Pension
Reported Expense Expense
-------- -------- --------
Services Segment
Total revenue $2,333.1 $2,333.1
Gross profit 437.8 ($32.6) 470.4
% of revenue 18.8% 20.2%
Operating income 37.4 (40.4) 77.8
% of revenue 1.6% 3.3%
Technology Segment
Total revenue 620.9 620.9
Gross profit 314.2 (0.7) 314.9
% of revenue 50.6% 50.7%
Operating income 44.3 (6.6) 50.9
% of revenue 7.1% 8.2%
Total Company
Total revenue 2,851.0 2,851.0
Gross profit 758.6 (33.3) 791.9
% of revenue 26.6% 27.8%
Operating income 81.7 (47.0) 128.7
% of revenue 2.9% 4.5%
Six Months Ended
June 30, 2003
----------------------------
Less Without
As Pension Pension
Reported Income Income
-------- -------- --------
Services Segment
Total revenue $2,282.3 $2,282.3
Gross profit 442.9 $0.7 442.2
% of revenue 19.4% 19.4%
Operating income 98.5 5.1 93.4
% of revenue 4.3% 4.1%
Technology Segment
Total revenue 700.8 700.8
Gross profit 338.6 2.0 336.6
% of revenue 48.3% 48.0%
Operating income 66.4 9.2 57.2
% of revenue 9.5% 8.2%
Total Company
Total revenue 2,823.9 2,823.9
Gross profit 779.2 2.7 776.5
% of revenue 27.6% 27.5%
Operating income 162.6 14.3 148.3
% of revenue 5.8% 5.3%
10. UNISYS CORPORATION
RECONCILATION OF GAAP TO NON-GAAP
FORWARD-LOOKING ESTIMATED DILUTED EARNINGS PER SHARE
Three
Months Year
Ending Ending
9/30/2004 12/31/2004
---------- ----------
Diluted earnings per share-
on a GAAP basis .03-.07 .49-.53
Add back estimated pension expense,
net of tax .05 .19
--------- ---------
Diluted earnings per share-
on a NON-GAAP basis
(excluding pension expense) .08-.12 .68-.72
========= =========
NOTE: See section in press release entitled
quot;Forward-Looking Statementsquot;.