SlideShare a Scribd company logo
UNISYS CORPORATION
                     CONSOLIDATED STATEMENTS OF INCOME
                     (Millions, except per share data)

                                       Three Months           Six Months
                                      Ended June 30         Ended June 30
                                   ------------------    ------------------
                                     2005       2004       2005       2004
                                   -------- --------     -------- --------
Revenue
  Services                        $1,236.0 $1,158.8      $2,343.7 $2,323.8
  Technology                         199.5    229.3         458.4    527.2
                                   -------- --------      -------- --------
                                   1,435.5  1,388.1       2,802.1  2,851.0
Costs and expenses
  Cost of revenue:
    Services                       1,063.4      930.2    2,044.8    1,855.9
    Technology                        94.7       90.8      219.6      236.5
                                   --------   --------   --------   --------
                                   1,158.1    1,021.0    2,264.4    2,092.4
  Selling, general and
    administrative                   267.4    272.9        529.0    534.1
  Research and development            66.6     71.3        131.5    142.8
                                   -------- --------     -------- --------
                                   1,492.1  1,365.2      2,924.9  2,769.3
                                   -------- --------     -------- --------
Operating income (loss)              (56.6)    22.9       (122.8)    81.7

Interest expense                      15.2       18.2       27.8       35.2
Other income
  (expense), net                      32.0       24.0       32.5       24.6
                                   --------   --------   --------   --------
Income (loss) before
  income taxes                       (39.8)      28.7     (118.1)      71.1
Provision (benefit) for
  income taxes                       (12.7)     9.3        (45.5)    22.8
                                   -------- --------     -------- --------
Net income (loss)                   ($27.1)   $19.4       ($72.6)   $48.3
                                   ======== ========     ======== ========
Earnings (loss) per share
Basic                              ($ .08)   $ .06       ($ .21)   $ .14
                                   ======== ========     ======== ========
Diluted                            ($ .08)   $ .06       ($ .21)   $ .14
                                   ======== ========     ======== ========
Shares used in the per share
  computations (thousands):
  Basic                            340,047    334,411    339,147    333,567
                                   ========   ========   ========   ========
 Diluted                           340,047    338,767    339,147    338,407
                                   ========   ========   ========   ========
UNISYS CORPORATION
                        SEGMENT RESULTS

                          (Millions)

                                   Elimi-
                        Total      nations     Services    Technology
                       --------    --------    --------     ----------
Three Months Ended
June 30, 2005
------------------
Customer revenue       $1,435.5                $1,236.0        $199.5
Intersegment                         ($75.7)        4.9          70.8
                        --------    --------    --------      --------
Total revenue          $1,435.5      ($75.7)   $1,240.9        $270.3
                        ========    ========    ========      ========

Gross profit percent      19.3%                  12.2%          44.6%
                        ========               ========       ========
Operating profit
  (loss) percent          (3.9%)                 (3.7%)         (4.8%)
                        ========               ========       ========
Three Months Ended
June 30, 2004
------------------
Customer revenue       $1,388.1                $1,158.8        $229.3
Intersegment                         ($57.3)        4.5          52.8
                        --------    --------    --------      --------
Total revenue          $1,388.1      ($57.3)   $1,163.3        $282.1
                        ========    ========    ========      ========

Gross profit percent      26.4%                  18.5%          53.3%
                        ========               ========       ========
Operating profit
  percent                  1.6%                   0.7%           5.4%
                        ========               ========       ========

Six Months Ended
June 30, 2005
------------------
Customer revenue       $2,802.1                $2,343.7        $458.4
Intersegment                        ($135.6)        9.7         125.9
                        --------    --------    --------      --------
Total revenue          $2,802.1     ($135.6)   $2,353.4        $584.3
                        ========    ========    ========      ========

Gross profit percent      19.2%                  11.6%          46.2%
                        ========               ========       ========
Operating profit
  (loss) percent          (4.4%)                 (5.2%)          1.1%
                        ========               ========       ========
Six Months Ended
June 30, 2004
------------------
Customer revenue       $2,851.0                $2,323.8        $527.2
Intersegment                        ($103.0)        9.3          93.7
                        --------    --------    --------      --------
Total revenue          $2,851.0     ($103.0)   $2,333.1        $620.9
                        ========    ========    ========      ========

Gross profit percent      26.6%                  18.8%          50.6%
                        ========               ========       ========
Operating profit
  percent                  2.9%                   1.6%           7.1%
                        ========               ========       ========
UNISYS CORPORATION
                     CONSOLIDATED BALANCE SHEETS
                              (Millions)
                                             June 30,      December 31,
                                               2005            2004
                                            ----------      ----------
Assets
Current assets
  Cash and cash equivalents                     $398.9         $660.5
  Accounts and notes receivable, net           1,073.1        1,136.8
  Inventories
     Parts and finished equipment                   87.6         93.7
     Work in process and materials                 118.1        122.4
  Deferred income taxes                            292.4        291.8
  Prepaid expense and other
    current assets                               153.9          112.4
                                            ----------     ----------
 Total                                         2,124.0        2,417.6
                                            ----------     ----------
Properties                                     1,331.7        1,305.5
  Less accumulated depreciation
    and amortization                             922.8          881.4
                                            ----------     ----------
 Properties, net                                 408.9          424.1
                                            ----------     ----------
Outsourcing assets, net                          432.2          431.9
Marketable software, net                         337.1          336.8
Investments at equity                            213.9          197.1
Prepaid pension cost                              45.3           52.5
Deferred income taxes                          1,394.6        1,394.6
Goodwill                                         188.8          189.9
Other long-term assets                           160.2          176.4
                                            ----------     ----------
 Total                                        $5,305.0       $5,620.9
                                            ==========     ==========
Liabilities and stockholders' equity
Current liabilities
  Notes payable                                   $1.4           $1.0
  Current maturities of long-term debt           400.5          151.7
  Accounts payable                               431.6          487.4
  Other accrued liabilities                    1,189.1        1,382.7
                                            ----------     ----------
 Total                                         2,022.6        2,022.8
                                            ----------     ----------
Long-term debt                                   499.4          898.4
Accrued pension liabilities                      610.6          537.9
Other long-term liabilities                      694.2          655.3
Stockholders' equity
  Common stock                                     3.4            3.4
  Accumulated deficit                           (448.8)        (376.2)
  Other capital                                3,907.0        3,883.8
  Accumulated other comprehensive loss        (1,983.4)      (2,004.5)
                                            ----------     ----------
 Stockholders' equity                          1,478.2        1,506.5
                                            ----------     ----------
 Total                                        $5,305.0       $5,620.9
                                            ==========     ==========
UNISYS CORPORATION
                 CONSOLIDATED STATEMENTS OF CASH FLOWS
                               (Millions)
                                                     Six Months Ended
                                                          June 30
                                                   -------------------
                                                     2005         2004
                                                   -------      -------
Cash flows from operating activities
Net income (loss)                                   ($72.6)        $48.3
Add (deduct) items to reconcile
  net income (loss) to net cash
  provided by operating activities:
Equity income                                         (11.6)       (14.3)
Depreciation and amortization of properties            61.8         68.9
Depreciation and amortization of
  outsourcing assets                                   65.6         59.0
Amortization of marketable software                    59.2         62.9
Increase in deferred income taxes, net                  (.6)        (2.4)
Decrease in receivables, net                           73.6        185.3
Decrease in inventories                                10.4          6.4
Decrease in accounts payable and
  other accrued liabilities                         (249.3)       (194.1)
Increase in other liabilities                         122.6          3.5
Increase in other assets                              (24.8)        (7.8)
Other                                                  56.4         21.6
                                                    -------       -------

Net cash provided by operating activities              90.7       237.3
                                                     -------     -------
Cash flows from investing activities
  Proceeds from investments                         3,709.4     2,878.8
  Purchases of investments                         (3,698.8)   (2,879.0)
  Investment in marketable software                   (63.3)      (60.5)
  Capital additions of properties                     (59.4)      (74.5)
  Capital additions of outsourcing assets             (86.3)      (92.3)
  Purchases of businesses                               (.5)      (12.6)
                                                     -------     -------
Net cash used for investing activities               (198.9)     (240.1)
                                                     -------     -------
Cash flows from financing activities
  Net proceeds from (reduction in)
    short-term borrowings                                .5       (10.6)
  Proceeds from employee stock plans                   12.8        24.0
  Payments of long-term debt                         (150.7)       (1.7)
                                                     -------     -------
Net cash (used for) provided by
  financing activities                               (137.4)       11.7
                                                     -------     -------
Effect of exchange rate changes on cash
  and cash equivalents                                (16.0)       (1.4)
                                                     -------     -------
(Decrease) increase in cash and cash
  equivalents                                        (261.6)        7.5
Cash and cash equivalents, beginning of
  period                                              660.5       635.9
                                                     -------     -------
Cash and cash equivalents, end of period             $398.9      $643.4
                                                     =======     =======
Reconciliation of GAAP to Non-GAAP
Financial Information

The preceding release presents information with and
without pension expense. Unisys believes that this
information will enhance an overall understanding
of its financial performance due to the significant
change in pension expense from period to period
and the non-operational nature of pension expense.
The presentation of non-GAAP information is not
meant to be considered in isolation or as a substitute
for results prepared in accordance with accounting
principles generally accepted in the United States.
UNISYS CORPORATION
              RECONCILIATION OF GAAP TO NON-GAAP
              CONSOLIDATED STATEMENTS OF INCOME
              (Millions, except per share data)

                                      Three Months Ended
                                         June 30, 2005
                                 ----------------------------
                                  US GAAP     Less     Without
                                     as     Pension    Pension
                                  Reported Expense     Expense
                                 -------- -------- --------
Revenue                          $1,435.5            $1,435.5

Costs and expenses
  Cost of revenue                 1,158.1     ($32.0)   1,126.1
  Selling, general and
    administrative                  267.4     (8.9)   258.5
  Research and development           66.6     (4.9)    61.7
                                 -------- -------- --------
                                  1,492.1    (45.8) 1,446.3
                                 -------- -------- --------
Operating income (loss)             (56.6)    45.8    (10.8)

Interest expense                     15.2                  15.2
Other income
  (expense), net                     32.0                   32.0
                                 --------    --------   --------
Income (loss) before
  income taxes                      (39.8)      45.8        6.0
Provision (benefit) for
  income taxes                      (12.7)    14.6           1.9
                                 -------- --------      --------
Net income (loss)                  ($27.1)   $31.2          $4.1
                                 ======== ========      ========
Earnings (loss) per share         ($ .08)   $ .09         $ .01
                                 ======== ========      ========

                                      Three Months Ended
                                         June 30, 2004
                                 ----------------------------
                                  US GAAP     Less     Without
                                     as     Pension    Pension
                                  Reported Expense     Expense
                                 -------- -------- --------
Revenue                          $1,388.1            $1,388.1

Costs and expenses
  Cost of revenue                 1,021.0     ($17.8)   1,003.2
  Selling, general and
    administrative                  272.9        (4.8)   268.1
  Research and development           71.3        (2.2)    69.1
                                 --------    -------- --------
                                  1,365.2       (24.8) 1,340.4
                                 --------    -------- --------
Operating income                     22.9        24.8     47.7

Interest expense                     18.2                  18.2
Other income
  (expense), net                     24.0                   24.0
                                 --------    --------   --------
Income before income taxes           28.7        24.8       53.5
Provision for income taxes            9.3         7.9       17.2
                                 --------    --------   --------
Net income                          $19.4       $16.9      $36.3
                                 ========    ========   ========
Earnings per share                 $ .06       $ .05      $ .11
                                 ========    ========   ========
UNISYS CORPORATION
              RECONCILIATION OF GAAP TO NON-GAAP
              CONSOLIDATED STATEMENTS OF INCOME
              (Millions, except per share data)

                                        Six Months Ended
                                         June 30, 2005
                                 ----------------------------
                                  US GAAP     Less     Without
                                     as      Pension   Pension
                                  Reported Expense     Expense
                                 -------- -------- --------
Revenue                          $2,802.1            $2,802.1

Costs and expenses
  Cost of revenue                 2,264.4     ($64.8)   2,199.6
  Selling, general and
    administrative                  529.0    (18.0)   511.0
  Research and development          131.5     (9.8)   121.7
                                 -------- -------- --------
                                  2,924.9    (92.6) 2,832.3
                                 -------- -------- --------
Operating income (loss)            (122.8)    92.6    (30.2)

Interest expense                     27.8                  27.8
Other income
  (expense), net                     32.5                   32.5
                                 --------    --------   --------
Income (loss) before
  income taxes                     (118.1)      92.6      (25.5)
Provision (benefit) for
  income taxes                      (45.5)    29.6         (15.9)
                                 -------- --------      --------
Net income (loss)                  ($72.6)   $63.0         ($9.6)
                                 ======== ========      ========
Earnings (loss) per share         ($ .21)   $ .18        ($ .03)
                                 ======== ========      ========

                                        Six Months Ended
                                         June 30, 2004
                                 ----------------------------
                                  US GAAP     Less     Without
                                     as      Pension   Pension
                                  Reported Expense     Expense
                                 -------- -------- --------
Revenue                          $2,851.0            $2,851.0

Costs and expenses
  Cost of revenue                 2,092.4     ($33.3)   2,059.1
  Selling, general and
    administrative                  534.1        (9.7)   524.4
  Research and development          142.8        (4.0)   138.8
                                 --------    -------- --------
                                  2,769.3       (47.0) 2,722.3
                                 --------    -------- --------
Operating income                     81.7        47.0    128.7

Interest expense                     35.2                  35.2
Other income
  (expense), net                     24.6                   24.6
                                 --------    --------   --------
Income before income taxes           71.1        47.0      118.1
Provision for income taxes           22.8        15.0       37.8
                                 --------    --------   --------
Net income                          $48.3       $32.0      $80.3
                                 ========    ========   ========
Earnings per share                 $ .14       $ .10      $ .24
                                 ========    ========   ========
UNISYS CORPORATION
            RECONCILIATION OF GAAP TO NON-GAAP
               SEGMENT RESULTS OF OPERATIONS
                         (Millions)

                                   Three Months Ended
                                      June 30, 2005
                              ----------------------------
                                           Less     Without
                                  As     Pension    Pension
                               Reported Expense     Expense
                              -------- -------- --------
Services Segment
   Total revenue             $1,240.9             $1,240.9
   Gross profit                 151.1     ($31.1)    182.2
     % of revenue                12.2%                14.7%
   Operating income (loss)      (46.4)     (38.5)     (7.9)
     % of revenue                -3.7%                -0.6%

Technology Segment
   Total revenue                 270.3                270.3
   Gross profit                  120.5      (0.9)     121.4
     % of revenue                 44.6%                44.9%
   Operating income (loss)       (12.9)     (7.3)      (5.6)
     % of revenue                 -4.8%                -2.1%

Total Company
   Total revenue              1,435.5               1,435.5
   Gross profit                 277.4      (32.0)     309.4
     % of revenue                19.3%                 21.6%
   Operating income (loss)      (56.6)     (45.8)     (10.8)
     % of revenue                -3.9%                 -0.8%
                                   Three Months Ended
                                      June 30, 2004
                              ----------------------------
                                           Less     Without
                                  As     Pension    Pension
                               Reported Expense     Expense
                              -------- -------- --------
Services Segment
   Total revenue             $1,163.3             $1,163.3
   Gross profit                 214.9     ($17.4)    232.3
     % of revenue                18.5%                20.0%
   Operating income               8.2      (21.1)     29.3
     % of revenue                 0.7%                 2.5%

Technology Segment
   Total revenue                 282.1                282.1
   Gross profit                  150.4      (0.4)     150.8
     % of revenue                 53.3%                53.5%
   Operating income               15.1      (3.7)      18.8
     % of revenue                  5.4%                 6.7%

Total Company
   Total revenue              1,388.1               1,388.1
   Gross profit                 367.1      (17.8)     384.9
     % of revenue                26.4%                 27.7%
   Operating income              22.9      (24.8)      47.7
     % of revenue                 1.6%                  3.4%
UNISYS CORPORATION
             RECONCILIATION OF GAAP TO NON-GAAP
                SEGMENT RESULTS OF OPERATIONS
                          (Millions)

                                     Six Months Ended
                                       June 30, 2005
                               ----------------------------
                                            Less     Without
                                  As      Pension    Pension
                              Reported    Expense    Expense
                              -------- --------     --------
Services Segment
   Total revenue             $2,353.4               $2,353.4
   Gross profit                 273.3     ($62.9)      336.2
     % of revenue                11.6%                  14.3%
   Operating income (loss)     (121.5)     (77.9)      (43.6)
     % of revenue                -5.2%                  -1.9%

Technology Segment
   Total revenue                584.3                  584.3
   Gross profit                 270.2       (1.9)      272.1
     % of revenue                46.2%                  46.6%
   Operating income               6.4      (14.7)       21.1
     % of revenue                 1.1%                   3.6%

Total Company
   Total revenue              2,802.1                2,802.1
   Gross profit                 537.7      (64.8)      602.5
     % of revenue                19.2%                  21.5%
   Operating income (loss)     (122.8)     (92.6)      (30.2)
     % of revenue                -4.4%                  -1.1%
                                     Six Months Ended
                                       June 30, 2004
                               ----------------------------
                                            Less     Without
                                  As      Pension    Pension
                              Reported    Expense    Expense
                              -------- --------     --------
Services Segment
   Total revenue             $2,333.1               $2,333.1
   Gross profit                 437.8     ($32.6)      470.4
     % of revenue                18.8%                  20.2%
   Operating income              37.4      (40.4)       77.8
     % of revenue                 1.6%                   3.3%

Technology Segment
   Total revenue                620.9                  620.9
   Gross profit                 314.2       (0.7)      314.9
     % of revenue                50.6%                  50.7%
   Operating income              44.3       (6.6)       50.9
     % of revenue                 7.1%                   8.2%

Total Company
   Total revenue              2,851.0                2,851.0
   Gross profit                 758.6      (33.3)      791.9
     % of revenue                26.6%                  27.8%
   Operating income              81.7      (47.0)      128.7
     % of revenue                 2.9%                   4.5%
UNISYS CORPORATION
               RECONCILATION OF GAAP TO NON-GAAP
      FORWARD-LOOKING ESTIMATED EARNINGS (LOSS) PER SHARE


                                           Three        Twelve
                                           Months       Months
                                           Ending       Ending
                                         9/30/2005    12/31/2005
                                        ----------    ----------

Earnings (loss) per share-
   on a GAAP basis                      (.05)-(.03)    (.03)-.02

Add back estimated pension expense,
   net of tax                                   .09          .36
                                          ---------    ---------
Earnings per share-
   on a NON-GAAP basis
   (excluding pension expense)            .04 - .06     .33 -.38
                                          =========    =========

NOTE: See section in press release entitled
quot;Forward-Looking Statementsquot;.

More Related Content

What's hot

unisys 4Q08_SPR
unisys 4Q08_SPRunisys 4Q08_SPR
unisys 4Q08_SPRfinance36
 
unisys 4Q06_SPR
unisys 4Q06_SPRunisys 4Q06_SPR
unisys 4Q06_SPRfinance36
 
unisys 3Q05_SPR
unisys 3Q05_SPRunisys 3Q05_SPR
unisys 3Q05_SPRfinance36
 
unisys 3Q06_SPR
unisys 3Q06_SPRunisys 3Q06_SPR
unisys 3Q06_SPRfinance36
 
unisys 4Q07_SPR
unisys 4Q07_SPRunisys 4Q07_SPR
unisys 4Q07_SPRfinance36
 
unisys 1Q07_SPR
unisys 1Q07_SPRunisys 1Q07_SPR
unisys 1Q07_SPRfinance36
 
unisys 1Q06_SPR
unisys 1Q06_SPRunisys 1Q06_SPR
unisys 1Q06_SPRfinance36
 
unisys 1Q04_SPR
unisys 1Q04_SPRunisys 1Q04_SPR
unisys 1Q04_SPRfinance36
 
unisys 1Q08_SPR
unisys 1Q08_SPRunisys 1Q08_SPR
unisys 1Q08_SPRfinance36
 
unisys 1Q05_SPR
unisys 1Q05_SPRunisys 1Q05_SPR
unisys 1Q05_SPRfinance36
 
unisys 2001_2Q_10Q
unisys 2001_2Q_10Qunisys 2001_2Q_10Q
unisys 2001_2Q_10Qfinance36
 
unisys 2001_1Q_10Q
unisys 2001_1Q_10Qunisys 2001_1Q_10Q
unisys 2001_1Q_10Qfinance36
 
unisys 2002_3Q_10Q
unisys 2002_3Q_10Qunisys 2002_3Q_10Q
unisys 2002_3Q_10Qfinance36
 
unisys 2001_3Q_10Q
unisys 2001_3Q_10Qunisys 2001_3Q_10Q
unisys 2001_3Q_10Qfinance36
 
unisys 2002_2Q_10Q
unisys 2002_2Q_10Qunisys 2002_2Q_10Q
unisys 2002_2Q_10Qfinance36
 
aetna table 2005 3rd
aetna table 2005 3rdaetna table 2005 3rd
aetna table 2005 3rdfinance9
 
unisys 2002_1Q_10Q
unisys 2002_1Q_10Qunisys 2002_1Q_10Q
unisys 2002_1Q_10Qfinance36
 
unisys 2005_2Q_10Q
unisys 2005_2Q_10Qunisys 2005_2Q_10Q
unisys 2005_2Q_10Qfinance36
 
advance auto parts 2003_ar
advance auto parts 2003_aradvance auto parts 2003_ar
advance auto parts 2003_arfinance48
 

What's hot (19)

unisys 4Q08_SPR
unisys 4Q08_SPRunisys 4Q08_SPR
unisys 4Q08_SPR
 
unisys 4Q06_SPR
unisys 4Q06_SPRunisys 4Q06_SPR
unisys 4Q06_SPR
 
unisys 3Q05_SPR
unisys 3Q05_SPRunisys 3Q05_SPR
unisys 3Q05_SPR
 
unisys 3Q06_SPR
unisys 3Q06_SPRunisys 3Q06_SPR
unisys 3Q06_SPR
 
unisys 4Q07_SPR
unisys 4Q07_SPRunisys 4Q07_SPR
unisys 4Q07_SPR
 
unisys 1Q07_SPR
unisys 1Q07_SPRunisys 1Q07_SPR
unisys 1Q07_SPR
 
unisys 1Q06_SPR
unisys 1Q06_SPRunisys 1Q06_SPR
unisys 1Q06_SPR
 
unisys 1Q04_SPR
unisys 1Q04_SPRunisys 1Q04_SPR
unisys 1Q04_SPR
 
unisys 1Q08_SPR
unisys 1Q08_SPRunisys 1Q08_SPR
unisys 1Q08_SPR
 
unisys 1Q05_SPR
unisys 1Q05_SPRunisys 1Q05_SPR
unisys 1Q05_SPR
 
unisys 2001_2Q_10Q
unisys 2001_2Q_10Qunisys 2001_2Q_10Q
unisys 2001_2Q_10Q
 
unisys 2001_1Q_10Q
unisys 2001_1Q_10Qunisys 2001_1Q_10Q
unisys 2001_1Q_10Q
 
unisys 2002_3Q_10Q
unisys 2002_3Q_10Qunisys 2002_3Q_10Q
unisys 2002_3Q_10Q
 
unisys 2001_3Q_10Q
unisys 2001_3Q_10Qunisys 2001_3Q_10Q
unisys 2001_3Q_10Q
 
unisys 2002_2Q_10Q
unisys 2002_2Q_10Qunisys 2002_2Q_10Q
unisys 2002_2Q_10Q
 
aetna table 2005 3rd
aetna table 2005 3rdaetna table 2005 3rd
aetna table 2005 3rd
 
unisys 2002_1Q_10Q
unisys 2002_1Q_10Qunisys 2002_1Q_10Q
unisys 2002_1Q_10Q
 
unisys 2005_2Q_10Q
unisys 2005_2Q_10Qunisys 2005_2Q_10Q
unisys 2005_2Q_10Q
 
advance auto parts 2003_ar
advance auto parts 2003_aradvance auto parts 2003_ar
advance auto parts 2003_ar
 

Viewers also liked

micron technollogy 08_8K_CFO_Appointment
micron technollogy 08_8K_CFO_Appointmentmicron technollogy 08_8K_CFO_Appointment
micron technollogy 08_8K_CFO_Appointmentfinance36
 
unisys 2005_1Q_10Q
unisys 2005_1Q_10Qunisys 2005_1Q_10Q
unisys 2005_1Q_10Qfinance36
 
unisys 2003_1Q_10Q
unisys 2003_1Q_10Qunisys 2003_1Q_10Q
unisys 2003_1Q_10Qfinance36
 
micron technollogy 2007_8_K_other_events
micron technollogy 2007_8_K_other_eventsmicron technollogy 2007_8_K_other_events
micron technollogy 2007_8_K_other_eventsfinance36
 
micron technollogy 2004_10K
micron technollogy 2004_10Kmicron technollogy 2004_10K
micron technollogy 2004_10Kfinance36
 
shaw group employee_compensation
shaw group  employee_compensationshaw group  employee_compensation
shaw group employee_compensationfinance36
 
shaw group 94AC2BEF-AE9A-4207-BADB-56E9EA310D39_BarclaysFebruary2009
shaw group 94AC2BEF-AE9A-4207-BADB-56E9EA310D39_BarclaysFebruary2009shaw group 94AC2BEF-AE9A-4207-BADB-56E9EA310D39_BarclaysFebruary2009
shaw group 94AC2BEF-AE9A-4207-BADB-56E9EA310D39_BarclaysFebruary2009finance36
 

Viewers also liked (7)

micron technollogy 08_8K_CFO_Appointment
micron technollogy 08_8K_CFO_Appointmentmicron technollogy 08_8K_CFO_Appointment
micron technollogy 08_8K_CFO_Appointment
 
unisys 2005_1Q_10Q
unisys 2005_1Q_10Qunisys 2005_1Q_10Q
unisys 2005_1Q_10Q
 
unisys 2003_1Q_10Q
unisys 2003_1Q_10Qunisys 2003_1Q_10Q
unisys 2003_1Q_10Q
 
micron technollogy 2007_8_K_other_events
micron technollogy 2007_8_K_other_eventsmicron technollogy 2007_8_K_other_events
micron technollogy 2007_8_K_other_events
 
micron technollogy 2004_10K
micron technollogy 2004_10Kmicron technollogy 2004_10K
micron technollogy 2004_10K
 
shaw group employee_compensation
shaw group  employee_compensationshaw group  employee_compensation
shaw group employee_compensation
 
shaw group 94AC2BEF-AE9A-4207-BADB-56E9EA310D39_BarclaysFebruary2009
shaw group 94AC2BEF-AE9A-4207-BADB-56E9EA310D39_BarclaysFebruary2009shaw group 94AC2BEF-AE9A-4207-BADB-56E9EA310D39_BarclaysFebruary2009
shaw group 94AC2BEF-AE9A-4207-BADB-56E9EA310D39_BarclaysFebruary2009
 

Similar to unisys 2Q05_SPR

unisys 2Q04_SPR
unisys 2Q04_SPRunisys 2Q04_SPR
unisys 2Q04_SPRfinance36
 
unisys 2Q04_SPR
unisys 2Q04_SPRunisys 2Q04_SPR
unisys 2Q04_SPRfinance36
 
Epsilon Energy Ltd. Announces 2012 Second Quarter Results
Epsilon Energy Ltd. Announces 2012 Second Quarter ResultsEpsilon Energy Ltd. Announces 2012 Second Quarter Results
Epsilon Energy Ltd. Announces 2012 Second Quarter Results
Rad Arnold
 
qwest communications Q_3Q07_Historical_v2
qwest communications Q_3Q07_Historical_v2qwest communications Q_3Q07_Historical_v2
qwest communications Q_3Q07_Historical_v2finance19
 
Q1 2009 Earning Report of Weatherford International
Q1 2009 Earning Report of Weatherford InternationalQ1 2009 Earning Report of Weatherford International
Q1 2009 Earning Report of Weatherford Internationalearningreport earningreport
 
Q1 2009 Earning Report of Weatherford International
Q1 2009 Earning Report of Weatherford InternationalQ1 2009 Earning Report of Weatherford International
Q1 2009 Earning Report of Weatherford Internationalearningreport earningreport
 
unisys 2Q04_10Q
unisys 2Q04_10Qunisys 2Q04_10Q
unisys 2Q04_10Qfinance36
 
Verizon Reports Sustained Revenue Growth and Continued Strong Cash Flows fo...
 	Verizon Reports Sustained Revenue Growth and Continued Strong Cash Flows fo... 	Verizon Reports Sustained Revenue Growth and Continued Strong Cash Flows fo...
Verizon Reports Sustained Revenue Growth and Continued Strong Cash Flows fo...finance2
 
nationwide 1Q07 Statistical Supplement
nationwide 	1Q07 Statistical Supplementnationwide 	1Q07 Statistical Supplement
nationwide 1Q07 Statistical Supplementfinance11
 
qwest communications Historical Quarterly Results1Q 06_2Q08
qwest communications Historical Quarterly Results1Q 06_2Q08qwest communications Historical Quarterly Results1Q 06_2Q08
qwest communications Historical Quarterly Results1Q 06_2Q08finance19
 
qwest communications Q_4Q07_profile
qwest communications Q_4Q07_profileqwest communications Q_4Q07_profile
qwest communications Q_4Q07_profilefinance19
 
qwest communications 1231 06
qwest communications 1231 06qwest communications 1231 06
qwest communications 1231 06finance19
 
unisys 2005_3Q_10Q
unisys 2005_3Q_10Qunisys 2005_3Q_10Q
unisys 2005_3Q_10Qfinance36
 
danaher 08_3Q_Release
danaher 08_3Q_Releasedanaher 08_3Q_Release
danaher 08_3Q_Releasefinance24
 
Maxim 2Q FISCAL 2009 RESULTS
Maxim 2Q FISCAL 2009 RESULTSMaxim 2Q FISCAL 2009 RESULTS
Maxim 2Q FISCAL 2009 RESULTS
earningsreport
 

Similar to unisys 2Q05_SPR (16)

unisys 2Q04_SPR
unisys 2Q04_SPRunisys 2Q04_SPR
unisys 2Q04_SPR
 
unisys 2Q04_SPR
unisys 2Q04_SPRunisys 2Q04_SPR
unisys 2Q04_SPR
 
Epsilon Energy Ltd. Announces 2012 Second Quarter Results
Epsilon Energy Ltd. Announces 2012 Second Quarter ResultsEpsilon Energy Ltd. Announces 2012 Second Quarter Results
Epsilon Energy Ltd. Announces 2012 Second Quarter Results
 
Q1 2009 Earning Report of Stockeryale Inc.
Q1 2009 Earning Report of Stockeryale Inc.Q1 2009 Earning Report of Stockeryale Inc.
Q1 2009 Earning Report of Stockeryale Inc.
 
qwest communications Q_3Q07_Historical_v2
qwest communications Q_3Q07_Historical_v2qwest communications Q_3Q07_Historical_v2
qwest communications Q_3Q07_Historical_v2
 
Q1 2009 Earning Report of Weatherford International
Q1 2009 Earning Report of Weatherford InternationalQ1 2009 Earning Report of Weatherford International
Q1 2009 Earning Report of Weatherford International
 
Q1 2009 Earning Report of Weatherford International
Q1 2009 Earning Report of Weatherford InternationalQ1 2009 Earning Report of Weatherford International
Q1 2009 Earning Report of Weatherford International
 
unisys 2Q04_10Q
unisys 2Q04_10Qunisys 2Q04_10Q
unisys 2Q04_10Q
 
Verizon Reports Sustained Revenue Growth and Continued Strong Cash Flows fo...
 	Verizon Reports Sustained Revenue Growth and Continued Strong Cash Flows fo... 	Verizon Reports Sustained Revenue Growth and Continued Strong Cash Flows fo...
Verizon Reports Sustained Revenue Growth and Continued Strong Cash Flows fo...
 
nationwide 1Q07 Statistical Supplement
nationwide 	1Q07 Statistical Supplementnationwide 	1Q07 Statistical Supplement
nationwide 1Q07 Statistical Supplement
 
qwest communications Historical Quarterly Results1Q 06_2Q08
qwest communications Historical Quarterly Results1Q 06_2Q08qwest communications Historical Quarterly Results1Q 06_2Q08
qwest communications Historical Quarterly Results1Q 06_2Q08
 
qwest communications Q_4Q07_profile
qwest communications Q_4Q07_profileqwest communications Q_4Q07_profile
qwest communications Q_4Q07_profile
 
qwest communications 1231 06
qwest communications 1231 06qwest communications 1231 06
qwest communications 1231 06
 
unisys 2005_3Q_10Q
unisys 2005_3Q_10Qunisys 2005_3Q_10Q
unisys 2005_3Q_10Q
 
danaher 08_3Q_Release
danaher 08_3Q_Releasedanaher 08_3Q_Release
danaher 08_3Q_Release
 
Maxim 2Q FISCAL 2009 RESULTS
Maxim 2Q FISCAL 2009 RESULTSMaxim 2Q FISCAL 2009 RESULTS
Maxim 2Q FISCAL 2009 RESULTS
 

More from finance36

unisys 2001_10K
unisys 2001_10Kunisys 2001_10K
unisys 2001_10Kfinance36
 
unisys 2002_10K
unisys 2002_10Kunisys 2002_10K
unisys 2002_10Kfinance36
 
unisys 2003_2Q_10Q
unisys 2003_2Q_10Qunisys 2003_2Q_10Q
unisys 2003_2Q_10Qfinance36
 
unisys 2003_3Q_10Q
unisys 2003_3Q_10Qunisys 2003_3Q_10Q
unisys 2003_3Q_10Qfinance36
 
unisys 2003_4Q_10K
unisys 2003_4Q_10Kunisys 2003_4Q_10K
unisys 2003_4Q_10Kfinance36
 
unisys 1Q04_10Q
unisys 1Q04_10Qunisys 1Q04_10Q
unisys 1Q04_10Qfinance36
 
unisys 3Q04_10Q
unisys 3Q04_10Qunisys 3Q04_10Q
unisys 3Q04_10Qfinance36
 
unisys 2004_4Q_10K
unisys 2004_4Q_10Kunisys 2004_4Q_10K
unisys 2004_4Q_10Kfinance36
 
unisys 2005_4Q_10K
unisys 2005_4Q_10Kunisys 2005_4Q_10K
unisys 2005_4Q_10Kfinance36
 
unisys 2006_1Q_10Q
unisys 2006_1Q_10Qunisys 2006_1Q_10Q
unisys 2006_1Q_10Qfinance36
 

More from finance36 (10)

unisys 2001_10K
unisys 2001_10Kunisys 2001_10K
unisys 2001_10K
 
unisys 2002_10K
unisys 2002_10Kunisys 2002_10K
unisys 2002_10K
 
unisys 2003_2Q_10Q
unisys 2003_2Q_10Qunisys 2003_2Q_10Q
unisys 2003_2Q_10Q
 
unisys 2003_3Q_10Q
unisys 2003_3Q_10Qunisys 2003_3Q_10Q
unisys 2003_3Q_10Q
 
unisys 2003_4Q_10K
unisys 2003_4Q_10Kunisys 2003_4Q_10K
unisys 2003_4Q_10K
 
unisys 1Q04_10Q
unisys 1Q04_10Qunisys 1Q04_10Q
unisys 1Q04_10Q
 
unisys 3Q04_10Q
unisys 3Q04_10Qunisys 3Q04_10Q
unisys 3Q04_10Q
 
unisys 2004_4Q_10K
unisys 2004_4Q_10Kunisys 2004_4Q_10K
unisys 2004_4Q_10K
 
unisys 2005_4Q_10K
unisys 2005_4Q_10Kunisys 2005_4Q_10K
unisys 2005_4Q_10K
 
unisys 2006_1Q_10Q
unisys 2006_1Q_10Qunisys 2006_1Q_10Q
unisys 2006_1Q_10Q
 

Recently uploaded

Intro_Economics_ GPresentation Week 4.pptx
Intro_Economics_ GPresentation Week 4.pptxIntro_Economics_ GPresentation Week 4.pptx
Intro_Economics_ GPresentation Week 4.pptx
shetivia
 
Chương 6. Ancol - phenol - ether (1).pdf
Chương 6. Ancol - phenol - ether (1).pdfChương 6. Ancol - phenol - ether (1).pdf
Chương 6. Ancol - phenol - ether (1).pdf
va2132004
 
how can I sell pi coins after successfully completing KYC
how can I sell pi coins after successfully completing KYChow can I sell pi coins after successfully completing KYC
how can I sell pi coins after successfully completing KYC
DOT TECH
 
The European Unemployment Puzzle: implications from population aging
The European Unemployment Puzzle: implications from population agingThe European Unemployment Puzzle: implications from population aging
The European Unemployment Puzzle: implications from population aging
GRAPE
 
Turin Startup Ecosystem 2024 - Ricerca sulle Startup e il Sistema dell'Innov...
Turin Startup Ecosystem 2024  - Ricerca sulle Startup e il Sistema dell'Innov...Turin Startup Ecosystem 2024  - Ricerca sulle Startup e il Sistema dell'Innov...
Turin Startup Ecosystem 2024 - Ricerca sulle Startup e il Sistema dell'Innov...
Quotidiano Piemontese
 
what is a pi whale and how to access one.
what is a pi whale and how to access one.what is a pi whale and how to access one.
what is a pi whale and how to access one.
DOT TECH
 
Exploring Abhay Bhutada’s Views After Poonawalla Fincorp’s Collaboration With...
Exploring Abhay Bhutada’s Views After Poonawalla Fincorp’s Collaboration With...Exploring Abhay Bhutada’s Views After Poonawalla Fincorp’s Collaboration With...
Exploring Abhay Bhutada’s Views After Poonawalla Fincorp’s Collaboration With...
beulahfernandes8
 
how to sell pi coins in all Africa Countries.
how to sell pi coins in all Africa Countries.how to sell pi coins in all Africa Countries.
how to sell pi coins in all Africa Countries.
DOT TECH
 
Financial Assets: Debit vs Equity Securities.pptx
Financial Assets: Debit vs Equity Securities.pptxFinancial Assets: Debit vs Equity Securities.pptx
Financial Assets: Debit vs Equity Securities.pptx
Writo-Finance
 
how can i use my minded pi coins I need some funds.
how can i use my minded pi coins I need some funds.how can i use my minded pi coins I need some funds.
how can i use my minded pi coins I need some funds.
DOT TECH
 
how to sell pi coins on Binance exchange
how to sell pi coins on Binance exchangehow to sell pi coins on Binance exchange
how to sell pi coins on Binance exchange
DOT TECH
 
The WhatsPump Pseudonym Problem and the Hilarious Downfall of Artificial Enga...
The WhatsPump Pseudonym Problem and the Hilarious Downfall of Artificial Enga...The WhatsPump Pseudonym Problem and the Hilarious Downfall of Artificial Enga...
The WhatsPump Pseudonym Problem and the Hilarious Downfall of Artificial Enga...
muslimdavidovich670
 
when will pi network coin be available on crypto exchange.
when will pi network coin be available on crypto exchange.when will pi network coin be available on crypto exchange.
when will pi network coin be available on crypto exchange.
DOT TECH
 
managementaccountingunitiv-230422140105-dd17d80b.ppt
managementaccountingunitiv-230422140105-dd17d80b.pptmanagementaccountingunitiv-230422140105-dd17d80b.ppt
managementaccountingunitiv-230422140105-dd17d80b.ppt
SuseelaPalanimuthu
 
What price will pi network be listed on exchanges
What price will pi network be listed on exchangesWhat price will pi network be listed on exchanges
What price will pi network be listed on exchanges
DOT TECH
 
GeM ppt in railway for presentation on gem
GeM ppt in railway  for presentation on gemGeM ppt in railway  for presentation on gem
GeM ppt in railway for presentation on gem
CwierAsn
 
Webinar Exploring DORA for Fintechs - Simont Braun
Webinar Exploring DORA for Fintechs - Simont BraunWebinar Exploring DORA for Fintechs - Simont Braun
Webinar Exploring DORA for Fintechs - Simont Braun
FinTech Belgium
 
This assessment plan proposal is to outline a structured approach to evaluati...
This assessment plan proposal is to outline a structured approach to evaluati...This assessment plan proposal is to outline a structured approach to evaluati...
This assessment plan proposal is to outline a structured approach to evaluati...
lamluanvan.net Viết thuê luận văn
 
how to sell pi coins in South Korea profitably.
how to sell pi coins in South Korea profitably.how to sell pi coins in South Korea profitably.
how to sell pi coins in South Korea profitably.
DOT TECH
 
how to sell pi coins on Bitmart crypto exchange
how to sell pi coins on Bitmart crypto exchangehow to sell pi coins on Bitmart crypto exchange
how to sell pi coins on Bitmart crypto exchange
DOT TECH
 

Recently uploaded (20)

Intro_Economics_ GPresentation Week 4.pptx
Intro_Economics_ GPresentation Week 4.pptxIntro_Economics_ GPresentation Week 4.pptx
Intro_Economics_ GPresentation Week 4.pptx
 
Chương 6. Ancol - phenol - ether (1).pdf
Chương 6. Ancol - phenol - ether (1).pdfChương 6. Ancol - phenol - ether (1).pdf
Chương 6. Ancol - phenol - ether (1).pdf
 
how can I sell pi coins after successfully completing KYC
how can I sell pi coins after successfully completing KYChow can I sell pi coins after successfully completing KYC
how can I sell pi coins after successfully completing KYC
 
The European Unemployment Puzzle: implications from population aging
The European Unemployment Puzzle: implications from population agingThe European Unemployment Puzzle: implications from population aging
The European Unemployment Puzzle: implications from population aging
 
Turin Startup Ecosystem 2024 - Ricerca sulle Startup e il Sistema dell'Innov...
Turin Startup Ecosystem 2024  - Ricerca sulle Startup e il Sistema dell'Innov...Turin Startup Ecosystem 2024  - Ricerca sulle Startup e il Sistema dell'Innov...
Turin Startup Ecosystem 2024 - Ricerca sulle Startup e il Sistema dell'Innov...
 
what is a pi whale and how to access one.
what is a pi whale and how to access one.what is a pi whale and how to access one.
what is a pi whale and how to access one.
 
Exploring Abhay Bhutada’s Views After Poonawalla Fincorp’s Collaboration With...
Exploring Abhay Bhutada’s Views After Poonawalla Fincorp’s Collaboration With...Exploring Abhay Bhutada’s Views After Poonawalla Fincorp’s Collaboration With...
Exploring Abhay Bhutada’s Views After Poonawalla Fincorp’s Collaboration With...
 
how to sell pi coins in all Africa Countries.
how to sell pi coins in all Africa Countries.how to sell pi coins in all Africa Countries.
how to sell pi coins in all Africa Countries.
 
Financial Assets: Debit vs Equity Securities.pptx
Financial Assets: Debit vs Equity Securities.pptxFinancial Assets: Debit vs Equity Securities.pptx
Financial Assets: Debit vs Equity Securities.pptx
 
how can i use my minded pi coins I need some funds.
how can i use my minded pi coins I need some funds.how can i use my minded pi coins I need some funds.
how can i use my minded pi coins I need some funds.
 
how to sell pi coins on Binance exchange
how to sell pi coins on Binance exchangehow to sell pi coins on Binance exchange
how to sell pi coins on Binance exchange
 
The WhatsPump Pseudonym Problem and the Hilarious Downfall of Artificial Enga...
The WhatsPump Pseudonym Problem and the Hilarious Downfall of Artificial Enga...The WhatsPump Pseudonym Problem and the Hilarious Downfall of Artificial Enga...
The WhatsPump Pseudonym Problem and the Hilarious Downfall of Artificial Enga...
 
when will pi network coin be available on crypto exchange.
when will pi network coin be available on crypto exchange.when will pi network coin be available on crypto exchange.
when will pi network coin be available on crypto exchange.
 
managementaccountingunitiv-230422140105-dd17d80b.ppt
managementaccountingunitiv-230422140105-dd17d80b.pptmanagementaccountingunitiv-230422140105-dd17d80b.ppt
managementaccountingunitiv-230422140105-dd17d80b.ppt
 
What price will pi network be listed on exchanges
What price will pi network be listed on exchangesWhat price will pi network be listed on exchanges
What price will pi network be listed on exchanges
 
GeM ppt in railway for presentation on gem
GeM ppt in railway  for presentation on gemGeM ppt in railway  for presentation on gem
GeM ppt in railway for presentation on gem
 
Webinar Exploring DORA for Fintechs - Simont Braun
Webinar Exploring DORA for Fintechs - Simont BraunWebinar Exploring DORA for Fintechs - Simont Braun
Webinar Exploring DORA for Fintechs - Simont Braun
 
This assessment plan proposal is to outline a structured approach to evaluati...
This assessment plan proposal is to outline a structured approach to evaluati...This assessment plan proposal is to outline a structured approach to evaluati...
This assessment plan proposal is to outline a structured approach to evaluati...
 
how to sell pi coins in South Korea profitably.
how to sell pi coins in South Korea profitably.how to sell pi coins in South Korea profitably.
how to sell pi coins in South Korea profitably.
 
how to sell pi coins on Bitmart crypto exchange
how to sell pi coins on Bitmart crypto exchangehow to sell pi coins on Bitmart crypto exchange
how to sell pi coins on Bitmart crypto exchange
 

unisys 2Q05_SPR

  • 1. UNISYS CORPORATION CONSOLIDATED STATEMENTS OF INCOME (Millions, except per share data) Three Months Six Months Ended June 30 Ended June 30 ------------------ ------------------ 2005 2004 2005 2004 -------- -------- -------- -------- Revenue Services $1,236.0 $1,158.8 $2,343.7 $2,323.8 Technology 199.5 229.3 458.4 527.2 -------- -------- -------- -------- 1,435.5 1,388.1 2,802.1 2,851.0 Costs and expenses Cost of revenue: Services 1,063.4 930.2 2,044.8 1,855.9 Technology 94.7 90.8 219.6 236.5 -------- -------- -------- -------- 1,158.1 1,021.0 2,264.4 2,092.4 Selling, general and administrative 267.4 272.9 529.0 534.1 Research and development 66.6 71.3 131.5 142.8 -------- -------- -------- -------- 1,492.1 1,365.2 2,924.9 2,769.3 -------- -------- -------- -------- Operating income (loss) (56.6) 22.9 (122.8) 81.7 Interest expense 15.2 18.2 27.8 35.2 Other income (expense), net 32.0 24.0 32.5 24.6 -------- -------- -------- -------- Income (loss) before income taxes (39.8) 28.7 (118.1) 71.1 Provision (benefit) for income taxes (12.7) 9.3 (45.5) 22.8 -------- -------- -------- -------- Net income (loss) ($27.1) $19.4 ($72.6) $48.3 ======== ======== ======== ======== Earnings (loss) per share Basic ($ .08) $ .06 ($ .21) $ .14 ======== ======== ======== ======== Diluted ($ .08) $ .06 ($ .21) $ .14 ======== ======== ======== ======== Shares used in the per share computations (thousands): Basic 340,047 334,411 339,147 333,567 ======== ======== ======== ======== Diluted 340,047 338,767 339,147 338,407 ======== ======== ======== ========
  • 2. UNISYS CORPORATION SEGMENT RESULTS (Millions) Elimi- Total nations Services Technology -------- -------- -------- ---------- Three Months Ended June 30, 2005 ------------------ Customer revenue $1,435.5 $1,236.0 $199.5 Intersegment ($75.7) 4.9 70.8 -------- -------- -------- -------- Total revenue $1,435.5 ($75.7) $1,240.9 $270.3 ======== ======== ======== ======== Gross profit percent 19.3% 12.2% 44.6% ======== ======== ======== Operating profit (loss) percent (3.9%) (3.7%) (4.8%) ======== ======== ======== Three Months Ended June 30, 2004 ------------------ Customer revenue $1,388.1 $1,158.8 $229.3 Intersegment ($57.3) 4.5 52.8 -------- -------- -------- -------- Total revenue $1,388.1 ($57.3) $1,163.3 $282.1 ======== ======== ======== ======== Gross profit percent 26.4% 18.5% 53.3% ======== ======== ======== Operating profit percent 1.6% 0.7% 5.4% ======== ======== ======== Six Months Ended June 30, 2005 ------------------ Customer revenue $2,802.1 $2,343.7 $458.4 Intersegment ($135.6) 9.7 125.9 -------- -------- -------- -------- Total revenue $2,802.1 ($135.6) $2,353.4 $584.3 ======== ======== ======== ======== Gross profit percent 19.2% 11.6% 46.2% ======== ======== ======== Operating profit (loss) percent (4.4%) (5.2%) 1.1% ======== ======== ======== Six Months Ended June 30, 2004 ------------------ Customer revenue $2,851.0 $2,323.8 $527.2 Intersegment ($103.0) 9.3 93.7 -------- -------- -------- -------- Total revenue $2,851.0 ($103.0) $2,333.1 $620.9 ======== ======== ======== ======== Gross profit percent 26.6% 18.8% 50.6% ======== ======== ======== Operating profit percent 2.9% 1.6% 7.1% ======== ======== ========
  • 3. UNISYS CORPORATION CONSOLIDATED BALANCE SHEETS (Millions) June 30, December 31, 2005 2004 ---------- ---------- Assets Current assets Cash and cash equivalents $398.9 $660.5 Accounts and notes receivable, net 1,073.1 1,136.8 Inventories Parts and finished equipment 87.6 93.7 Work in process and materials 118.1 122.4 Deferred income taxes 292.4 291.8 Prepaid expense and other current assets 153.9 112.4 ---------- ---------- Total 2,124.0 2,417.6 ---------- ---------- Properties 1,331.7 1,305.5 Less accumulated depreciation and amortization 922.8 881.4 ---------- ---------- Properties, net 408.9 424.1 ---------- ---------- Outsourcing assets, net 432.2 431.9 Marketable software, net 337.1 336.8 Investments at equity 213.9 197.1 Prepaid pension cost 45.3 52.5 Deferred income taxes 1,394.6 1,394.6 Goodwill 188.8 189.9 Other long-term assets 160.2 176.4 ---------- ---------- Total $5,305.0 $5,620.9 ========== ========== Liabilities and stockholders' equity Current liabilities Notes payable $1.4 $1.0 Current maturities of long-term debt 400.5 151.7 Accounts payable 431.6 487.4 Other accrued liabilities 1,189.1 1,382.7 ---------- ---------- Total 2,022.6 2,022.8 ---------- ---------- Long-term debt 499.4 898.4 Accrued pension liabilities 610.6 537.9 Other long-term liabilities 694.2 655.3 Stockholders' equity Common stock 3.4 3.4 Accumulated deficit (448.8) (376.2) Other capital 3,907.0 3,883.8 Accumulated other comprehensive loss (1,983.4) (2,004.5) ---------- ---------- Stockholders' equity 1,478.2 1,506.5 ---------- ---------- Total $5,305.0 $5,620.9 ========== ==========
  • 4. UNISYS CORPORATION CONSOLIDATED STATEMENTS OF CASH FLOWS (Millions) Six Months Ended June 30 ------------------- 2005 2004 ------- ------- Cash flows from operating activities Net income (loss) ($72.6) $48.3 Add (deduct) items to reconcile net income (loss) to net cash provided by operating activities: Equity income (11.6) (14.3) Depreciation and amortization of properties 61.8 68.9 Depreciation and amortization of outsourcing assets 65.6 59.0 Amortization of marketable software 59.2 62.9 Increase in deferred income taxes, net (.6) (2.4) Decrease in receivables, net 73.6 185.3 Decrease in inventories 10.4 6.4 Decrease in accounts payable and other accrued liabilities (249.3) (194.1) Increase in other liabilities 122.6 3.5 Increase in other assets (24.8) (7.8) Other 56.4 21.6 ------- ------- Net cash provided by operating activities 90.7 237.3 ------- ------- Cash flows from investing activities Proceeds from investments 3,709.4 2,878.8 Purchases of investments (3,698.8) (2,879.0) Investment in marketable software (63.3) (60.5) Capital additions of properties (59.4) (74.5) Capital additions of outsourcing assets (86.3) (92.3) Purchases of businesses (.5) (12.6) ------- ------- Net cash used for investing activities (198.9) (240.1) ------- ------- Cash flows from financing activities Net proceeds from (reduction in) short-term borrowings .5 (10.6) Proceeds from employee stock plans 12.8 24.0 Payments of long-term debt (150.7) (1.7) ------- ------- Net cash (used for) provided by financing activities (137.4) 11.7 ------- ------- Effect of exchange rate changes on cash and cash equivalents (16.0) (1.4) ------- ------- (Decrease) increase in cash and cash equivalents (261.6) 7.5 Cash and cash equivalents, beginning of period 660.5 635.9 ------- ------- Cash and cash equivalents, end of period $398.9 $643.4 ======= =======
  • 5. Reconciliation of GAAP to Non-GAAP Financial Information The preceding release presents information with and without pension expense. Unisys believes that this information will enhance an overall understanding of its financial performance due to the significant change in pension expense from period to period and the non-operational nature of pension expense. The presentation of non-GAAP information is not meant to be considered in isolation or as a substitute for results prepared in accordance with accounting principles generally accepted in the United States.
  • 6. UNISYS CORPORATION RECONCILIATION OF GAAP TO NON-GAAP CONSOLIDATED STATEMENTS OF INCOME (Millions, except per share data) Three Months Ended June 30, 2005 ---------------------------- US GAAP Less Without as Pension Pension Reported Expense Expense -------- -------- -------- Revenue $1,435.5 $1,435.5 Costs and expenses Cost of revenue 1,158.1 ($32.0) 1,126.1 Selling, general and administrative 267.4 (8.9) 258.5 Research and development 66.6 (4.9) 61.7 -------- -------- -------- 1,492.1 (45.8) 1,446.3 -------- -------- -------- Operating income (loss) (56.6) 45.8 (10.8) Interest expense 15.2 15.2 Other income (expense), net 32.0 32.0 -------- -------- -------- Income (loss) before income taxes (39.8) 45.8 6.0 Provision (benefit) for income taxes (12.7) 14.6 1.9 -------- -------- -------- Net income (loss) ($27.1) $31.2 $4.1 ======== ======== ======== Earnings (loss) per share ($ .08) $ .09 $ .01 ======== ======== ======== Three Months Ended June 30, 2004 ---------------------------- US GAAP Less Without as Pension Pension Reported Expense Expense -------- -------- -------- Revenue $1,388.1 $1,388.1 Costs and expenses Cost of revenue 1,021.0 ($17.8) 1,003.2 Selling, general and administrative 272.9 (4.8) 268.1 Research and development 71.3 (2.2) 69.1 -------- -------- -------- 1,365.2 (24.8) 1,340.4 -------- -------- -------- Operating income 22.9 24.8 47.7 Interest expense 18.2 18.2 Other income (expense), net 24.0 24.0 -------- -------- -------- Income before income taxes 28.7 24.8 53.5 Provision for income taxes 9.3 7.9 17.2 -------- -------- -------- Net income $19.4 $16.9 $36.3 ======== ======== ======== Earnings per share $ .06 $ .05 $ .11 ======== ======== ========
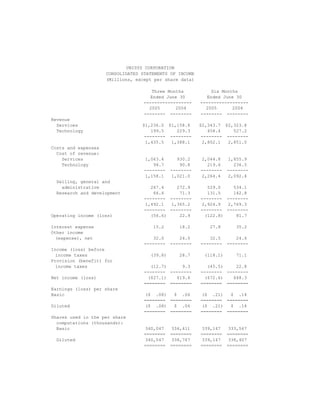
  • 7. UNISYS CORPORATION RECONCILIATION OF GAAP TO NON-GAAP CONSOLIDATED STATEMENTS OF INCOME (Millions, except per share data) Six Months Ended June 30, 2005 ---------------------------- US GAAP Less Without as Pension Pension Reported Expense Expense -------- -------- -------- Revenue $2,802.1 $2,802.1 Costs and expenses Cost of revenue 2,264.4 ($64.8) 2,199.6 Selling, general and administrative 529.0 (18.0) 511.0 Research and development 131.5 (9.8) 121.7 -------- -------- -------- 2,924.9 (92.6) 2,832.3 -------- -------- -------- Operating income (loss) (122.8) 92.6 (30.2) Interest expense 27.8 27.8 Other income (expense), net 32.5 32.5 -------- -------- -------- Income (loss) before income taxes (118.1) 92.6 (25.5) Provision (benefit) for income taxes (45.5) 29.6 (15.9) -------- -------- -------- Net income (loss) ($72.6) $63.0 ($9.6) ======== ======== ======== Earnings (loss) per share ($ .21) $ .18 ($ .03) ======== ======== ======== Six Months Ended June 30, 2004 ---------------------------- US GAAP Less Without as Pension Pension Reported Expense Expense -------- -------- -------- Revenue $2,851.0 $2,851.0 Costs and expenses Cost of revenue 2,092.4 ($33.3) 2,059.1 Selling, general and administrative 534.1 (9.7) 524.4 Research and development 142.8 (4.0) 138.8 -------- -------- -------- 2,769.3 (47.0) 2,722.3 -------- -------- -------- Operating income 81.7 47.0 128.7 Interest expense 35.2 35.2 Other income (expense), net 24.6 24.6 -------- -------- -------- Income before income taxes 71.1 47.0 118.1 Provision for income taxes 22.8 15.0 37.8 -------- -------- -------- Net income $48.3 $32.0 $80.3 ======== ======== ======== Earnings per share $ .14 $ .10 $ .24 ======== ======== ========
  • 8. UNISYS CORPORATION RECONCILIATION OF GAAP TO NON-GAAP SEGMENT RESULTS OF OPERATIONS (Millions) Three Months Ended June 30, 2005 ---------------------------- Less Without As Pension Pension Reported Expense Expense -------- -------- -------- Services Segment Total revenue $1,240.9 $1,240.9 Gross profit 151.1 ($31.1) 182.2 % of revenue 12.2% 14.7% Operating income (loss) (46.4) (38.5) (7.9) % of revenue -3.7% -0.6% Technology Segment Total revenue 270.3 270.3 Gross profit 120.5 (0.9) 121.4 % of revenue 44.6% 44.9% Operating income (loss) (12.9) (7.3) (5.6) % of revenue -4.8% -2.1% Total Company Total revenue 1,435.5 1,435.5 Gross profit 277.4 (32.0) 309.4 % of revenue 19.3% 21.6% Operating income (loss) (56.6) (45.8) (10.8) % of revenue -3.9% -0.8% Three Months Ended June 30, 2004 ---------------------------- Less Without As Pension Pension Reported Expense Expense -------- -------- -------- Services Segment Total revenue $1,163.3 $1,163.3 Gross profit 214.9 ($17.4) 232.3 % of revenue 18.5% 20.0% Operating income 8.2 (21.1) 29.3 % of revenue 0.7% 2.5% Technology Segment Total revenue 282.1 282.1 Gross profit 150.4 (0.4) 150.8 % of revenue 53.3% 53.5% Operating income 15.1 (3.7) 18.8 % of revenue 5.4% 6.7% Total Company Total revenue 1,388.1 1,388.1 Gross profit 367.1 (17.8) 384.9 % of revenue 26.4% 27.7% Operating income 22.9 (24.8) 47.7 % of revenue 1.6% 3.4%
  • 9. UNISYS CORPORATION RECONCILIATION OF GAAP TO NON-GAAP SEGMENT RESULTS OF OPERATIONS (Millions) Six Months Ended June 30, 2005 ---------------------------- Less Without As Pension Pension Reported Expense Expense -------- -------- -------- Services Segment Total revenue $2,353.4 $2,353.4 Gross profit 273.3 ($62.9) 336.2 % of revenue 11.6% 14.3% Operating income (loss) (121.5) (77.9) (43.6) % of revenue -5.2% -1.9% Technology Segment Total revenue 584.3 584.3 Gross profit 270.2 (1.9) 272.1 % of revenue 46.2% 46.6% Operating income 6.4 (14.7) 21.1 % of revenue 1.1% 3.6% Total Company Total revenue 2,802.1 2,802.1 Gross profit 537.7 (64.8) 602.5 % of revenue 19.2% 21.5% Operating income (loss) (122.8) (92.6) (30.2) % of revenue -4.4% -1.1% Six Months Ended June 30, 2004 ---------------------------- Less Without As Pension Pension Reported Expense Expense -------- -------- -------- Services Segment Total revenue $2,333.1 $2,333.1 Gross profit 437.8 ($32.6) 470.4 % of revenue 18.8% 20.2% Operating income 37.4 (40.4) 77.8 % of revenue 1.6% 3.3% Technology Segment Total revenue 620.9 620.9 Gross profit 314.2 (0.7) 314.9 % of revenue 50.6% 50.7% Operating income 44.3 (6.6) 50.9 % of revenue 7.1% 8.2% Total Company Total revenue 2,851.0 2,851.0 Gross profit 758.6 (33.3) 791.9 % of revenue 26.6% 27.8% Operating income 81.7 (47.0) 128.7 % of revenue 2.9% 4.5%
  • 10. UNISYS CORPORATION RECONCILATION OF GAAP TO NON-GAAP FORWARD-LOOKING ESTIMATED EARNINGS (LOSS) PER SHARE Three Twelve Months Months Ending Ending 9/30/2005 12/31/2005 ---------- ---------- Earnings (loss) per share- on a GAAP basis (.05)-(.03) (.03)-.02 Add back estimated pension expense, net of tax .09 .36 --------- --------- Earnings per share- on a NON-GAAP basis (excluding pension expense) .04 - .06 .33 -.38 ========= ========= NOTE: See section in press release entitled quot;Forward-Looking Statementsquot;.