SlideShare a Scribd company logo
1 of 60
Download to read offline
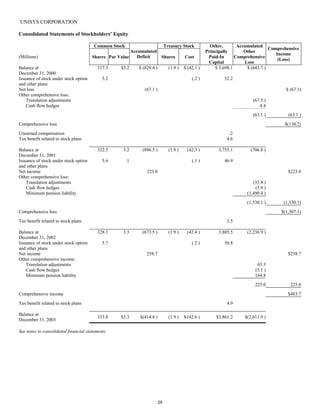
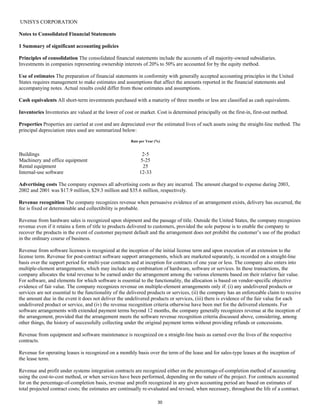
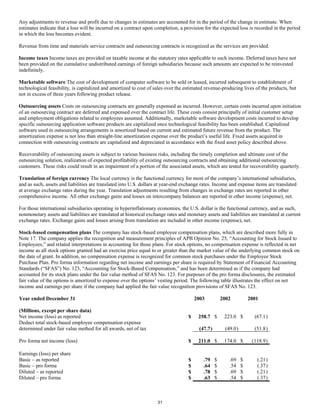
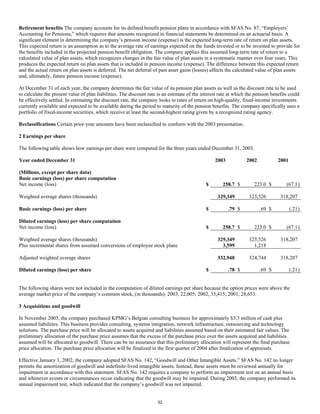
SECURITIES AND EXCHANGE COMMISSION
                                                        WASHINGTON, D.C. 20549

                                                                 FORM 10-K
(Mark One)

x ANNUAL REPORT PURSUANT TO SECTION 13 OR 15(d) OF THE SECURITIES EXCHANGE
 ACT OF 1934

For the fiscal year ended December 31, 2003

                                                                              OR


¨ TRANSITION REPORT PURSUANT TO SECTION 13 OR 15(d) OF THE SECURITIES
  EXCHANGE ACT OF 1934

For the transition period from             to                .

                                                         Commission file number: 1-8729


                                 UNISYS CORPORATION
                                                      (Exact name of registrant as specified in its charter)


                                              Delaware                                                                 38-0387840
                                       (State or other jurisdiction                                                   (I.R.S. Employer

                                   of incorporation or organization)                                                  Identification No.)
                         Unisys Way, Blue Bell, Pennsylvania                                                               19424
                                 (Address of principal executive offices)                                                (Zip Code)


                             Registrant’s telephone number, including area code: (215) 986-4011

                                      Securities registered pursuant to Section 12(b) of the Act:


                                       Title of each class                                    Name of each exchange on which registered

                         Common Stock, par value $.01                                            New York Stock Exchange
                        Preferred Share Purchase Rights                                          New York Stock Exchange


                                                                                1
Securities registered pursuant to Section 12(g) of the Act: None

Indicate by check mark whether the registrant (1) has filed all reports required to be filed by Section 13 or 15(d) of the Securities
Exchange Act of 1934 during the preceding 12 months (or for such shorter period that the registrant was required to file such reports),
and (2) has been subject to such filing requirements for the past 90 days. YES x NO ¨

Indicate by check mark if disclosure of delinquent filers pursuant to Item 405 of Regulation S-K is not contained herein, and will not
be contained, to the best of registrant’s knowledge, in definitive proxy or information statements incorporated by reference in Part III
of this Form 10-K or any amendment to this Form 10-K. ¨

Indicate by check mark whether the registrant is an accelerated filer (as defined in Exchange Act Rule 12b-2). YES x NO ¨

Aggregate market value of the voting and non-voting common equity held by non-affiliates as of the last business day of the
registrant’s most recently completed second fiscal quarter: approximately $4.0 billion.

The amount shown is based on the closing price of Unisys Common Stock as reported on the New York Stock Exchange composite
tape on June 30, 2003. Voting stock beneficially held by officers and directors is not included in the computation. However, Unisys
Corporation has not determined that such individuals are “affiliates” within the meaning of Rule 405 under the Securities Act of 1933.

Number of shares of Unisys Common Stock, par value $.01, outstanding as of December 31, 2003: 331,780,105.

                                       DOCUMENTS INCORPORATED BY REFERENCE

Portions of the Unisys Corporation 2003 Annual Report to Stockholders — Part I, Part II and Part IV.

Portions of the Unisys Corporation Proxy Statement for the 2004 Annual Meeting of Stockholders — Part III.


                                                                    2
PART I

ITEM 1. BUSINESS

Unisys Corporation (“Unisys” or the “Company”) is a worldwide information technology services and solutions company that
combines expertise in systems integration and consulting, outsourcing, infrastructure and high-end server technology to help clients
achieve competitive advantage.

Unisys has two business segments — Services and Technology. Financial information concerning the two segments is set forth in
Note 16, “Segment information”, of the Notes to Consolidated Financial Statements appearing in the Unisys 2003 Annual Report to
Stockholders, and such information is incorporated herein by reference.

The principal executive offices of Unisys are located at Unisys Way, Blue Bell, Pennsylvania 19424.

Principal Products and Services

Unisys provides services and technology to commercial businesses and governments throughout most of the world.

In the Services segment, Unisys provides end-to-end services and solutions designed to help clients improve their competitiveness and
efficiency in the global marketplace. The Unisys portfolio of solutions and services includes systems integration and consulting;
outsourcing, including the management of a customer’s internal information systems and management of specific business processes,
such as check processing, insurance claims processing, health claims processing, mortgage administration and cargo management;
infrastructure services involving the design and support of customers’ IT infrastructure, including desktops, servers, mobile and
wireless systems, and networks; enterprise-wide security solutions to protect systems, networks, applications and data; and core
maintenance (maintenance on Unisys proprietary products).

In the Technology segment, Unisys develops servers and related products that operate in transaction-intensive, mission-critical
environments. Major offerings include enterprise-class servers based on the Unisys Cellular MultiProcessing architecture, such as the
ClearPath Plus family of servers, which integrates proprietary and “open” platforms, and the ES7000 family of servers, which provide
enterprise-class attributes on Intel-based servers; operating system software and middleware to power high-end servers; and
specialized technologies such as payment systems, chip testing and third-party products.

The primary vertical markets Unisys serves worldwide include financial services, communications, transportation, commercial, and
public sector, including the U.S. federal government.

Products and services are marketed primarily through a direct sales force. In certain foreign countries, Unisys markets primarily
through distributors.

Materials

Unisys purchases components and supplies from a number of suppliers around the world. For certain technology products, the
Company relies on a single or limited number of suppliers, although the Company makes every effort to assure that alternative sources
are available if the need arises. The failure of the Company’s suppliers to deliver components and supplies in sufficient quantities and
in a timely manner could adversely affect the Company’s business.

Patents, Trademarks and Licenses

Unisys owns many domestic and foreign patents relating to the design and manufacture of its products, has granted licenses under
certain of its patents to others and is licensed under the patents of others. Unisys does not believe that its business is materially
dependent upon any single patent or license or related group thereof. Trademarks and service marks used on or in connection with
Unisys products and services are considered to be valuable assets of Unisys.

Seasonality

The Company’s revenue is affected by such factors as the introduction of new products and services, the length of sales cycles and the
seasonality of purchases. Seasonality has generally resulted in higher fourth quarter revenue than in other quarters.

Customers

No single customer accounts for more than 10% of Unisys revenue. Sales of commercial products and services to various agencies of
the U.S. government represented 15% of total consolidated revenue in 2003.

                                                                    3
Backlog

In the Services segment, firm order backlog at December 31, 2003 was $6.4 billion, compared to $6.0 billion at December 31, 2002.
Approximately $2.4 billion (37%) of 2003 backlog is expected to be filled in 2004. Although the Company believes that this backlog
is firm, the Company may, for commercial reasons, allow the orders to be cancelled, with or without penalty. In addition, funded
government contracts included in this backlog are generally subject to termination, in whole or part, at the convenience of the
government or if funding becomes unavailable. In such cases, the Company is generally entitled to receive payment for work
completed plus allowable termination or cancellation costs.

At the end of 2003, the Company also had $2.6 billion of potential future Services order value which it may receive under certain
multi-year U.S. government contracts for which funding is appropriated annually. The comparable value of unfunded multi-year U.S.
government contracts at the end of 2002 was $3.0 billion.

Because of the relatively short cycle between order and shipment in its Technology segment, the Company believes that backlog
information for this segment is not material to the understanding of its business.

Competition

Unisys business is affected by rapid change in technology in the information services and technology industries and aggressive
competition from many domestic and foreign companies. Principal competitors are systems integrators, consulting and other
professional services firms, outsourcing providers, infrastructure services providers, computer hardware manufacturers and software
providers. Unisys competes primarily on the basis of service, product performance, technological innovation, and price. Unisys
believes that its continued investment in engineering and research and development, coupled with its marketing capabilities, will have
a favorable impact on its competitive position.

Research and Development

Unisys-sponsored research and development costs were $280.1 million in 2003, $273.3 million in 2002, and $331.5 million in 2001.

Environmental Matters

Capital expenditures, earnings and the competitive position of Unisys have not been materially affected by compliance with federal,
state and local laws regulating the protection of the environment. Capital expenditures for environmental control facilities are not
expected to be material in 2004 and 2005.

Employees

As of December 31, 2003, Unisys had approximately 37,300 employees.

Unisys uses the title “partner” for certain members of its services business management. In using the term “partner” or “partners,”
Unisys does not mean to imply that these individuals are partners in the legal sense or to imply any intention to create a separate legal
entity, such as a partnership.

International and Domestic Operations

Financial information by geographic area is set forth in Note 16, “Segment information”, of the Notes to Consolidated Financial
Statements appearing in the Unisys 2003 Annual Report to Stockholders, and such information is incorporated herein by reference.

Available Information

Unisys makes available, free of charge through its Internet web site at http://www.unisys.com/about__unisys/investors, its annual
report on Form 10-K, quarterly reports on Form 10-Q, current reports on Form 8-K, and amendments to those reports filed or
furnished pursuant to Section 13(a) or 15(d) of the Securities Exchange Act of 1934, as soon as reasonably practicable after such
material is electronically filed with or furnished to the SEC.

Unisys also makes available on its Internet website its Guidelines on Significant Corporate Governance Issues, the charters of the
Audit Committee, Compensation Committee, Finance Committee, and Nominating and Corporate Governance Committee of its board
of directors, and its Code of Ethics and Business Conduct. Such information is also available in print to stockholders upon request.


                                                                    4
ITEM 2. PROPERTIES

As of December 31, 2003 , Unisys had 26 major facilities in the United States with an aggregate floor space of approximately 5.5
million square feet, located primarily in California, Georgia, Illinois, Michigan, Minnesota, Pennsylvania, Utah and Virginia. Three of
these facilities, with aggregate floor space of approximately 1.5 million square feet, were owned by Unisys and 23 , with
approximately 4.0 million square feet of floor space, were leased to Unisys. Approximately 4.9 million square feet of the U.S.
facilities were in current operation, approximately .4 million square feet were subleased to others, and approximately .2 million square
feet were being held in reserve or were declared surplus with disposition efforts in progress.

As of December 31, 2003 , Unisys had 24 major facilities outside the United States with an aggregate floor space of approximately 2.5
million square feet, located primarily in Australia, Brazil, France, Germany, Netherlands, South Africa, Switzerland and the United
Kingdom. Five of these facilities, with approximately .7 million square feet of floor space, were owned by Unisys and 19 , with
approximately 1.8 million square feet of floor space, were leased to Unisys. Approximately 1.9 million square feet were in current
operation, approximately .3 million square feet were subleased to others, and approximately .3 million square feet were being held in
reserve or were declared surplus with disposition efforts in progress.

Unisys major facilities include offices, laboratories, centers of excellence, manufacturing plants, warehouses, and distribution and
sales centers. Unisys believes that its facilities are suitable and adequate for current and presently projected needs. Unisys
continuously reviews its anticipated requirements for facilities and will from time to time acquire additional facilities, expand existing
facilities, and dispose of existing facilities or parts thereof, as necessary.

ITEM 3. LEGAL PROCEEDINGS

As of the date of filing of this report, Unisys has no material legal proceedings required to be disclosed under this Item 3.

ITEM 4. SUBMISSION OF MATTERS TO A VOTE OF SECURITY HOLDERS

No matters were submitted to a vote of security holders of Unisys during the fourth quarter of 2003.

ITEM 10. EXECUTIVE OFFICERS OF THE REGISTRANT

Information concerning the executive officers of Unisys as of February 1, 2004 is set forth below.

Name                             Age       Position with Unisys

Lawrence A. Weinbach              64       Chairman of the Board, President and Chief Executive Officer
George R. Gazerwitz               63       Executive Vice President; President, Systems and Technology
Joseph W. McGrath                 51       Executive Vice President; President, Enterprise Transformation Services
David O. Aker                     57       Senior Vice President, Worldwide Human Resources
Richard D. Badler                 53       Senior Vice President, Corporate Communications
Janet Brutschea Haugen            45       Senior Vice President and Chief Financial Officer
Nancy Straus Sundheim             52       Senior Vice President, General Counsel and Secretary
Janet B. Wallace                  52       Senior Vice President; President, Global Infrastructure Services
Leigh Alexander                   46       Vice President and Chief Marketing Officer
Scott A. Battersby                45       Vice President and Treasurer
Leo C. Daiuto                     58       Vice President, Product Development and Technology
Jack F. McHale                    54       Vice President, Investor Relations
Carol S. Sabochick                43       Vice President and Corporate Controller

There is no family relationship among any of the above-named executive officers. The By-Laws provide that the officers of Unisys
shall be elected annually by the Board of Directors and that each officer shall hold office for a term of one year and until a successor is
elected and qualified, or until the officer’s earlier resignation or removal.

Mr. Weinbach, Chairman of the Board, President and Chief Executive Officer since 1997. Prior to that time, he held the position of
Managing Partner-Chief Executive of Andersen Worldwide (Arthur Andersen and Andersen Consulting), a global professional
services organization. He had been with Andersen Worldwide since 1961. Mr. Weinbach has been an officer since 1997.

Mr. Gazerwitz, Executive Vice President and President, Systems and Technology since 2000. Prior to that time, he served as
Executive Vice President and President of the Computer Systems Group (1996-1999). Mr. Gazerwitz has been an officer since 1984.


                                                                     5
Mr. McGrath, Executive Vice President and President, Enterprise Transformation Services since 2000. During 1999, he served as
Senior Vice President of Major Accounts Sales and Chief Marketing Officer. Prior to joining Unisys in 1999, he was with Xerox
Corporation from 1988 until 1998, serving as vice president and general manager of its Production Color Systems unit and as vice
president of strategy and integration for the Production Systems division. Mr. McGrath has been an officer since 1999.

Mr. Aker, Senior Vice President, Worldwide Human Resources since 1997. Prior to that time, he served as Vice President, Worldwide
Human Resources (1995-1997). Mr. Aker has been an officer since 1995.

Mr. Badler, Senior Vice President, Corporate Communications since 2002. From 1998 to 2002, he served as Vice President, Corporate
Communications. Prior to joining Unisys, he was Vice President, Corporate Communications for General Instrument Corporation
(1996-1998). Mr. Badler has been an officer since 1998.

Ms. Haugen, Senior Vice President and Chief Financial Officer since 2000. Prior to that time, she served as Vice President and
Controller and Acting Chief Financial Officer (1999-2000) and Vice President and Controller (1996-1999). Ms. Haugen has been an
officer since 1996.

Ms. Sundheim, Senior Vice President, General Counsel and Secretary since 2001. From 1999 to 2001, she was Vice President, Deputy
General Counsel and Secretary. She had been Deputy General Counsel since 1990. Ms. Sundheim has been an officer since 1999.

Ms. Wallace, Senior Vice President and President, Global Infrastructure Services since 2000. Ms. Wallace joined Unisys in 1999 as
Vice President and President, Global Network Services. Prior to that, she was Vice President of Services Marketing and Sales,
Compaq Computer Corporation (1998-1999); and Vice President of Marketing and Services, Digital Equipment Corporation (1993-
1998). Ms. Wallace has been an officer since 2000.

Ms. Alexander, Vice President and Chief Marketing Officer since 2000. Prior to joining Unisys in 2000, she was with Comdial
Corporation from 1998 serving as president, Comdial Enterprise Solutions and as Senior Vice President, Marketing. Before that, Ms.
Alexander was Senior Vice President, Marketing and Strategic Planning at PageNet Corporation (1996-1997). Ms. Alexander has
been an officer since 2000.

Mr. Battersby, Vice President and Treasurer since 2000. Prior to that time, he served as vice president of corporate strategy and
development (1998-2000); and vice president and Assistant Treasurer (1996-1998). Mr. Battersby has been an officer since 2000.

Mr. Daiuto, Vice President, Product Development and Technology since 2000. Prior to that time, he had held a variety of business and
engineering management positions with Unisys since he joined the Company in 1970. Mr. Daiuto has been an officer since 2000.

Mr. McHale, Vice President, Investor Relations since 1997. From 1989 to 1997, he was Vice President, Investor and Corporate
Communications. Mr. McHale has been an officer since 1986.

Ms. Sabochick, Vice President and Corporate Controller since 2002. Prior to joining Unisys, she was with Safeguard Global Services
serving as Chief Financial Officer (2001), and with AstraMerck Pharmaceuticals (1995-2000) serving as Controller. Prior to
AstraMerck, she was with PricewaterhouseCoopers for 11 years. Ms. Sabochick has been an officer since 2002.


                                                                  6
PART II

ITEM 5. MARKET FOR THE REGISTRANT’S COMMON EQUITY AND RELATED STOCKHOLDER MATTERS

Unisys Common Stock (trading symbol “UIS”) is listed for trading on the New York Stock Exchange, on exchanges in Amsterdam,
Brussels, and London and on the SWX Swiss Exchange. Information on the high and low sales prices for Unisys Common Stock is set
forth under the heading “Quarterly financial information” in the Unisys 2003 Annual Report to Stockholders and is incorporated
herein by reference. At December 31, 2003 , there were 331.8 million shares outstanding and approximately 26,300 stockholders of
record. Unisys has not declared or paid any cash dividends on its Common Stock since 1990 and does not anticipate declaring or
paying cash dividends in the foreseeable future.

ITEM 6. SELECTED FINANCIAL DATA

A summary of selected financial data for Unisys is set forth under the heading “Five-year summary of selected financial data” in the
Unisys 2003 Annual Report to Stockholders and is incorporated herein by reference.

ITEM 7. MANAGEMENT’S DISCUSSION AND ANALYSIS OF FINANCIAL CONDITION AND RESULTS OF
OPERATIONS

Management’s discussion and analysis of financial condition and results of operations is set forth under the heading “Management’s
Discussion and Analysis of Financial Condition and Results of Operations” in the Unisys 2003 Annual Report to Stockholders and is
incorporated herein by reference.

ITEM 7A. QUANTITATIVE AND QUALITATIVE DISCLOSURES ABOUT MARKET RISK

Information concerning market risk is set forth under the heading “Market risk” in “Management’s Discussion and Analysis of
Financial Condition and Results of Operations” in the Unisys 2003 Annual Report to Stockholders and is incorporated herein by
reference.

ITEM 8. FINANCIAL STATEMENTS AND SUPPLEMENTARY DATA

The financial statements of Unisys, consisting of the consolidated balance sheets at December 31, 2003 and 2002 and the related
consolidated statements of income, cash flows and stockholders’ equity for each of the three years in the period ended December 31,
2003, appearing in the Unisys 2003 Annual Report to Stockholders, together with the report of Ernst & Young LLP, independent
auditors, on the financial statements at December 31, 2003 and 2002 and for each of the three years in the period ended December 31 ,
2003, appearing in the Unisys 2003 Annual Report to Stockholders, are incorporated herein by reference. Supplementary financial
data, consisting of information appearing under the heading “Quarterly financial information” in the Unisys 2003 Annual Report to
Stockholders, is incorporated herein by reference.

ITEM 9. CHANGES IN AND DISAGREEMENTS WITH ACCOUNTANTS ON ACCOUNTING AND FINANCIAL
DISCLOSURE

Not applicable.

ITEM 9A. CONTROLS AND PROCEDURES

The Company’s management, with the participation of the Company’s Chief Executive Officer and Chief Financial Officer, has
evaluated the effectiveness of the Company’s disclosure controls and procedures as of December 31, 2003. Based on this evaluation,
the Company’s Chief Executive Officer and Chief Financial Officer concluded that the Company’s disclosure controls and procedures
are effective for gathering, analyzing and disclosing the information the Company is required to disclose in the reports it files under
the Securities Exchange Act of 1934, within the time periods specified in the SEC’s rules and forms. Such evaluation did not identify
any change in the Company’s internal controls over financial reporting that occurred during the quarter ended December 31, 2003 that
has materially affected, or is reasonably likely to materially affect, the Company’s internal control over financial reporting.


                                                                   7
PART III

ITEM 10. DIRECTORS AND EXECUTIVE OFFICERS OF THE REGISTRANT

(a) Identification of Directors. Information concerning the directors of Unisys is set forth under the headings “Nominees for Election
to the Board of Directors”, “Members of the Board of Directors Continuing in Office — Term Expiring in 2005” and “Members of the
Board of Directors Continuing in Office — Term Expiring in 2006” in the Unisys Proxy Statement for the 2004 Annual Meeting of
Stockholders and is incorporated herein by reference.

(b) Identification of Executive Officers. Information concerning executive officers of Unisys is set forth under the caption
“EXECUTIVE OFFICERS OF THE REGISTRANT” in Part I, Item 10, of this report.

(c) Audit Committee Financial Experts. Information concerning audit committee financial experts is set forth under the heading
“Committees” in the Unisys Proxy Statement for the 2004 Annual Meeting of Stockholders and is incorporated herein by reference.

(d) Identification of the Audit Committee. Information concerning the audit committee of Unisys is set forth under the heading
“Committees” in the Unisys Proxy Statement for the 2004 Annual Meeting of Stockholders and is incorporated herein by reference.

(e) Section 16(a) Beneficial Ownership Reporting Compliance. Information concerning compliance with beneficial ownership
reporting requirements is set forth under the caption “Section 16(a) Beneficial Ownership Reporting Compliance” in the Unisys Proxy
Statement for the 2004 Annual Meeting of Stockholders and is incorporated herein by reference.

(f) Code of Ethics.
Information concerning the Unisys Code of Ethics and Business Conduct is set forth under the caption “Code of Ethics and Business
Conduct” in the Unisys Proxy Statement for the 2004 Annual Meeting of Stockholders and is incorporated herein by reference.

ITEM 11. EXECUTIVE COMPENSATION

Information concerning executive compensation is set forth under the headings “EXECUTIVE COMPENSATION”, “REPORT OF
THE COMPENSATION COMMITTEE” and “STOCK PERFORMANCE GRAPH” in the Unisys Proxy Statement for the 2004
Annual Meeting of Stockholders and is incorporated herein by reference.

ITEM 12. SECURITY OWNERSHIP OF CERTAIN BENEFICIAL OWNERS AND MANAGEMENT AND RELATED
STOCKHOLDER MATTERS

Information concerning securities authorized for issuance under equity compensation plans is set forth under the heading “EQUITY
COMPENSATION PLAN INFORMATION” in the Unisys Proxy Statement for the 2004 Annual Meeting of Stockholders and is
incorporated herein by reference.

Information concerning shares of Unisys equity securities beneficially owned by certain beneficial owners and by management is set
forth under the heading “SECURITY OWNERSHIP BY CERTAIN BENEFICIAL OWNERS AND MANAGEMENT” in the Unisys
Proxy Statement for the 2004 Annual Meeting of Stockholders and is incorporated herein by reference.

ITEM 13. CERTAIN RELATIONSHIPS AND RELATED TRANSACTIONS

Information concerning certain relationships and related transactions is set forth under the heading “EXECUTIVE COMPENSATION
- Transactions with Management” in the Unisys Proxy Statement for the 2004 Annual Meeting of Stockholders and is incorporated
herein by reference.

ITEM 14. PRINCIPAL ACCOUNTANT FEES AND SERVICES

Information concerning fees and services of the Company’s principal accountants is set forth under the heading “Relationship with
Independent Auditors” in the Unisys Proxy Statement for the 2004 Annual Meeting of Stockholders and is incorporated herein by
reference.


                                                                    8
PART IV

ITEM 15. EXHIBITS, FINANCIAL STATEMENT SCHEDULES, AND REPORTS ON FORM 8-K

(a) The following documents are filed as part of this report:

1. Financial Statements from the Unisys 2003 Annual Report to Stockholders which are incorporated herein by reference:


Consolidated Balance Sheets at December 31, 2003 and December 31, 2002
Consolidated Statements of Income for each of the three years in the period ended December 31, 2003
Consolidated Statements of Cash Flows for each of the three years in the period ended December 31, 2003
Consolidated Statements of Stockholders’ Equity for each of the three years in the period ended December 31, 2003
Notes to Consolidated Financial Statements
Report of Independent Auditors

2. Financial Statement Schedules filed as part of this report pursuant to Item 8 of this report:


                            Schedule                                                               Form 10-K
                            Number                                                                  Page No.

                            II             Valuation and Qualifying Accounts                          11


The financial statement schedule should be read in conjunction with the consolidated financial statements and notes thereto in the
Unisys 2003 Annual Report to Stockholders. Financial statement schedules not included with this report have been omitted because
they are not applicable or the required information is shown in the consolidated financial statements or notes thereto.

Separate financial statements of subsidiaries not consolidated with Unisys and entities in which Unisys has a fifty percent or less
ownership interest have been omitted because these operations do not meet any of the conditions set forth in Rule 3-09 of Regulation
S-X.

3. Exhibits. Those exhibits required to be filed by Item 601 of Regulation S-K are listed in the Exhibit Index included in this report at
pages 12 through 13 Management contracts and compensatory plans and arrangements are listed as Exhibits 10.1 through 10.20.

(b) Reports on Form 8-K.

On October 15, 2003, Unisys furnished a Current Report on Form 8-K to provide, under Items 7 and 12, the Company’s earnings
release reporting its financial results for the quarter ended September 30, 2003. Such information shall not be deemed “filed” for
purposes of Section 18 of the Securities Exchange Act of 1934.


                                                                     9
SIGNATURES

Pursuant to the requirements of Section 13 or 15(d) of the Securities Exchange Act of 1934, the registrant has duly caused this report
to be signed on its behalf by the undersigned, thereunto duly authorized.


                          UNISYS CORPORATION
                          By:      /s/ Lawrence A. Weinbach
Date:   February 17,                 Lawrence A. Weinbach
        2004
                                         Chairman of the Board,

                                         President and Chief

                                         Executive Officer


Pursuant to the requirements of the Securities Exchange Act of 1934, this report has been signed below by the following persons on
behalf of the registrant and in the capacities indicated on February 17, 2004.


/s/ Lawrence A. Weinbach                                                                                     *Henry C. Duques
  Lawrence A. Weinbach                                                                                       Henry C. Duques

 Chairman of the Board, President and Chief Executive Officer (principal executive officer) and              Director
Director
                                                                                                             *Denise K. Fletcher
                                                                                                             Denise K. Fletcher
                                                                                                             Director
/s/ Janet Brutschea Haugen                                                                                   *Gail D. Fosler
  Janet Brutschea Haugen                                                                                     Gail D. Fosler
  Senior Vice President and Chief Financial Officer (principal financial officer)                            Director


                                                                                                             Melvin R. Goodes
/s/ Carol S. Sabochick                                                                                       Director
  Carol S. Sabochick                                                                                         *Edwin A. Huston

 Vice President and Corporate Controller (principal accounting officer)
                                                                                                             Edwin A. Huston
                                                                                                             Director
                                                                                                             Clayton M. Jones
                                                                                                             Director
*J. P. Bolduc                                                                                                *Theodore E. Martin
  J. P. Bolduc                                                                                               Theodore E. Martin
  Director                                                                                                   Director
*James J. Duderstadt                                                                                    *By: /s/ Lawrence A.
                                                                                                             Weinbach
 James J. Duderstadt                                                                                         Lawrence A. Weinbach
 Director                                                                                                    Attorney-in-Fact


                                                                   10
UNISYS CORPORATION

                                 SCHEDULE II - VALUATION AND QUALIFYING ACCOUNTS

                                                      (Millions)


Description                                                                     Additions                    Balance
                                                              Balance at
                                                                                Charged       Deductions     at End
                                                              Beginning
                                                                                 to Costs        (1)        of Period
                                                              of Period
                                                                              and Expenses

Allowance for Doubtful Accounts
(deducted from accounts and notes receivable):

Year Ended                                                         $   48.3       $    23.6      $ (21.3)      $    50.6
December 31, 2001

Year Ended                                                         $   50.6       $    23.9      $ (12.7)      $    61.8
December 31, 2002

Year Ended                                                         $   61.8       $      .6      $ (12.6)      $    49.8
December 31, 2003


(1) Write-off of bad debts less recoveries.


                                                         11
EXHIBIT INDEX

Exhibit                                                            Description
Number
3.1       Restated Certificate of Incorporation of Unisys Corporation (incorporated by reference to Exhibit 3.1 to the registrant’s
          Quarterly Report on Form 10-Q for the quarterly period ended September 30, 1999)
3.3       By-Laws of Unisys Corporation (incorporated by reference to Exhibit 3.3 to the registrant’s Annual Report on Form 10-K for
          the year ended December 31, 2001)
4.1       Agreement to furnish to the Commission on request a copy of any instrument defining the rights of the holders of long-term
          debt which authorizes a total amount of debt not exceeding 10% of the total assets of the registrant (incorporated by reference
          to Exhibit 4 to the registrant’s Annual Report on Form 10-K for the year ended December 31, 1982 (File No. 1-145))
4.2       Form of Rights Agreement dated as of March 7, 1986, which includes as Exhibit A, the Certificate of Designations for the
          Junior Participating Preferred Stock, and as Exhibit B, the Form of Rights Certificate (incorporated by reference to Exhibit 1
          to the registrant’s Registration Statement on Form 8-A, dated March 11, 1986)
4.3       Amendment No. 1, dated as of February 22, 1996, to Rights Agreement (incorporated by reference to Exhibit 4 to the
          registrant’s Current Report on Form 8-K dated February 22, 1996)
4.4       Amendment No. 2, dated as of December 7, 2000, to Rights Agreement (incorporated by reference to Exhibit 4 to the
          registrant’s Current Report on Form 8-K dated December 7, 2000)
10.1      Unisys Corporation Deferred Compensation Plan as amended and restated effective September 22, 2000 (incorporated by
          reference to Exhibit 10.3 to the registrant’s Quarterly Report on Form 10-Q for the quarterly period ended September 30,
          2000)
10.2      Deferred Compensation Plan for Directors of Unisys Corporation, as amended and restated effective September 22, 2000
          (incorporated by reference to Exhibit 10.4 to the registrant’s Quarterly Report on Form 10-Q for the quarterly period ended
          September 30, 2000)
10.3      Unisys Corporation Director Stock Unit Plan, as amended and restated, effective September 22, 2000 (incorporated by
          reference to Exhibit 10.5 to the registrant’s Quarterly Report on Form 10-Q for the quarterly period ended September 30,
          2000)
10.4      Unisys Directors Stock Option Plan, as amended and restated effective September 22, 2000 (incorporated by reference to
          Exhibit 10.2 to the registrant’s Quarterly Report on Form 10-Q for the quarterly period ended September 30, 2000)
10.5      Unisys Executive Annual Variable Compensation Plan (incorporated by reference to Exhibit A to the registrant’s Proxy
          Statement, dated March 23, 1993, for its 1993 Annual Meeting of Stockholders)
10.6      1990 Unisys Long-Term Incentive Plan, as amended and restated effective September 22, 2000 (incorporated by reference to
          Exhibit 10.1 to the registrant’s Quarterly Report on Form 10-Q for the quarterly period ended September 30, 2000)
10.7      Unisys Corporation Executive Life Insurance Program (incorporated by reference to Exhibit 10.1 to the registrant’s Quarterly
          Report on Form 10-Q for the quarterly period ended June 30, 1999)
10.8      Form of Indemnification Agreement between Unisys Corporation and each of its Directors (incorporated by reference to
          Exhibit B to the registrant’s Proxy Statement, dated March 22, 1988, for the 1988 Annual Meeting of Stockholders)
10.9      Form of Executive Employment Agreement (incorporated by reference to Exhibit 10.1 to the registrant’s Quarterly Report on
          Form 10-Q for the quarterly period ended June 30, 1995)
10.10     Employment Agreement, dated April 25, 2002 between the registrant and Lawrence A. Weinbach (incorporated by reference
          to Exhibit 10 to the registrant’s Quarterly Report on Form 10-Q for the quarterly period ended March 31, 2002)
10.11     Amendment dated July 25, 2002, to Employment Agreement between the registrant and Lawrence A. Weinbach (incorporated
          by reference to Exhibit 10.2 to the registrant’s Quarterly Report on Form 10-Q for the quarterly period ended June 30, 2002)
10.12     Letter Agreement, dated June 3, 2002, between Unisys Corporation and Joseph W. McGrath (incorporated by reference to
          Exhibit 10.1 to the registrant’s Quarterly Report on Form 10-Q for the quarterly period ended June 30, 2002)
10.13     Unisys Corporation Supplemental Executive Retirement Income Plan, as amended through May 22, 1997 (incorporated by
          reference to Exhibit 10.3 to the registrant’s Quarterly Report on Form 10-Q for the quarterly period ended June 30, 1997)
10.14     Amendment 2001-1 to the Unisys Corporation Supplemental Executive Retirement Income Plan (incorporated by reference to
          Exhibit 10.13 to the registrant’s Annual Report on Form 10-K for the year ended December 31, 2001)


                                                                    12
10.15   Summary of supplemental executive benefits provided to officers of Unisys Corporation (incorporated by reference to Exhibit
        10.14 to the registrant’s Annual Report on Form 10-K for the year ended December 31, 2001)
10.16   Unisys Corporation Elected Officer Pension Plan, as amended through July 19, 2001 (incorporated by reference to Exhibit
        10.15 to the registrant’s Annual Report on Form 10-K for the year ended December 31, 2001)
10.17   Unisys Corporation 2002 Stock Option Plan (incorporated by reference to Exhibit 10.17 to the registrant’s Annual Report on
        Form 10-K for the year ended December 31, 2002)
10.18   Unisys Corporation Employee Stock Purchase Plan, as amended and restated February 13, 2003 (incorporated by reference to
        Appendix C to the registrant’s Proxy Statement, dated March 14, 2003, for its 2003 Annual Meeting of Stockholders)
10.19   Unisys Corporation Savings Plan, amended and restated effective January 1, 2002 (incorporated by reference to Exhibit 10.19
        to the registrant’s Annual Report on Form10-K for the year ended December 31, 2002)
10.20   Unisys Corporation 2003 Long-Term Incentive and Equity Compensation Plan (incorporated by reference to Appendix B to
        the registrant’s Proxy Statement, dated March 14, 2003, for its 2003 Annual Meeting of Stockholders)
12      Computation of Ratio of Earnings to Fixed Charges
13      Portions of the Annual Report to Stockholders of the Registrant for the year ended December 31, 2003
21      Subsidiaries of the Registrant
23      Consent of Independent Auditors
24      Power of Attorney
31.1    Certification of Lawrence A. Weinbach required by Rule 13a-14(a) or Rule 15d-14(a)
31.2    Certification of Janet Brutschea Haugen required by Rule 13a-14(a) or Rule 15d-14(a)
32.1    Certification of Lawrence A. Weinbach required by Rule 13a-14(b) or Rule 15d-14(b) and Section 906 of the Sarbanes-Oxley
        Act of 2002, 18 U.S.C. Section 1350
32.2    Certification of Janet Brutschea Haugen required by Rule 13a-14(b) or Rule 15d-14(b) and Section 906 of the Sarbanes-Oxley
        Act of 2002, 18 U.S.C. Section 1350


                                                               13
Exhibit 12

                                                       UNISYS CORPORATION

                        COMPUTATION OF RATIO OF EARNINGS TO FIXED CHARGES (UNAUDITED)

                                                           ($ in millions)


                                                                                           Years Ended December 31

                                                                             2003          2002          2001          2000          1999

Fixed charges
Interest expense                                                      $      69.6      $    66.5     $    70.0     $    79.8     $   127.8
Interest capitalized during the period                                       14.5           13.9          11.8          11.4           3.6
Amortization of debt issuance expenses                                        3.8            2.6           2.7           3.2           4.1
Portion of rental expense representative of interest                         55.2           53.0          53.9          42.2          46.3

Total Fixed Charges                                                       143.1            136.0         138.4         136.6         181.8

Earnings
Income (loss) from continuing operations before income taxes              380.5            332.8         (46.5 )       379.0         770.3
Add (deduct) the following:
Share of loss (income) of associated companies                               (16.2 )        14.2          (8.6 )       (20.5 )         8.9
Amortization of capitalized interest                                          10.2           8.8           5.4           2.2           —

Subtotal                                                                  374.5            355.8         (49.7 )       360.7         779.2

Fixed charges per above                                                   143.1            136.0         138.4         136.6         181.8
Less interest capitalized during the period                               (14.5 )          (13.9 )       (11.8 )       (11.4 )        (3.6 )

Total earnings (loss)                                                 $   503.1        $   477.9     $    76.9     $   485.9     $   957.4

Ratio of earnings to fixed charges                                           3.52           3.51             *          3.56          5.27


* Earnings for the year ended December 31, 2001 were inadequate to cover fixed charges by approximately $61.5 million.


                                                                 14
UNISYS CORPORATION

Management’s Discussion and Analysis of Financial Condition and Results of Operations

Overview

In recent years the company has undertaken a major repositioning of its business model, its portfolio and its employee skills set to
strengthen its capabilities as a services-led solutions provider. The objective of this repositioning is to capitalize on emerging growth
opportunities in the information technology (“IT”) services market and deliver consistent, profitable growth for its stockholders.

Recognizing the growing need in the marketplace for IT services and solutions that help clients reduce costs and enhance their
competitiveness, the company has pursued services opportunities in business process outsourcing, systems integration and consulting,
enterprise security, and other service areas. The company has grown its base of long-term outsourcing contracts that provide a reliable
base of annuity revenue over multiple years. Through recruiting and training efforts, the company has strengthened its skills and
capabilities in systems integration and consulting to capture higher-margin business opportunities in focused vertical industries. The
company has also strengthened its capabilities in enterprise security to capitalize on the growing need by organizations to enhance
their security profile against physical and electronic threats. In its technology business, the company has focused on high-end
enterprise server technology that offers attractive margins, while de-emphasizing low-end products where margins have been under
pressure due to technology commoditization. Across all of these areas, management has focused on improving its margins by pursuing
value-added business and by tightly controlling costs.

These efforts have enabled the company to deliver consistent financial results during a highly volatile period for the IT industry
overall. In 2003 the company reported strong growth in net income and earnings per share, building on its profit growth in 2002. The
company has achieved this earnings growth despite the impact of pension accounting, which has resulted in a significant decline in
pension income in 2003 and 2002. The company’s focus on value-added business and tight cost control has also resulted in a
substantial increase in operational cash flow in recent years. The company’s management has placed a strong emphasis on generating
cash flow, which resulted in significant operating cash flow in 2003.

In 2004, the company plans to maintain its focus on the areas discussed above and continue to build its capabilities as a leading
provider of value-added services and high-end server technology to the IT marketplace.

Results of operations

Company results

In 2003, the company reported net income of $258.7 million, or $.78 per diluted share, compared with $223.0 million, or $.69 per
share in 2002, and a net loss of $67.1 million, or $.21 per share, in 2001. The results for 2001 include a fourth-quarter pretax charge of
$276.3 million, or $.64 per share, principally for a work-force reduction. See Note 5 of the Notes to Consolidated Financial
Statements.

Revenue for 2003 was $5.91 billion compared with $5.61 billion in 2002 and $6.02 billion in 2001. Revenue in 2003 increased 5%
from the prior year. This increase was due to an increase of 9% in Services revenue offset in part by an 8% decline in Technology
revenue. Foreign currency fluctuations had a 4% positive impact on revenue in 2003 compared with 2002. Revenue in 2002 decreased
7% from the prior year. The decrease was due to a decline in Technology revenue of 16% as well as a 4% decline in Services revenue.
Foreign currency fluctuations had a negligible impact on revenue in 2002. Revenue from international operations in 2003, 2002 and
2001 was $3.15 billion, $3.11 billion and $3.42 billion, respectively. Revenue from U.S. operations was $2.76 billion in 2003, $2.50
billion in 2002 and $2.60 billion in 2001.

Total gross profit percent was 29.0% in 2003, 30.1% in 2002, and 24.6% in 2001. The decrease in gross profit percent in 2003
principally reflected a decline in pension income as described below. The increase in gross profit in 2002 from 2001 was principally
due to the company’s focus on higher value-added business opportunities and continued tight cost controls, including the personnel
reduction actions taken in 2001 and 2002.

Selling, general and administrative expenses were $1.01 billion in 2003 (17.0% of revenue), $.99 billion in 2002 (17.7% of revenue),
and $1.16 billion in 2001 (19.2% of revenue). The increase in 2003 from 2002 was principally due to lower pension income and
foreign currency translations, offset in part by continued tight cost controls. The decrease in 2002 from 2001, net of the impacts of the
fourth-quarter charge in 2001, reflected the benefits of the personnel reduction actions announced in the fourth quarter of 2001 and
continued tight cost controls.

Research and development (“R&D”) expenses in 2003 were $280.1 million compared with $273.3 million in 2002 and $331.5 million
in 2001. The company continues to invest in high-end Cellular MultiProcessing (CMP) server technology and in key programs within
its industry practices.

                                                                    15
In 2003, the company reported operating income of $427.7 million, or 7.2% of revenue, compared with operating income of $423.2
million, or 7.5% of revenue in 2002 and an operating loss of $4.5 million in 2001.

Interest expense was $69.6 million in 2003, $66.5 million in 2002 and $70.0 million in 2001. The increase in 2003 was due to higher
average borrowings. The decline in 2002 was principally due to lower average borrowings and lower average interest rates.

Other income (expense), net, which can vary from year to year, was income of $22.4 million in 2003, an expense of $23.9 million in
2002 and income of $1.5 million in 2001. The difference in 2003 from 2002 was principally due to equity income of $18.3 million in
2003 compared with a loss of $12.4 million in 2002. Specifically, in 2003 the company recognized $12.2 million income related to its
share of a subsidy recorded by Nihon Unisys, Ltd. (“NUL”) upon transfer of a portion of its pension plan obligation to the Japanese
government. In 2002, the company recognized a charge of $21.8 million related to its share of an early retirement charge recorded by
NUL. In addition in 2003, the company recorded $10.7 million of income related to minority investors’ share of losses of companies
owned 51% by the company, compared with $.3 million in 2002. Partially offsetting these items were foreign exchange losses in 2003
of $11.3 million compared with losses in 2002 of $1.2 million. The lower other income (expense), net in 2002 from 2001 was
principally due to foreign exchange losses of $1.2 million in 2002 compared with foreign exchange gains of $21.4 million in 2001
(principally due to Latin America), equity investment losses of $12.4 million in 2002 (principally due to the $21.8 million charge
relating to the NUL early retirement charge discussed above) compared with equity income of $10.4 million in 2001. In addition, in
2001, the company recorded a charge of $26.5 million related to the early extinguishment of debt.

Pension income for 2003 was $22.6 million compared with $143.5 million in 2002 and $170.0 million in 2001. At the beginning of
each year, accounting rules require that the company establish an expected long-term rate of return on its pension plan assets. The
principal reason for the decline in pension income in 2003 was that, effective January 1, 2003, the company reduced its expected long-
term rate of return on plan assets for its U.S. pension plan to 8.75% from 9.50%. In addition, the discount rate used for the U.S.
pension plan declined to 6.75% at December 31, 2002, from 7.50% at December 31, 2001. The remaining reasons for the decline in
pension income were lower expected return on U.S. plan assets due to asset declines and the company’s change as of January 1, 2003
to a cash balance plan in the U.S. Additionally for international plans, declines in discount rates, lower expected long-term rates of
return on plan assets, and currency translation contributed to lower pension income. The principal reason for the decline in pension
income in 2002 was that, effective January 1, 2002, the company reduced its expected long-term rate of return on plan assets for its
U.S. pension plan to 9.5% from 10.0%. The company records pension income or expense, as well as other employee-related costs such
as FICA and medical insurance costs, in operating income in the following income statement categories: cost of sales, selling, general
and administrative expenses, and research and development expenses. The amount allocated to each line is based on where the salaries
of the active employees are charged.

Income before income taxes in 2003 was $380.5 million compared with $332.8 million in 2002 and a loss of $73.0 million in 2001.

The provision for income taxes in 2003 was $121.8 million (32% effective tax rate) compared with $109.8 million (33% effective tax
rate) in 2002 and $(5.9) million in 2001. It is expected that the effective tax rate will be 32% for 2004.

At December 31, 2003, the company owned approximately 28% of the voting common stock of NUL. The company accounts for this
investment by the equity method. NUL is the exclusive supplier of the company’s hardware and software products in Japan. The
company considers its investment in NUL to be of a long-term strategic nature. For the years ended December 31, 2003, 2002 and
2001, total direct and indirect sales to NUL were approximately $275 million, $270 million and $340 million, respectively.

At December 31, 2003, the market value of the company’s investment in NUL was approximately $258 million and the amount of this
investment recorded on the company’s books was $152 million, which is net of $74 million relating to the company’s share of NUL’s
minimum pension liability adjustment. The market value is determined by both the quoted price per share of NUL’s shares on the
Tokyo stock exchange and the current exchange rate of the Japanese yen to the U.S. dollar. At any point in time, the company’s book
value may be higher or lower than the market value. The company would reflect impairment in this investment only if the loss in value
of the investment were deemed to be other than a temporary decline.

Segments results

The company has two business segments: Services and Technology. Revenue classifications by segment are as follows: Services –
systems integration and consulting, outsourcing, infrastructure services and core maintenance; Technology – enterprise-class servers
and specialized technologies. The accounting policies of each business segment are the same as those followed by the company as a
whole. Intersegment sales and transfers are priced as if the sales or transfers were to third parties. Accordingly, the Technology
segment recognizes intersegment revenue and manufacturing profit on hardware and software shipments to customers under Services
contracts. The Services segment, in turn, recognizes customer revenue and marketing profit on such shipments of company hardware
and software to customers. The Services segment also includes the sale of hardware and software products sourced from third parties
that are sold to customers through the company’s Services channels. In the company’s consolidated statements of income, the
manufacturing costs of products sourced from the Technology segment and sold to Services customers are reported in cost of revenue
for Services.

                                                                 16
Also included in the Technology segment’s sales and operating profit are sales of hardware and software sold to the Services segment
for internal use in Services agreements. The amount of such profit included in operating income of the Technology segment for the
years ended December 31, 2003, 2002 and 2001, was $24.4 million, $19.2 million and $21.8 million, respectively. The profit on these
transactions is eliminated in Corporate.

The company evaluates business segment performance on operating income exclusive of restructuring charges and unusual and
nonrecurring items, which are included in Corporate. All other corporate and centrally incurred costs are allocated to the business
segments based principally on revenue, employees, square footage or usage. See Note 16 of the Notes to Consolidated Financial
Statements.

Information by business segment for 2003, 2002 and 2001 is presented below:


          (Millions of dollars)                          Total         Eliminations       Services          Technology

          2003
          Customer revenue                           $    5,911.2                          $ 4,691.9           $ 1,219.3
          Intersegment                                                     $   (319.8 )         25.9               293.9

          Total revenue                              $    5,911.2          $   (319.8 )    $ 4,717.8           $ 1,513.2

          Gross profit percent                               29.0 %                               20.2 %              50.4 %
          Operating income percent                            7.2 %                                5.0 %              12.7 %

          2002
          Customer revenue                           $    5,607.4                          $ 4,285.1           $ 1,322.3
          Intersegment                                                     $   (331.9 )         38.8               293.1

          Total revenue                              $    5,607.4          $   (331.9 )    $ 4,323.9           $ 1,615.4

          Gross profit percent                               30.1 %                               22.2 %              46.5 %
          Operating income percent                            7.5 %                                5.9 %              11.7 %

          2001
          Customer revenue                           $    6,018.1                          $ 4,444.6           $ 1,573.5
          Intersegment                                                     $   (363.4 )         73.8               289.6

          Total revenue                              $    6,018.1          $   (363.4 )    $ 4,518.4           $ 1,863.1

          Gross profit percent                               24.6 %                               19.7 %              43.0 %
          Operating income percent                            4.5 %                                2.1 %              11.6 %

Gross profit percent and operating income percent are as a percent of total revenue.

In the Services segment, customer revenue was $4.69 billion in 2003, $4.29 billion in 2002 and $4.44 billion in 2001. Revenue in
2003 was up 9% from 2002, principally due to a 17% increase in outsourcing ($1.68 billion in 2003 compared with $1.44 billion in
2002), a 10% increase in systems integration and consulting ($1.60 billion in 2003 compared with $1.46 billion in 2002), a 1%
increase in infrastructure services ($.84 billion in 2003 compared with $.83 billion in 2002) and a 3% increase in core maintenance
($.57 billion in 2003 compared with $.56 billion in 2002). Revenue in 2002 was down 4% from 2001, as an 11% increase in
outsourcing ($1.44 billion in 2002 compared with $1.30 billion in 2001) was more than offset by a 24% decline in infrastructure
services ($.83 billion in 2002 compared with $1.09 billion in 2001) and a 4% decline in core maintenance revenue ($.56 billion in
2002 compared with $.58 billion in 2001). Systems integration and consulting revenue in 2002 was $1.46 billion compared with $1.47
billion in 2001. In 2003, the systems integration business benefited from growth in the company’s U.S. Federal government business.
Throughout the three years, outsourcing revenue continued to grow as the company continues to expand this business. The growth in
outsourcing revenue was particularly driven by growth in business process outsourcing. Within the Services segment, the change in
revenue in 2002 from 2001 reflected then-current market conditions, as well as the company’s de-emphasis of low-margin commodity
hardware sales within infrastructure services contracts. Services gross profit was 20.2% in 2003, 22.2% in 2002 and 19.7% in 2001,
and operating income percent was 5.0% in 2003, 5.9% in 2002 and 2.1% in 2001. The decline in gross profit and operating income
margins in 2003 were principally due to a lower pension income compared with 2002. The company achieved the margin
improvements in 2002 compared with 2001 by executing its strategy of selectively pursuing higher value-added business
opportunities, growing its annuity-based outsourcing business and resizing its workforce to meet the market demand.

                                                                      17
In the Technology segment, customer revenue was $1.22 billion in 2003, $1.32 billion in 2002 and $1.57 billion in 2001. Demand
throughout the period in the Technology segment remained weak industry-wide as customers deferred spending on new computer
hardware and software. Revenue in 2003 was down 8% from 2002, due to a 21% decrease in sales of specialized technology products
($.29 billion in 2003 compared with $.37 billion in 2002) and a 3% decline in sales of enterprise-class servers ($.93 billion in 2003
compared with $.96 billion in 2002). The 8% decline in Technology customer revenue in 2003 as well as the 16% decline in customer
revenue in 2002 reflected the impact of the global downturn in information technology spending on sales of high-end server products,
as well as lower commodity hardware sales as a result of the company’s decision to de-emphasize sales of these products. Technology
gross profit percent was 50.4% in 2003, 46.5% in 2002 and 43.0% in 2001, and Technology operating income percent was 12.7 % in
2003, 11.7% in 2002 and 11.6% in 2001. The margin improvements in 2003 primarily reflected a richer mix of ClearPath servers and
software offset in part by lower pension income. The margin improvements in 2002 primarily reflected, within ClearPath revenue, a
higher proportion of high-end, higher margin products, increased demand for high-end payment systems products and continued tight
cost controls.

New accounting pronouncements

Effective January 1, 2003, the company adopted SFAS No. 145, “Rescission of FASB Statements No. 4, 44 and 64, Amendment of
FASB Statement No. 13, and Technical Corrections.” SFAS No. 145 rescinds SFAS No. 4, which required that all gains and losses
from extinguishment of debt be reported as an extraordinary item. Previously recorded losses on the early extinguishment of debts that
were classified as an extraordinary item in prior periods have been reclassified to other income (expense), net. The adoption of SFAS
No. 145 had no effect on the company’s consolidated financial position, consolidated results of operations, or liquidity.

Effective January 1, 2003, the company adopted SFAS No. 146, “Accounting for Costs Associated with Exit or Disposal Activities.”
SFAS No. 146 requires companies to recognize costs associated with exit or disposal activities when they are incurred rather than at
the date of commitment to an exit or disposal plan. SFAS No. 146 replaces previous accounting guidance provided by Emerging
Issues Task Force (“EITF”) Issue No. 94-3, “Liability Recognition for Certain Employee Termination Benefits and Other Costs to
Exit an Activity (including Certain Costs Incurred in a Restructuring),” and is effective for the company for exit or disposal activities
initiated after December 31, 2002. Adoption of this statement had no material impact on the company’s consolidated financial
position, consolidated results of operations, or liquidity.

Effective January 1, 2003, the company adopted the Financial Accounting Standards Board’s (“FASB”) Interpretation No. 45,
“Guarantor’s Accounting and Disclosure Requirements for Guarantees, Including Indirect Guarantees of Indebtedness of Others, an
Interpretation of FASB Statements No. 5, 57, and 107 and Rescission of FASB Interpretation No. 34” (“FIN 45”). The interpretation
requires that upon issuance of a guarantee, the entity must recognize a liability for the fair value of the obligation it assumes under that
guarantee. In addition, FIN 45 requires disclosures about the guarantees that an entity has issued, including a roll-forward of the
entity’s product warranty liabilities. This interpretation is intended to improve the comparability of financial reporting by requiring
identical accounting for guarantees issued with separately identified consideration and guarantees issued without separately identified
consideration. Adoption of this Interpretation had no material impact on the company’s consolidated financial position, consolidated
results of operations, or liquidity.

Effective July 1, 2003, the company adopted the FASB’s consensus on EITF Issue No. 00-21, “Accounting for Revenue
Arrangements with Multiple Deliverables.” This issue addresses how to account for arrangements that may involve the delivery or
performance of multiple products, services, and/or rights to use assets. The final consensus of this issue is applicable to agreements
entered into in fiscal periods beginning after June 15, 2003. Adoption of this issue had no material impact on the company’s
consolidated financial position, consolidated results of operations, or liquidity.

In January 2003, the FASB issued Interpretation No. 46 (“FIN 46”), “Consolidation of Variable Interest Entities, an interpretation of
ARB 51.” The primary objectives of this interpretation are to provide guidance on the identification of entities for which control is
achieved through means other than through voting rights (“variable interest entities”) and how to determine when and which business
enterprise (the “primary beneficiary”) should consolidate the variable interest entity. This new model for consolidation applies to an
entity in which either (i) the equity investors (if any) do not have a controlling financial interest; or (ii) the equity investment at risk is
insufficient to finance that entity’s activities without receiving additional subordinated financial support from other parties. In
addition, FIN 46 requires that the primary beneficiary, as well as all other enterprises with a significant variable interest in a variable
interest entity, make additional disclosures. Certain disclosure requirements of FIN 46 were effective for financial statements issued
after January 31, 2003. In December 2003, the FASB issued FIN 46 (revised December 2003), “Consolidation of Variable Interest
Entities” (“FIN 46-R”) to address certain FIN 46 implementation issues. The effective dates and impact of FIN 46 and FIN 46-R are
as follows: (i) Special-purpose entities (“SPEs”) created prior to February 1, 2003. The company must apply either the provisions of
FIN 46 or early adopt the provisions of FIN 46-R at the end of the first interim or annual reporting period ending after December 15,
2003. (ii) Non-SPEs created prior to February 1, 2003. The company is required to adopt FIN 46-R at the end of the first interim or
annual reporting period ending after March 15, 2004. (iii) All entities, regardless of whether an SPE, that were created subsequent to
January 31, 2003. The provisions of FIN 46 were applicable for variable interests in entities obtained after January 31, 2003. The
adoption of the provisions applicable to SPEs and all other variable interests obtained after January 31, 2003 did not have a material

                                                                      18
impact on the company’s consolidated financial position, consolidated results of operations, or liquidity. The company is currently
evaluating the impact of adopting FIN 46-R applicable to Non-SPEs created prior to February 1, 2003 but does not expect a material
impact.

In May 2003, the EITF reached a consensus on Issue No. 03-5, “Applicability of AICPA Statement of Position 97-2, Software
Revenue Recognition, to Non-Software Deliverables in an Arrangement Containing More-Than-Incidental Software.” The FASB
ratified this consensus in August 2003. EITF Issue No. 03-5 affirms that AICPA Statement of Position 97-2 applies to non-software
deliverables, such as hardware and services, in an arrangement if the software is essential to the functionality of the non-software
deliverables. The adoption of EITF Issue No. 03-5 did not have a material impact on the company’s consolidated financial position,
consolidated results of operations, or liquidity.

Effective January 1, 2002, the company adopted SFAS No. 143, “Accounting for Asset Retirement Obligations.” This statement
addresses financial accounting and reporting for legal obligations associated with the retirement of tangible long-lived assets that
result from the acquisition, construction, development and normal operation of a long-lived asset. SFAS No. 143 requires that the fair
value of a liability for an asset retirement obligation be recognized in the period in which it is incurred, if a reasonable estimate of fair
value can be made. The associated asset retirement costs are capitalized as part of the carrying amount of the long-lived asset and
subsequently allocated to expense over the asset’s useful life. Adoption of SFAS No. 143 had no effect on the company’s consolidated
financial position, consolidated results of operations, or liquidity.

Effective January 1, 2002, the company adopted SFAS No. 144, “Accounting for the Impairment or Disposal of Long-Lived Assets.”
This statement addresses financial accounting and reporting for the impairment or disposal of long-lived assets. SFAS No. 144
requires an impairment loss to be recognized only if the carrying amounts of long-lived assets to be held and used are not recoverable
from their expected undiscounted future cash flows. Adoption of SFAS No. 144 had no effect on the company’s consolidated financial
position, consolidated results of operations, or liquidity.

Financial condition

Cash and cash equivalents at December 31, 2003 were $635.9 million compared with $301.8 million at December 31, 2002.

During 2003, cash provided by operations was $529.2 million compared with $324.5 million in 2002, principally reflecting strong
working capital management and an increase in profitability. Cash expenditures related to prior-year restructuring actions (which are
included in operating activities) in 2003, 2002 and 2001 were $58.4 million, $104.4 million and $71.5 million, respectively, and are
expected to be approximately $10 million in 2004, principally for international work-force reductions and facility costs. Personnel
reductions in 2003 related to prior-year restructuring actions were approximately 500. No additional personnel reductions are expected
related to prior-year restructuring actions.

Cash used for investing activities in 2003 was $468.8 million compared with $379.2 million in 2002. During 2003, both proceeds from
investments and purchases of investments, which represent derivative financial instruments used to manage the company’s currency
exposure to market risks from changes in foreign currency exchange rates, increased from the prior year as a result of an increase in
the company’s exposure, principally related to intercompany accounts. The increase in cash used for investing activities was due to net
purchases of investments of $68.1 million for 2003 compared with $38.3 million in the prior-year period. In addition in 2003, the
investment in marketable software was $144.1 million compared with $139.9 million in 2002, and capital additions were $251.3
million in 2003 compared with $196.2 million in 2002. The increase in capital additions principally reflected additions of revenue-
generating assets, particularly in the company’s outsourcing business.

Cash provided by financing activities during 2003 was $255.5 million compared with $25.3 million in 2002. In 2003, the company
had net proceeds from issuance of long-term debt of $293.3 million, as described below. In addition, during 2003, there was a
reduction of $64.5 million in short-term borrowings compared with a reduction of $1.6 million in 2002.

In March 2003, the company issued $300 million of 6 7 / 8 % senior notes due 2010. At December 31, 2003, total debt was $1.1 billion,
an increase of $238.5 million from December 31, 2002. See Note 10 of the Notes to Consolidated Financial Statements for
components of the company’s long-term debt.

The company has a $500 million credit agreement that expires in May 2006. As of December 31, 2003, there were no borrowings
under this facility, and the entire $500 million was available for borrowings. Borrowings under the agreement bear interest based on
the then-current LIBOR or prime rates and the company’s credit rating. The credit agreement contains financial and other covenants,
including maintenance of certain financial ratios, a minimum level of net worth and limitations on certain types of transactions, which
could reduce the amount the company is able to borrow. Events of default under the credit agreement include failure to perform
covenants, material adverse change, change of control and default under other debt aggregating at least $25 million. If an event of
default were to occur under the credit agreement, the lenders would be entitled to declare all amounts borrowed under it immediately
due and payable. The occurrence of an event of default under the credit agreement could also cause the acceleration of obligations
under certain other agreements and the termination of the company’s U.S. trade accounts receivable facility, described below.

                                                                     19
In addition, the company and certain international subsidiaries have access to certain uncommitted lines of credit from various banks.
Other sources of short-term funding are operational cash flows, including customer prepayments, and the company’s U.S. trade
accounts receivable facility. Using this facility, the company sells, on an ongoing basis, up to $225 million of its eligible U.S. trade
accounts receivable through a wholly owned subsidiary, Unisys Funding Corporation I. The facility is renewable annually at the
purchasers’ option and expires in December 2006. See Note 6 of the Notes to Consolidated Financial Statements.

At December 31, 2003, the company had short-term borrowings of $17.7 million, borrowed principally by international subsidiaries,
at a weighted average interest rate at December 31 of 7.4%.

At December 31, 2003, the company met all covenants and conditions under its various lending and funding agreements. Since the
company believes that it will continue to meet these covenants and conditions, the company believes that it has adequate sources and
availability of short-term funding to meet its expected cash requirements.

As described more fully in Notes 5, 10 and 13 of the Notes to Consolidated Financial Statements, at December 31, 2003 the company
had certain cash obligations, which are due as follows:


   (Millions)                                           Total       Less than 1 year         1-3 years      4-5 years   After 5 years

   Notes payable                                   $         17.7 $               17.7
   Long-term debt                                         1,050.0                        $        550.0 $        200.0 $        300.0
   Capital lease obligations                                  5.6                 2.2               2.2            1.2
   Operating leases                                         657.0               130.0             184.8          116.7          225.5
   Minimum purchase obligations                              20.0                10.0              10.0
   Work-force reductions                                      5.8                 5.0                .8

   Total                                           $      1,756.1 $             164.9 $           747.8 $        317.9 $        525.5

As more fully described in Note 13 to the Notes to Consolidated Financial Statements, the company could have an additional
obligation under an operating lease for one of its facilities.

At December 31, 2003, the company had outstanding standby letters of credit and surety bonds of approximately $280 million related
to performance and payment guarantees. On the basis of experience with these arrangements, the company believes that any
obligations that may arise will not be material.

The company may, from time to time, redeem, tender for, or repurchase its securities in the open market or in privately negotiated
transactions depending upon availability, market conditions, and other factors.

The company has on file with the Securities and Exchange Commission an effective registration statement covering $1.2 billion of
debt or equity securities, which enables the company to be prepared for future market opportunities.

Stockholders’ equity increased $539.2 million during 2003, principally reflecting a reduction in the minimum pension liability
adjustment of $164.8 million, currency translation of $65.3 million, net income of $258.7 million, $50.6 million for issuance of stock
under stock option and other plans, and $4.9 million of tax benefits related to employee stock plans.

Market risk

The company has exposure to interest rate risk from its short-term and long-term debt. In general, the company’s long-term debt is
fixed rate, and the short-term debt is variable rate. See Note 10 of the Notes to Consolidated Financial Statements for components of
the company’s long-term debt. The company believes that the market risk assuming a hypothetical 10% increase in interest rates
would not be material to the fair value of these financial instruments, or the related cash flows, or future results of operations.

The company is also exposed to foreign currency exchange rate risks. The company uses derivative financial instruments to reduce its
exposure to market risks from changes in foreign currency exchange rates. The derivative instruments used are foreign exchange
forward contracts and foreign exchange options. See Note 14 of the Notes to Consolidated Financial Statements for additional
information on the company’s derivative financial instruments.


                                                                   20
The company has performed a sensitivity analysis assuming a hypothetical 10% adverse movement in foreign currency exchange rates
applied to these derivative financial instruments described above. As of December 31, 2003 and 2002, the analysis indicated that such
market movements would have reduced the estimated fair value of these derivative financial instruments by approximately $58
million and $45 million, respectively.

Based on changes in the timing and amount of interest rate and foreign currency exchange rate movements and the company’s actual
exposures and hedges, actual gains and losses in the future may differ from the above analysis.

Critical accounting policies

Outsourcing

In recent years, the company’s outsourcing business has increased significantly. Typically the terms of these contracts are between
three and 10 years. In a number of these arrangements, the company hires certain of the customers’ employees and often becomes
responsible for the related employee obligations, such as pension and severance commitments. In addition, system development
activity on outsourcing contracts may require significant upfront investments by the company. The company funds these investments,
and any employee-related obligations, from customer prepayments and operating cash flow. Also, in the early phases of these
contracts, gross margins may be lower than in later years when the work force and facilities have been rationalized for efficient
operations, and an integrated systems solution has been implemented.

Revenue under these contracts is recognized when the company performs the services or processes transactions in accordance with
contractual performance standards. Customer prepayments (even if nonrefundable) are deferred (classified as a liability) and
recognized systematically over future periods as services are delivered or performed.

Costs on outsourcing contracts are generally charged to expense as incurred. However, direct costs incurred related to the inception of
an outsourcing contract are deferred and charged to expense over the contract term. These costs consist principally of initial customer
setup and employment obligations related to employees assumed. In addition, the costs of equipment and software, some of which is
internally developed, is capitalized and depreciated over the shorter of their life or the term of the contract.

At December 31, 2003 and 2002, the net capitalized amount related to outsourcing contracts was $477.5 million, and $321.0 million,
respectively. These costs are tested for recoverability quarterly.

Systems integration

For long-term systems integration contracts, the company recognizes revenue and profit as the contracts progress using the
percentage-of-completion method of accounting, which relies on estimates of total expected contract revenues and costs. The company
follows this method since reasonably dependable estimates of the revenue and costs applicable to various elements of a contract can be
made. Since the financial reporting of these contracts depends on estimates, which are assessed continually during the term of the
contracts, recognized revenue and profit are subject to revisions as the contract progresses to completion. Revisions in profit estimates
are reflected in the period in which the facts that give rise to the revision become known. Accordingly, favorable changes in estimates
result in additional revenue and profit recognition, and unfavorable changes in estimates result in a reduction of recognized revenue
and profit. When estimates indicate that a loss will be incurred on a contract upon completion, a provision for the expected loss is
recorded in the period in which the loss becomes evident. As work progresses under a loss contract, revenue continues to be
recognized, and a portion of the contract costs incurred in each period is charged to the contract loss reserve. For other systems
integration projects, the company recognizes revenue when the services have been performed.

Taxes

The company accounts for income taxes in accordance with SFAS No. 109, “Accounting for Income Taxes,” which requires that
deferred tax assets and liabilities be recognized using enacted tax rates for the effect of temporary differences between the book and
tax bases of recorded assets and liabilities. SFAS No. 109 also requires that deferred tax assets be reduced by a valuation allowance, if
it is more likely than not that some portion or all of the deferred tax asset will not be realized.

At December 31, 2003 and 2002, the company had deferred tax assets in excess of deferred tax liabilities of $2,034 million and $2,178
million, respectively. For the reasons cited below, at December 31, 2003 and 2002, management determined that it is more likely than
not that $1,583 million and $1,726 million, respectively, of such assets will be realized, resulting in a valuation allowance of $451
million and $452 million, respectively.

The company evaluates quarterly the realizability of its deferred tax assets by assessing its valuation allowance and by adjusting the
amount of such allowance, if necessary. The factors used to assess the likelihood of realization are the company’s forecast of future
taxable income and available tax planning strategies that could be implemented to realize the net deferred tax assets. The company has
used tax planning strategies to realize or renew net deferred tax assets in order to avoid the potential loss of future tax benefits.

                                                                   21
Approximately $4.8 billion of future taxable income (predominately U.S.) ultimately is needed to realize the net deferred tax assets at
December 31, 2003. Failure to achieve forecasted taxable income might affect the ultimate realization of the net deferred tax assets.
Factors that may affect the company’s ability to achieve sufficient forecasted taxable income include, but are not limited to, the
following: increased competition, a decline in sales or margins, loss of market share, delays in product availability or technological
obsolescence.

In addition, the company operates within multiple taxing jurisdictions and is subject to audit in these jurisdictions. These audits can
involve complex issues, which may require an extended period of time to resolve. In management’s opinion, adequate provisions for
income taxes have been made for all years.

Pensions

The company accounts for its defined benefit pension plans in accordance with SFAS No. 87, “Employers’ Accounting for Pensions,”
which requires that amounts recognized in financial statements be determined on an actuarial basis. As permitted by SFAS No. 87, the
company uses a calculated value of plan assets (which is further described below). SFAS No. 87 allows that the effects of the
performance of the pension plan’s assets and changes in pension liability discount rates on the company’s computation of pension
income (expense) be amortized over future periods. A substantial portion of the company’s pension amounts relates to its defined
benefit plan in the United States.

A significant element in determining the company’s pension income (expense) in accordance with SFAS No. 87 is the expected long-
term rate of return on plan assets. The company sets the expected long-term rate of return based on the expected long-term return of
the various asset categories in which it invests. The company considers the current expectations for future returns and the actual
historical returns of each asset class. Also, since the company’s investment policy is to actively manage certain asset classes where the
potential exists to outperform the broader market, the expected returns for those asset classes are adjusted to reflect the expected
additional returns. For 2004 and 2003, the company has assumed that the expected long-term rate of return on U.S. plan assets will be
8.75%. A change of 25 basis points in the expected long-term rate of return for the company’s U.S. pension plan causes a change of
approximately $10 million in pension expense. The assumed long-term rate of return on assets is applied to a calculated value of plan
assets, which recognizes changes in the fair value of plan assets in a systematic manner over four years. This produces the expected
return on plan assets that is included in pension income (expense). The difference between this expected return and the actual return
on plan assets is deferred. The net deferral of past asset gains (losses) affects the calculated value of plan assets and, ultimately, future
pension income (expense). At December 31, 2003, for the company’s U.S. defined benefit pension plan, the calculated value of plan
assets was $4.48 billion compared with the fair value of plan assets of $4.13 billion.

At the end of each year, the company determines the discount rate to be used to calculate the present value of plan liabilities. The
discount rate is an estimate of the current interest rate at which the pension liabilities could be effectively settled at the end of the year.
In estimating this rate, the company looks to rates of return on high-quality, fixed-income investments that (i) receive one of the two
highest ratings given by a recognized ratings agency and (ii) are currently available and expected to be available during the period to
maturity of the pension benefits. At December 31, 2003, the company determined this rate to be 6.25% for its U.S. defined benefit
pension plan, a decrease of 50 basis points from the rate used at December 31, 2002. A change of 25 basis points in the U.S. discount
rate causes a change in pension expense of approximately $11 million and a change of approximately $105 million in the projected
benefit obligation. The net effect of changes in the discount rate, as well as the net effect of other changes in actuarial assumptions and
experience, have been deferred, as permitted by SFAS No. 87.

Management chose the above assumptions as to the expected long-term rate of return on plan assets and the discount rate with
consultation from and concurrence of the company’s outside actuaries.

SFAS No. 87 defines gains and losses as changes in the amount of either the projected benefit obligation or plan assets resulting from
experience different from that assumed and from changes in assumptions. Because gains and losses may reflect refinements in
estimates as well as real changes in economic values and because some gains in one period may be offset by losses in another and vice
versa, SFAS No. 87 does not require recognition of gains and losses as components of net pension cost of the period in which they
arise.

As a minimum, amortization of an unrecognized net gain or loss must be included as a component of net pension cost for a year if, as
of the beginning of the year, that unrecognized net gain or loss exceeds 10 percent of the greater of the projected benefit obligation or
the calculated value of plan assets. If amortization is required, the minimum amortization is that excess above the 10 percent divided
by the average remaining service period of active employees expected to receive benefits under the plan. For the company’s U.S.
defined benefit pension plan, that period is approximately nine years. At December 31, 2003, based on the calculated value of plan
assets, the estimated unrecognized loss was $1.25 billion.

For the year ended December 31, 2003, the company recognized consolidated pretax pension income of $22.6 million, compared with
$143.5 million of consolidated pretax pension income for the year ended December 31, 2002. Approximately $80 million of the
decline was in the U.S., and $40 million was in international subsidiaries, principally the plans in the United Kingdom. The reasons

                                                                      22
for the decline in the U.S. were as follows: (a) a reduction in the expected long-term rate of return on plan assets from 9.50% to
8.75%, (b) a decline in the discount rate from 7.50% to 6.75%, (c) lower expected returns on plan assets due to lower assets than the
prior year, and (d) the change to a cash balance plan which was effective January 1, 2003. The decline in international plans was
principally due to declines in discount rates, lower expected long-term rates of returns on plan assets and currency translations.

For 2004, the company expects to recognize pension expense of approximately $85 million ($33 million of expense in the U.S. and
$52 million of expense in international plans). This would represent a change of approximately $108 million from 2003, substantially
all in the U.S. The change in the U.S. will be due to: (a) lower expected returns on plan assets of approximately $35 million due to
amortization of the difference between the calculated value of plan assets and the fair value of plan assets, (b) a 50 basis-point
reduction in the discount rate, which causes an approximate $23 million increase in pension expense, and (c) an approximate $44
million increase in amortization of net unrecognized losses.

During 2003, the company made cash contributions to its worldwide defined benefit pension plans of approximately $63 million and
expects to make cash contributions of approximately $66 million during 2004. In accordance with regulations governing contributions
to U.S. defined benefit pension plans, the company is not required to fund its U.S. qualified defined benefit plan in 2004.

At December 31 of each year, accounting rules require a company to recognize a liability on its balance sheet for each pension plan if
the fair value of the assets of that pension plan is less than the present value of the pension obligation (the accumulated benefit
obligation, or “ABO”). This liability is called a “minimum pension liability.” Concurrently, any existing prepaid pension asset for the
pension plan must be removed. These adjustments are recorded as a charge in “accumulated other comprehensive income (loss)” in
stockholders’ equity. If at any future year-end, the fair value of the pension plan assets exceeds the ABO, the charge to stockholders’
equity would be reversed for such plan. Alternatively, if the fair market value of pension plan assets experiences further declines or
the discount rate is reduced, additional charges to accumulated other comprehensive income (loss) may be required at a future year-
end.

At December 31, 2002, for all of the company’s defined benefit pension plans, the ABO exceeded the fair value of pension plan
assets. At December 31, 2003, the difference between the ABO and the fair value of pension plan assets decreased. As a result at
December 31, 2003, the company adjusted its minimum pension liability as follows: decreased its pension plan liabilities by
approximately $300 million, increased its investments at equity by approximately $6 million relating to the company’s share of the
change in NUL’s minimum pension liability, decreased prepaid pension asset by $56 million, and offset these changes by a credit to
other comprehensive income of approximately $250 million, or $165 million net of tax.

This accounting has no effect on the company’s net income, liquidity or cash flows. Financial ratios and net worth covenants in the
company’s credit agreements and debt securities are unaffected by charges or credits to stockholders’ equity caused by adjusting a
minimum pension liability.

Factors that may affect future results

From time to time, the company provides information containing “forward-looking” statements, as defined in the Private Securities
Litigation Reform Act of 1995. Forward-looking statements provide current expectations of future events and include any statement
that does not directly relate to any historical or current fact. Words such as “anticipates,” “believes,” “expects,” “intends,” “plans,”
“projects” and similar expressions may identify such forward-looking statements. All forward-looking statements rely on assumptions
and are subject to risks, uncertainties and other factors that could cause the company’s actual results to differ materially from
expectations. These other factors include, but are not limited to, those discussed below. Any forward-looking statement speaks only as
of the date on which that statement is made. The company assumes no obligation to update any forward-looking statement to reflect
events or circumstances that occur after the date on which the statement is made.

The company’s business is affected by changes in general economic and business conditions. The company continues to face a
challenging economic environment. In this environment, many organizations are delaying planned purchases of information
technology products and services. If the level of demand for the company’s products and services declines in the future, the
company’s business could be adversely affected. The company’s business could also be affected by acts of war, terrorism or natural
disasters. Current world tensions could escalate and this could have unpredictable consequences on the world economy and on our
business.

The information services and technology markets in which the company operates include a large number of companies vying for
customers and market share both domestically and internationally. The company’s competitors include systems integrators, consulting
and other professional services firms, outsourcing providers, infrastructure services providers, computer hardware manufacturers and
software providers. Some of the company’s competitors may develop competing products and services that offer better price-
performance or that reach the market in advance of the company’s offerings. Some competitors also have or may develop greater
financial and other resources than the company, with enhanced ability to compete for market share, in some instances through
significant economic incentives to secure contracts. Some also may be better able to compete for skilled professionals. Any of these
factors could have an adverse effect on the company’s business. Future results will depend on the company’s ability to mitigate the

                                                                   23
unisys 2003_4Q_10K
unisys 2003_4Q_10K
unisys 2003_4Q_10K
unisys 2003_4Q_10K
unisys 2003_4Q_10K
unisys 2003_4Q_10K
unisys 2003_4Q_10K
unisys 2003_4Q_10K
unisys 2003_4Q_10K
unisys 2003_4Q_10K
unisys 2003_4Q_10K
unisys 2003_4Q_10K
unisys 2003_4Q_10K
unisys 2003_4Q_10K
unisys 2003_4Q_10K
unisys 2003_4Q_10K
unisys 2003_4Q_10K
unisys 2003_4Q_10K
unisys 2003_4Q_10K
unisys 2003_4Q_10K
unisys 2003_4Q_10K
unisys 2003_4Q_10K
unisys 2003_4Q_10K
unisys 2003_4Q_10K
unisys 2003_4Q_10K
unisys 2003_4Q_10K
unisys 2003_4Q_10K
unisys 2003_4Q_10K
unisys 2003_4Q_10K
unisys 2003_4Q_10K
unisys 2003_4Q_10K
unisys 2003_4Q_10K
unisys 2003_4Q_10K
unisys 2003_4Q_10K
unisys 2003_4Q_10K
unisys 2003_4Q_10K
unisys 2003_4Q_10K

More Related Content

What's hot

micron technollogy 2001_10k
micron technollogy 2001_10kmicron technollogy 2001_10k
micron technollogy 2001_10kfinance36
 
micron technollogy 10k_2005
micron technollogy 10k_2005micron technollogy 10k_2005
micron technollogy 10k_2005finance36
 
NYSE:PRO 2008 Annual Report
NYSE:PRO 2008 Annual ReportNYSE:PRO 2008 Annual Report
NYSE:PRO 2008 Annual ReportMatthew Balfour
 
FORM 10−K
FORM 10−KFORM 10−K
FORM 10−KVideoguy
 
micron technollogy 2002_10K
micron technollogy 2002_10Kmicron technollogy 2002_10K
micron technollogy 2002_10Kfinance36
 
Q2 2009 Earning Report of Investors Capital Holdings, Ltd.
Q2 2009 Earning Report of Investors Capital Holdings, Ltd.Q2 2009 Earning Report of Investors Capital Holdings, Ltd.
Q2 2009 Earning Report of Investors Capital Holdings, Ltd.earningreport earningreport
 
Xyzmo Product Compliancy
Xyzmo Product CompliancyXyzmo Product Compliancy
Xyzmo Product CompliancyNamirial GmbH
 
micron technollogy 8k_040208
micron technollogy 8k_040208micron technollogy 8k_040208
micron technollogy 8k_040208finance36
 
visteon 2004 Form 10-K
visteon 2004 Form 10-Kvisteon 2004 Form 10-K
visteon 2004 Form 10-Kfinance24
 
Realogy8-KFiling_11-25-08
Realogy8-KFiling_11-25-08Realogy8-KFiling_11-25-08
Realogy8-KFiling_11-25-08finance35
 
micron technollogy 2004_10K
micron technollogy 2004_10Kmicron technollogy 2004_10K
micron technollogy 2004_10Kfinance36
 
Q2 2009 Earning Report of Bell Microproducts, Inc.
Q2 2009 Earning Report of Bell Microproducts, Inc.Q2 2009 Earning Report of Bell Microproducts, Inc.
Q2 2009 Earning Report of Bell Microproducts, Inc.earningreport earningreport
 
micron technollogy 2008_8-K-Nanya
micron technollogy 2008_8-K-Nanyamicron technollogy 2008_8-K-Nanya
micron technollogy 2008_8-K-Nanyafinance36
 
c.h. robinson worldwide10K_2007
c.h. robinson worldwide10K_2007c.h. robinson worldwide10K_2007
c.h. robinson worldwide10K_2007finance31
 
NYSE:PRO 2009 Annual Report
NYSE:PRO 2009 Annual ReportNYSE:PRO 2009 Annual Report
NYSE:PRO 2009 Annual ReportMatthew Balfour
 
317 clearchanne
317  clearchanne317  clearchanne
317 clearchannefinance31
 

What's hot (20)

micron technollogy 2001_10k
micron technollogy 2001_10kmicron technollogy 2001_10k
micron technollogy 2001_10k
 
micron technollogy 10k_2005
micron technollogy 10k_2005micron technollogy 10k_2005
micron technollogy 10k_2005
 
NYSE:PRO 2008 Annual Report
NYSE:PRO 2008 Annual ReportNYSE:PRO 2008 Annual Report
NYSE:PRO 2008 Annual Report
 
FORM 10−K
FORM 10−KFORM 10−K
FORM 10−K
 
micron technollogy 2002_10K
micron technollogy 2002_10Kmicron technollogy 2002_10K
micron technollogy 2002_10K
 
Q2 2009 Earning Report of Investors Capital Holdings, Ltd.
Q2 2009 Earning Report of Investors Capital Holdings, Ltd.Q2 2009 Earning Report of Investors Capital Holdings, Ltd.
Q2 2009 Earning Report of Investors Capital Holdings, Ltd.
 
Xyzmo Product Compliancy
Xyzmo Product CompliancyXyzmo Product Compliancy
Xyzmo Product Compliancy
 
micron technollogy 8k_040208
micron technollogy 8k_040208micron technollogy 8k_040208
micron technollogy 8k_040208
 
visteon 2004 Form 10-K
visteon 2004 Form 10-Kvisteon 2004 Form 10-K
visteon 2004 Form 10-K
 
Realogy8-KFiling_11-25-08
Realogy8-KFiling_11-25-08Realogy8-KFiling_11-25-08
Realogy8-KFiling_11-25-08
 
micron technollogy 2004_10K
micron technollogy 2004_10Kmicron technollogy 2004_10K
micron technollogy 2004_10K
 
slm 200510K
slm 200510Kslm 200510K
slm 200510K
 
Q2 2009 Earning Report of Bell Microproducts, Inc.
Q2 2009 Earning Report of Bell Microproducts, Inc.Q2 2009 Earning Report of Bell Microproducts, Inc.
Q2 2009 Earning Report of Bell Microproducts, Inc.
 
micron technollogy 2008_8-K-Nanya
micron technollogy 2008_8-K-Nanyamicron technollogy 2008_8-K-Nanya
micron technollogy 2008_8-K-Nanya
 
Q1 2009 Earning Report of Western Union Co.
Q1 2009 Earning Report of Western Union Co.Q1 2009 Earning Report of Western Union Co.
Q1 2009 Earning Report of Western Union Co.
 
Q2 2009 Earning Report of Crown Crafts, Inc.
Q2 2009 Earning Report of Crown Crafts, Inc.Q2 2009 Earning Report of Crown Crafts, Inc.
Q2 2009 Earning Report of Crown Crafts, Inc.
 
c.h. robinson worldwide10K_2007
c.h. robinson worldwide10K_2007c.h. robinson worldwide10K_2007
c.h. robinson worldwide10K_2007
 
NYSE:PRO 2009 Annual Report
NYSE:PRO 2009 Annual ReportNYSE:PRO 2009 Annual Report
NYSE:PRO 2009 Annual Report
 
Q2 2009 Earning Report of Vision Sciences, Inc.
Q2 2009 Earning Report of Vision Sciences, Inc.Q2 2009 Earning Report of Vision Sciences, Inc.
Q2 2009 Earning Report of Vision Sciences, Inc.
 
317 clearchanne
317  clearchanne317  clearchanne
317 clearchanne
 

Viewers also liked

Aula 03 - ma1 - IFES - 1 semestre 2011
Aula   03 - ma1 - IFES -  1 semestre 2011Aula   03 - ma1 - IFES -  1 semestre 2011
Aula 03 - ma1 - IFES - 1 semestre 2011Moises Omena
 
Ip & npd razaghi-ramezankhani-ghiassaleh-parvizian
Ip & npd razaghi-ramezankhani-ghiassaleh-parvizianIp & npd razaghi-ramezankhani-ghiassaleh-parvizian
Ip & npd razaghi-ramezankhani-ghiassaleh-parvizianOmid Aminzadeh Gohari
 
Career-Edge Magazine coverage - Ritesh Ambastha
Career-Edge Magazine coverage  - Ritesh AmbasthaCareer-Edge Magazine coverage  - Ritesh Ambastha
Career-Edge Magazine coverage - Ritesh AmbasthaNAILBITER
 
unisys 1Q07_SPR
unisys 1Q07_SPRunisys 1Q07_SPR
unisys 1Q07_SPRfinance36
 
marshall & llsley corp annual reports 2007
marshall  & llsley corp annual reports 2007marshall  & llsley corp annual reports 2007
marshall & llsley corp annual reports 2007finance36
 
Hexion Q307lEarningsCall
Hexion Q307lEarningsCallHexion Q307lEarningsCall
Hexion Q307lEarningsCallfinance36
 
unisys 2006_1Q_10Q
unisys 2006_1Q_10Qunisys 2006_1Q_10Q
unisys 2006_1Q_10Qfinance36
 
unisys 2008_1Q_10Q
unisys 2008_1Q_10Qunisys 2008_1Q_10Q
unisys 2008_1Q_10Qfinance36
 
Hexion2006SummaryAnnualReport
Hexion2006SummaryAnnualReportHexion2006SummaryAnnualReport
Hexion2006SummaryAnnualReportfinance36
 
unisys 10238828
unisys 10238828unisys 10238828
unisys 10238828finance36
 
unisys 1Q05_SPR
unisys 1Q05_SPRunisys 1Q05_SPR
unisys 1Q05_SPRfinance36
 
unisys 02/108955
unisys 02/108955unisys 02/108955
unisys 02/108955finance36
 
unisys 2002_3Q_10Q
unisys 2002_3Q_10Qunisys 2002_3Q_10Q
unisys 2002_3Q_10Qfinance36
 
HexionAcquisitionJuly07Final
HexionAcquisitionJuly07FinalHexionAcquisitionJuly07Final
HexionAcquisitionJuly07Finalfinance36
 
unisys 2Q04_10Q
unisys 2Q04_10Qunisys 2Q04_10Q
unisys 2Q04_10Qfinance36
 
unisys 2Q08_SPR
unisys 2Q08_SPRunisys 2Q08_SPR
unisys 2Q08_SPRfinance36
 
Hexion CSFBConferenceMarch2008Final
Hexion CSFBConferenceMarch2008FinalHexion CSFBConferenceMarch2008Final
Hexion CSFBConferenceMarch2008Finalfinance36
 
unisys 2002_1Q_10Q
unisys 2002_1Q_10Qunisys 2002_1Q_10Q
unisys 2002_1Q_10Qfinance36
 
brunswick annual reports 2007
brunswick annual reports 2007brunswick annual reports 2007
brunswick annual reports 2007finance36
 

Viewers also liked (20)

Aula 03 - ma1 - IFES - 1 semestre 2011
Aula   03 - ma1 - IFES -  1 semestre 2011Aula   03 - ma1 - IFES -  1 semestre 2011
Aula 03 - ma1 - IFES - 1 semestre 2011
 
Ip & npd razaghi-ramezankhani-ghiassaleh-parvizian
Ip & npd razaghi-ramezankhani-ghiassaleh-parvizianIp & npd razaghi-ramezankhani-ghiassaleh-parvizian
Ip & npd razaghi-ramezankhani-ghiassaleh-parvizian
 
Career-Edge Magazine coverage - Ritesh Ambastha
Career-Edge Magazine coverage  - Ritesh AmbasthaCareer-Edge Magazine coverage  - Ritesh Ambastha
Career-Edge Magazine coverage - Ritesh Ambastha
 
unisys 1Q07_SPR
unisys 1Q07_SPRunisys 1Q07_SPR
unisys 1Q07_SPR
 
marshall & llsley corp annual reports 2007
marshall  & llsley corp annual reports 2007marshall  & llsley corp annual reports 2007
marshall & llsley corp annual reports 2007
 
Hexion Q307lEarningsCall
Hexion Q307lEarningsCallHexion Q307lEarningsCall
Hexion Q307lEarningsCall
 
unisys 2006_1Q_10Q
unisys 2006_1Q_10Qunisys 2006_1Q_10Q
unisys 2006_1Q_10Q
 
asbury
asburyasbury
asbury
 
unisys 2008_1Q_10Q
unisys 2008_1Q_10Qunisys 2008_1Q_10Q
unisys 2008_1Q_10Q
 
Hexion2006SummaryAnnualReport
Hexion2006SummaryAnnualReportHexion2006SummaryAnnualReport
Hexion2006SummaryAnnualReport
 
unisys 10238828
unisys 10238828unisys 10238828
unisys 10238828
 
unisys 1Q05_SPR
unisys 1Q05_SPRunisys 1Q05_SPR
unisys 1Q05_SPR
 
unisys 02/108955
unisys 02/108955unisys 02/108955
unisys 02/108955
 
unisys 2002_3Q_10Q
unisys 2002_3Q_10Qunisys 2002_3Q_10Q
unisys 2002_3Q_10Q
 
HexionAcquisitionJuly07Final
HexionAcquisitionJuly07FinalHexionAcquisitionJuly07Final
HexionAcquisitionJuly07Final
 
unisys 2Q04_10Q
unisys 2Q04_10Qunisys 2Q04_10Q
unisys 2Q04_10Q
 
unisys 2Q08_SPR
unisys 2Q08_SPRunisys 2Q08_SPR
unisys 2Q08_SPR
 
Hexion CSFBConferenceMarch2008Final
Hexion CSFBConferenceMarch2008FinalHexion CSFBConferenceMarch2008Final
Hexion CSFBConferenceMarch2008Final
 
unisys 2002_1Q_10Q
unisys 2002_1Q_10Qunisys 2002_1Q_10Q
unisys 2002_1Q_10Q
 
brunswick annual reports 2007
brunswick annual reports 2007brunswick annual reports 2007
brunswick annual reports 2007
 

Similar to unisys 2003_4Q_10K

unisys 2001_10K
unisys 2001_10Kunisys 2001_10K
unisys 2001_10Kfinance36
 
unisys 2002_10K
unisys 2002_10Kunisys 2002_10K
unisys 2002_10Kfinance36
 
unisys 2007_4Q_10K
unisys 2007_4Q_10Kunisys 2007_4Q_10K
unisys 2007_4Q_10Kfinance36
 
virgin media. 2007AnnualReportFinal
virgin media. 2007AnnualReportFinalvirgin media. 2007AnnualReportFinal
virgin media. 2007AnnualReportFinalfinance28
 
virgin media. 2007AnnualReportFinal
virgin media. 2007AnnualReportFinalvirgin media. 2007AnnualReportFinal
virgin media. 2007AnnualReportFinalfinance28
 
international paper Q4 2001 10-K
international paper Q4 2001 10-Kinternational paper Q4 2001 10-K
international paper Q4 2001 10-Kfinance12
 
dish network annual reports 2005
dish network annual reports 2005dish network annual reports 2005
dish network annual reports 2005finance24
 
national oilwell varco 1999 Form 10-K
national oilwell varco 	1999 Form 10-Knational oilwell varco 	1999 Form 10-K
national oilwell varco 1999 Form 10-Kfinance40
 
national oilwell varco 2001 Form 10-K
national oilwell varco 	2001 Form 10-Knational oilwell varco 	2001 Form 10-K
national oilwell varco 2001 Form 10-Kfinance40
 
yrc worldwide 2007_AR
yrc worldwide 2007_ARyrc worldwide 2007_AR
yrc worldwide 2007_ARfinance41
 
yrc worldwide 2007_AR
yrc worldwide 2007_ARyrc worldwide 2007_AR
yrc worldwide 2007_ARfinance41
 
urs Form 10-K 2006
urs Form 10-K 2006urs Form 10-K 2006
urs Form 10-K 2006finance38
 
helath net 10K 98
helath net 10K 98helath net 10K 98
helath net 10K 98finance18
 
dover 10K_2006
dover 10K_2006dover 10K_2006
dover 10K_2006finance30
 
national oilwell varco 2000 Form 10-K
national oilwell varco 	2000 Form 10-Knational oilwell varco 	2000 Form 10-K
national oilwell varco 2000 Form 10-Kfinance40
 
clearchannel 15
clearchannel  15clearchannel  15
clearchannel 15finance31
 
usg AR_10K2003
usg AR_10K2003usg AR_10K2003
usg AR_10K2003finance40
 
supervalu annual report 2003
supervalu annual report 2003supervalu annual report 2003
supervalu annual report 2003finance7
 
clearchannel 229
clearchannel  229clearchannel  229
clearchannel 229finance31
 
dish network annual reports 2000
dish network annual reports 2000dish network annual reports 2000
dish network annual reports 2000finance24
 

Similar to unisys 2003_4Q_10K (20)

unisys 2001_10K
unisys 2001_10Kunisys 2001_10K
unisys 2001_10K
 
unisys 2002_10K
unisys 2002_10Kunisys 2002_10K
unisys 2002_10K
 
unisys 2007_4Q_10K
unisys 2007_4Q_10Kunisys 2007_4Q_10K
unisys 2007_4Q_10K
 
virgin media. 2007AnnualReportFinal
virgin media. 2007AnnualReportFinalvirgin media. 2007AnnualReportFinal
virgin media. 2007AnnualReportFinal
 
virgin media. 2007AnnualReportFinal
virgin media. 2007AnnualReportFinalvirgin media. 2007AnnualReportFinal
virgin media. 2007AnnualReportFinal
 
international paper Q4 2001 10-K
international paper Q4 2001 10-Kinternational paper Q4 2001 10-K
international paper Q4 2001 10-K
 
dish network annual reports 2005
dish network annual reports 2005dish network annual reports 2005
dish network annual reports 2005
 
national oilwell varco 1999 Form 10-K
national oilwell varco 	1999 Form 10-Knational oilwell varco 	1999 Form 10-K
national oilwell varco 1999 Form 10-K
 
national oilwell varco 2001 Form 10-K
national oilwell varco 	2001 Form 10-Knational oilwell varco 	2001 Form 10-K
national oilwell varco 2001 Form 10-K
 
yrc worldwide 2007_AR
yrc worldwide 2007_ARyrc worldwide 2007_AR
yrc worldwide 2007_AR
 
yrc worldwide 2007_AR
yrc worldwide 2007_ARyrc worldwide 2007_AR
yrc worldwide 2007_AR
 
urs Form 10-K 2006
urs Form 10-K 2006urs Form 10-K 2006
urs Form 10-K 2006
 
helath net 10K 98
helath net 10K 98helath net 10K 98
helath net 10K 98
 
dover 10K_2006
dover 10K_2006dover 10K_2006
dover 10K_2006
 
national oilwell varco 2000 Form 10-K
national oilwell varco 	2000 Form 10-Knational oilwell varco 	2000 Form 10-K
national oilwell varco 2000 Form 10-K
 
clearchannel 15
clearchannel  15clearchannel  15
clearchannel 15
 
usg AR_10K2003
usg AR_10K2003usg AR_10K2003
usg AR_10K2003
 
supervalu annual report 2003
supervalu annual report 2003supervalu annual report 2003
supervalu annual report 2003
 
clearchannel 229
clearchannel  229clearchannel  229
clearchannel 229
 
dish network annual reports 2000
dish network annual reports 2000dish network annual reports 2000
dish network annual reports 2000
 

More from finance36

unisys 2001_1Q_10Q
unisys 2001_1Q_10Qunisys 2001_1Q_10Q
unisys 2001_1Q_10Qfinance36
 
unisys 2001_2Q_10Q
unisys 2001_2Q_10Qunisys 2001_2Q_10Q
unisys 2001_2Q_10Qfinance36
 
unisys 2001_3Q_10Q
unisys 2001_3Q_10Qunisys 2001_3Q_10Q
unisys 2001_3Q_10Qfinance36
 
unisys 2002_2Q_10Q
unisys 2002_2Q_10Qunisys 2002_2Q_10Q
unisys 2002_2Q_10Qfinance36
 
unisys 2003_1Q_10Q
unisys 2003_1Q_10Qunisys 2003_1Q_10Q
unisys 2003_1Q_10Qfinance36
 
unisys 2003_2Q_10Q
unisys 2003_2Q_10Qunisys 2003_2Q_10Q
unisys 2003_2Q_10Qfinance36
 
unisys 2003_3Q_10Q
unisys 2003_3Q_10Qunisys 2003_3Q_10Q
unisys 2003_3Q_10Qfinance36
 
unisys 1Q04_10Q
unisys 1Q04_10Qunisys 1Q04_10Q
unisys 1Q04_10Qfinance36
 
unisys 1Q04_SPR
unisys 1Q04_SPRunisys 1Q04_SPR
unisys 1Q04_SPRfinance36
 
unisys 2Q04_SPR
unisys 2Q04_SPRunisys 2Q04_SPR
unisys 2Q04_SPRfinance36
 
unisys 3Q04_10Q
unisys 3Q04_10Qunisys 3Q04_10Q
unisys 3Q04_10Qfinance36
 
unisys 3Q04_SPR
unisys 3Q04_SPRunisys 3Q04_SPR
unisys 3Q04_SPRfinance36
 
unisys 4Q04_SPR
unisys 4Q04_SPRunisys 4Q04_SPR
unisys 4Q04_SPRfinance36
 
unisys 2005_1Q_10Q
unisys 2005_1Q_10Qunisys 2005_1Q_10Q
unisys 2005_1Q_10Qfinance36
 
unisys 2005_2Q_10Q
unisys 2005_2Q_10Qunisys 2005_2Q_10Q
unisys 2005_2Q_10Qfinance36
 
unisys 2Q04_SPR
unisys 2Q04_SPRunisys 2Q04_SPR
unisys 2Q04_SPRfinance36
 
unisys 2Q05_SPR
unisys 2Q05_SPRunisys 2Q05_SPR
unisys 2Q05_SPRfinance36
 
unisys 2005_3Q_10Q
unisys 2005_3Q_10Qunisys 2005_3Q_10Q
unisys 2005_3Q_10Qfinance36
 
unisys 2Q04_SPR
unisys 2Q04_SPRunisys 2Q04_SPR
unisys 2Q04_SPRfinance36
 
unisys 3Q05_SPR
unisys 3Q05_SPRunisys 3Q05_SPR
unisys 3Q05_SPRfinance36
 

More from finance36 (20)

unisys 2001_1Q_10Q
unisys 2001_1Q_10Qunisys 2001_1Q_10Q
unisys 2001_1Q_10Q
 
unisys 2001_2Q_10Q
unisys 2001_2Q_10Qunisys 2001_2Q_10Q
unisys 2001_2Q_10Q
 
unisys 2001_3Q_10Q
unisys 2001_3Q_10Qunisys 2001_3Q_10Q
unisys 2001_3Q_10Q
 
unisys 2002_2Q_10Q
unisys 2002_2Q_10Qunisys 2002_2Q_10Q
unisys 2002_2Q_10Q
 
unisys 2003_1Q_10Q
unisys 2003_1Q_10Qunisys 2003_1Q_10Q
unisys 2003_1Q_10Q
 
unisys 2003_2Q_10Q
unisys 2003_2Q_10Qunisys 2003_2Q_10Q
unisys 2003_2Q_10Q
 
unisys 2003_3Q_10Q
unisys 2003_3Q_10Qunisys 2003_3Q_10Q
unisys 2003_3Q_10Q
 
unisys 1Q04_10Q
unisys 1Q04_10Qunisys 1Q04_10Q
unisys 1Q04_10Q
 
unisys 1Q04_SPR
unisys 1Q04_SPRunisys 1Q04_SPR
unisys 1Q04_SPR
 
unisys 2Q04_SPR
unisys 2Q04_SPRunisys 2Q04_SPR
unisys 2Q04_SPR
 
unisys 3Q04_10Q
unisys 3Q04_10Qunisys 3Q04_10Q
unisys 3Q04_10Q
 
unisys 3Q04_SPR
unisys 3Q04_SPRunisys 3Q04_SPR
unisys 3Q04_SPR
 
unisys 4Q04_SPR
unisys 4Q04_SPRunisys 4Q04_SPR
unisys 4Q04_SPR
 
unisys 2005_1Q_10Q
unisys 2005_1Q_10Qunisys 2005_1Q_10Q
unisys 2005_1Q_10Q
 
unisys 2005_2Q_10Q
unisys 2005_2Q_10Qunisys 2005_2Q_10Q
unisys 2005_2Q_10Q
 
unisys 2Q04_SPR
unisys 2Q04_SPRunisys 2Q04_SPR
unisys 2Q04_SPR
 
unisys 2Q05_SPR
unisys 2Q05_SPRunisys 2Q05_SPR
unisys 2Q05_SPR
 
unisys 2005_3Q_10Q
unisys 2005_3Q_10Qunisys 2005_3Q_10Q
unisys 2005_3Q_10Q
 
unisys 2Q04_SPR
unisys 2Q04_SPRunisys 2Q04_SPR
unisys 2Q04_SPR
 
unisys 3Q05_SPR
unisys 3Q05_SPRunisys 3Q05_SPR
unisys 3Q05_SPR
 

Recently uploaded

Best VIP Call Girls Noida Sector 18 Call Me: 8448380779
Best VIP Call Girls Noida Sector 18 Call Me: 8448380779Best VIP Call Girls Noida Sector 18 Call Me: 8448380779
Best VIP Call Girls Noida Sector 18 Call Me: 8448380779Delhi Call girls
 
Lundin Gold April 2024 Corporate Presentation v4.pdf
Lundin Gold April 2024 Corporate Presentation v4.pdfLundin Gold April 2024 Corporate Presentation v4.pdf
Lundin Gold April 2024 Corporate Presentation v4.pdfAdnet Communications
 
Monthly Market Risk Update: April 2024 [SlideShare]
Monthly Market Risk Update: April 2024 [SlideShare]Monthly Market Risk Update: April 2024 [SlideShare]
Monthly Market Risk Update: April 2024 [SlideShare]Commonwealth
 
High Class Call Girls Nagpur Grishma Call 7001035870 Meet With Nagpur Escorts
High Class Call Girls Nagpur Grishma Call 7001035870 Meet With Nagpur EscortsHigh Class Call Girls Nagpur Grishma Call 7001035870 Meet With Nagpur Escorts
High Class Call Girls Nagpur Grishma Call 7001035870 Meet With Nagpur Escortsranjana rawat
 
Russian Call Girls In Gtb Nagar (Delhi) 9711199012 💋✔💕😘 Naughty Call Girls Se...
Russian Call Girls In Gtb Nagar (Delhi) 9711199012 💋✔💕😘 Naughty Call Girls Se...Russian Call Girls In Gtb Nagar (Delhi) 9711199012 💋✔💕😘 Naughty Call Girls Se...
Russian Call Girls In Gtb Nagar (Delhi) 9711199012 💋✔💕😘 Naughty Call Girls Se...shivangimorya083
 
Instant Issue Debit Cards - School Designs
Instant Issue Debit Cards - School DesignsInstant Issue Debit Cards - School Designs
Instant Issue Debit Cards - School Designsegoetzinger
 
Q3 2024 Earnings Conference Call and Webcast Slides
Q3 2024 Earnings Conference Call and Webcast SlidesQ3 2024 Earnings Conference Call and Webcast Slides
Q3 2024 Earnings Conference Call and Webcast SlidesMarketing847413
 
The Economic History of the U.S. Lecture 18.pdf
The Economic History of the U.S. Lecture 18.pdfThe Economic History of the U.S. Lecture 18.pdf
The Economic History of the U.S. Lecture 18.pdfGale Pooley
 
How Automation is Driving Efficiency Through the Last Mile of Reporting
How Automation is Driving Efficiency Through the Last Mile of ReportingHow Automation is Driving Efficiency Through the Last Mile of Reporting
How Automation is Driving Efficiency Through the Last Mile of ReportingAggregage
 
High Class Call Girls Nashik Maya 7001305949 Independent Escort Service Nashik
High Class Call Girls Nashik Maya 7001305949 Independent Escort Service NashikHigh Class Call Girls Nashik Maya 7001305949 Independent Escort Service Nashik
High Class Call Girls Nashik Maya 7001305949 Independent Escort Service NashikCall Girls in Nagpur High Profile
 
Call US 📞 9892124323 ✅ Kurla Call Girls In Kurla ( Mumbai ) secure service
Call US 📞 9892124323 ✅ Kurla Call Girls In Kurla ( Mumbai ) secure serviceCall US 📞 9892124323 ✅ Kurla Call Girls In Kurla ( Mumbai ) secure service
Call US 📞 9892124323 ✅ Kurla Call Girls In Kurla ( Mumbai ) secure servicePooja Nehwal
 
The Economic History of the U.S. Lecture 17.pdf
The Economic History of the U.S. Lecture 17.pdfThe Economic History of the U.S. Lecture 17.pdf
The Economic History of the U.S. Lecture 17.pdfGale Pooley
 
VIP Call Girls LB Nagar ( Hyderabad ) Phone 8250192130 | ₹5k To 25k With Room...
VIP Call Girls LB Nagar ( Hyderabad ) Phone 8250192130 | ₹5k To 25k With Room...VIP Call Girls LB Nagar ( Hyderabad ) Phone 8250192130 | ₹5k To 25k With Room...
VIP Call Girls LB Nagar ( Hyderabad ) Phone 8250192130 | ₹5k To 25k With Room...Suhani Kapoor
 
Vip B Aizawl Call Girls #9907093804 Contact Number Escorts Service Aizawl
Vip B Aizawl Call Girls #9907093804 Contact Number Escorts Service AizawlVip B Aizawl Call Girls #9907093804 Contact Number Escorts Service Aizawl
Vip B Aizawl Call Girls #9907093804 Contact Number Escorts Service Aizawlmakika9823
 
VVIP Pune Call Girls Katraj (7001035870) Pune Escorts Nearby with Complete Sa...
VVIP Pune Call Girls Katraj (7001035870) Pune Escorts Nearby with Complete Sa...VVIP Pune Call Girls Katraj (7001035870) Pune Escorts Nearby with Complete Sa...
VVIP Pune Call Girls Katraj (7001035870) Pune Escorts Nearby with Complete Sa...Call Girls in Nagpur High Profile
 
Malad Call Girl in Services 9892124323 | ₹,4500 With Room Free Delivery
Malad Call Girl in Services  9892124323 | ₹,4500 With Room Free DeliveryMalad Call Girl in Services  9892124323 | ₹,4500 With Room Free Delivery
Malad Call Girl in Services 9892124323 | ₹,4500 With Room Free DeliveryPooja Nehwal
 
Solution Manual for Financial Accounting, 11th Edition by Robert Libby, Patri...
Solution Manual for Financial Accounting, 11th Edition by Robert Libby, Patri...Solution Manual for Financial Accounting, 11th Edition by Robert Libby, Patri...
Solution Manual for Financial Accounting, 11th Edition by Robert Libby, Patri...ssifa0344
 
20240417-Calibre-April-2024-Investor-Presentation.pdf
20240417-Calibre-April-2024-Investor-Presentation.pdf20240417-Calibre-April-2024-Investor-Presentation.pdf
20240417-Calibre-April-2024-Investor-Presentation.pdfAdnet Communications
 

Recently uploaded (20)

Best VIP Call Girls Noida Sector 18 Call Me: 8448380779
Best VIP Call Girls Noida Sector 18 Call Me: 8448380779Best VIP Call Girls Noida Sector 18 Call Me: 8448380779
Best VIP Call Girls Noida Sector 18 Call Me: 8448380779
 
Lundin Gold April 2024 Corporate Presentation v4.pdf
Lundin Gold April 2024 Corporate Presentation v4.pdfLundin Gold April 2024 Corporate Presentation v4.pdf
Lundin Gold April 2024 Corporate Presentation v4.pdf
 
Monthly Market Risk Update: April 2024 [SlideShare]
Monthly Market Risk Update: April 2024 [SlideShare]Monthly Market Risk Update: April 2024 [SlideShare]
Monthly Market Risk Update: April 2024 [SlideShare]
 
High Class Call Girls Nagpur Grishma Call 7001035870 Meet With Nagpur Escorts
High Class Call Girls Nagpur Grishma Call 7001035870 Meet With Nagpur EscortsHigh Class Call Girls Nagpur Grishma Call 7001035870 Meet With Nagpur Escorts
High Class Call Girls Nagpur Grishma Call 7001035870 Meet With Nagpur Escorts
 
Russian Call Girls In Gtb Nagar (Delhi) 9711199012 💋✔💕😘 Naughty Call Girls Se...
Russian Call Girls In Gtb Nagar (Delhi) 9711199012 💋✔💕😘 Naughty Call Girls Se...Russian Call Girls In Gtb Nagar (Delhi) 9711199012 💋✔💕😘 Naughty Call Girls Se...
Russian Call Girls In Gtb Nagar (Delhi) 9711199012 💋✔💕😘 Naughty Call Girls Se...
 
Instant Issue Debit Cards - School Designs
Instant Issue Debit Cards - School DesignsInstant Issue Debit Cards - School Designs
Instant Issue Debit Cards - School Designs
 
Q3 2024 Earnings Conference Call and Webcast Slides
Q3 2024 Earnings Conference Call and Webcast SlidesQ3 2024 Earnings Conference Call and Webcast Slides
Q3 2024 Earnings Conference Call and Webcast Slides
 
The Economic History of the U.S. Lecture 18.pdf
The Economic History of the U.S. Lecture 18.pdfThe Economic History of the U.S. Lecture 18.pdf
The Economic History of the U.S. Lecture 18.pdf
 
Veritas Interim Report 1 January–31 March 2024
Veritas Interim Report 1 January–31 March 2024Veritas Interim Report 1 January–31 March 2024
Veritas Interim Report 1 January–31 March 2024
 
How Automation is Driving Efficiency Through the Last Mile of Reporting
How Automation is Driving Efficiency Through the Last Mile of ReportingHow Automation is Driving Efficiency Through the Last Mile of Reporting
How Automation is Driving Efficiency Through the Last Mile of Reporting
 
High Class Call Girls Nashik Maya 7001305949 Independent Escort Service Nashik
High Class Call Girls Nashik Maya 7001305949 Independent Escort Service NashikHigh Class Call Girls Nashik Maya 7001305949 Independent Escort Service Nashik
High Class Call Girls Nashik Maya 7001305949 Independent Escort Service Nashik
 
Call US 📞 9892124323 ✅ Kurla Call Girls In Kurla ( Mumbai ) secure service
Call US 📞 9892124323 ✅ Kurla Call Girls In Kurla ( Mumbai ) secure serviceCall US 📞 9892124323 ✅ Kurla Call Girls In Kurla ( Mumbai ) secure service
Call US 📞 9892124323 ✅ Kurla Call Girls In Kurla ( Mumbai ) secure service
 
Commercial Bank Economic Capsule - April 2024
Commercial Bank Economic Capsule - April 2024Commercial Bank Economic Capsule - April 2024
Commercial Bank Economic Capsule - April 2024
 
The Economic History of the U.S. Lecture 17.pdf
The Economic History of the U.S. Lecture 17.pdfThe Economic History of the U.S. Lecture 17.pdf
The Economic History of the U.S. Lecture 17.pdf
 
VIP Call Girls LB Nagar ( Hyderabad ) Phone 8250192130 | ₹5k To 25k With Room...
VIP Call Girls LB Nagar ( Hyderabad ) Phone 8250192130 | ₹5k To 25k With Room...VIP Call Girls LB Nagar ( Hyderabad ) Phone 8250192130 | ₹5k To 25k With Room...
VIP Call Girls LB Nagar ( Hyderabad ) Phone 8250192130 | ₹5k To 25k With Room...
 
Vip B Aizawl Call Girls #9907093804 Contact Number Escorts Service Aizawl
Vip B Aizawl Call Girls #9907093804 Contact Number Escorts Service AizawlVip B Aizawl Call Girls #9907093804 Contact Number Escorts Service Aizawl
Vip B Aizawl Call Girls #9907093804 Contact Number Escorts Service Aizawl
 
VVIP Pune Call Girls Katraj (7001035870) Pune Escorts Nearby with Complete Sa...
VVIP Pune Call Girls Katraj (7001035870) Pune Escorts Nearby with Complete Sa...VVIP Pune Call Girls Katraj (7001035870) Pune Escorts Nearby with Complete Sa...
VVIP Pune Call Girls Katraj (7001035870) Pune Escorts Nearby with Complete Sa...
 
Malad Call Girl in Services 9892124323 | ₹,4500 With Room Free Delivery
Malad Call Girl in Services  9892124323 | ₹,4500 With Room Free DeliveryMalad Call Girl in Services  9892124323 | ₹,4500 With Room Free Delivery
Malad Call Girl in Services 9892124323 | ₹,4500 With Room Free Delivery
 
Solution Manual for Financial Accounting, 11th Edition by Robert Libby, Patri...
Solution Manual for Financial Accounting, 11th Edition by Robert Libby, Patri...Solution Manual for Financial Accounting, 11th Edition by Robert Libby, Patri...
Solution Manual for Financial Accounting, 11th Edition by Robert Libby, Patri...
 
20240417-Calibre-April-2024-Investor-Presentation.pdf
20240417-Calibre-April-2024-Investor-Presentation.pdf20240417-Calibre-April-2024-Investor-Presentation.pdf
20240417-Calibre-April-2024-Investor-Presentation.pdf
 

unisys 2003_4Q_10K

  • 1. SECURITIES AND EXCHANGE COMMISSION WASHINGTON, D.C. 20549 FORM 10-K (Mark One) x ANNUAL REPORT PURSUANT TO SECTION 13 OR 15(d) OF THE SECURITIES EXCHANGE ACT OF 1934 For the fiscal year ended December 31, 2003 OR ¨ TRANSITION REPORT PURSUANT TO SECTION 13 OR 15(d) OF THE SECURITIES EXCHANGE ACT OF 1934 For the transition period from to . Commission file number: 1-8729 UNISYS CORPORATION (Exact name of registrant as specified in its charter) Delaware 38-0387840 (State or other jurisdiction (I.R.S. Employer of incorporation or organization) Identification No.) Unisys Way, Blue Bell, Pennsylvania 19424 (Address of principal executive offices) (Zip Code) Registrant’s telephone number, including area code: (215) 986-4011 Securities registered pursuant to Section 12(b) of the Act: Title of each class Name of each exchange on which registered Common Stock, par value $.01 New York Stock Exchange Preferred Share Purchase Rights New York Stock Exchange 1
  • 2. Securities registered pursuant to Section 12(g) of the Act: None Indicate by check mark whether the registrant (1) has filed all reports required to be filed by Section 13 or 15(d) of the Securities Exchange Act of 1934 during the preceding 12 months (or for such shorter period that the registrant was required to file such reports), and (2) has been subject to such filing requirements for the past 90 days. YES x NO ¨ Indicate by check mark if disclosure of delinquent filers pursuant to Item 405 of Regulation S-K is not contained herein, and will not be contained, to the best of registrant’s knowledge, in definitive proxy or information statements incorporated by reference in Part III of this Form 10-K or any amendment to this Form 10-K. ¨ Indicate by check mark whether the registrant is an accelerated filer (as defined in Exchange Act Rule 12b-2). YES x NO ¨ Aggregate market value of the voting and non-voting common equity held by non-affiliates as of the last business day of the registrant’s most recently completed second fiscal quarter: approximately $4.0 billion. The amount shown is based on the closing price of Unisys Common Stock as reported on the New York Stock Exchange composite tape on June 30, 2003. Voting stock beneficially held by officers and directors is not included in the computation. However, Unisys Corporation has not determined that such individuals are “affiliates” within the meaning of Rule 405 under the Securities Act of 1933. Number of shares of Unisys Common Stock, par value $.01, outstanding as of December 31, 2003: 331,780,105. DOCUMENTS INCORPORATED BY REFERENCE Portions of the Unisys Corporation 2003 Annual Report to Stockholders — Part I, Part II and Part IV. Portions of the Unisys Corporation Proxy Statement for the 2004 Annual Meeting of Stockholders — Part III. 2
  • 3. PART I ITEM 1. BUSINESS Unisys Corporation (“Unisys” or the “Company”) is a worldwide information technology services and solutions company that combines expertise in systems integration and consulting, outsourcing, infrastructure and high-end server technology to help clients achieve competitive advantage. Unisys has two business segments — Services and Technology. Financial information concerning the two segments is set forth in Note 16, “Segment information”, of the Notes to Consolidated Financial Statements appearing in the Unisys 2003 Annual Report to Stockholders, and such information is incorporated herein by reference. The principal executive offices of Unisys are located at Unisys Way, Blue Bell, Pennsylvania 19424. Principal Products and Services Unisys provides services and technology to commercial businesses and governments throughout most of the world. In the Services segment, Unisys provides end-to-end services and solutions designed to help clients improve their competitiveness and efficiency in the global marketplace. The Unisys portfolio of solutions and services includes systems integration and consulting; outsourcing, including the management of a customer’s internal information systems and management of specific business processes, such as check processing, insurance claims processing, health claims processing, mortgage administration and cargo management; infrastructure services involving the design and support of customers’ IT infrastructure, including desktops, servers, mobile and wireless systems, and networks; enterprise-wide security solutions to protect systems, networks, applications and data; and core maintenance (maintenance on Unisys proprietary products). In the Technology segment, Unisys develops servers and related products that operate in transaction-intensive, mission-critical environments. Major offerings include enterprise-class servers based on the Unisys Cellular MultiProcessing architecture, such as the ClearPath Plus family of servers, which integrates proprietary and “open” platforms, and the ES7000 family of servers, which provide enterprise-class attributes on Intel-based servers; operating system software and middleware to power high-end servers; and specialized technologies such as payment systems, chip testing and third-party products. The primary vertical markets Unisys serves worldwide include financial services, communications, transportation, commercial, and public sector, including the U.S. federal government. Products and services are marketed primarily through a direct sales force. In certain foreign countries, Unisys markets primarily through distributors. Materials Unisys purchases components and supplies from a number of suppliers around the world. For certain technology products, the Company relies on a single or limited number of suppliers, although the Company makes every effort to assure that alternative sources are available if the need arises. The failure of the Company’s suppliers to deliver components and supplies in sufficient quantities and in a timely manner could adversely affect the Company’s business. Patents, Trademarks and Licenses Unisys owns many domestic and foreign patents relating to the design and manufacture of its products, has granted licenses under certain of its patents to others and is licensed under the patents of others. Unisys does not believe that its business is materially dependent upon any single patent or license or related group thereof. Trademarks and service marks used on or in connection with Unisys products and services are considered to be valuable assets of Unisys. Seasonality The Company’s revenue is affected by such factors as the introduction of new products and services, the length of sales cycles and the seasonality of purchases. Seasonality has generally resulted in higher fourth quarter revenue than in other quarters. Customers No single customer accounts for more than 10% of Unisys revenue. Sales of commercial products and services to various agencies of the U.S. government represented 15% of total consolidated revenue in 2003. 3
  • 4. Backlog In the Services segment, firm order backlog at December 31, 2003 was $6.4 billion, compared to $6.0 billion at December 31, 2002. Approximately $2.4 billion (37%) of 2003 backlog is expected to be filled in 2004. Although the Company believes that this backlog is firm, the Company may, for commercial reasons, allow the orders to be cancelled, with or without penalty. In addition, funded government contracts included in this backlog are generally subject to termination, in whole or part, at the convenience of the government or if funding becomes unavailable. In such cases, the Company is generally entitled to receive payment for work completed plus allowable termination or cancellation costs. At the end of 2003, the Company also had $2.6 billion of potential future Services order value which it may receive under certain multi-year U.S. government contracts for which funding is appropriated annually. The comparable value of unfunded multi-year U.S. government contracts at the end of 2002 was $3.0 billion. Because of the relatively short cycle between order and shipment in its Technology segment, the Company believes that backlog information for this segment is not material to the understanding of its business. Competition Unisys business is affected by rapid change in technology in the information services and technology industries and aggressive competition from many domestic and foreign companies. Principal competitors are systems integrators, consulting and other professional services firms, outsourcing providers, infrastructure services providers, computer hardware manufacturers and software providers. Unisys competes primarily on the basis of service, product performance, technological innovation, and price. Unisys believes that its continued investment in engineering and research and development, coupled with its marketing capabilities, will have a favorable impact on its competitive position. Research and Development Unisys-sponsored research and development costs were $280.1 million in 2003, $273.3 million in 2002, and $331.5 million in 2001. Environmental Matters Capital expenditures, earnings and the competitive position of Unisys have not been materially affected by compliance with federal, state and local laws regulating the protection of the environment. Capital expenditures for environmental control facilities are not expected to be material in 2004 and 2005. Employees As of December 31, 2003, Unisys had approximately 37,300 employees. Unisys uses the title “partner” for certain members of its services business management. In using the term “partner” or “partners,” Unisys does not mean to imply that these individuals are partners in the legal sense or to imply any intention to create a separate legal entity, such as a partnership. International and Domestic Operations Financial information by geographic area is set forth in Note 16, “Segment information”, of the Notes to Consolidated Financial Statements appearing in the Unisys 2003 Annual Report to Stockholders, and such information is incorporated herein by reference. Available Information Unisys makes available, free of charge through its Internet web site at http://www.unisys.com/about__unisys/investors, its annual report on Form 10-K, quarterly reports on Form 10-Q, current reports on Form 8-K, and amendments to those reports filed or furnished pursuant to Section 13(a) or 15(d) of the Securities Exchange Act of 1934, as soon as reasonably practicable after such material is electronically filed with or furnished to the SEC. Unisys also makes available on its Internet website its Guidelines on Significant Corporate Governance Issues, the charters of the Audit Committee, Compensation Committee, Finance Committee, and Nominating and Corporate Governance Committee of its board of directors, and its Code of Ethics and Business Conduct. Such information is also available in print to stockholders upon request. 4
  • 5. ITEM 2. PROPERTIES As of December 31, 2003 , Unisys had 26 major facilities in the United States with an aggregate floor space of approximately 5.5 million square feet, located primarily in California, Georgia, Illinois, Michigan, Minnesota, Pennsylvania, Utah and Virginia. Three of these facilities, with aggregate floor space of approximately 1.5 million square feet, were owned by Unisys and 23 , with approximately 4.0 million square feet of floor space, were leased to Unisys. Approximately 4.9 million square feet of the U.S. facilities were in current operation, approximately .4 million square feet were subleased to others, and approximately .2 million square feet were being held in reserve or were declared surplus with disposition efforts in progress. As of December 31, 2003 , Unisys had 24 major facilities outside the United States with an aggregate floor space of approximately 2.5 million square feet, located primarily in Australia, Brazil, France, Germany, Netherlands, South Africa, Switzerland and the United Kingdom. Five of these facilities, with approximately .7 million square feet of floor space, were owned by Unisys and 19 , with approximately 1.8 million square feet of floor space, were leased to Unisys. Approximately 1.9 million square feet were in current operation, approximately .3 million square feet were subleased to others, and approximately .3 million square feet were being held in reserve or were declared surplus with disposition efforts in progress. Unisys major facilities include offices, laboratories, centers of excellence, manufacturing plants, warehouses, and distribution and sales centers. Unisys believes that its facilities are suitable and adequate for current and presently projected needs. Unisys continuously reviews its anticipated requirements for facilities and will from time to time acquire additional facilities, expand existing facilities, and dispose of existing facilities or parts thereof, as necessary. ITEM 3. LEGAL PROCEEDINGS As of the date of filing of this report, Unisys has no material legal proceedings required to be disclosed under this Item 3. ITEM 4. SUBMISSION OF MATTERS TO A VOTE OF SECURITY HOLDERS No matters were submitted to a vote of security holders of Unisys during the fourth quarter of 2003. ITEM 10. EXECUTIVE OFFICERS OF THE REGISTRANT Information concerning the executive officers of Unisys as of February 1, 2004 is set forth below. Name Age Position with Unisys Lawrence A. Weinbach 64 Chairman of the Board, President and Chief Executive Officer George R. Gazerwitz 63 Executive Vice President; President, Systems and Technology Joseph W. McGrath 51 Executive Vice President; President, Enterprise Transformation Services David O. Aker 57 Senior Vice President, Worldwide Human Resources Richard D. Badler 53 Senior Vice President, Corporate Communications Janet Brutschea Haugen 45 Senior Vice President and Chief Financial Officer Nancy Straus Sundheim 52 Senior Vice President, General Counsel and Secretary Janet B. Wallace 52 Senior Vice President; President, Global Infrastructure Services Leigh Alexander 46 Vice President and Chief Marketing Officer Scott A. Battersby 45 Vice President and Treasurer Leo C. Daiuto 58 Vice President, Product Development and Technology Jack F. McHale 54 Vice President, Investor Relations Carol S. Sabochick 43 Vice President and Corporate Controller There is no family relationship among any of the above-named executive officers. The By-Laws provide that the officers of Unisys shall be elected annually by the Board of Directors and that each officer shall hold office for a term of one year and until a successor is elected and qualified, or until the officer’s earlier resignation or removal. Mr. Weinbach, Chairman of the Board, President and Chief Executive Officer since 1997. Prior to that time, he held the position of Managing Partner-Chief Executive of Andersen Worldwide (Arthur Andersen and Andersen Consulting), a global professional services organization. He had been with Andersen Worldwide since 1961. Mr. Weinbach has been an officer since 1997. Mr. Gazerwitz, Executive Vice President and President, Systems and Technology since 2000. Prior to that time, he served as Executive Vice President and President of the Computer Systems Group (1996-1999). Mr. Gazerwitz has been an officer since 1984. 5
  • 6. Mr. McGrath, Executive Vice President and President, Enterprise Transformation Services since 2000. During 1999, he served as Senior Vice President of Major Accounts Sales and Chief Marketing Officer. Prior to joining Unisys in 1999, he was with Xerox Corporation from 1988 until 1998, serving as vice president and general manager of its Production Color Systems unit and as vice president of strategy and integration for the Production Systems division. Mr. McGrath has been an officer since 1999. Mr. Aker, Senior Vice President, Worldwide Human Resources since 1997. Prior to that time, he served as Vice President, Worldwide Human Resources (1995-1997). Mr. Aker has been an officer since 1995. Mr. Badler, Senior Vice President, Corporate Communications since 2002. From 1998 to 2002, he served as Vice President, Corporate Communications. Prior to joining Unisys, he was Vice President, Corporate Communications for General Instrument Corporation (1996-1998). Mr. Badler has been an officer since 1998. Ms. Haugen, Senior Vice President and Chief Financial Officer since 2000. Prior to that time, she served as Vice President and Controller and Acting Chief Financial Officer (1999-2000) and Vice President and Controller (1996-1999). Ms. Haugen has been an officer since 1996. Ms. Sundheim, Senior Vice President, General Counsel and Secretary since 2001. From 1999 to 2001, she was Vice President, Deputy General Counsel and Secretary. She had been Deputy General Counsel since 1990. Ms. Sundheim has been an officer since 1999. Ms. Wallace, Senior Vice President and President, Global Infrastructure Services since 2000. Ms. Wallace joined Unisys in 1999 as Vice President and President, Global Network Services. Prior to that, she was Vice President of Services Marketing and Sales, Compaq Computer Corporation (1998-1999); and Vice President of Marketing and Services, Digital Equipment Corporation (1993- 1998). Ms. Wallace has been an officer since 2000. Ms. Alexander, Vice President and Chief Marketing Officer since 2000. Prior to joining Unisys in 2000, she was with Comdial Corporation from 1998 serving as president, Comdial Enterprise Solutions and as Senior Vice President, Marketing. Before that, Ms. Alexander was Senior Vice President, Marketing and Strategic Planning at PageNet Corporation (1996-1997). Ms. Alexander has been an officer since 2000. Mr. Battersby, Vice President and Treasurer since 2000. Prior to that time, he served as vice president of corporate strategy and development (1998-2000); and vice president and Assistant Treasurer (1996-1998). Mr. Battersby has been an officer since 2000. Mr. Daiuto, Vice President, Product Development and Technology since 2000. Prior to that time, he had held a variety of business and engineering management positions with Unisys since he joined the Company in 1970. Mr. Daiuto has been an officer since 2000. Mr. McHale, Vice President, Investor Relations since 1997. From 1989 to 1997, he was Vice President, Investor and Corporate Communications. Mr. McHale has been an officer since 1986. Ms. Sabochick, Vice President and Corporate Controller since 2002. Prior to joining Unisys, she was with Safeguard Global Services serving as Chief Financial Officer (2001), and with AstraMerck Pharmaceuticals (1995-2000) serving as Controller. Prior to AstraMerck, she was with PricewaterhouseCoopers for 11 years. Ms. Sabochick has been an officer since 2002. 6
  • 7. PART II ITEM 5. MARKET FOR THE REGISTRANT’S COMMON EQUITY AND RELATED STOCKHOLDER MATTERS Unisys Common Stock (trading symbol “UIS”) is listed for trading on the New York Stock Exchange, on exchanges in Amsterdam, Brussels, and London and on the SWX Swiss Exchange. Information on the high and low sales prices for Unisys Common Stock is set forth under the heading “Quarterly financial information” in the Unisys 2003 Annual Report to Stockholders and is incorporated herein by reference. At December 31, 2003 , there were 331.8 million shares outstanding and approximately 26,300 stockholders of record. Unisys has not declared or paid any cash dividends on its Common Stock since 1990 and does not anticipate declaring or paying cash dividends in the foreseeable future. ITEM 6. SELECTED FINANCIAL DATA A summary of selected financial data for Unisys is set forth under the heading “Five-year summary of selected financial data” in the Unisys 2003 Annual Report to Stockholders and is incorporated herein by reference. ITEM 7. MANAGEMENT’S DISCUSSION AND ANALYSIS OF FINANCIAL CONDITION AND RESULTS OF OPERATIONS Management’s discussion and analysis of financial condition and results of operations is set forth under the heading “Management’s Discussion and Analysis of Financial Condition and Results of Operations” in the Unisys 2003 Annual Report to Stockholders and is incorporated herein by reference. ITEM 7A. QUANTITATIVE AND QUALITATIVE DISCLOSURES ABOUT MARKET RISK Information concerning market risk is set forth under the heading “Market risk” in “Management’s Discussion and Analysis of Financial Condition and Results of Operations” in the Unisys 2003 Annual Report to Stockholders and is incorporated herein by reference. ITEM 8. FINANCIAL STATEMENTS AND SUPPLEMENTARY DATA The financial statements of Unisys, consisting of the consolidated balance sheets at December 31, 2003 and 2002 and the related consolidated statements of income, cash flows and stockholders’ equity for each of the three years in the period ended December 31, 2003, appearing in the Unisys 2003 Annual Report to Stockholders, together with the report of Ernst & Young LLP, independent auditors, on the financial statements at December 31, 2003 and 2002 and for each of the three years in the period ended December 31 , 2003, appearing in the Unisys 2003 Annual Report to Stockholders, are incorporated herein by reference. Supplementary financial data, consisting of information appearing under the heading “Quarterly financial information” in the Unisys 2003 Annual Report to Stockholders, is incorporated herein by reference. ITEM 9. CHANGES IN AND DISAGREEMENTS WITH ACCOUNTANTS ON ACCOUNTING AND FINANCIAL DISCLOSURE Not applicable. ITEM 9A. CONTROLS AND PROCEDURES The Company’s management, with the participation of the Company’s Chief Executive Officer and Chief Financial Officer, has evaluated the effectiveness of the Company’s disclosure controls and procedures as of December 31, 2003. Based on this evaluation, the Company’s Chief Executive Officer and Chief Financial Officer concluded that the Company’s disclosure controls and procedures are effective for gathering, analyzing and disclosing the information the Company is required to disclose in the reports it files under the Securities Exchange Act of 1934, within the time periods specified in the SEC’s rules and forms. Such evaluation did not identify any change in the Company’s internal controls over financial reporting that occurred during the quarter ended December 31, 2003 that has materially affected, or is reasonably likely to materially affect, the Company’s internal control over financial reporting. 7
  • 8. PART III ITEM 10. DIRECTORS AND EXECUTIVE OFFICERS OF THE REGISTRANT (a) Identification of Directors. Information concerning the directors of Unisys is set forth under the headings “Nominees for Election to the Board of Directors”, “Members of the Board of Directors Continuing in Office — Term Expiring in 2005” and “Members of the Board of Directors Continuing in Office — Term Expiring in 2006” in the Unisys Proxy Statement for the 2004 Annual Meeting of Stockholders and is incorporated herein by reference. (b) Identification of Executive Officers. Information concerning executive officers of Unisys is set forth under the caption “EXECUTIVE OFFICERS OF THE REGISTRANT” in Part I, Item 10, of this report. (c) Audit Committee Financial Experts. Information concerning audit committee financial experts is set forth under the heading “Committees” in the Unisys Proxy Statement for the 2004 Annual Meeting of Stockholders and is incorporated herein by reference. (d) Identification of the Audit Committee. Information concerning the audit committee of Unisys is set forth under the heading “Committees” in the Unisys Proxy Statement for the 2004 Annual Meeting of Stockholders and is incorporated herein by reference. (e) Section 16(a) Beneficial Ownership Reporting Compliance. Information concerning compliance with beneficial ownership reporting requirements is set forth under the caption “Section 16(a) Beneficial Ownership Reporting Compliance” in the Unisys Proxy Statement for the 2004 Annual Meeting of Stockholders and is incorporated herein by reference. (f) Code of Ethics. Information concerning the Unisys Code of Ethics and Business Conduct is set forth under the caption “Code of Ethics and Business Conduct” in the Unisys Proxy Statement for the 2004 Annual Meeting of Stockholders and is incorporated herein by reference. ITEM 11. EXECUTIVE COMPENSATION Information concerning executive compensation is set forth under the headings “EXECUTIVE COMPENSATION”, “REPORT OF THE COMPENSATION COMMITTEE” and “STOCK PERFORMANCE GRAPH” in the Unisys Proxy Statement for the 2004 Annual Meeting of Stockholders and is incorporated herein by reference. ITEM 12. SECURITY OWNERSHIP OF CERTAIN BENEFICIAL OWNERS AND MANAGEMENT AND RELATED STOCKHOLDER MATTERS Information concerning securities authorized for issuance under equity compensation plans is set forth under the heading “EQUITY COMPENSATION PLAN INFORMATION” in the Unisys Proxy Statement for the 2004 Annual Meeting of Stockholders and is incorporated herein by reference. Information concerning shares of Unisys equity securities beneficially owned by certain beneficial owners and by management is set forth under the heading “SECURITY OWNERSHIP BY CERTAIN BENEFICIAL OWNERS AND MANAGEMENT” in the Unisys Proxy Statement for the 2004 Annual Meeting of Stockholders and is incorporated herein by reference. ITEM 13. CERTAIN RELATIONSHIPS AND RELATED TRANSACTIONS Information concerning certain relationships and related transactions is set forth under the heading “EXECUTIVE COMPENSATION - Transactions with Management” in the Unisys Proxy Statement for the 2004 Annual Meeting of Stockholders and is incorporated herein by reference. ITEM 14. PRINCIPAL ACCOUNTANT FEES AND SERVICES Information concerning fees and services of the Company’s principal accountants is set forth under the heading “Relationship with Independent Auditors” in the Unisys Proxy Statement for the 2004 Annual Meeting of Stockholders and is incorporated herein by reference. 8
  • 9. PART IV ITEM 15. EXHIBITS, FINANCIAL STATEMENT SCHEDULES, AND REPORTS ON FORM 8-K (a) The following documents are filed as part of this report: 1. Financial Statements from the Unisys 2003 Annual Report to Stockholders which are incorporated herein by reference: Consolidated Balance Sheets at December 31, 2003 and December 31, 2002 Consolidated Statements of Income for each of the three years in the period ended December 31, 2003 Consolidated Statements of Cash Flows for each of the three years in the period ended December 31, 2003 Consolidated Statements of Stockholders’ Equity for each of the three years in the period ended December 31, 2003 Notes to Consolidated Financial Statements Report of Independent Auditors 2. Financial Statement Schedules filed as part of this report pursuant to Item 8 of this report: Schedule Form 10-K Number Page No. II Valuation and Qualifying Accounts 11 The financial statement schedule should be read in conjunction with the consolidated financial statements and notes thereto in the Unisys 2003 Annual Report to Stockholders. Financial statement schedules not included with this report have been omitted because they are not applicable or the required information is shown in the consolidated financial statements or notes thereto. Separate financial statements of subsidiaries not consolidated with Unisys and entities in which Unisys has a fifty percent or less ownership interest have been omitted because these operations do not meet any of the conditions set forth in Rule 3-09 of Regulation S-X. 3. Exhibits. Those exhibits required to be filed by Item 601 of Regulation S-K are listed in the Exhibit Index included in this report at pages 12 through 13 Management contracts and compensatory plans and arrangements are listed as Exhibits 10.1 through 10.20. (b) Reports on Form 8-K. On October 15, 2003, Unisys furnished a Current Report on Form 8-K to provide, under Items 7 and 12, the Company’s earnings release reporting its financial results for the quarter ended September 30, 2003. Such information shall not be deemed “filed” for purposes of Section 18 of the Securities Exchange Act of 1934. 9
  • 10. SIGNATURES Pursuant to the requirements of Section 13 or 15(d) of the Securities Exchange Act of 1934, the registrant has duly caused this report to be signed on its behalf by the undersigned, thereunto duly authorized. UNISYS CORPORATION By: /s/ Lawrence A. Weinbach Date: February 17, Lawrence A. Weinbach 2004 Chairman of the Board, President and Chief Executive Officer Pursuant to the requirements of the Securities Exchange Act of 1934, this report has been signed below by the following persons on behalf of the registrant and in the capacities indicated on February 17, 2004. /s/ Lawrence A. Weinbach *Henry C. Duques Lawrence A. Weinbach Henry C. Duques Chairman of the Board, President and Chief Executive Officer (principal executive officer) and Director Director *Denise K. Fletcher Denise K. Fletcher Director /s/ Janet Brutschea Haugen *Gail D. Fosler Janet Brutschea Haugen Gail D. Fosler Senior Vice President and Chief Financial Officer (principal financial officer) Director Melvin R. Goodes /s/ Carol S. Sabochick Director Carol S. Sabochick *Edwin A. Huston Vice President and Corporate Controller (principal accounting officer) Edwin A. Huston Director Clayton M. Jones Director *J. P. Bolduc *Theodore E. Martin J. P. Bolduc Theodore E. Martin Director Director *James J. Duderstadt *By: /s/ Lawrence A. Weinbach James J. Duderstadt Lawrence A. Weinbach Director Attorney-in-Fact 10
  • 11. UNISYS CORPORATION SCHEDULE II - VALUATION AND QUALIFYING ACCOUNTS (Millions) Description Additions Balance Balance at Charged Deductions at End Beginning to Costs (1) of Period of Period and Expenses Allowance for Doubtful Accounts (deducted from accounts and notes receivable): Year Ended $ 48.3 $ 23.6 $ (21.3) $ 50.6 December 31, 2001 Year Ended $ 50.6 $ 23.9 $ (12.7) $ 61.8 December 31, 2002 Year Ended $ 61.8 $ .6 $ (12.6) $ 49.8 December 31, 2003 (1) Write-off of bad debts less recoveries. 11
  • 12. EXHIBIT INDEX Exhibit Description Number 3.1 Restated Certificate of Incorporation of Unisys Corporation (incorporated by reference to Exhibit 3.1 to the registrant’s Quarterly Report on Form 10-Q for the quarterly period ended September 30, 1999) 3.3 By-Laws of Unisys Corporation (incorporated by reference to Exhibit 3.3 to the registrant’s Annual Report on Form 10-K for the year ended December 31, 2001) 4.1 Agreement to furnish to the Commission on request a copy of any instrument defining the rights of the holders of long-term debt which authorizes a total amount of debt not exceeding 10% of the total assets of the registrant (incorporated by reference to Exhibit 4 to the registrant’s Annual Report on Form 10-K for the year ended December 31, 1982 (File No. 1-145)) 4.2 Form of Rights Agreement dated as of March 7, 1986, which includes as Exhibit A, the Certificate of Designations for the Junior Participating Preferred Stock, and as Exhibit B, the Form of Rights Certificate (incorporated by reference to Exhibit 1 to the registrant’s Registration Statement on Form 8-A, dated March 11, 1986) 4.3 Amendment No. 1, dated as of February 22, 1996, to Rights Agreement (incorporated by reference to Exhibit 4 to the registrant’s Current Report on Form 8-K dated February 22, 1996) 4.4 Amendment No. 2, dated as of December 7, 2000, to Rights Agreement (incorporated by reference to Exhibit 4 to the registrant’s Current Report on Form 8-K dated December 7, 2000) 10.1 Unisys Corporation Deferred Compensation Plan as amended and restated effective September 22, 2000 (incorporated by reference to Exhibit 10.3 to the registrant’s Quarterly Report on Form 10-Q for the quarterly period ended September 30, 2000) 10.2 Deferred Compensation Plan for Directors of Unisys Corporation, as amended and restated effective September 22, 2000 (incorporated by reference to Exhibit 10.4 to the registrant’s Quarterly Report on Form 10-Q for the quarterly period ended September 30, 2000) 10.3 Unisys Corporation Director Stock Unit Plan, as amended and restated, effective September 22, 2000 (incorporated by reference to Exhibit 10.5 to the registrant’s Quarterly Report on Form 10-Q for the quarterly period ended September 30, 2000) 10.4 Unisys Directors Stock Option Plan, as amended and restated effective September 22, 2000 (incorporated by reference to Exhibit 10.2 to the registrant’s Quarterly Report on Form 10-Q for the quarterly period ended September 30, 2000) 10.5 Unisys Executive Annual Variable Compensation Plan (incorporated by reference to Exhibit A to the registrant’s Proxy Statement, dated March 23, 1993, for its 1993 Annual Meeting of Stockholders) 10.6 1990 Unisys Long-Term Incentive Plan, as amended and restated effective September 22, 2000 (incorporated by reference to Exhibit 10.1 to the registrant’s Quarterly Report on Form 10-Q for the quarterly period ended September 30, 2000) 10.7 Unisys Corporation Executive Life Insurance Program (incorporated by reference to Exhibit 10.1 to the registrant’s Quarterly Report on Form 10-Q for the quarterly period ended June 30, 1999) 10.8 Form of Indemnification Agreement between Unisys Corporation and each of its Directors (incorporated by reference to Exhibit B to the registrant’s Proxy Statement, dated March 22, 1988, for the 1988 Annual Meeting of Stockholders) 10.9 Form of Executive Employment Agreement (incorporated by reference to Exhibit 10.1 to the registrant’s Quarterly Report on Form 10-Q for the quarterly period ended June 30, 1995) 10.10 Employment Agreement, dated April 25, 2002 between the registrant and Lawrence A. Weinbach (incorporated by reference to Exhibit 10 to the registrant’s Quarterly Report on Form 10-Q for the quarterly period ended March 31, 2002) 10.11 Amendment dated July 25, 2002, to Employment Agreement between the registrant and Lawrence A. Weinbach (incorporated by reference to Exhibit 10.2 to the registrant’s Quarterly Report on Form 10-Q for the quarterly period ended June 30, 2002) 10.12 Letter Agreement, dated June 3, 2002, between Unisys Corporation and Joseph W. McGrath (incorporated by reference to Exhibit 10.1 to the registrant’s Quarterly Report on Form 10-Q for the quarterly period ended June 30, 2002) 10.13 Unisys Corporation Supplemental Executive Retirement Income Plan, as amended through May 22, 1997 (incorporated by reference to Exhibit 10.3 to the registrant’s Quarterly Report on Form 10-Q for the quarterly period ended June 30, 1997) 10.14 Amendment 2001-1 to the Unisys Corporation Supplemental Executive Retirement Income Plan (incorporated by reference to Exhibit 10.13 to the registrant’s Annual Report on Form 10-K for the year ended December 31, 2001) 12
  • 13. 10.15 Summary of supplemental executive benefits provided to officers of Unisys Corporation (incorporated by reference to Exhibit 10.14 to the registrant’s Annual Report on Form 10-K for the year ended December 31, 2001) 10.16 Unisys Corporation Elected Officer Pension Plan, as amended through July 19, 2001 (incorporated by reference to Exhibit 10.15 to the registrant’s Annual Report on Form 10-K for the year ended December 31, 2001) 10.17 Unisys Corporation 2002 Stock Option Plan (incorporated by reference to Exhibit 10.17 to the registrant’s Annual Report on Form 10-K for the year ended December 31, 2002) 10.18 Unisys Corporation Employee Stock Purchase Plan, as amended and restated February 13, 2003 (incorporated by reference to Appendix C to the registrant’s Proxy Statement, dated March 14, 2003, for its 2003 Annual Meeting of Stockholders) 10.19 Unisys Corporation Savings Plan, amended and restated effective January 1, 2002 (incorporated by reference to Exhibit 10.19 to the registrant’s Annual Report on Form10-K for the year ended December 31, 2002) 10.20 Unisys Corporation 2003 Long-Term Incentive and Equity Compensation Plan (incorporated by reference to Appendix B to the registrant’s Proxy Statement, dated March 14, 2003, for its 2003 Annual Meeting of Stockholders) 12 Computation of Ratio of Earnings to Fixed Charges 13 Portions of the Annual Report to Stockholders of the Registrant for the year ended December 31, 2003 21 Subsidiaries of the Registrant 23 Consent of Independent Auditors 24 Power of Attorney 31.1 Certification of Lawrence A. Weinbach required by Rule 13a-14(a) or Rule 15d-14(a) 31.2 Certification of Janet Brutschea Haugen required by Rule 13a-14(a) or Rule 15d-14(a) 32.1 Certification of Lawrence A. Weinbach required by Rule 13a-14(b) or Rule 15d-14(b) and Section 906 of the Sarbanes-Oxley Act of 2002, 18 U.S.C. Section 1350 32.2 Certification of Janet Brutschea Haugen required by Rule 13a-14(b) or Rule 15d-14(b) and Section 906 of the Sarbanes-Oxley Act of 2002, 18 U.S.C. Section 1350 13
  • 14. Exhibit 12 UNISYS CORPORATION COMPUTATION OF RATIO OF EARNINGS TO FIXED CHARGES (UNAUDITED) ($ in millions) Years Ended December 31 2003 2002 2001 2000 1999 Fixed charges Interest expense $ 69.6 $ 66.5 $ 70.0 $ 79.8 $ 127.8 Interest capitalized during the period 14.5 13.9 11.8 11.4 3.6 Amortization of debt issuance expenses 3.8 2.6 2.7 3.2 4.1 Portion of rental expense representative of interest 55.2 53.0 53.9 42.2 46.3 Total Fixed Charges 143.1 136.0 138.4 136.6 181.8 Earnings Income (loss) from continuing operations before income taxes 380.5 332.8 (46.5 ) 379.0 770.3 Add (deduct) the following: Share of loss (income) of associated companies (16.2 ) 14.2 (8.6 ) (20.5 ) 8.9 Amortization of capitalized interest 10.2 8.8 5.4 2.2 — Subtotal 374.5 355.8 (49.7 ) 360.7 779.2 Fixed charges per above 143.1 136.0 138.4 136.6 181.8 Less interest capitalized during the period (14.5 ) (13.9 ) (11.8 ) (11.4 ) (3.6 ) Total earnings (loss) $ 503.1 $ 477.9 $ 76.9 $ 485.9 $ 957.4 Ratio of earnings to fixed charges 3.52 3.51 * 3.56 5.27 * Earnings for the year ended December 31, 2001 were inadequate to cover fixed charges by approximately $61.5 million. 14
  • 15. UNISYS CORPORATION Management’s Discussion and Analysis of Financial Condition and Results of Operations Overview In recent years the company has undertaken a major repositioning of its business model, its portfolio and its employee skills set to strengthen its capabilities as a services-led solutions provider. The objective of this repositioning is to capitalize on emerging growth opportunities in the information technology (“IT”) services market and deliver consistent, profitable growth for its stockholders. Recognizing the growing need in the marketplace for IT services and solutions that help clients reduce costs and enhance their competitiveness, the company has pursued services opportunities in business process outsourcing, systems integration and consulting, enterprise security, and other service areas. The company has grown its base of long-term outsourcing contracts that provide a reliable base of annuity revenue over multiple years. Through recruiting and training efforts, the company has strengthened its skills and capabilities in systems integration and consulting to capture higher-margin business opportunities in focused vertical industries. The company has also strengthened its capabilities in enterprise security to capitalize on the growing need by organizations to enhance their security profile against physical and electronic threats. In its technology business, the company has focused on high-end enterprise server technology that offers attractive margins, while de-emphasizing low-end products where margins have been under pressure due to technology commoditization. Across all of these areas, management has focused on improving its margins by pursuing value-added business and by tightly controlling costs. These efforts have enabled the company to deliver consistent financial results during a highly volatile period for the IT industry overall. In 2003 the company reported strong growth in net income and earnings per share, building on its profit growth in 2002. The company has achieved this earnings growth despite the impact of pension accounting, which has resulted in a significant decline in pension income in 2003 and 2002. The company’s focus on value-added business and tight cost control has also resulted in a substantial increase in operational cash flow in recent years. The company’s management has placed a strong emphasis on generating cash flow, which resulted in significant operating cash flow in 2003. In 2004, the company plans to maintain its focus on the areas discussed above and continue to build its capabilities as a leading provider of value-added services and high-end server technology to the IT marketplace. Results of operations Company results In 2003, the company reported net income of $258.7 million, or $.78 per diluted share, compared with $223.0 million, or $.69 per share in 2002, and a net loss of $67.1 million, or $.21 per share, in 2001. The results for 2001 include a fourth-quarter pretax charge of $276.3 million, or $.64 per share, principally for a work-force reduction. See Note 5 of the Notes to Consolidated Financial Statements. Revenue for 2003 was $5.91 billion compared with $5.61 billion in 2002 and $6.02 billion in 2001. Revenue in 2003 increased 5% from the prior year. This increase was due to an increase of 9% in Services revenue offset in part by an 8% decline in Technology revenue. Foreign currency fluctuations had a 4% positive impact on revenue in 2003 compared with 2002. Revenue in 2002 decreased 7% from the prior year. The decrease was due to a decline in Technology revenue of 16% as well as a 4% decline in Services revenue. Foreign currency fluctuations had a negligible impact on revenue in 2002. Revenue from international operations in 2003, 2002 and 2001 was $3.15 billion, $3.11 billion and $3.42 billion, respectively. Revenue from U.S. operations was $2.76 billion in 2003, $2.50 billion in 2002 and $2.60 billion in 2001. Total gross profit percent was 29.0% in 2003, 30.1% in 2002, and 24.6% in 2001. The decrease in gross profit percent in 2003 principally reflected a decline in pension income as described below. The increase in gross profit in 2002 from 2001 was principally due to the company’s focus on higher value-added business opportunities and continued tight cost controls, including the personnel reduction actions taken in 2001 and 2002. Selling, general and administrative expenses were $1.01 billion in 2003 (17.0% of revenue), $.99 billion in 2002 (17.7% of revenue), and $1.16 billion in 2001 (19.2% of revenue). The increase in 2003 from 2002 was principally due to lower pension income and foreign currency translations, offset in part by continued tight cost controls. The decrease in 2002 from 2001, net of the impacts of the fourth-quarter charge in 2001, reflected the benefits of the personnel reduction actions announced in the fourth quarter of 2001 and continued tight cost controls. Research and development (“R&D”) expenses in 2003 were $280.1 million compared with $273.3 million in 2002 and $331.5 million in 2001. The company continues to invest in high-end Cellular MultiProcessing (CMP) server technology and in key programs within its industry practices. 15
  • 16. In 2003, the company reported operating income of $427.7 million, or 7.2% of revenue, compared with operating income of $423.2 million, or 7.5% of revenue in 2002 and an operating loss of $4.5 million in 2001. Interest expense was $69.6 million in 2003, $66.5 million in 2002 and $70.0 million in 2001. The increase in 2003 was due to higher average borrowings. The decline in 2002 was principally due to lower average borrowings and lower average interest rates. Other income (expense), net, which can vary from year to year, was income of $22.4 million in 2003, an expense of $23.9 million in 2002 and income of $1.5 million in 2001. The difference in 2003 from 2002 was principally due to equity income of $18.3 million in 2003 compared with a loss of $12.4 million in 2002. Specifically, in 2003 the company recognized $12.2 million income related to its share of a subsidy recorded by Nihon Unisys, Ltd. (“NUL”) upon transfer of a portion of its pension plan obligation to the Japanese government. In 2002, the company recognized a charge of $21.8 million related to its share of an early retirement charge recorded by NUL. In addition in 2003, the company recorded $10.7 million of income related to minority investors’ share of losses of companies owned 51% by the company, compared with $.3 million in 2002. Partially offsetting these items were foreign exchange losses in 2003 of $11.3 million compared with losses in 2002 of $1.2 million. The lower other income (expense), net in 2002 from 2001 was principally due to foreign exchange losses of $1.2 million in 2002 compared with foreign exchange gains of $21.4 million in 2001 (principally due to Latin America), equity investment losses of $12.4 million in 2002 (principally due to the $21.8 million charge relating to the NUL early retirement charge discussed above) compared with equity income of $10.4 million in 2001. In addition, in 2001, the company recorded a charge of $26.5 million related to the early extinguishment of debt. Pension income for 2003 was $22.6 million compared with $143.5 million in 2002 and $170.0 million in 2001. At the beginning of each year, accounting rules require that the company establish an expected long-term rate of return on its pension plan assets. The principal reason for the decline in pension income in 2003 was that, effective January 1, 2003, the company reduced its expected long- term rate of return on plan assets for its U.S. pension plan to 8.75% from 9.50%. In addition, the discount rate used for the U.S. pension plan declined to 6.75% at December 31, 2002, from 7.50% at December 31, 2001. The remaining reasons for the decline in pension income were lower expected return on U.S. plan assets due to asset declines and the company’s change as of January 1, 2003 to a cash balance plan in the U.S. Additionally for international plans, declines in discount rates, lower expected long-term rates of return on plan assets, and currency translation contributed to lower pension income. The principal reason for the decline in pension income in 2002 was that, effective January 1, 2002, the company reduced its expected long-term rate of return on plan assets for its U.S. pension plan to 9.5% from 10.0%. The company records pension income or expense, as well as other employee-related costs such as FICA and medical insurance costs, in operating income in the following income statement categories: cost of sales, selling, general and administrative expenses, and research and development expenses. The amount allocated to each line is based on where the salaries of the active employees are charged. Income before income taxes in 2003 was $380.5 million compared with $332.8 million in 2002 and a loss of $73.0 million in 2001. The provision for income taxes in 2003 was $121.8 million (32% effective tax rate) compared with $109.8 million (33% effective tax rate) in 2002 and $(5.9) million in 2001. It is expected that the effective tax rate will be 32% for 2004. At December 31, 2003, the company owned approximately 28% of the voting common stock of NUL. The company accounts for this investment by the equity method. NUL is the exclusive supplier of the company’s hardware and software products in Japan. The company considers its investment in NUL to be of a long-term strategic nature. For the years ended December 31, 2003, 2002 and 2001, total direct and indirect sales to NUL were approximately $275 million, $270 million and $340 million, respectively. At December 31, 2003, the market value of the company’s investment in NUL was approximately $258 million and the amount of this investment recorded on the company’s books was $152 million, which is net of $74 million relating to the company’s share of NUL’s minimum pension liability adjustment. The market value is determined by both the quoted price per share of NUL’s shares on the Tokyo stock exchange and the current exchange rate of the Japanese yen to the U.S. dollar. At any point in time, the company’s book value may be higher or lower than the market value. The company would reflect impairment in this investment only if the loss in value of the investment were deemed to be other than a temporary decline. Segments results The company has two business segments: Services and Technology. Revenue classifications by segment are as follows: Services – systems integration and consulting, outsourcing, infrastructure services and core maintenance; Technology – enterprise-class servers and specialized technologies. The accounting policies of each business segment are the same as those followed by the company as a whole. Intersegment sales and transfers are priced as if the sales or transfers were to third parties. Accordingly, the Technology segment recognizes intersegment revenue and manufacturing profit on hardware and software shipments to customers under Services contracts. The Services segment, in turn, recognizes customer revenue and marketing profit on such shipments of company hardware and software to customers. The Services segment also includes the sale of hardware and software products sourced from third parties that are sold to customers through the company’s Services channels. In the company’s consolidated statements of income, the manufacturing costs of products sourced from the Technology segment and sold to Services customers are reported in cost of revenue for Services. 16
  • 17. Also included in the Technology segment’s sales and operating profit are sales of hardware and software sold to the Services segment for internal use in Services agreements. The amount of such profit included in operating income of the Technology segment for the years ended December 31, 2003, 2002 and 2001, was $24.4 million, $19.2 million and $21.8 million, respectively. The profit on these transactions is eliminated in Corporate. The company evaluates business segment performance on operating income exclusive of restructuring charges and unusual and nonrecurring items, which are included in Corporate. All other corporate and centrally incurred costs are allocated to the business segments based principally on revenue, employees, square footage or usage. See Note 16 of the Notes to Consolidated Financial Statements. Information by business segment for 2003, 2002 and 2001 is presented below: (Millions of dollars) Total Eliminations Services Technology 2003 Customer revenue $ 5,911.2 $ 4,691.9 $ 1,219.3 Intersegment $ (319.8 ) 25.9 293.9 Total revenue $ 5,911.2 $ (319.8 ) $ 4,717.8 $ 1,513.2 Gross profit percent 29.0 % 20.2 % 50.4 % Operating income percent 7.2 % 5.0 % 12.7 % 2002 Customer revenue $ 5,607.4 $ 4,285.1 $ 1,322.3 Intersegment $ (331.9 ) 38.8 293.1 Total revenue $ 5,607.4 $ (331.9 ) $ 4,323.9 $ 1,615.4 Gross profit percent 30.1 % 22.2 % 46.5 % Operating income percent 7.5 % 5.9 % 11.7 % 2001 Customer revenue $ 6,018.1 $ 4,444.6 $ 1,573.5 Intersegment $ (363.4 ) 73.8 289.6 Total revenue $ 6,018.1 $ (363.4 ) $ 4,518.4 $ 1,863.1 Gross profit percent 24.6 % 19.7 % 43.0 % Operating income percent 4.5 % 2.1 % 11.6 % Gross profit percent and operating income percent are as a percent of total revenue. In the Services segment, customer revenue was $4.69 billion in 2003, $4.29 billion in 2002 and $4.44 billion in 2001. Revenue in 2003 was up 9% from 2002, principally due to a 17% increase in outsourcing ($1.68 billion in 2003 compared with $1.44 billion in 2002), a 10% increase in systems integration and consulting ($1.60 billion in 2003 compared with $1.46 billion in 2002), a 1% increase in infrastructure services ($.84 billion in 2003 compared with $.83 billion in 2002) and a 3% increase in core maintenance ($.57 billion in 2003 compared with $.56 billion in 2002). Revenue in 2002 was down 4% from 2001, as an 11% increase in outsourcing ($1.44 billion in 2002 compared with $1.30 billion in 2001) was more than offset by a 24% decline in infrastructure services ($.83 billion in 2002 compared with $1.09 billion in 2001) and a 4% decline in core maintenance revenue ($.56 billion in 2002 compared with $.58 billion in 2001). Systems integration and consulting revenue in 2002 was $1.46 billion compared with $1.47 billion in 2001. In 2003, the systems integration business benefited from growth in the company’s U.S. Federal government business. Throughout the three years, outsourcing revenue continued to grow as the company continues to expand this business. The growth in outsourcing revenue was particularly driven by growth in business process outsourcing. Within the Services segment, the change in revenue in 2002 from 2001 reflected then-current market conditions, as well as the company’s de-emphasis of low-margin commodity hardware sales within infrastructure services contracts. Services gross profit was 20.2% in 2003, 22.2% in 2002 and 19.7% in 2001, and operating income percent was 5.0% in 2003, 5.9% in 2002 and 2.1% in 2001. The decline in gross profit and operating income margins in 2003 were principally due to a lower pension income compared with 2002. The company achieved the margin improvements in 2002 compared with 2001 by executing its strategy of selectively pursuing higher value-added business opportunities, growing its annuity-based outsourcing business and resizing its workforce to meet the market demand. 17
  • 18. In the Technology segment, customer revenue was $1.22 billion in 2003, $1.32 billion in 2002 and $1.57 billion in 2001. Demand throughout the period in the Technology segment remained weak industry-wide as customers deferred spending on new computer hardware and software. Revenue in 2003 was down 8% from 2002, due to a 21% decrease in sales of specialized technology products ($.29 billion in 2003 compared with $.37 billion in 2002) and a 3% decline in sales of enterprise-class servers ($.93 billion in 2003 compared with $.96 billion in 2002). The 8% decline in Technology customer revenue in 2003 as well as the 16% decline in customer revenue in 2002 reflected the impact of the global downturn in information technology spending on sales of high-end server products, as well as lower commodity hardware sales as a result of the company’s decision to de-emphasize sales of these products. Technology gross profit percent was 50.4% in 2003, 46.5% in 2002 and 43.0% in 2001, and Technology operating income percent was 12.7 % in 2003, 11.7% in 2002 and 11.6% in 2001. The margin improvements in 2003 primarily reflected a richer mix of ClearPath servers and software offset in part by lower pension income. The margin improvements in 2002 primarily reflected, within ClearPath revenue, a higher proportion of high-end, higher margin products, increased demand for high-end payment systems products and continued tight cost controls. New accounting pronouncements Effective January 1, 2003, the company adopted SFAS No. 145, “Rescission of FASB Statements No. 4, 44 and 64, Amendment of FASB Statement No. 13, and Technical Corrections.” SFAS No. 145 rescinds SFAS No. 4, which required that all gains and losses from extinguishment of debt be reported as an extraordinary item. Previously recorded losses on the early extinguishment of debts that were classified as an extraordinary item in prior periods have been reclassified to other income (expense), net. The adoption of SFAS No. 145 had no effect on the company’s consolidated financial position, consolidated results of operations, or liquidity. Effective January 1, 2003, the company adopted SFAS No. 146, “Accounting for Costs Associated with Exit or Disposal Activities.” SFAS No. 146 requires companies to recognize costs associated with exit or disposal activities when they are incurred rather than at the date of commitment to an exit or disposal plan. SFAS No. 146 replaces previous accounting guidance provided by Emerging Issues Task Force (“EITF”) Issue No. 94-3, “Liability Recognition for Certain Employee Termination Benefits and Other Costs to Exit an Activity (including Certain Costs Incurred in a Restructuring),” and is effective for the company for exit or disposal activities initiated after December 31, 2002. Adoption of this statement had no material impact on the company’s consolidated financial position, consolidated results of operations, or liquidity. Effective January 1, 2003, the company adopted the Financial Accounting Standards Board’s (“FASB”) Interpretation No. 45, “Guarantor’s Accounting and Disclosure Requirements for Guarantees, Including Indirect Guarantees of Indebtedness of Others, an Interpretation of FASB Statements No. 5, 57, and 107 and Rescission of FASB Interpretation No. 34” (“FIN 45”). The interpretation requires that upon issuance of a guarantee, the entity must recognize a liability for the fair value of the obligation it assumes under that guarantee. In addition, FIN 45 requires disclosures about the guarantees that an entity has issued, including a roll-forward of the entity’s product warranty liabilities. This interpretation is intended to improve the comparability of financial reporting by requiring identical accounting for guarantees issued with separately identified consideration and guarantees issued without separately identified consideration. Adoption of this Interpretation had no material impact on the company’s consolidated financial position, consolidated results of operations, or liquidity. Effective July 1, 2003, the company adopted the FASB’s consensus on EITF Issue No. 00-21, “Accounting for Revenue Arrangements with Multiple Deliverables.” This issue addresses how to account for arrangements that may involve the delivery or performance of multiple products, services, and/or rights to use assets. The final consensus of this issue is applicable to agreements entered into in fiscal periods beginning after June 15, 2003. Adoption of this issue had no material impact on the company’s consolidated financial position, consolidated results of operations, or liquidity. In January 2003, the FASB issued Interpretation No. 46 (“FIN 46”), “Consolidation of Variable Interest Entities, an interpretation of ARB 51.” The primary objectives of this interpretation are to provide guidance on the identification of entities for which control is achieved through means other than through voting rights (“variable interest entities”) and how to determine when and which business enterprise (the “primary beneficiary”) should consolidate the variable interest entity. This new model for consolidation applies to an entity in which either (i) the equity investors (if any) do not have a controlling financial interest; or (ii) the equity investment at risk is insufficient to finance that entity’s activities without receiving additional subordinated financial support from other parties. In addition, FIN 46 requires that the primary beneficiary, as well as all other enterprises with a significant variable interest in a variable interest entity, make additional disclosures. Certain disclosure requirements of FIN 46 were effective for financial statements issued after January 31, 2003. In December 2003, the FASB issued FIN 46 (revised December 2003), “Consolidation of Variable Interest Entities” (“FIN 46-R”) to address certain FIN 46 implementation issues. The effective dates and impact of FIN 46 and FIN 46-R are as follows: (i) Special-purpose entities (“SPEs”) created prior to February 1, 2003. The company must apply either the provisions of FIN 46 or early adopt the provisions of FIN 46-R at the end of the first interim or annual reporting period ending after December 15, 2003. (ii) Non-SPEs created prior to February 1, 2003. The company is required to adopt FIN 46-R at the end of the first interim or annual reporting period ending after March 15, 2004. (iii) All entities, regardless of whether an SPE, that were created subsequent to January 31, 2003. The provisions of FIN 46 were applicable for variable interests in entities obtained after January 31, 2003. The adoption of the provisions applicable to SPEs and all other variable interests obtained after January 31, 2003 did not have a material 18
  • 19. impact on the company’s consolidated financial position, consolidated results of operations, or liquidity. The company is currently evaluating the impact of adopting FIN 46-R applicable to Non-SPEs created prior to February 1, 2003 but does not expect a material impact. In May 2003, the EITF reached a consensus on Issue No. 03-5, “Applicability of AICPA Statement of Position 97-2, Software Revenue Recognition, to Non-Software Deliverables in an Arrangement Containing More-Than-Incidental Software.” The FASB ratified this consensus in August 2003. EITF Issue No. 03-5 affirms that AICPA Statement of Position 97-2 applies to non-software deliverables, such as hardware and services, in an arrangement if the software is essential to the functionality of the non-software deliverables. The adoption of EITF Issue No. 03-5 did not have a material impact on the company’s consolidated financial position, consolidated results of operations, or liquidity. Effective January 1, 2002, the company adopted SFAS No. 143, “Accounting for Asset Retirement Obligations.” This statement addresses financial accounting and reporting for legal obligations associated with the retirement of tangible long-lived assets that result from the acquisition, construction, development and normal operation of a long-lived asset. SFAS No. 143 requires that the fair value of a liability for an asset retirement obligation be recognized in the period in which it is incurred, if a reasonable estimate of fair value can be made. The associated asset retirement costs are capitalized as part of the carrying amount of the long-lived asset and subsequently allocated to expense over the asset’s useful life. Adoption of SFAS No. 143 had no effect on the company’s consolidated financial position, consolidated results of operations, or liquidity. Effective January 1, 2002, the company adopted SFAS No. 144, “Accounting for the Impairment or Disposal of Long-Lived Assets.” This statement addresses financial accounting and reporting for the impairment or disposal of long-lived assets. SFAS No. 144 requires an impairment loss to be recognized only if the carrying amounts of long-lived assets to be held and used are not recoverable from their expected undiscounted future cash flows. Adoption of SFAS No. 144 had no effect on the company’s consolidated financial position, consolidated results of operations, or liquidity. Financial condition Cash and cash equivalents at December 31, 2003 were $635.9 million compared with $301.8 million at December 31, 2002. During 2003, cash provided by operations was $529.2 million compared with $324.5 million in 2002, principally reflecting strong working capital management and an increase in profitability. Cash expenditures related to prior-year restructuring actions (which are included in operating activities) in 2003, 2002 and 2001 were $58.4 million, $104.4 million and $71.5 million, respectively, and are expected to be approximately $10 million in 2004, principally for international work-force reductions and facility costs. Personnel reductions in 2003 related to prior-year restructuring actions were approximately 500. No additional personnel reductions are expected related to prior-year restructuring actions. Cash used for investing activities in 2003 was $468.8 million compared with $379.2 million in 2002. During 2003, both proceeds from investments and purchases of investments, which represent derivative financial instruments used to manage the company’s currency exposure to market risks from changes in foreign currency exchange rates, increased from the prior year as a result of an increase in the company’s exposure, principally related to intercompany accounts. The increase in cash used for investing activities was due to net purchases of investments of $68.1 million for 2003 compared with $38.3 million in the prior-year period. In addition in 2003, the investment in marketable software was $144.1 million compared with $139.9 million in 2002, and capital additions were $251.3 million in 2003 compared with $196.2 million in 2002. The increase in capital additions principally reflected additions of revenue- generating assets, particularly in the company’s outsourcing business. Cash provided by financing activities during 2003 was $255.5 million compared with $25.3 million in 2002. In 2003, the company had net proceeds from issuance of long-term debt of $293.3 million, as described below. In addition, during 2003, there was a reduction of $64.5 million in short-term borrowings compared with a reduction of $1.6 million in 2002. In March 2003, the company issued $300 million of 6 7 / 8 % senior notes due 2010. At December 31, 2003, total debt was $1.1 billion, an increase of $238.5 million from December 31, 2002. See Note 10 of the Notes to Consolidated Financial Statements for components of the company’s long-term debt. The company has a $500 million credit agreement that expires in May 2006. As of December 31, 2003, there were no borrowings under this facility, and the entire $500 million was available for borrowings. Borrowings under the agreement bear interest based on the then-current LIBOR or prime rates and the company’s credit rating. The credit agreement contains financial and other covenants, including maintenance of certain financial ratios, a minimum level of net worth and limitations on certain types of transactions, which could reduce the amount the company is able to borrow. Events of default under the credit agreement include failure to perform covenants, material adverse change, change of control and default under other debt aggregating at least $25 million. If an event of default were to occur under the credit agreement, the lenders would be entitled to declare all amounts borrowed under it immediately due and payable. The occurrence of an event of default under the credit agreement could also cause the acceleration of obligations under certain other agreements and the termination of the company’s U.S. trade accounts receivable facility, described below. 19
  • 20. In addition, the company and certain international subsidiaries have access to certain uncommitted lines of credit from various banks. Other sources of short-term funding are operational cash flows, including customer prepayments, and the company’s U.S. trade accounts receivable facility. Using this facility, the company sells, on an ongoing basis, up to $225 million of its eligible U.S. trade accounts receivable through a wholly owned subsidiary, Unisys Funding Corporation I. The facility is renewable annually at the purchasers’ option and expires in December 2006. See Note 6 of the Notes to Consolidated Financial Statements. At December 31, 2003, the company had short-term borrowings of $17.7 million, borrowed principally by international subsidiaries, at a weighted average interest rate at December 31 of 7.4%. At December 31, 2003, the company met all covenants and conditions under its various lending and funding agreements. Since the company believes that it will continue to meet these covenants and conditions, the company believes that it has adequate sources and availability of short-term funding to meet its expected cash requirements. As described more fully in Notes 5, 10 and 13 of the Notes to Consolidated Financial Statements, at December 31, 2003 the company had certain cash obligations, which are due as follows: (Millions) Total Less than 1 year 1-3 years 4-5 years After 5 years Notes payable $ 17.7 $ 17.7 Long-term debt 1,050.0 $ 550.0 $ 200.0 $ 300.0 Capital lease obligations 5.6 2.2 2.2 1.2 Operating leases 657.0 130.0 184.8 116.7 225.5 Minimum purchase obligations 20.0 10.0 10.0 Work-force reductions 5.8 5.0 .8 Total $ 1,756.1 $ 164.9 $ 747.8 $ 317.9 $ 525.5 As more fully described in Note 13 to the Notes to Consolidated Financial Statements, the company could have an additional obligation under an operating lease for one of its facilities. At December 31, 2003, the company had outstanding standby letters of credit and surety bonds of approximately $280 million related to performance and payment guarantees. On the basis of experience with these arrangements, the company believes that any obligations that may arise will not be material. The company may, from time to time, redeem, tender for, or repurchase its securities in the open market or in privately negotiated transactions depending upon availability, market conditions, and other factors. The company has on file with the Securities and Exchange Commission an effective registration statement covering $1.2 billion of debt or equity securities, which enables the company to be prepared for future market opportunities. Stockholders’ equity increased $539.2 million during 2003, principally reflecting a reduction in the minimum pension liability adjustment of $164.8 million, currency translation of $65.3 million, net income of $258.7 million, $50.6 million for issuance of stock under stock option and other plans, and $4.9 million of tax benefits related to employee stock plans. Market risk The company has exposure to interest rate risk from its short-term and long-term debt. In general, the company’s long-term debt is fixed rate, and the short-term debt is variable rate. See Note 10 of the Notes to Consolidated Financial Statements for components of the company’s long-term debt. The company believes that the market risk assuming a hypothetical 10% increase in interest rates would not be material to the fair value of these financial instruments, or the related cash flows, or future results of operations. The company is also exposed to foreign currency exchange rate risks. The company uses derivative financial instruments to reduce its exposure to market risks from changes in foreign currency exchange rates. The derivative instruments used are foreign exchange forward contracts and foreign exchange options. See Note 14 of the Notes to Consolidated Financial Statements for additional information on the company’s derivative financial instruments. 20
  • 21. The company has performed a sensitivity analysis assuming a hypothetical 10% adverse movement in foreign currency exchange rates applied to these derivative financial instruments described above. As of December 31, 2003 and 2002, the analysis indicated that such market movements would have reduced the estimated fair value of these derivative financial instruments by approximately $58 million and $45 million, respectively. Based on changes in the timing and amount of interest rate and foreign currency exchange rate movements and the company’s actual exposures and hedges, actual gains and losses in the future may differ from the above analysis. Critical accounting policies Outsourcing In recent years, the company’s outsourcing business has increased significantly. Typically the terms of these contracts are between three and 10 years. In a number of these arrangements, the company hires certain of the customers’ employees and often becomes responsible for the related employee obligations, such as pension and severance commitments. In addition, system development activity on outsourcing contracts may require significant upfront investments by the company. The company funds these investments, and any employee-related obligations, from customer prepayments and operating cash flow. Also, in the early phases of these contracts, gross margins may be lower than in later years when the work force and facilities have been rationalized for efficient operations, and an integrated systems solution has been implemented. Revenue under these contracts is recognized when the company performs the services or processes transactions in accordance with contractual performance standards. Customer prepayments (even if nonrefundable) are deferred (classified as a liability) and recognized systematically over future periods as services are delivered or performed. Costs on outsourcing contracts are generally charged to expense as incurred. However, direct costs incurred related to the inception of an outsourcing contract are deferred and charged to expense over the contract term. These costs consist principally of initial customer setup and employment obligations related to employees assumed. In addition, the costs of equipment and software, some of which is internally developed, is capitalized and depreciated over the shorter of their life or the term of the contract. At December 31, 2003 and 2002, the net capitalized amount related to outsourcing contracts was $477.5 million, and $321.0 million, respectively. These costs are tested for recoverability quarterly. Systems integration For long-term systems integration contracts, the company recognizes revenue and profit as the contracts progress using the percentage-of-completion method of accounting, which relies on estimates of total expected contract revenues and costs. The company follows this method since reasonably dependable estimates of the revenue and costs applicable to various elements of a contract can be made. Since the financial reporting of these contracts depends on estimates, which are assessed continually during the term of the contracts, recognized revenue and profit are subject to revisions as the contract progresses to completion. Revisions in profit estimates are reflected in the period in which the facts that give rise to the revision become known. Accordingly, favorable changes in estimates result in additional revenue and profit recognition, and unfavorable changes in estimates result in a reduction of recognized revenue and profit. When estimates indicate that a loss will be incurred on a contract upon completion, a provision for the expected loss is recorded in the period in which the loss becomes evident. As work progresses under a loss contract, revenue continues to be recognized, and a portion of the contract costs incurred in each period is charged to the contract loss reserve. For other systems integration projects, the company recognizes revenue when the services have been performed. Taxes The company accounts for income taxes in accordance with SFAS No. 109, “Accounting for Income Taxes,” which requires that deferred tax assets and liabilities be recognized using enacted tax rates for the effect of temporary differences between the book and tax bases of recorded assets and liabilities. SFAS No. 109 also requires that deferred tax assets be reduced by a valuation allowance, if it is more likely than not that some portion or all of the deferred tax asset will not be realized. At December 31, 2003 and 2002, the company had deferred tax assets in excess of deferred tax liabilities of $2,034 million and $2,178 million, respectively. For the reasons cited below, at December 31, 2003 and 2002, management determined that it is more likely than not that $1,583 million and $1,726 million, respectively, of such assets will be realized, resulting in a valuation allowance of $451 million and $452 million, respectively. The company evaluates quarterly the realizability of its deferred tax assets by assessing its valuation allowance and by adjusting the amount of such allowance, if necessary. The factors used to assess the likelihood of realization are the company’s forecast of future taxable income and available tax planning strategies that could be implemented to realize the net deferred tax assets. The company has used tax planning strategies to realize or renew net deferred tax assets in order to avoid the potential loss of future tax benefits. 21
  • 22. Approximately $4.8 billion of future taxable income (predominately U.S.) ultimately is needed to realize the net deferred tax assets at December 31, 2003. Failure to achieve forecasted taxable income might affect the ultimate realization of the net deferred tax assets. Factors that may affect the company’s ability to achieve sufficient forecasted taxable income include, but are not limited to, the following: increased competition, a decline in sales or margins, loss of market share, delays in product availability or technological obsolescence. In addition, the company operates within multiple taxing jurisdictions and is subject to audit in these jurisdictions. These audits can involve complex issues, which may require an extended period of time to resolve. In management’s opinion, adequate provisions for income taxes have been made for all years. Pensions The company accounts for its defined benefit pension plans in accordance with SFAS No. 87, “Employers’ Accounting for Pensions,” which requires that amounts recognized in financial statements be determined on an actuarial basis. As permitted by SFAS No. 87, the company uses a calculated value of plan assets (which is further described below). SFAS No. 87 allows that the effects of the performance of the pension plan’s assets and changes in pension liability discount rates on the company’s computation of pension income (expense) be amortized over future periods. A substantial portion of the company’s pension amounts relates to its defined benefit plan in the United States. A significant element in determining the company’s pension income (expense) in accordance with SFAS No. 87 is the expected long- term rate of return on plan assets. The company sets the expected long-term rate of return based on the expected long-term return of the various asset categories in which it invests. The company considers the current expectations for future returns and the actual historical returns of each asset class. Also, since the company’s investment policy is to actively manage certain asset classes where the potential exists to outperform the broader market, the expected returns for those asset classes are adjusted to reflect the expected additional returns. For 2004 and 2003, the company has assumed that the expected long-term rate of return on U.S. plan assets will be 8.75%. A change of 25 basis points in the expected long-term rate of return for the company’s U.S. pension plan causes a change of approximately $10 million in pension expense. The assumed long-term rate of return on assets is applied to a calculated value of plan assets, which recognizes changes in the fair value of plan assets in a systematic manner over four years. This produces the expected return on plan assets that is included in pension income (expense). The difference between this expected return and the actual return on plan assets is deferred. The net deferral of past asset gains (losses) affects the calculated value of plan assets and, ultimately, future pension income (expense). At December 31, 2003, for the company’s U.S. defined benefit pension plan, the calculated value of plan assets was $4.48 billion compared with the fair value of plan assets of $4.13 billion. At the end of each year, the company determines the discount rate to be used to calculate the present value of plan liabilities. The discount rate is an estimate of the current interest rate at which the pension liabilities could be effectively settled at the end of the year. In estimating this rate, the company looks to rates of return on high-quality, fixed-income investments that (i) receive one of the two highest ratings given by a recognized ratings agency and (ii) are currently available and expected to be available during the period to maturity of the pension benefits. At December 31, 2003, the company determined this rate to be 6.25% for its U.S. defined benefit pension plan, a decrease of 50 basis points from the rate used at December 31, 2002. A change of 25 basis points in the U.S. discount rate causes a change in pension expense of approximately $11 million and a change of approximately $105 million in the projected benefit obligation. The net effect of changes in the discount rate, as well as the net effect of other changes in actuarial assumptions and experience, have been deferred, as permitted by SFAS No. 87. Management chose the above assumptions as to the expected long-term rate of return on plan assets and the discount rate with consultation from and concurrence of the company’s outside actuaries. SFAS No. 87 defines gains and losses as changes in the amount of either the projected benefit obligation or plan assets resulting from experience different from that assumed and from changes in assumptions. Because gains and losses may reflect refinements in estimates as well as real changes in economic values and because some gains in one period may be offset by losses in another and vice versa, SFAS No. 87 does not require recognition of gains and losses as components of net pension cost of the period in which they arise. As a minimum, amortization of an unrecognized net gain or loss must be included as a component of net pension cost for a year if, as of the beginning of the year, that unrecognized net gain or loss exceeds 10 percent of the greater of the projected benefit obligation or the calculated value of plan assets. If amortization is required, the minimum amortization is that excess above the 10 percent divided by the average remaining service period of active employees expected to receive benefits under the plan. For the company’s U.S. defined benefit pension plan, that period is approximately nine years. At December 31, 2003, based on the calculated value of plan assets, the estimated unrecognized loss was $1.25 billion. For the year ended December 31, 2003, the company recognized consolidated pretax pension income of $22.6 million, compared with $143.5 million of consolidated pretax pension income for the year ended December 31, 2002. Approximately $80 million of the decline was in the U.S., and $40 million was in international subsidiaries, principally the plans in the United Kingdom. The reasons 22
  • 23. for the decline in the U.S. were as follows: (a) a reduction in the expected long-term rate of return on plan assets from 9.50% to 8.75%, (b) a decline in the discount rate from 7.50% to 6.75%, (c) lower expected returns on plan assets due to lower assets than the prior year, and (d) the change to a cash balance plan which was effective January 1, 2003. The decline in international plans was principally due to declines in discount rates, lower expected long-term rates of returns on plan assets and currency translations. For 2004, the company expects to recognize pension expense of approximately $85 million ($33 million of expense in the U.S. and $52 million of expense in international plans). This would represent a change of approximately $108 million from 2003, substantially all in the U.S. The change in the U.S. will be due to: (a) lower expected returns on plan assets of approximately $35 million due to amortization of the difference between the calculated value of plan assets and the fair value of plan assets, (b) a 50 basis-point reduction in the discount rate, which causes an approximate $23 million increase in pension expense, and (c) an approximate $44 million increase in amortization of net unrecognized losses. During 2003, the company made cash contributions to its worldwide defined benefit pension plans of approximately $63 million and expects to make cash contributions of approximately $66 million during 2004. In accordance with regulations governing contributions to U.S. defined benefit pension plans, the company is not required to fund its U.S. qualified defined benefit plan in 2004. At December 31 of each year, accounting rules require a company to recognize a liability on its balance sheet for each pension plan if the fair value of the assets of that pension plan is less than the present value of the pension obligation (the accumulated benefit obligation, or “ABO”). This liability is called a “minimum pension liability.” Concurrently, any existing prepaid pension asset for the pension plan must be removed. These adjustments are recorded as a charge in “accumulated other comprehensive income (loss)” in stockholders’ equity. If at any future year-end, the fair value of the pension plan assets exceeds the ABO, the charge to stockholders’ equity would be reversed for such plan. Alternatively, if the fair market value of pension plan assets experiences further declines or the discount rate is reduced, additional charges to accumulated other comprehensive income (loss) may be required at a future year- end. At December 31, 2002, for all of the company’s defined benefit pension plans, the ABO exceeded the fair value of pension plan assets. At December 31, 2003, the difference between the ABO and the fair value of pension plan assets decreased. As a result at December 31, 2003, the company adjusted its minimum pension liability as follows: decreased its pension plan liabilities by approximately $300 million, increased its investments at equity by approximately $6 million relating to the company’s share of the change in NUL’s minimum pension liability, decreased prepaid pension asset by $56 million, and offset these changes by a credit to other comprehensive income of approximately $250 million, or $165 million net of tax. This accounting has no effect on the company’s net income, liquidity or cash flows. Financial ratios and net worth covenants in the company’s credit agreements and debt securities are unaffected by charges or credits to stockholders’ equity caused by adjusting a minimum pension liability. Factors that may affect future results From time to time, the company provides information containing “forward-looking” statements, as defined in the Private Securities Litigation Reform Act of 1995. Forward-looking statements provide current expectations of future events and include any statement that does not directly relate to any historical or current fact. Words such as “anticipates,” “believes,” “expects,” “intends,” “plans,” “projects” and similar expressions may identify such forward-looking statements. All forward-looking statements rely on assumptions and are subject to risks, uncertainties and other factors that could cause the company’s actual results to differ materially from expectations. These other factors include, but are not limited to, those discussed below. Any forward-looking statement speaks only as of the date on which that statement is made. The company assumes no obligation to update any forward-looking statement to reflect events or circumstances that occur after the date on which the statement is made. The company’s business is affected by changes in general economic and business conditions. The company continues to face a challenging economic environment. In this environment, many organizations are delaying planned purchases of information technology products and services. If the level of demand for the company’s products and services declines in the future, the company’s business could be adversely affected. The company’s business could also be affected by acts of war, terrorism or natural disasters. Current world tensions could escalate and this could have unpredictable consequences on the world economy and on our business. The information services and technology markets in which the company operates include a large number of companies vying for customers and market share both domestically and internationally. The company’s competitors include systems integrators, consulting and other professional services firms, outsourcing providers, infrastructure services providers, computer hardware manufacturers and software providers. Some of the company’s competitors may develop competing products and services that offer better price- performance or that reach the market in advance of the company’s offerings. Some competitors also have or may develop greater financial and other resources than the company, with enhanced ability to compete for market share, in some instances through significant economic incentives to secure contracts. Some also may be better able to compete for skilled professionals. Any of these factors could have an adverse effect on the company’s business. Future results will depend on the company’s ability to mitigate the 23