Download to read offline


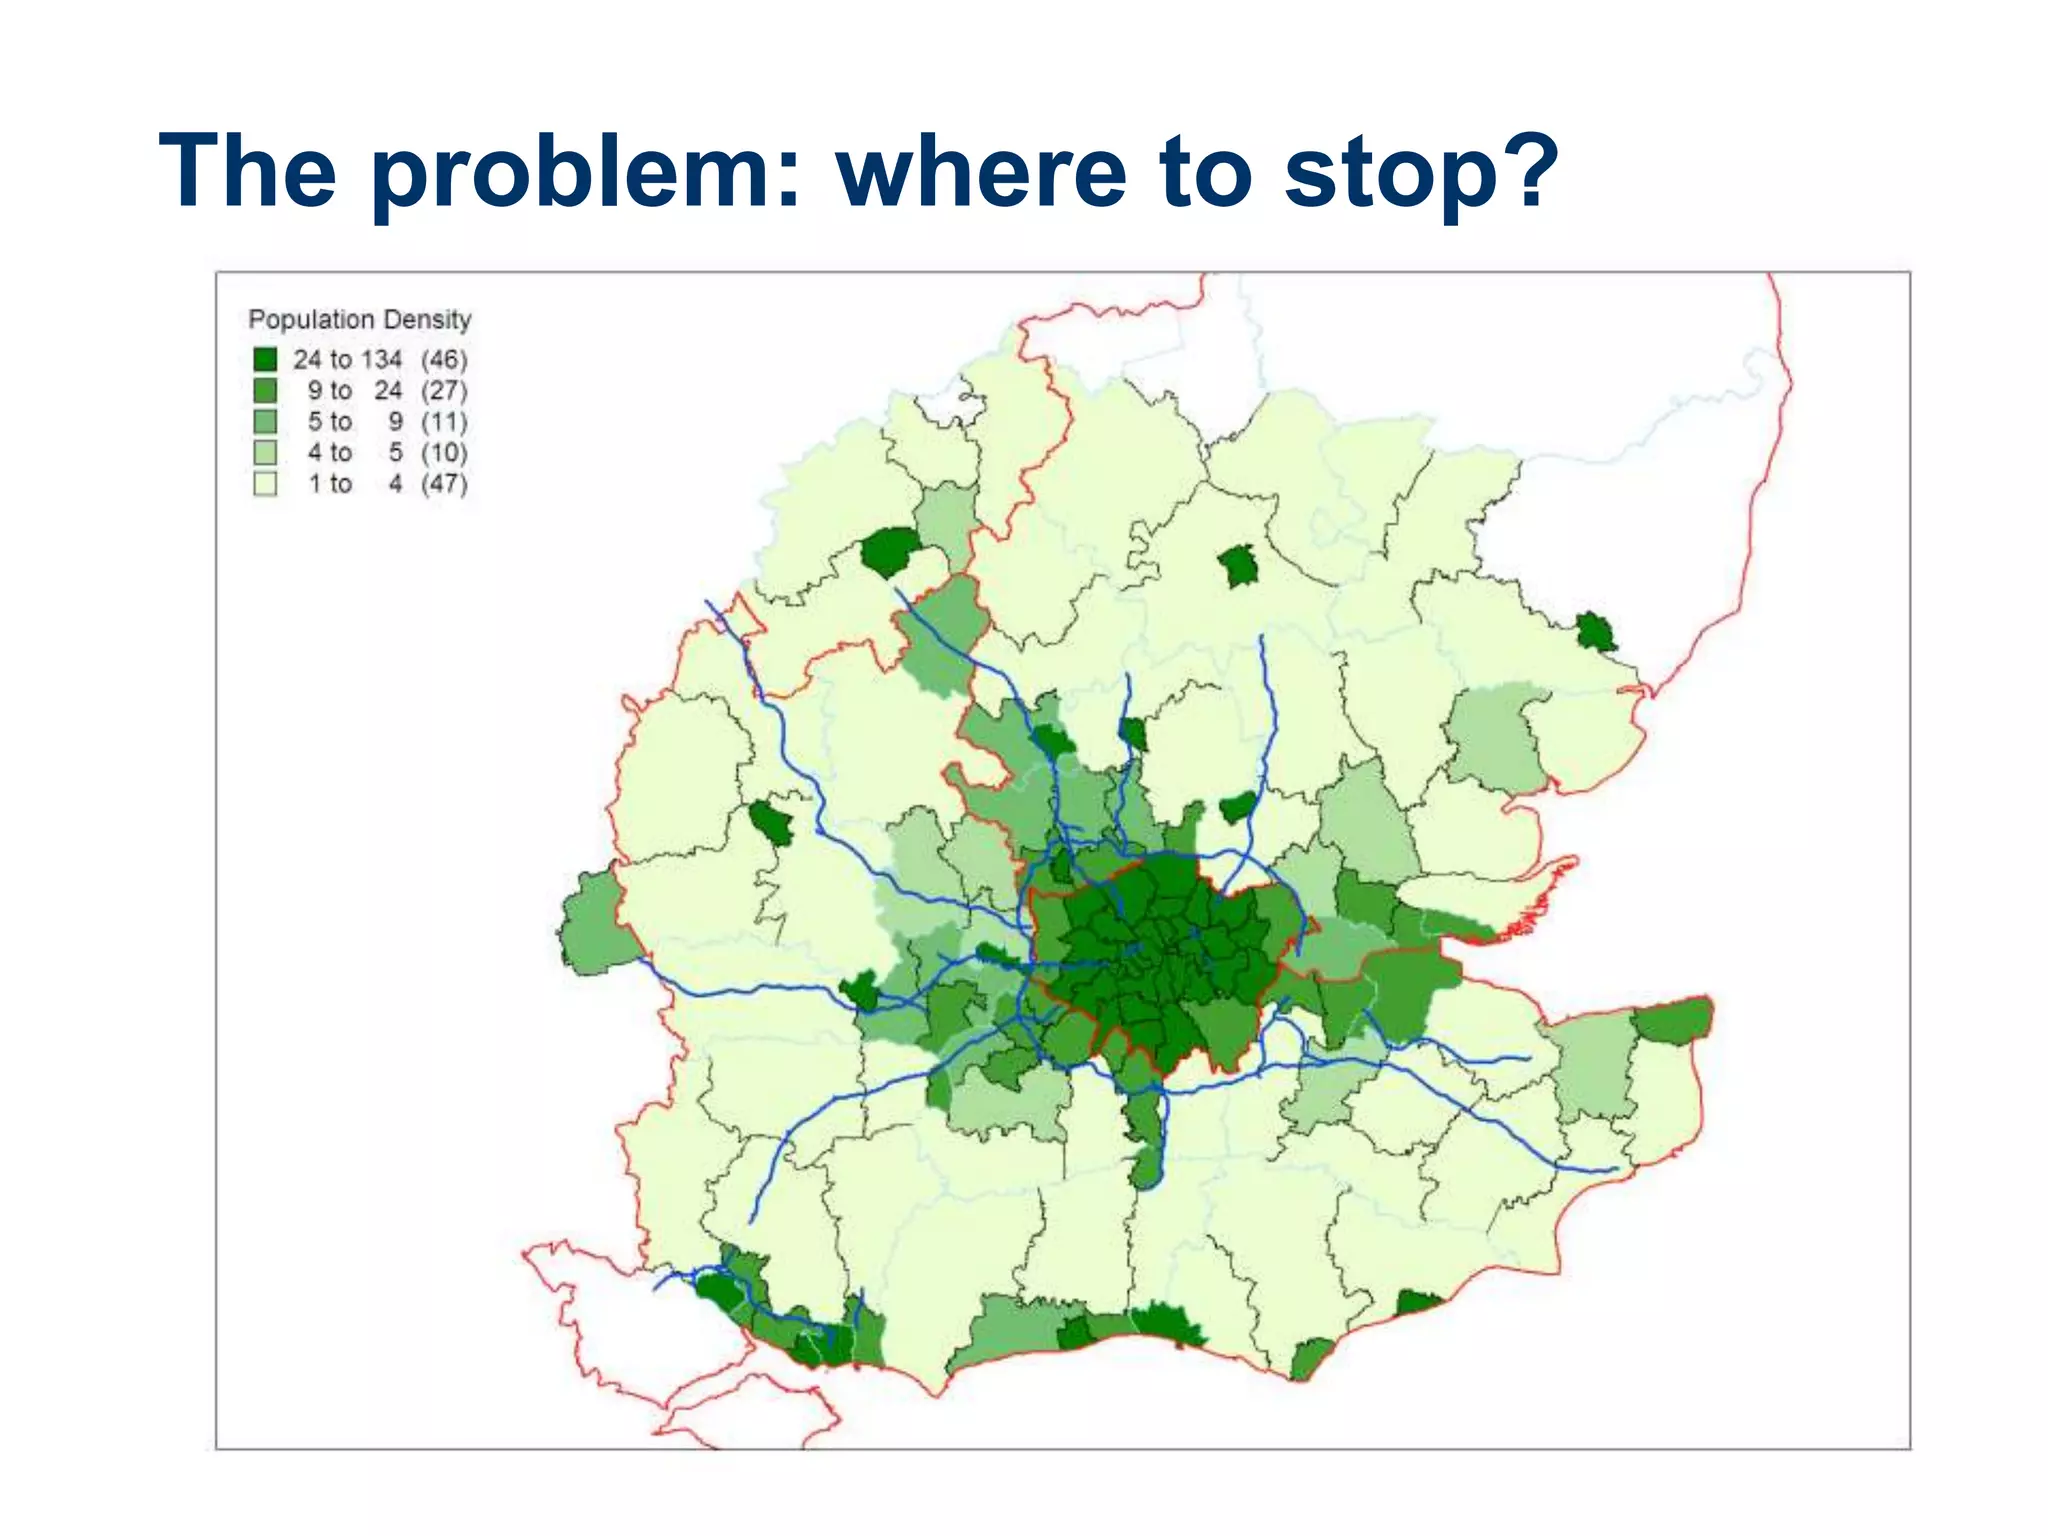


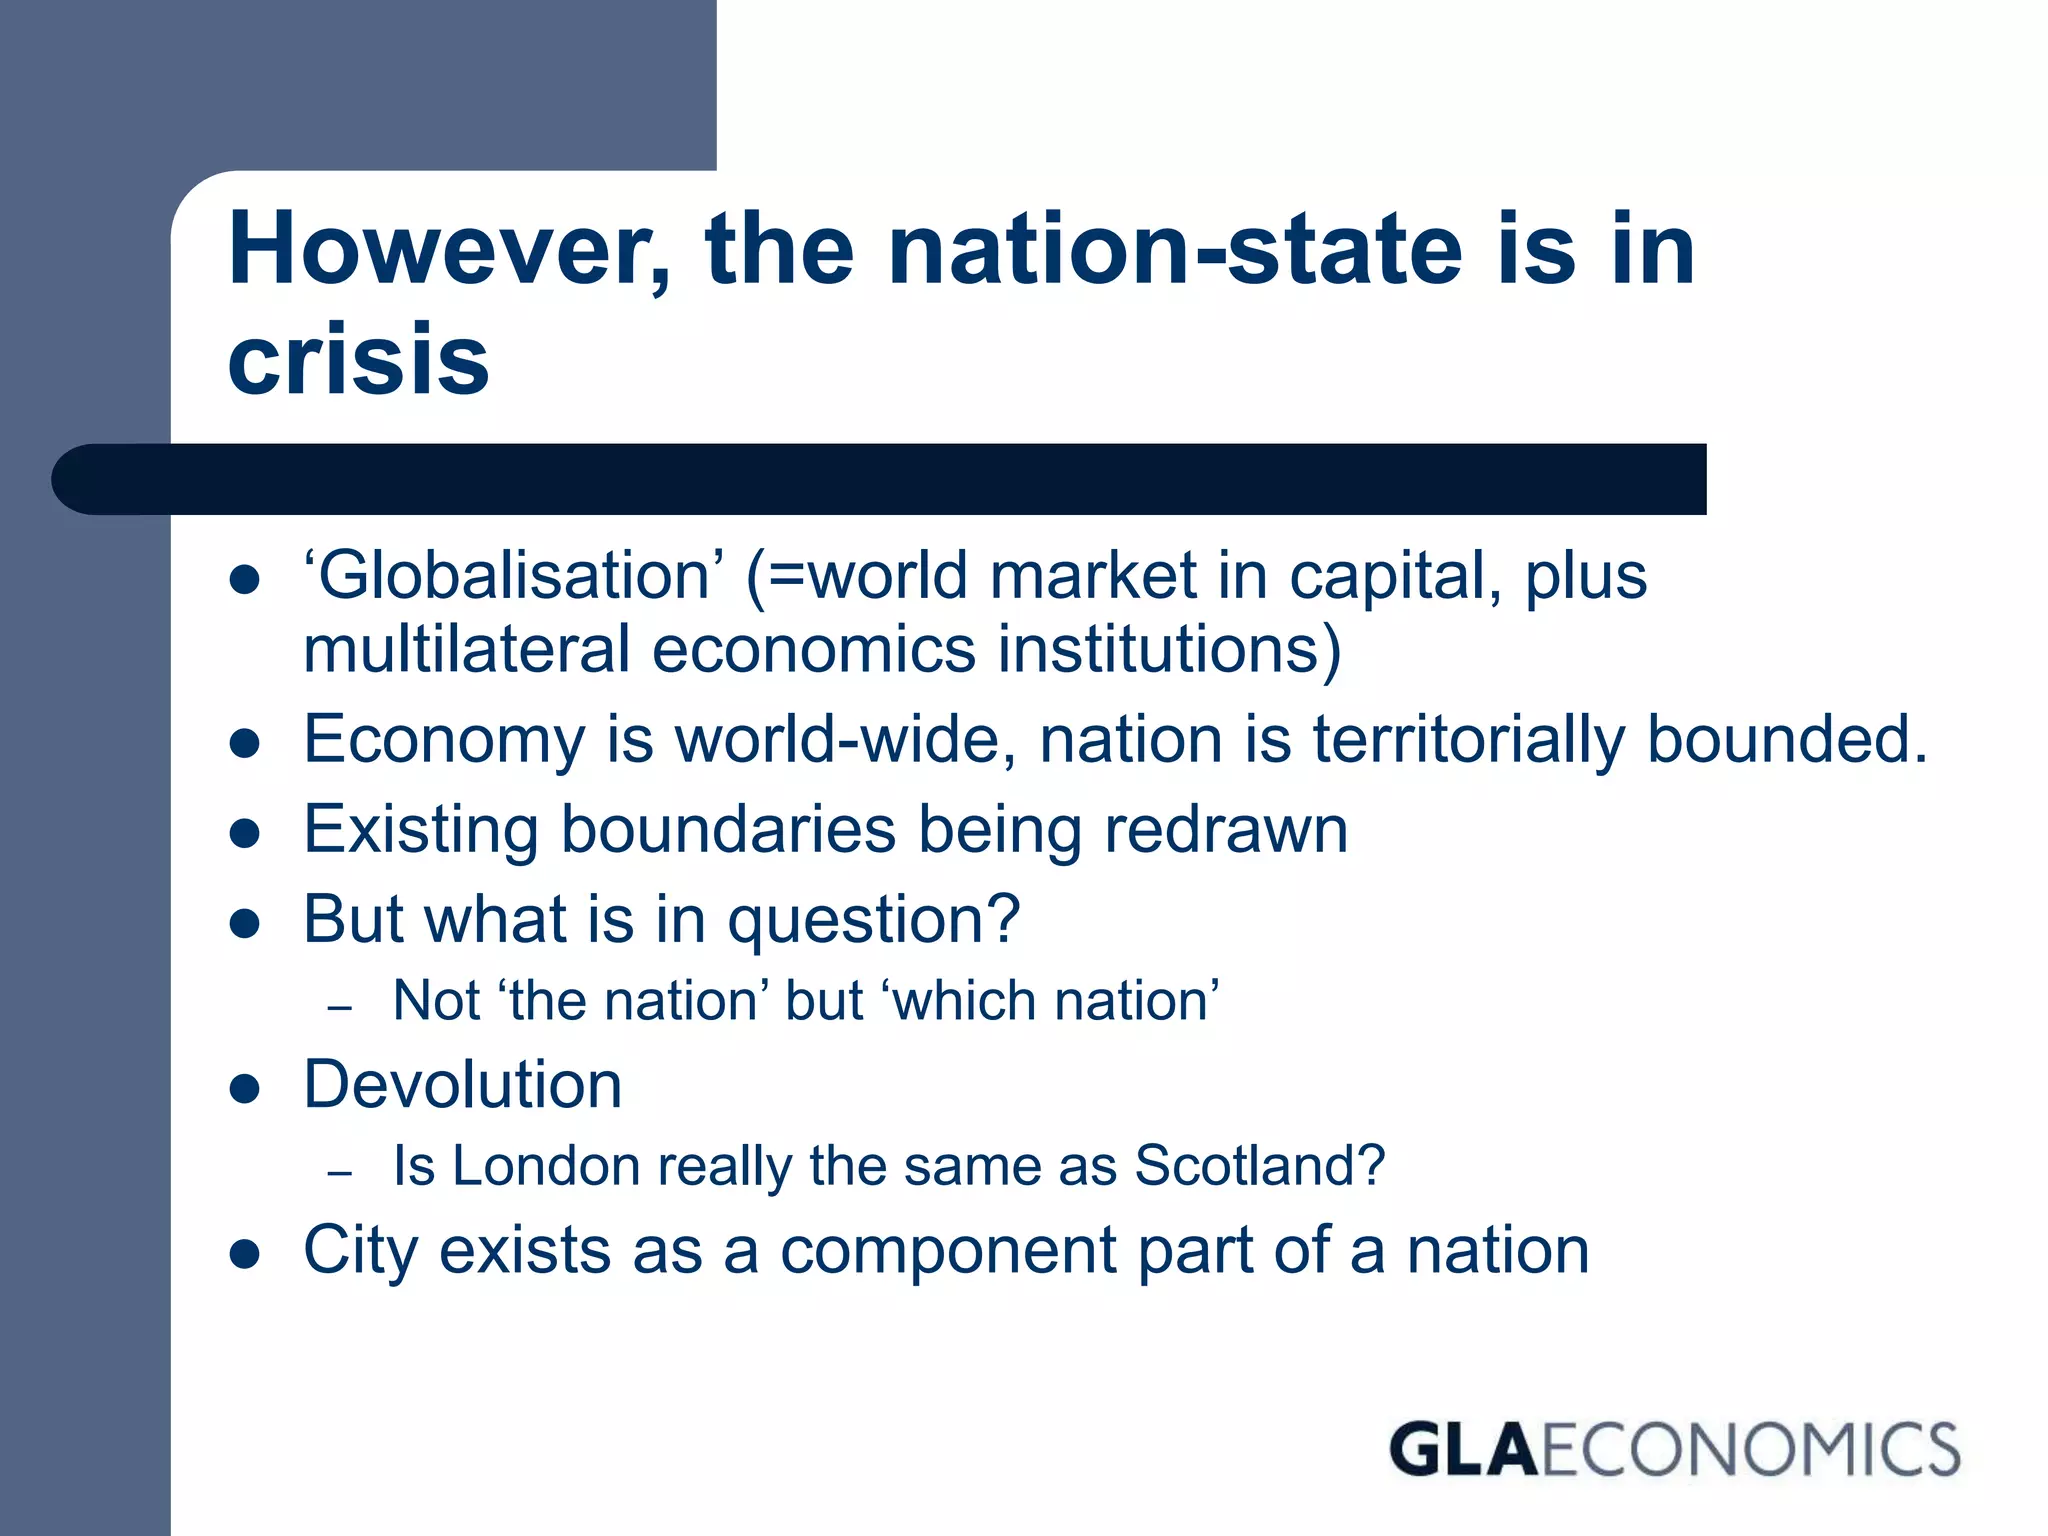

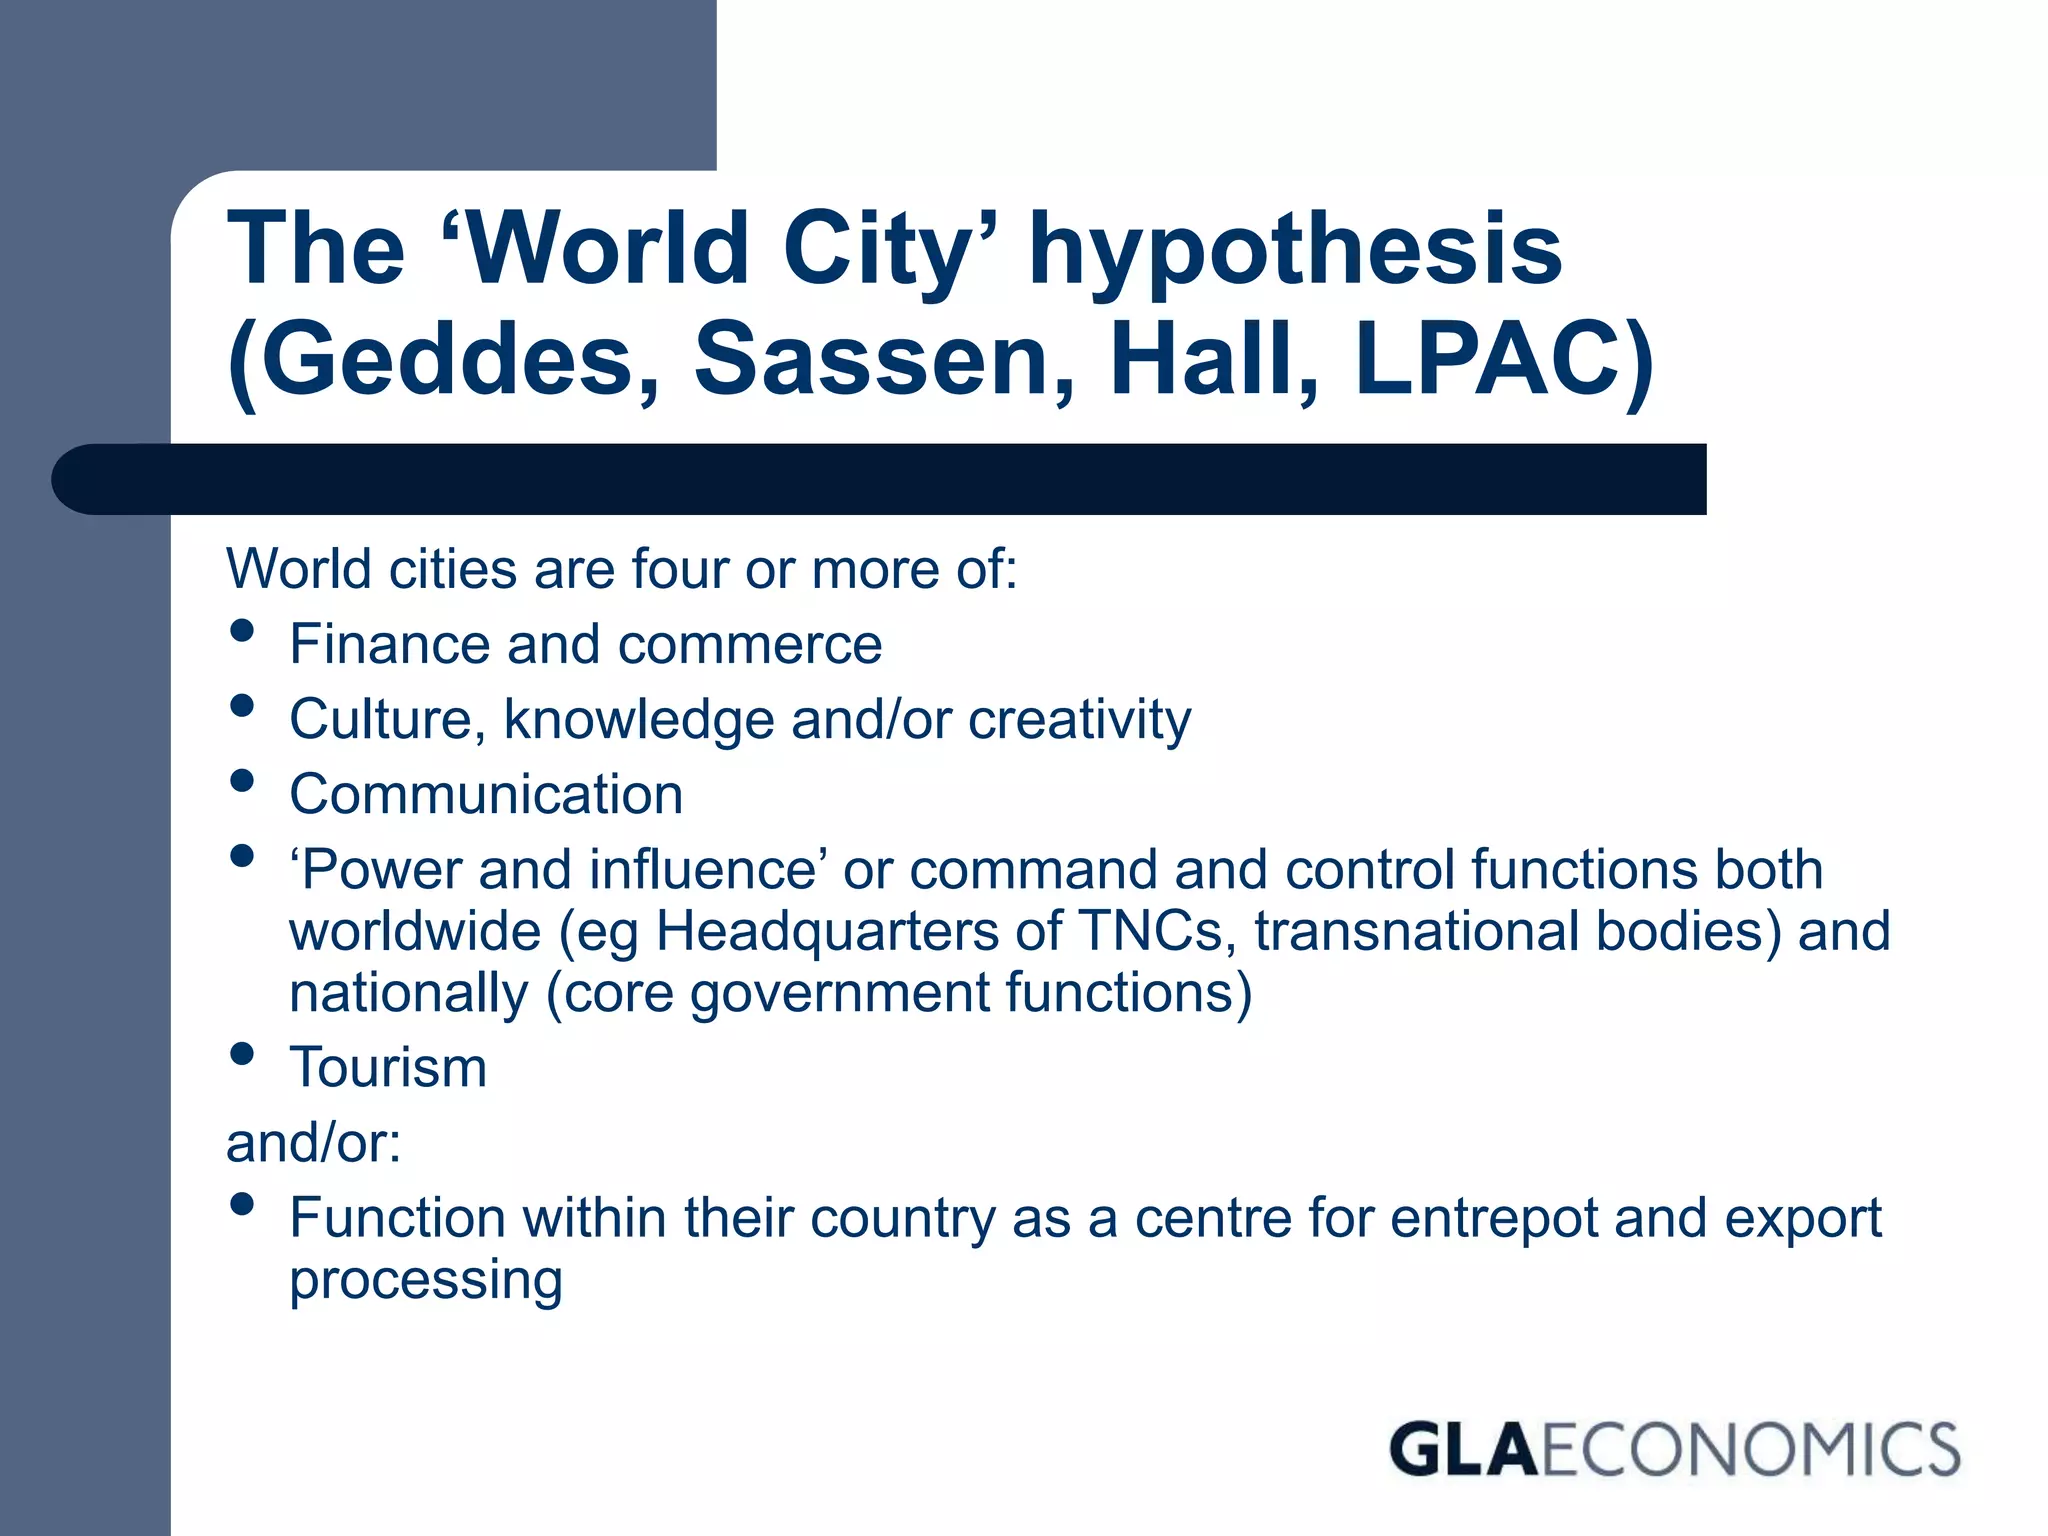


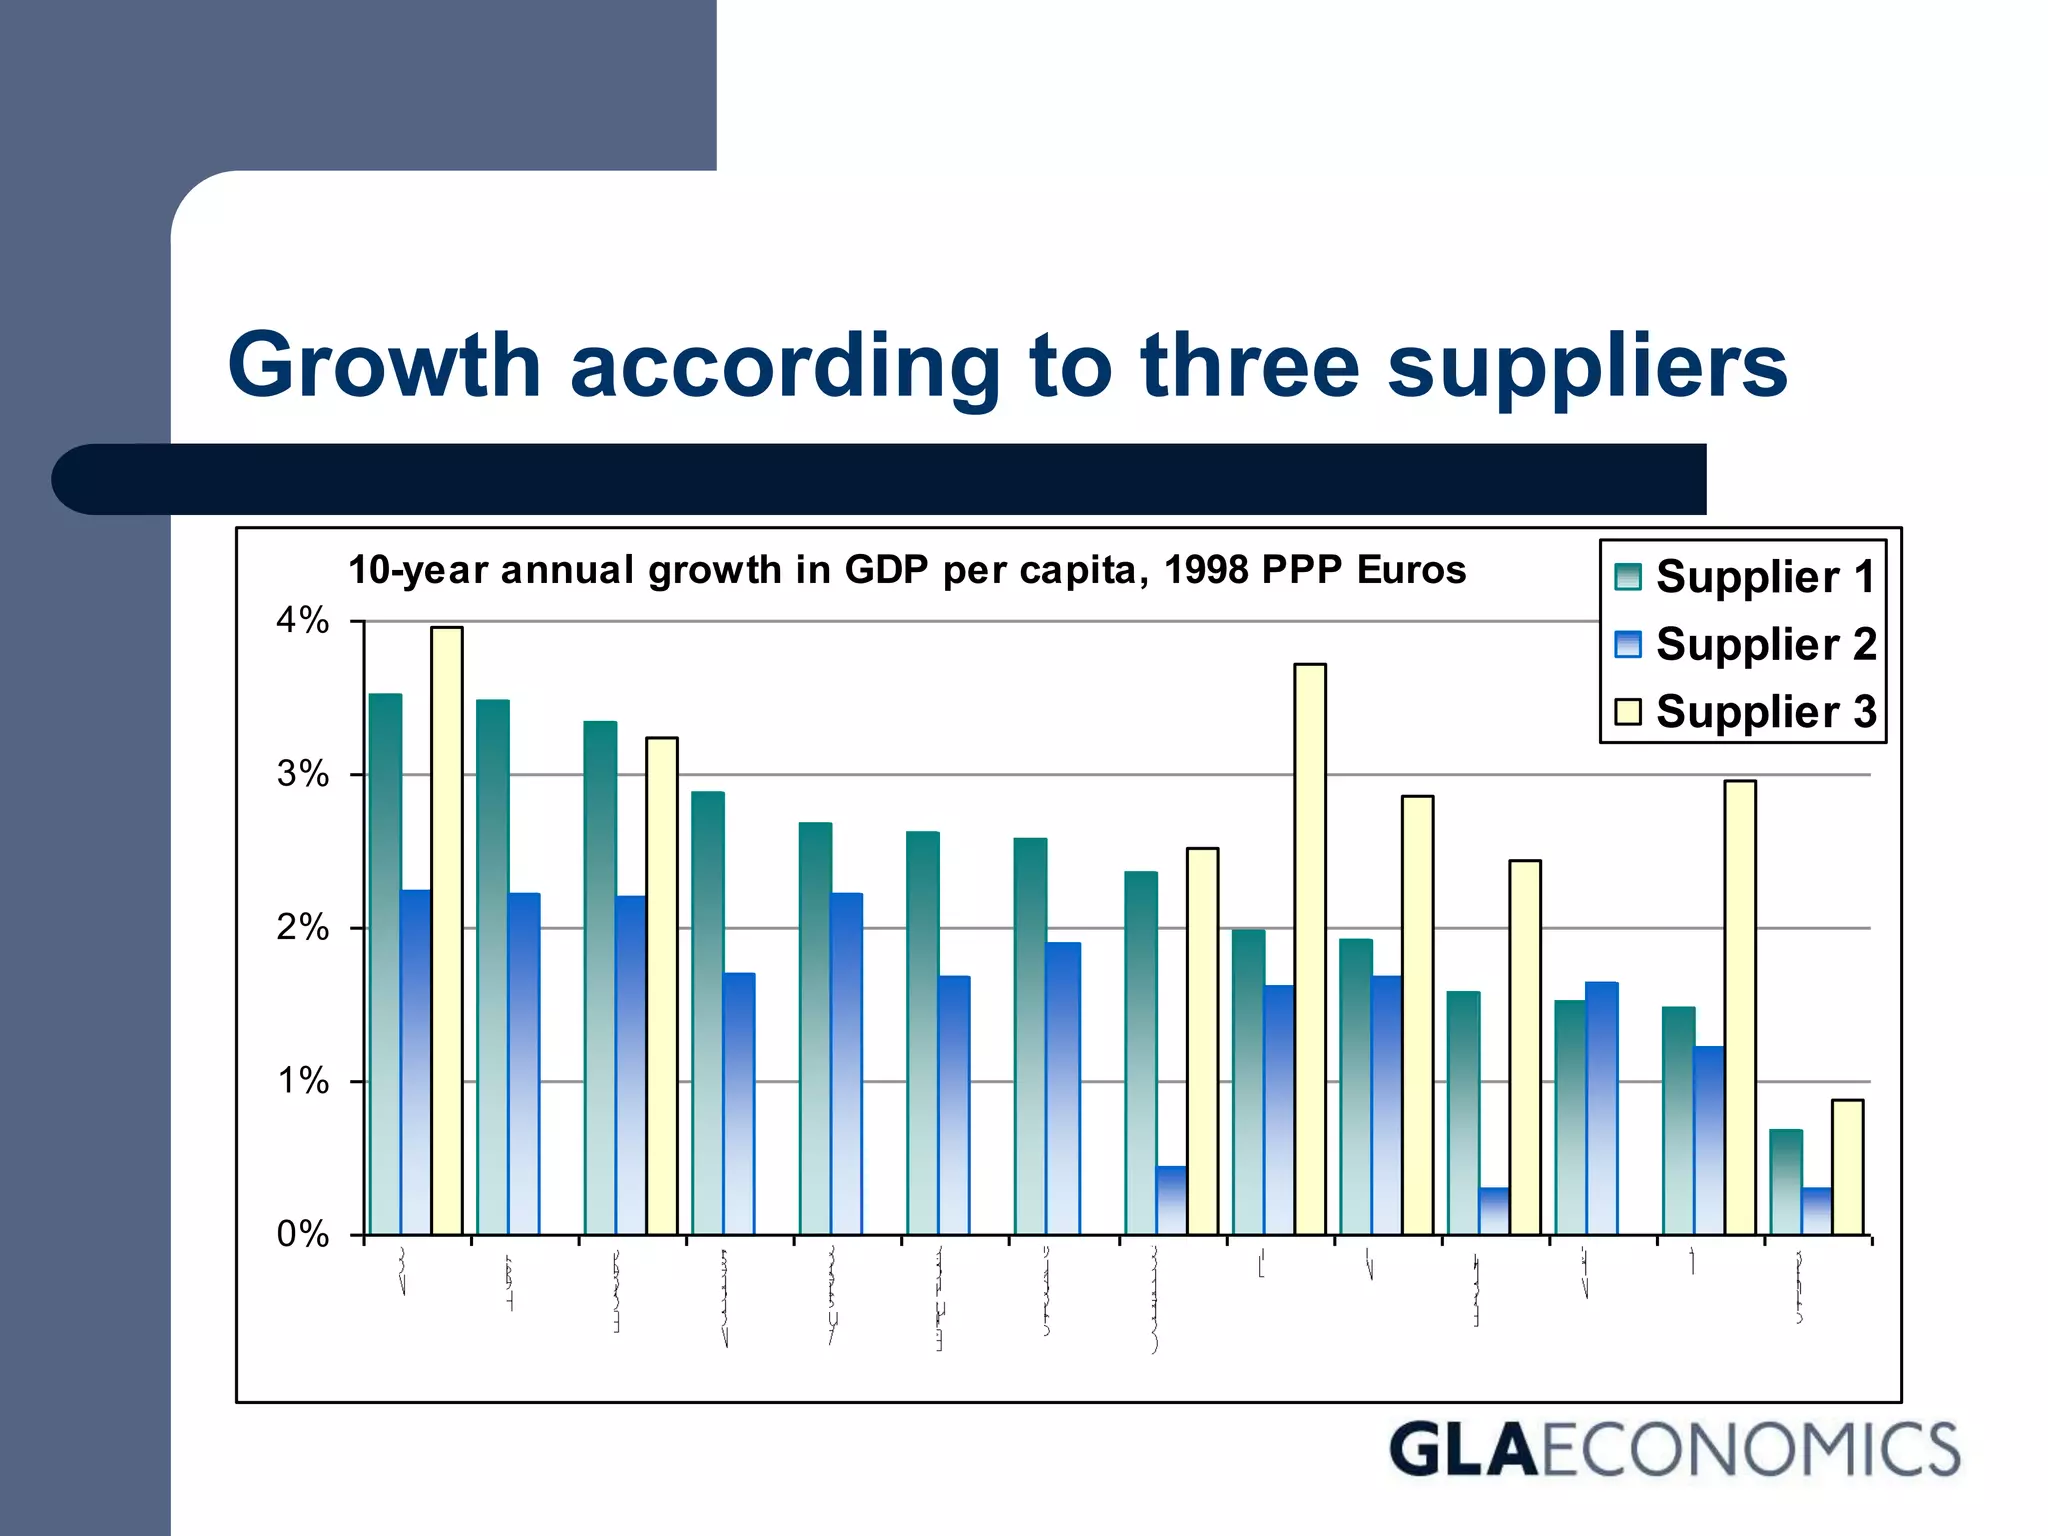


This document discusses why cities are not states and explores governance issues related to London. It examines how cities have historically assumed some state functions but were later absorbed by larger territorial projects. While the nation state is the dominant form, globalization has undermined multilateralism and the adequacy of the national form. Cities can only optimize in the context of their relation to the national and world economy, but which nation? The document explores definitions of world cities and challenges in measuring and comparing cities economically. It considers how London's economy has shifted towards services and creative industries.


