Download as PDF, PPTX


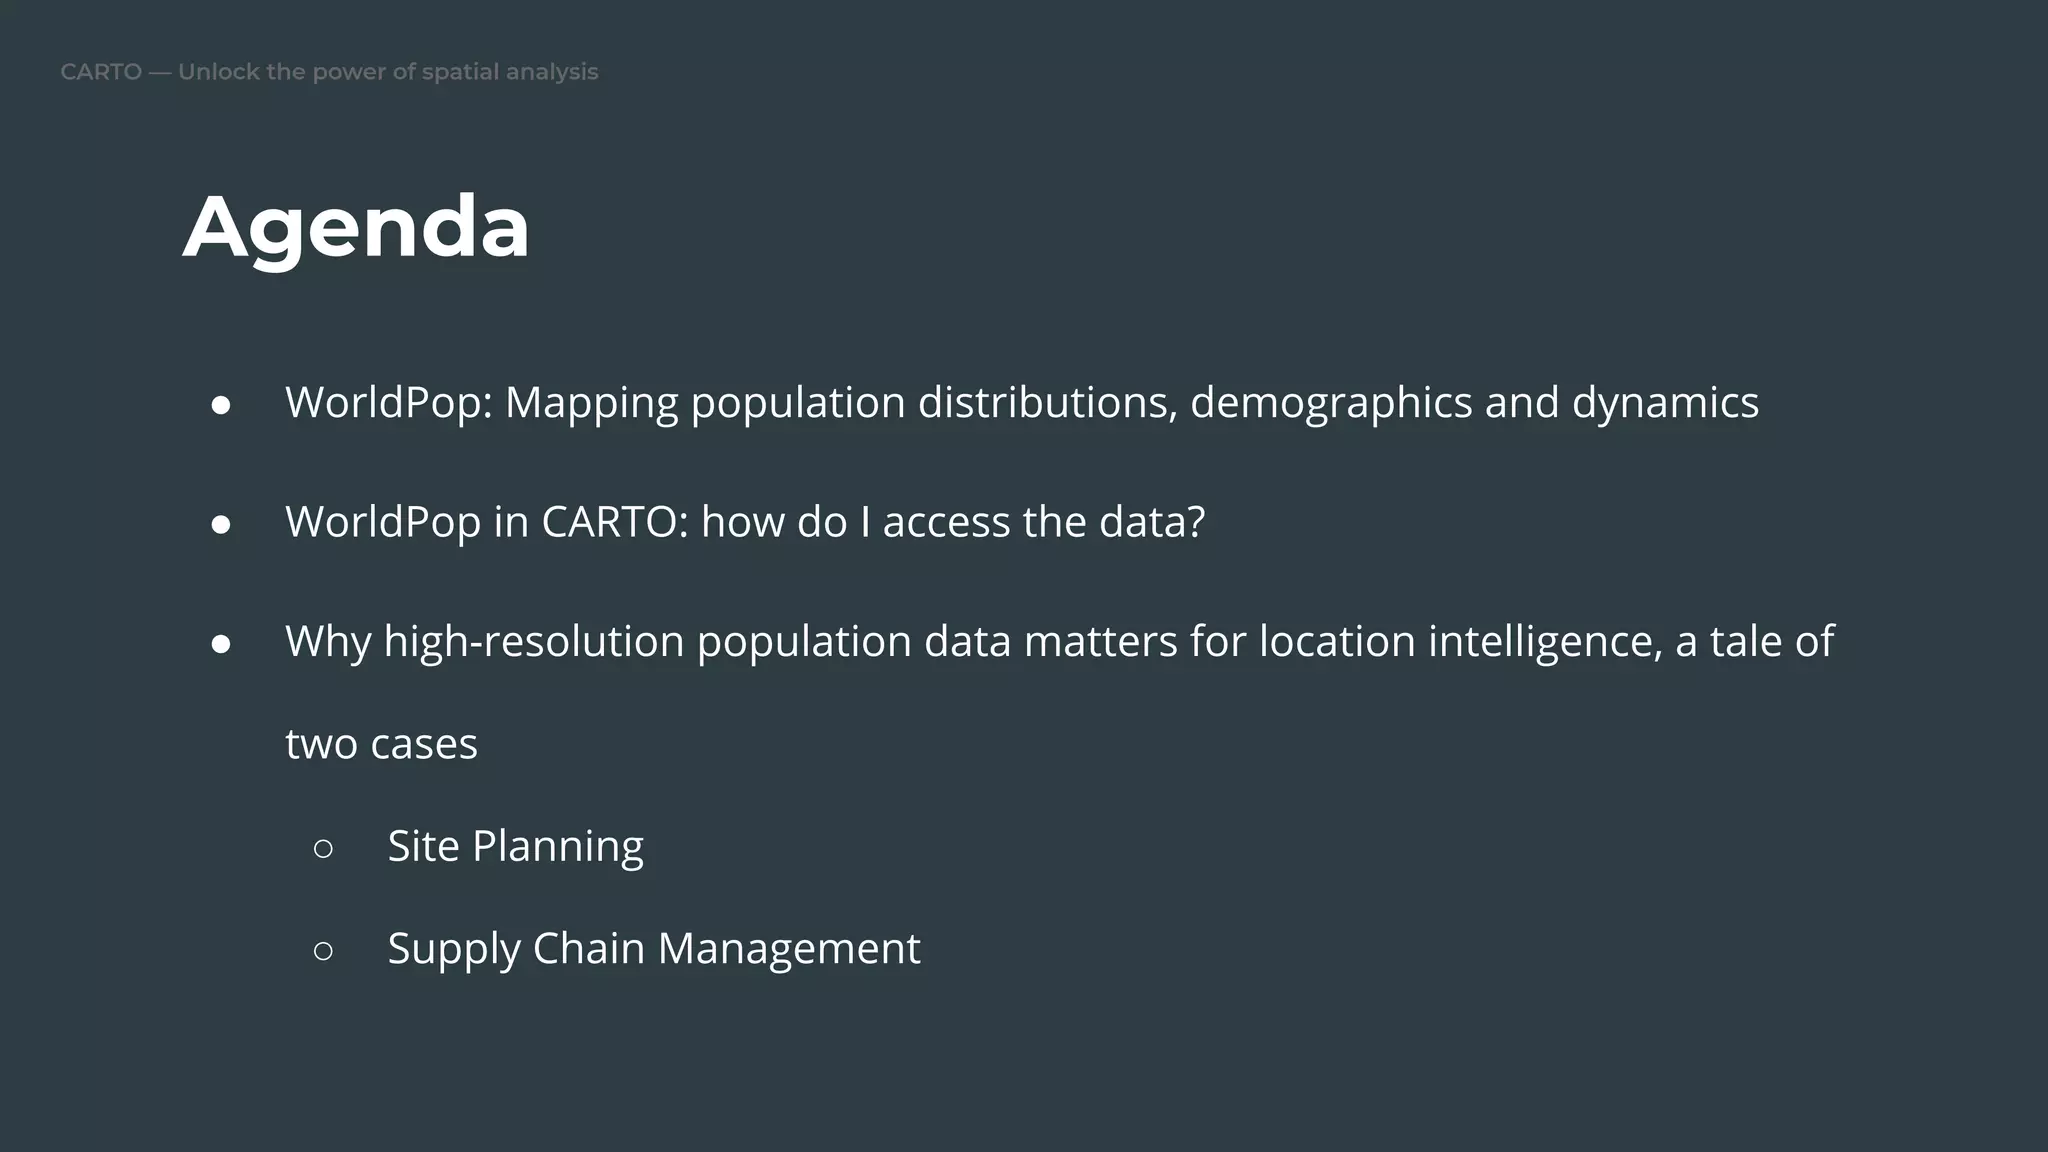
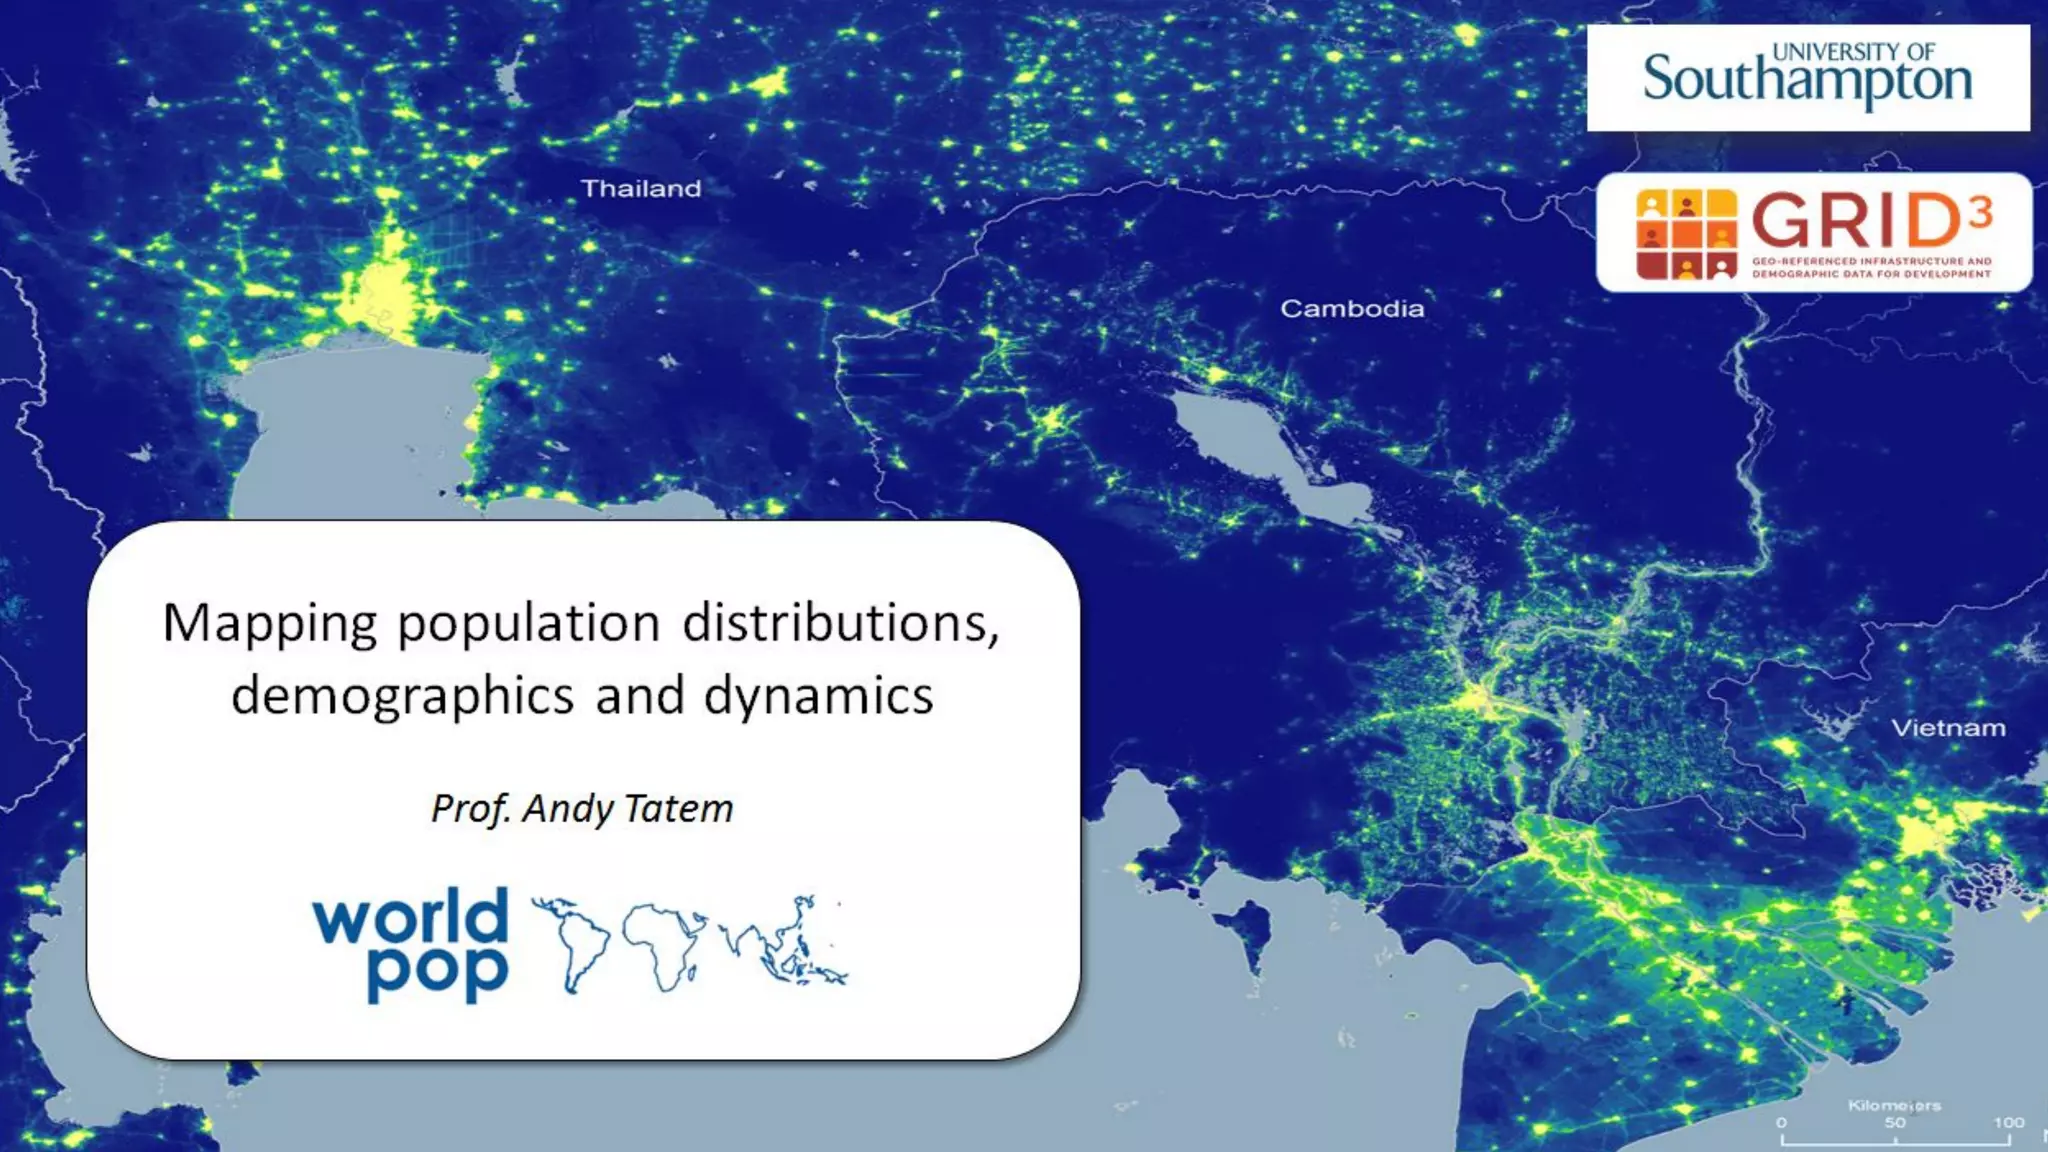
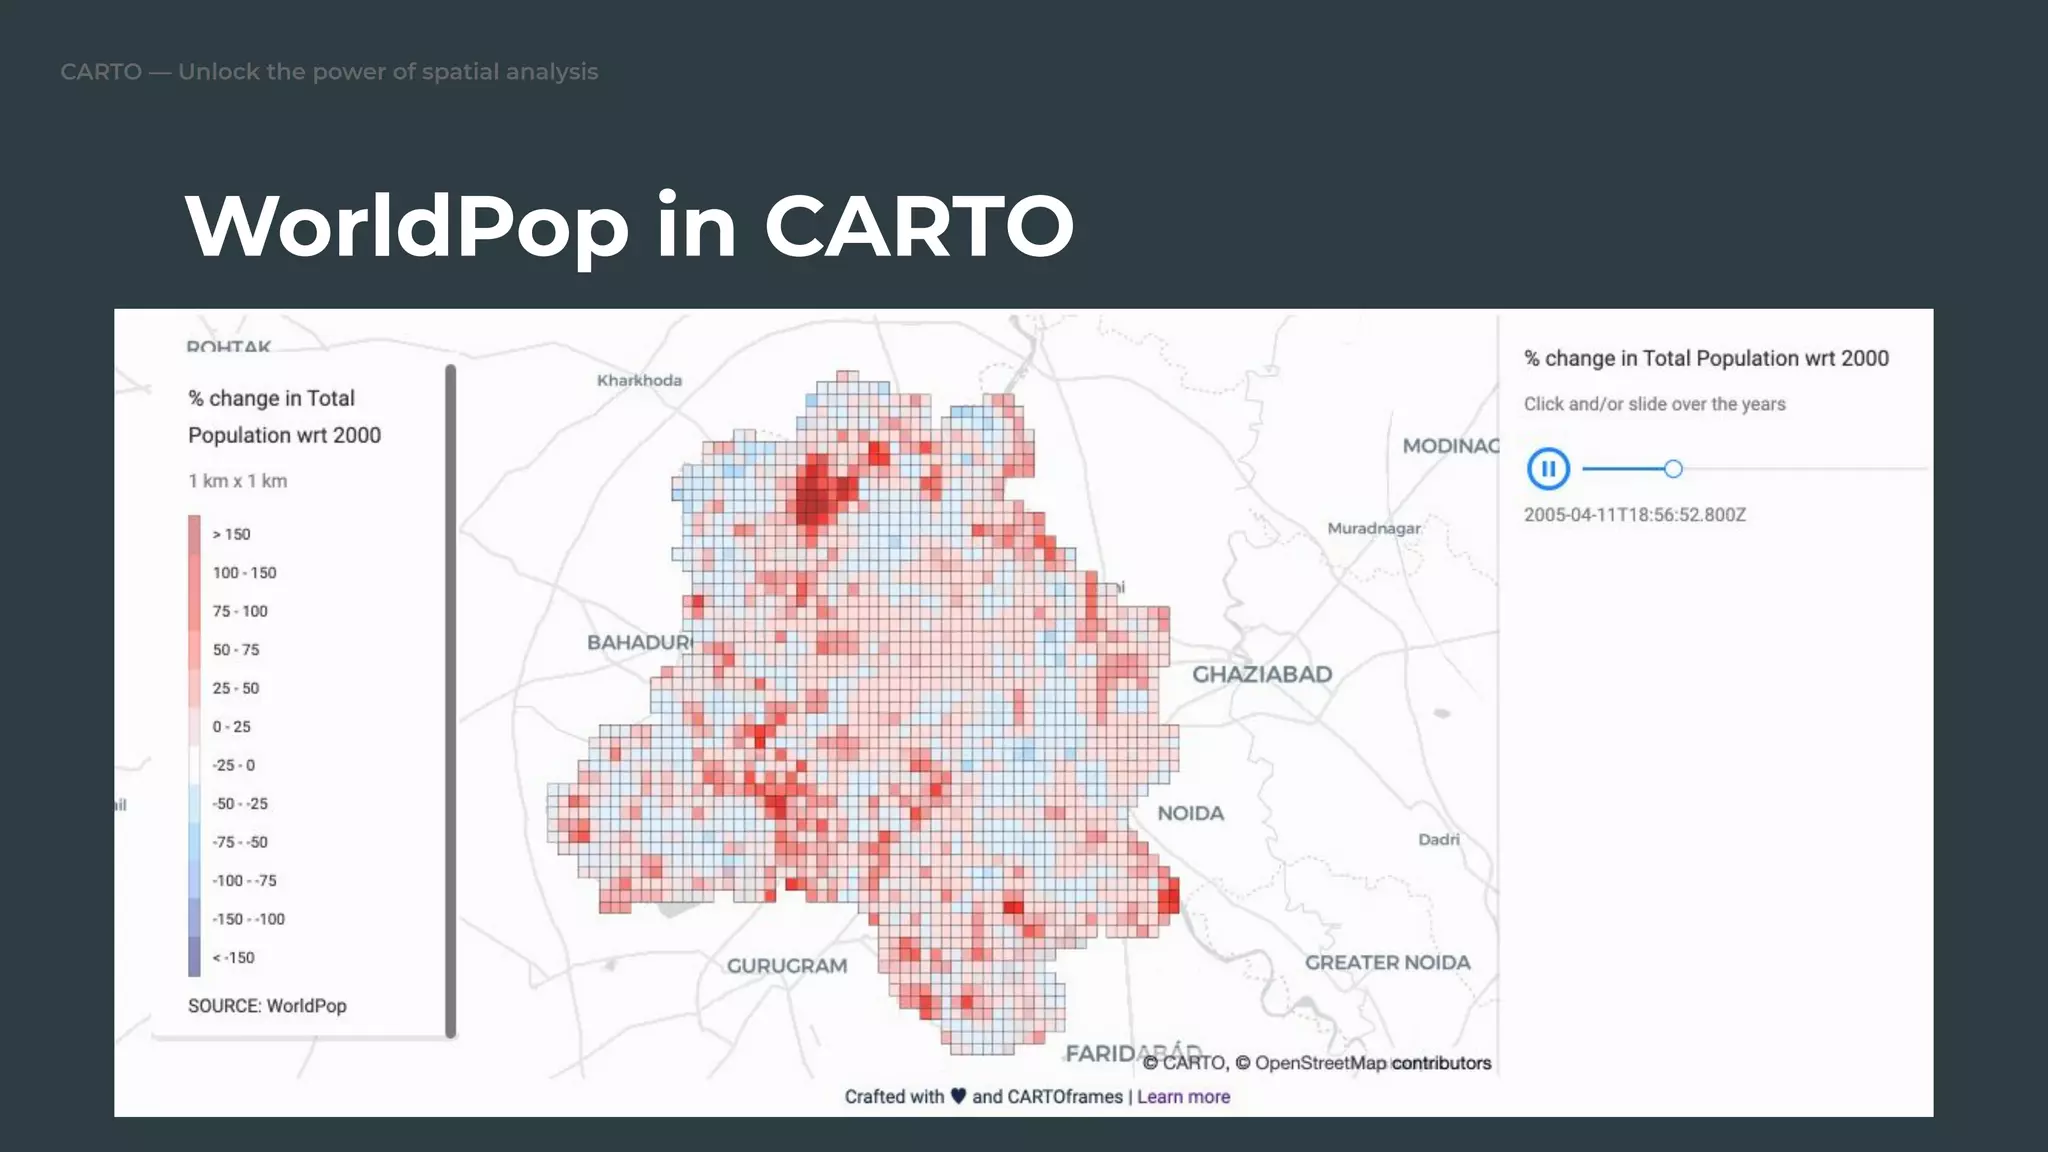
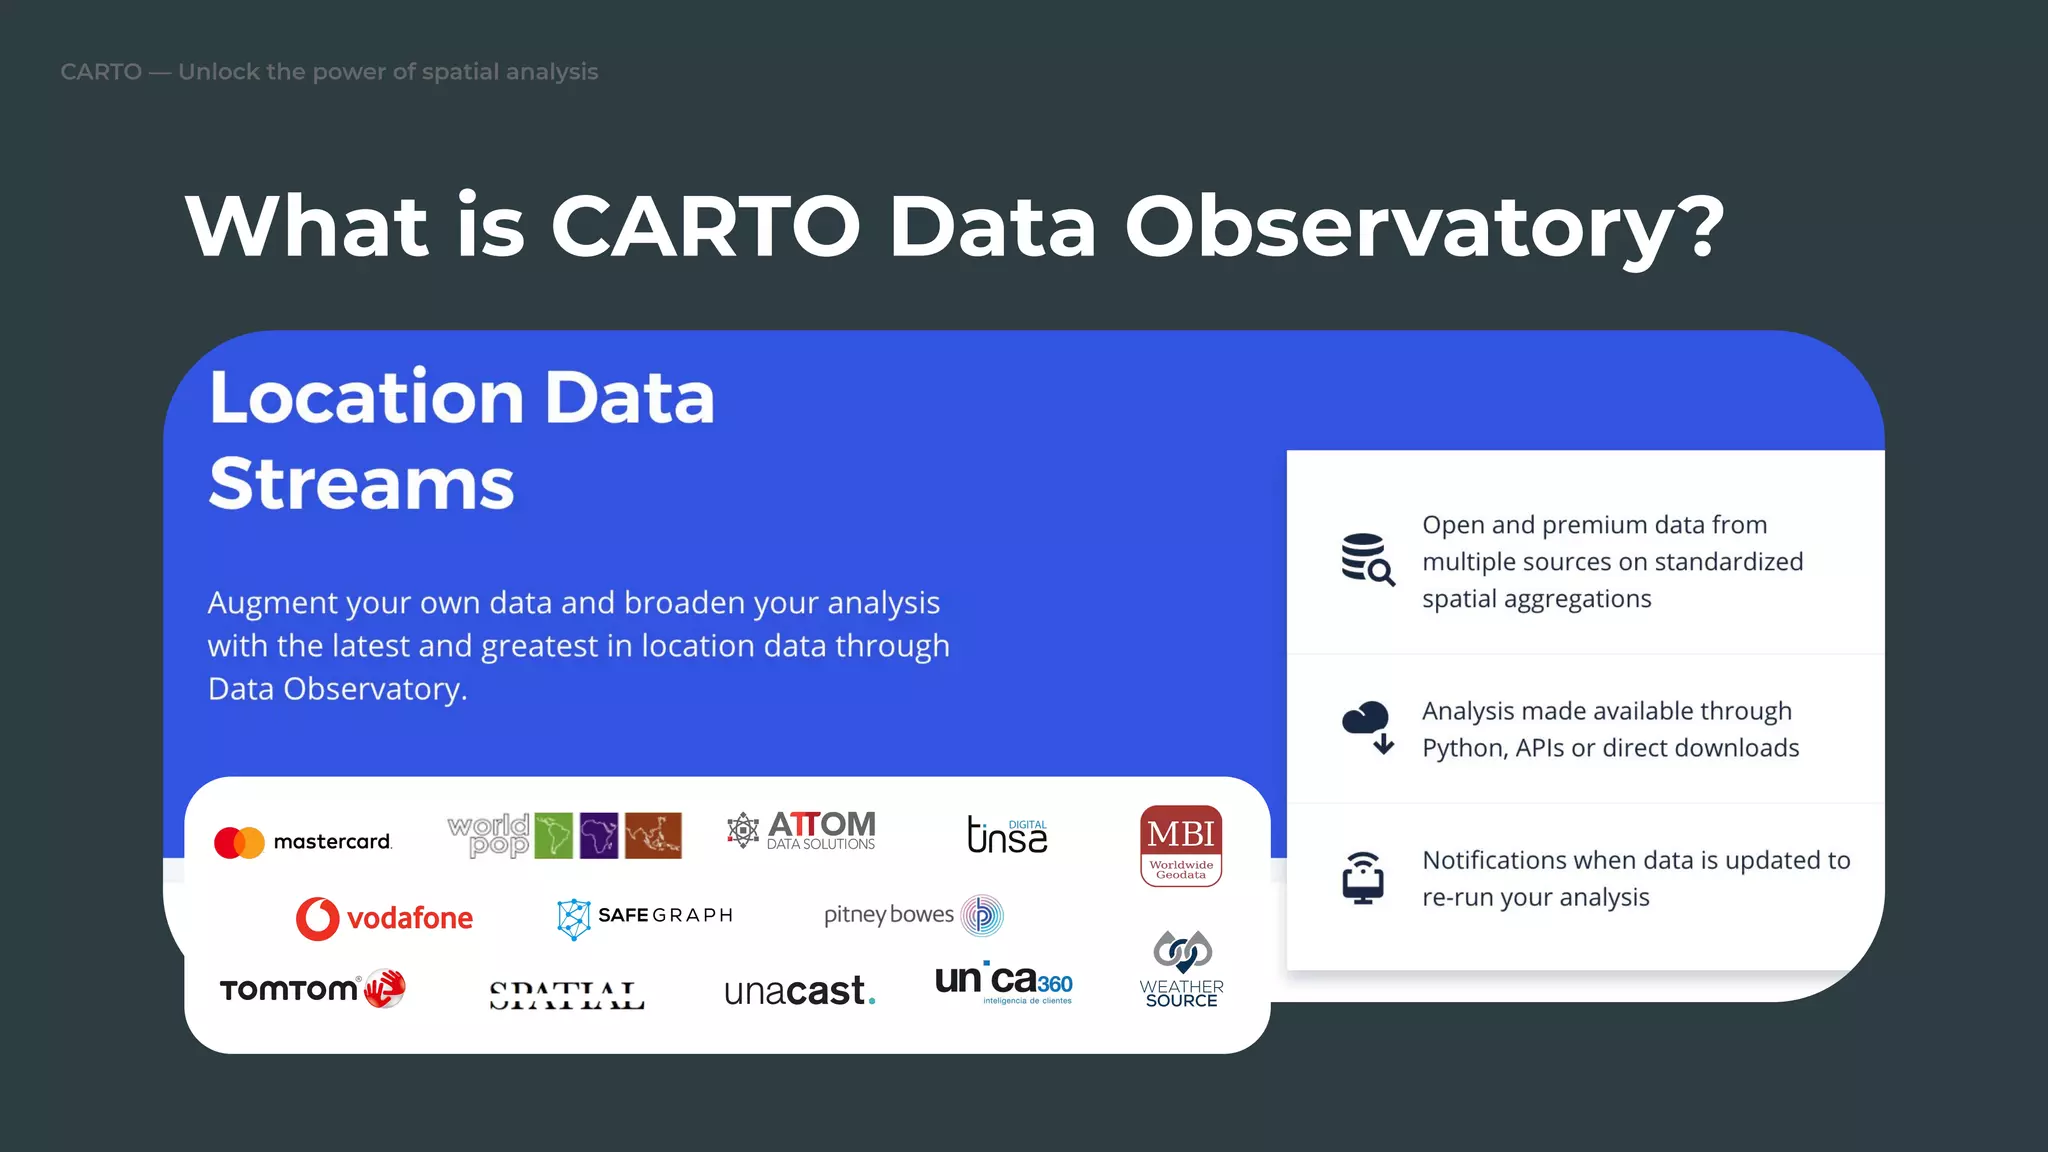
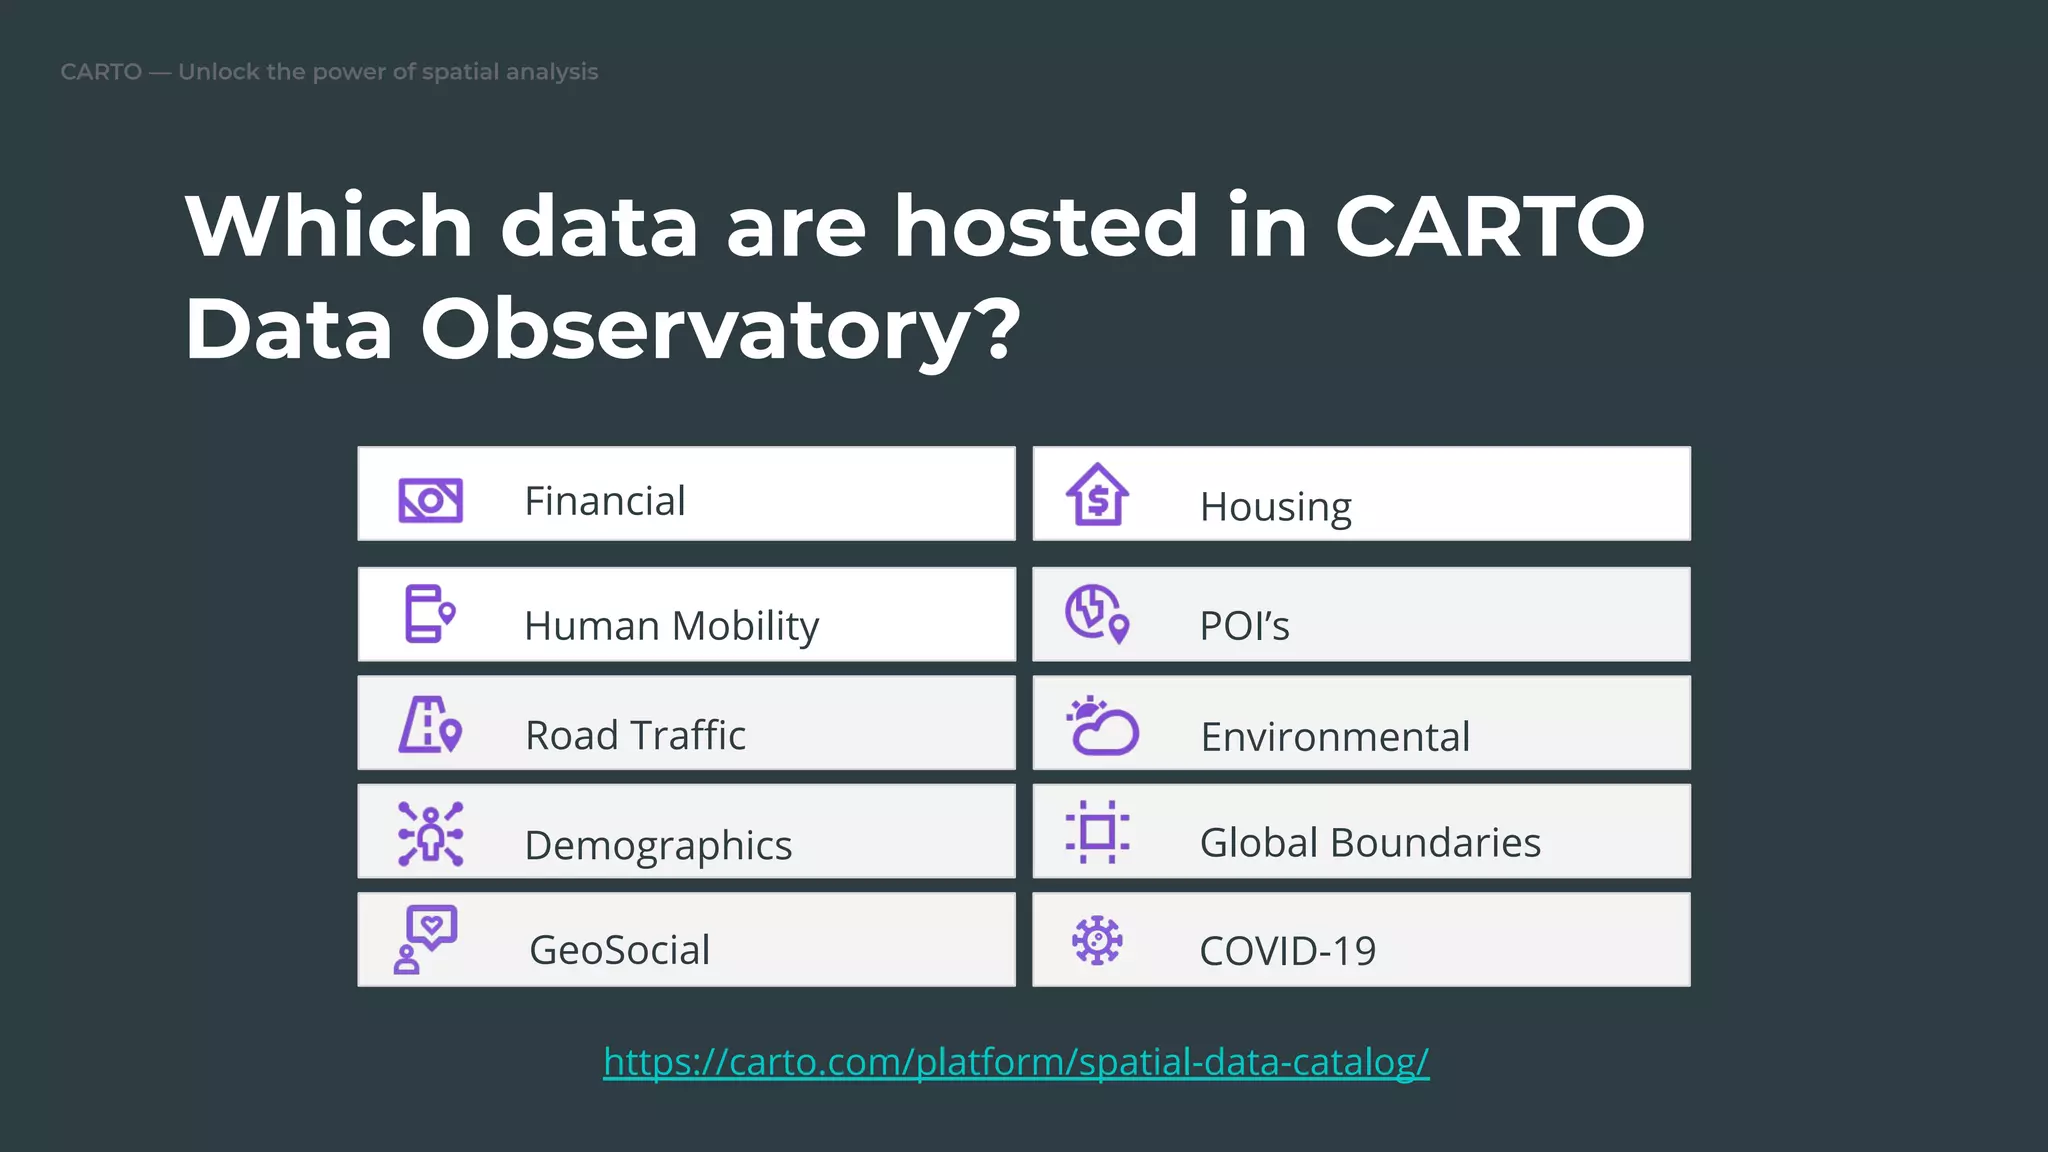
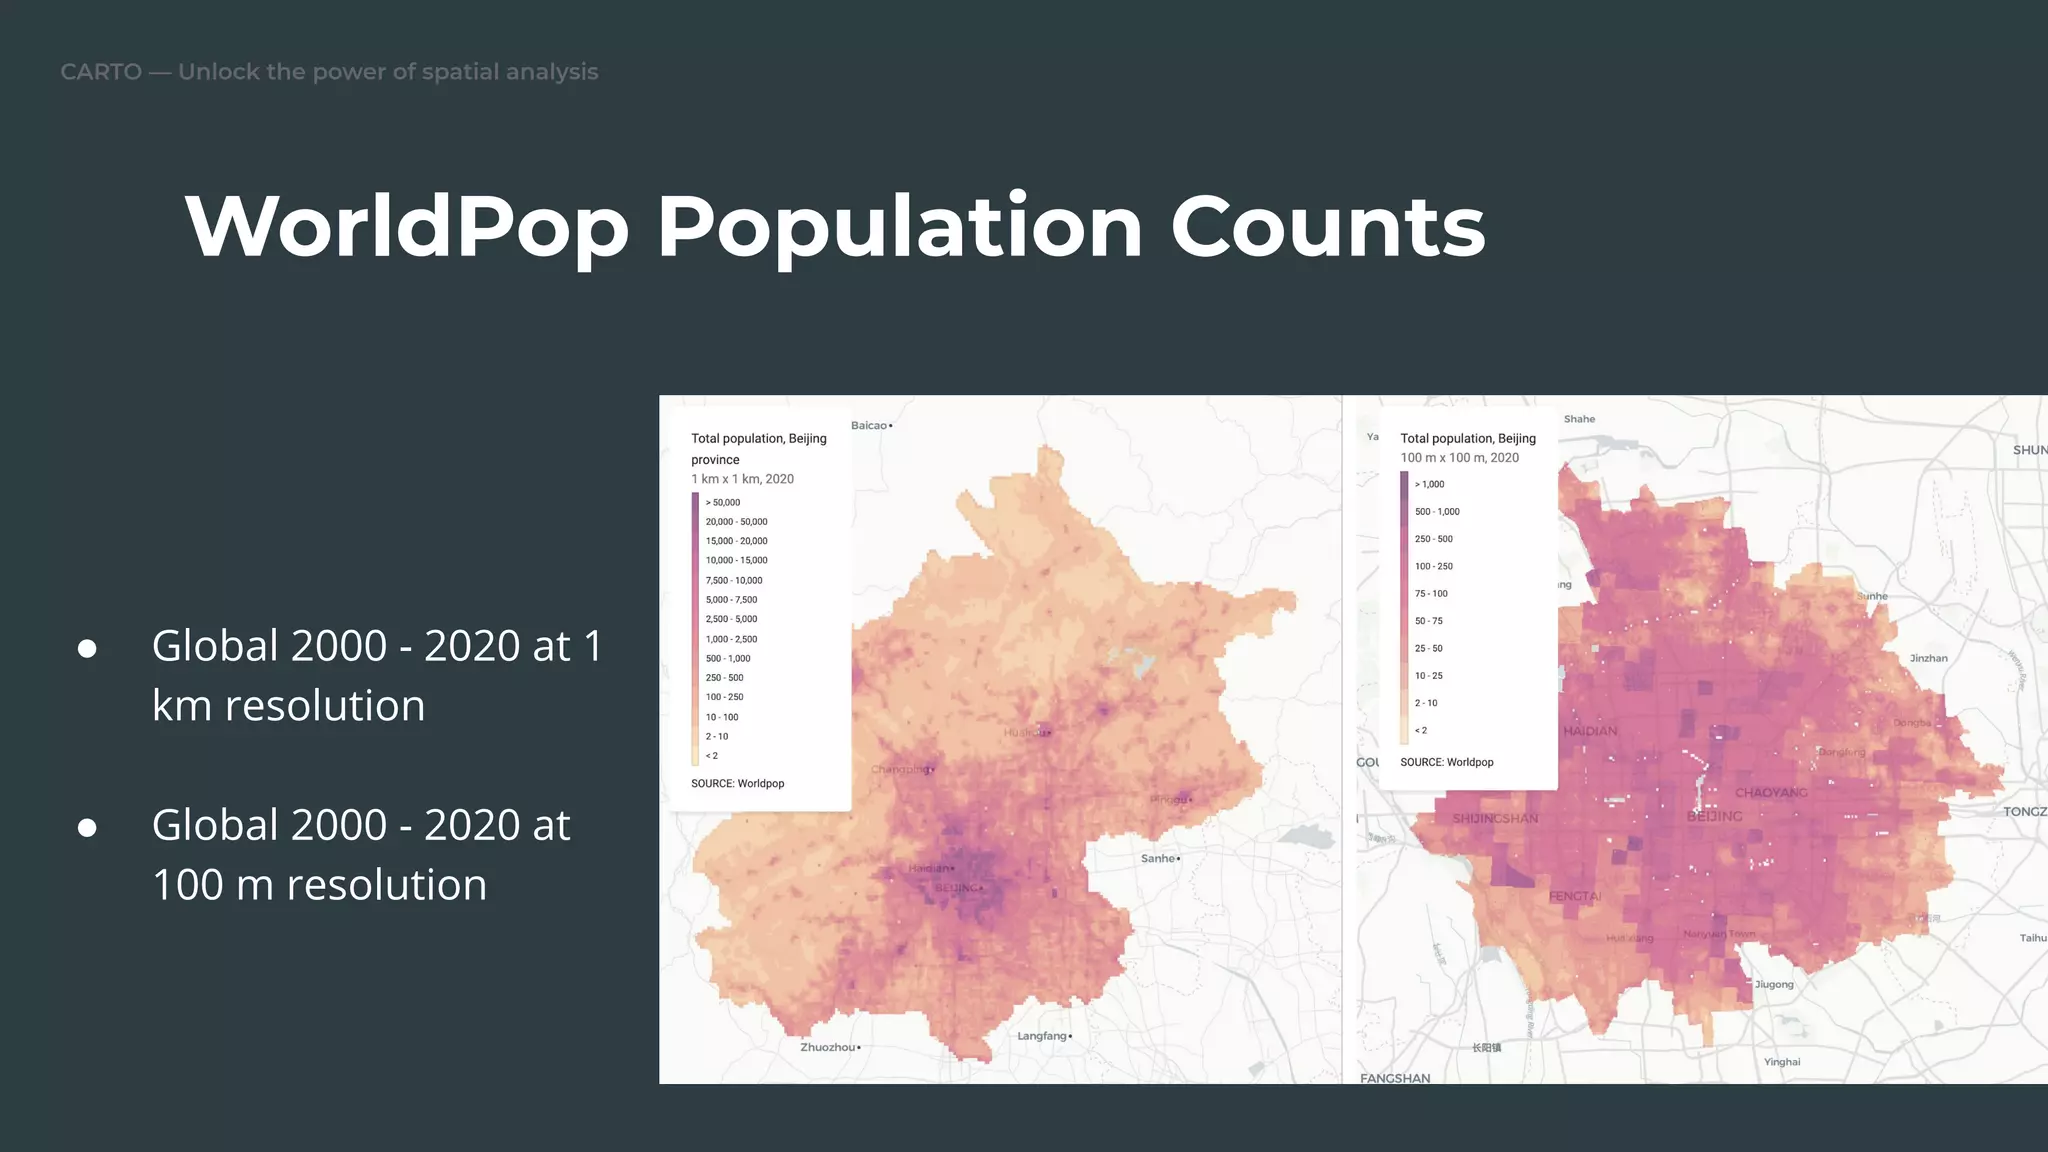
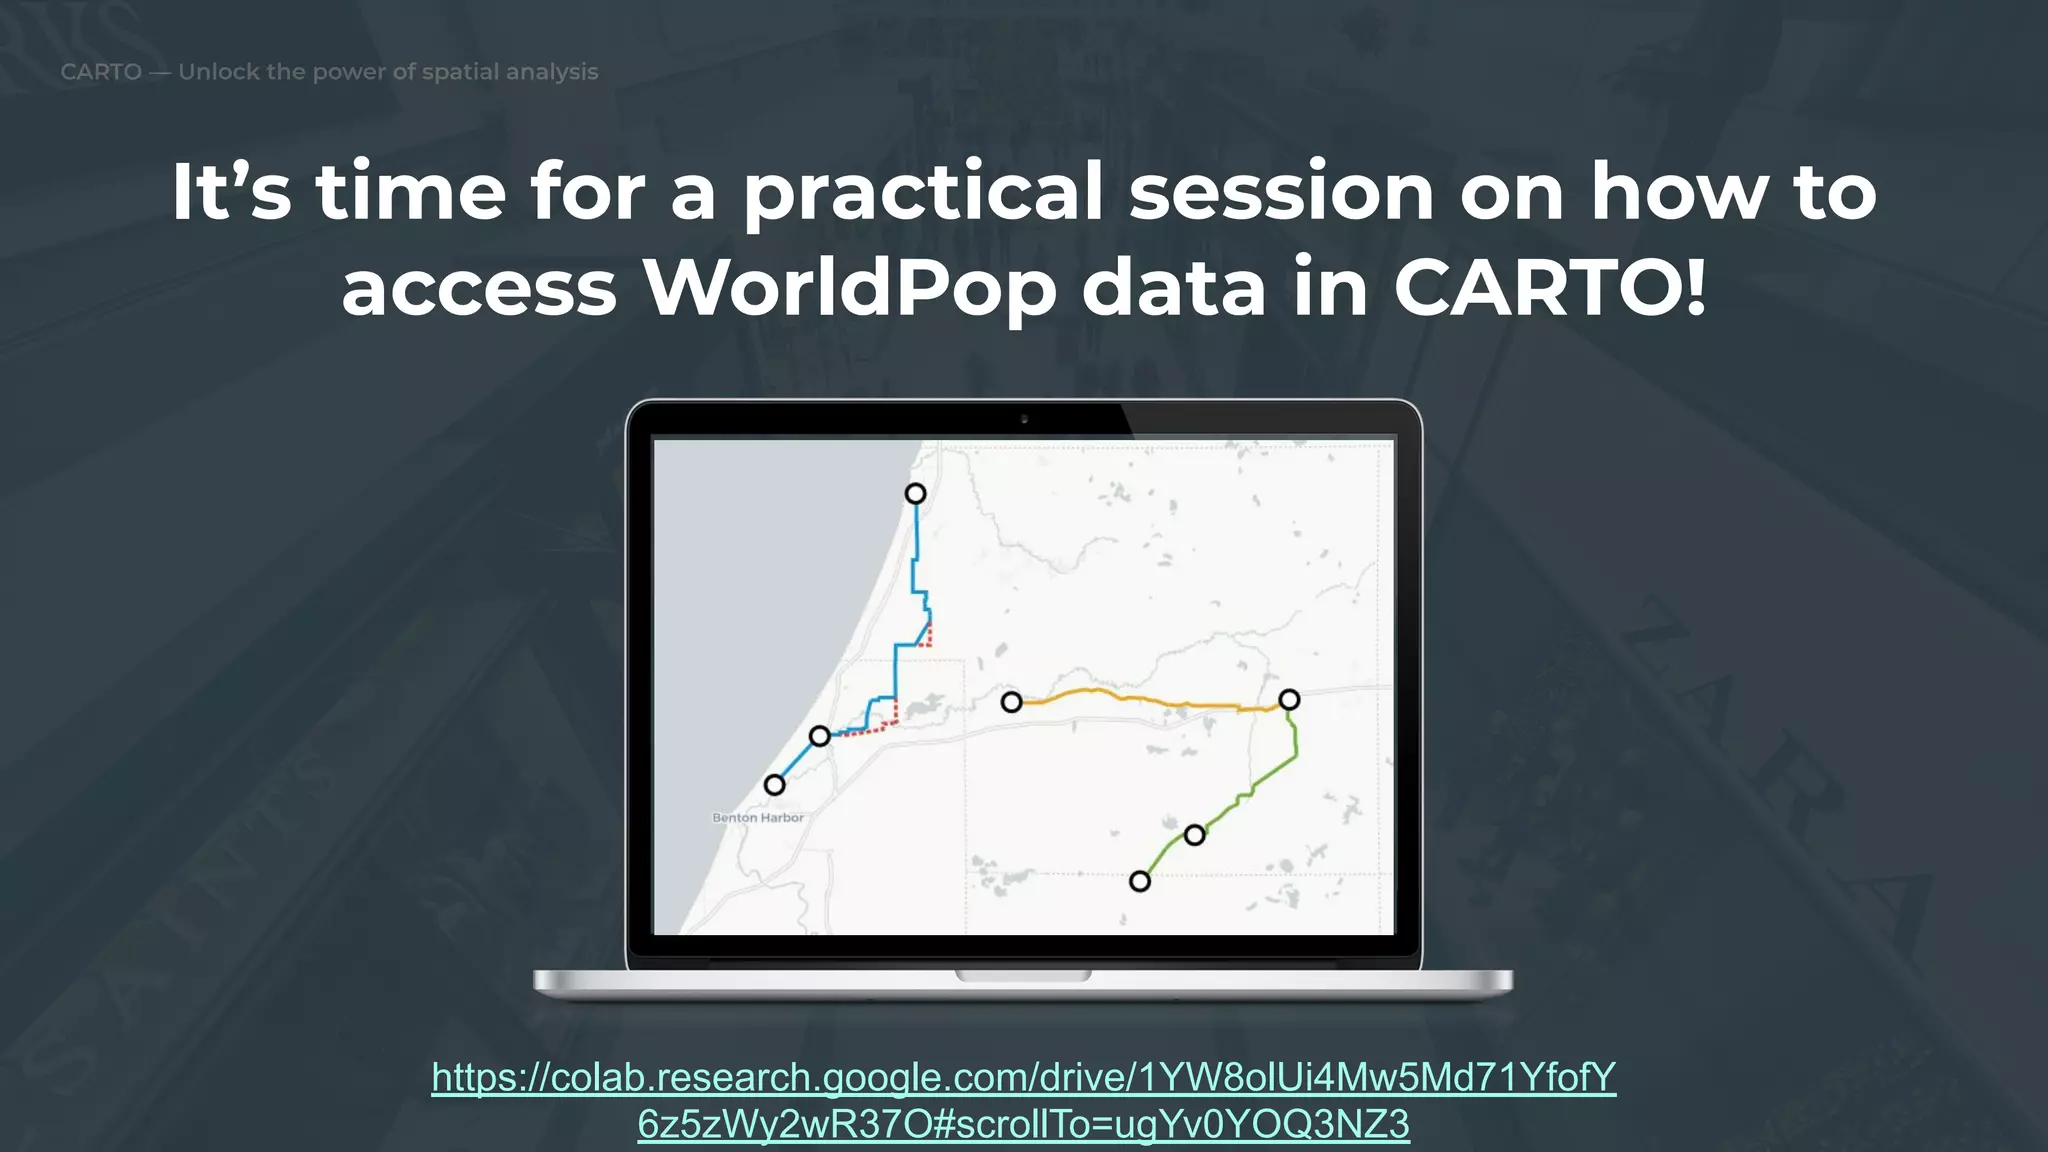
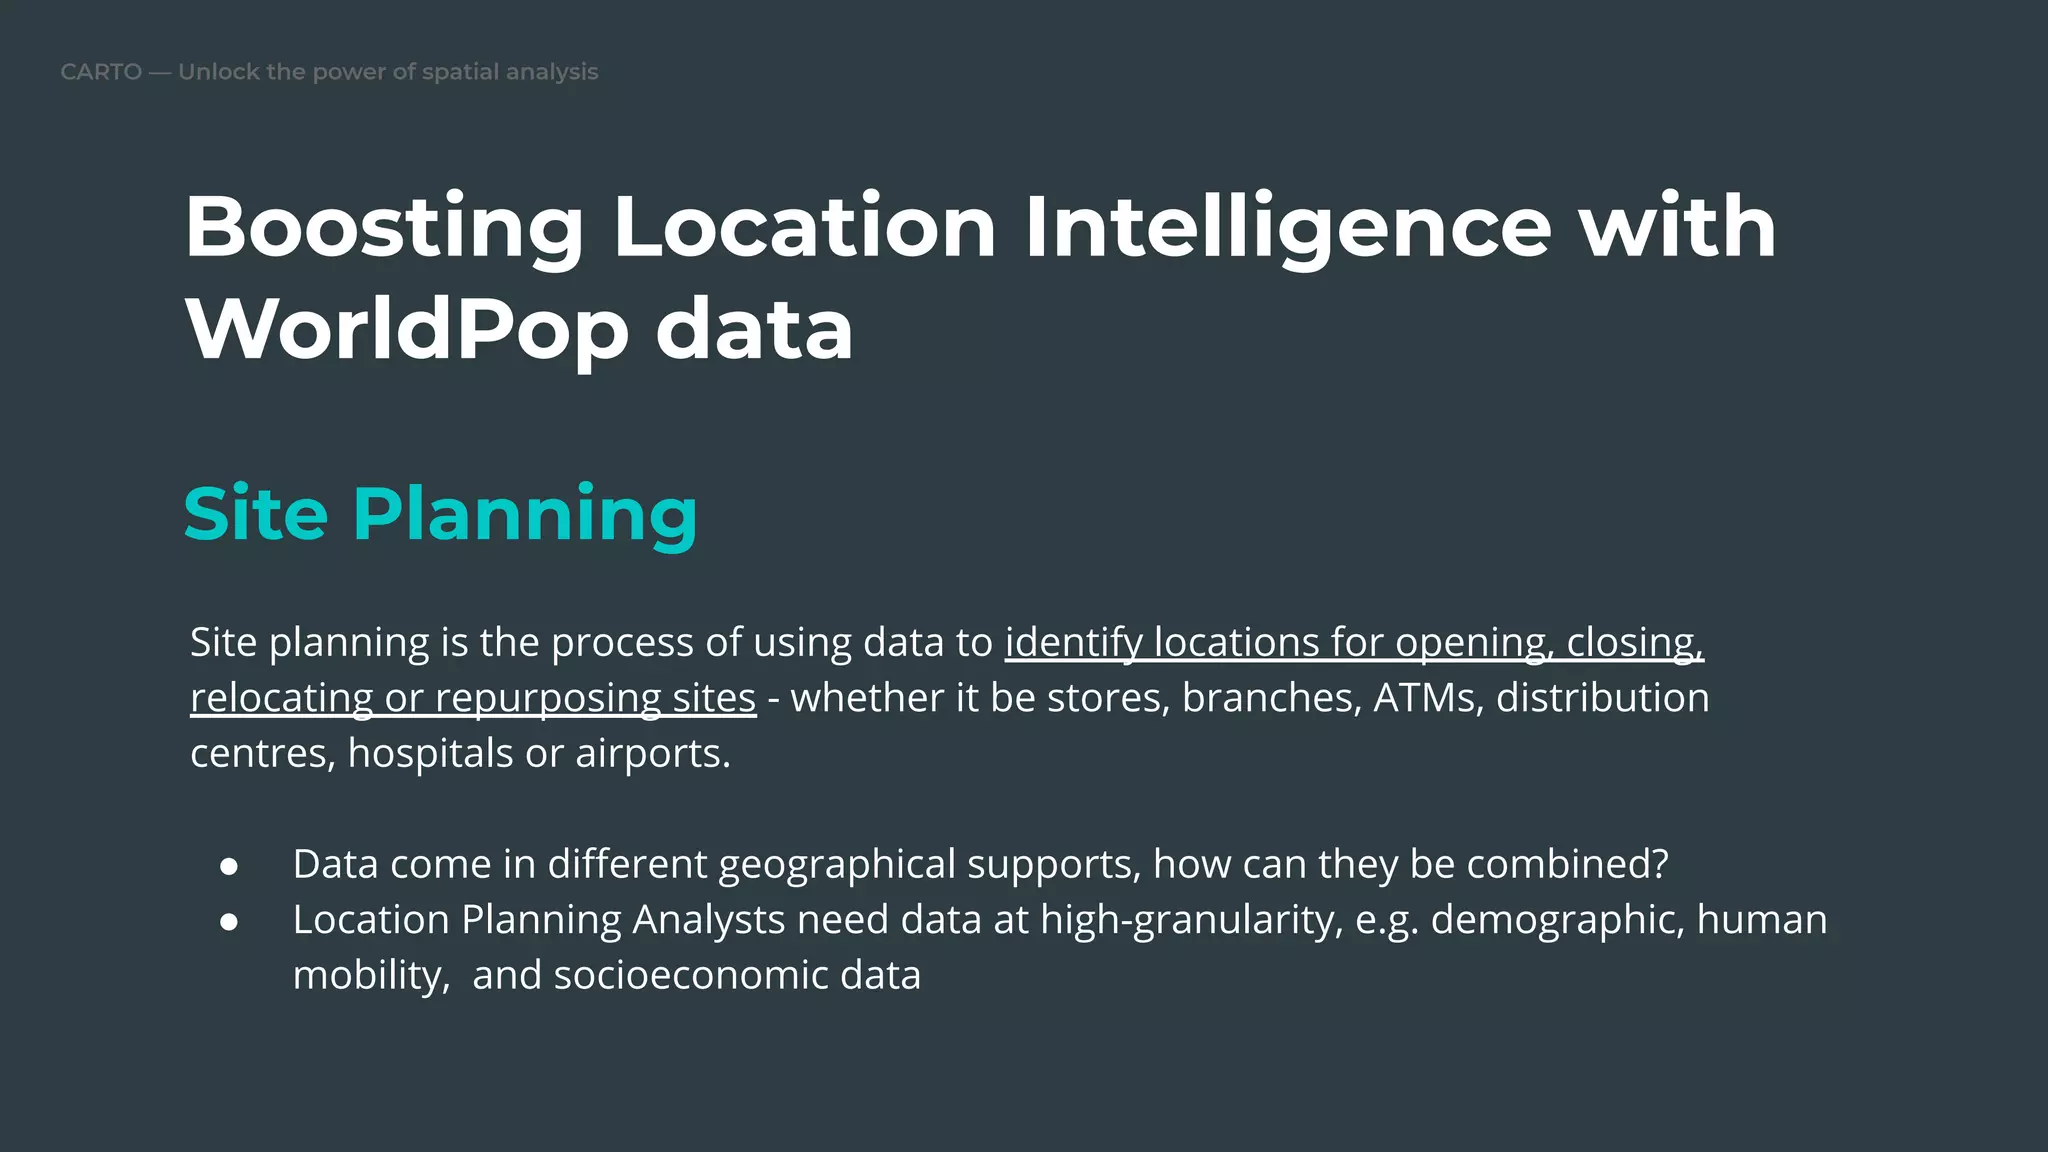
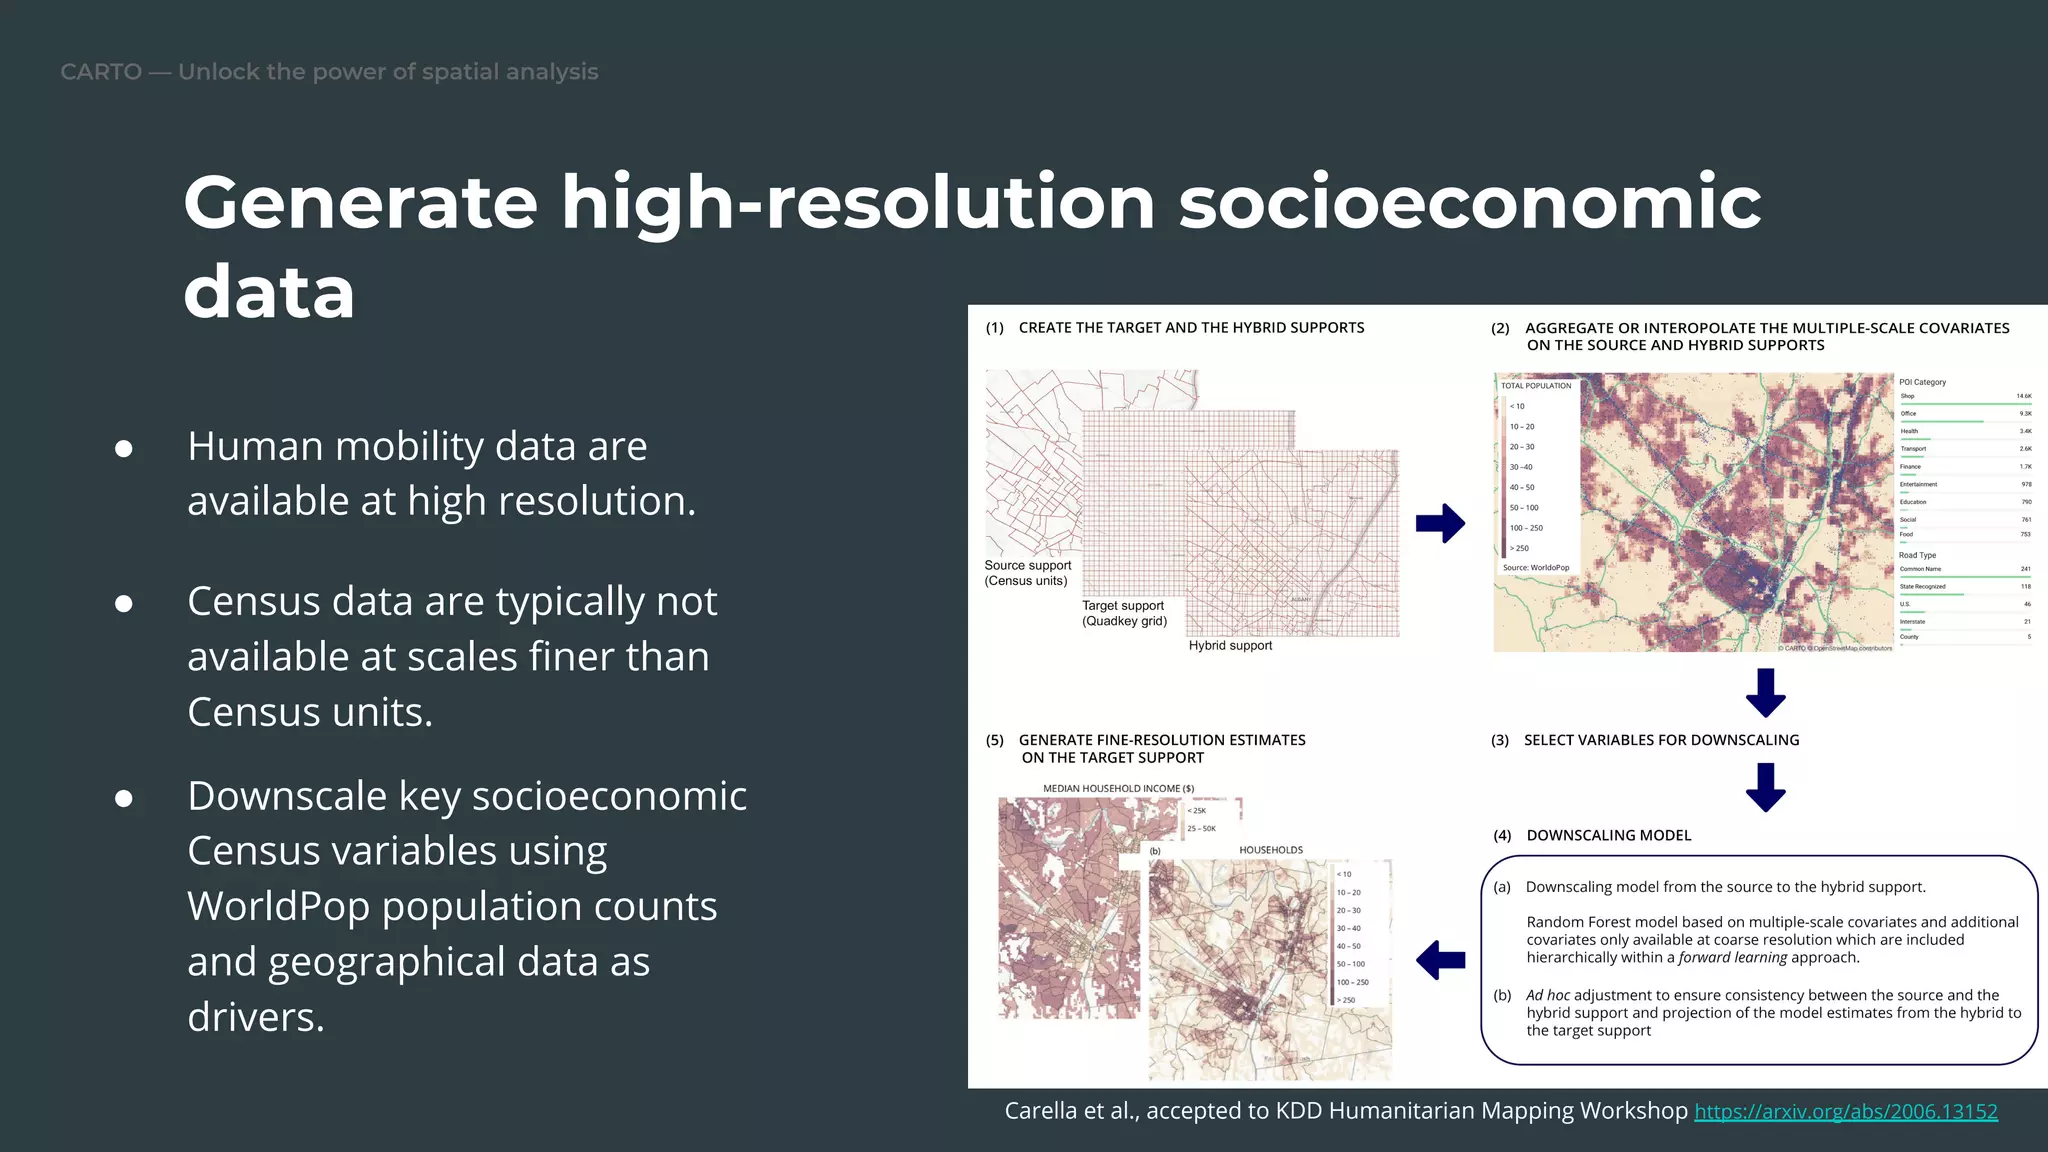
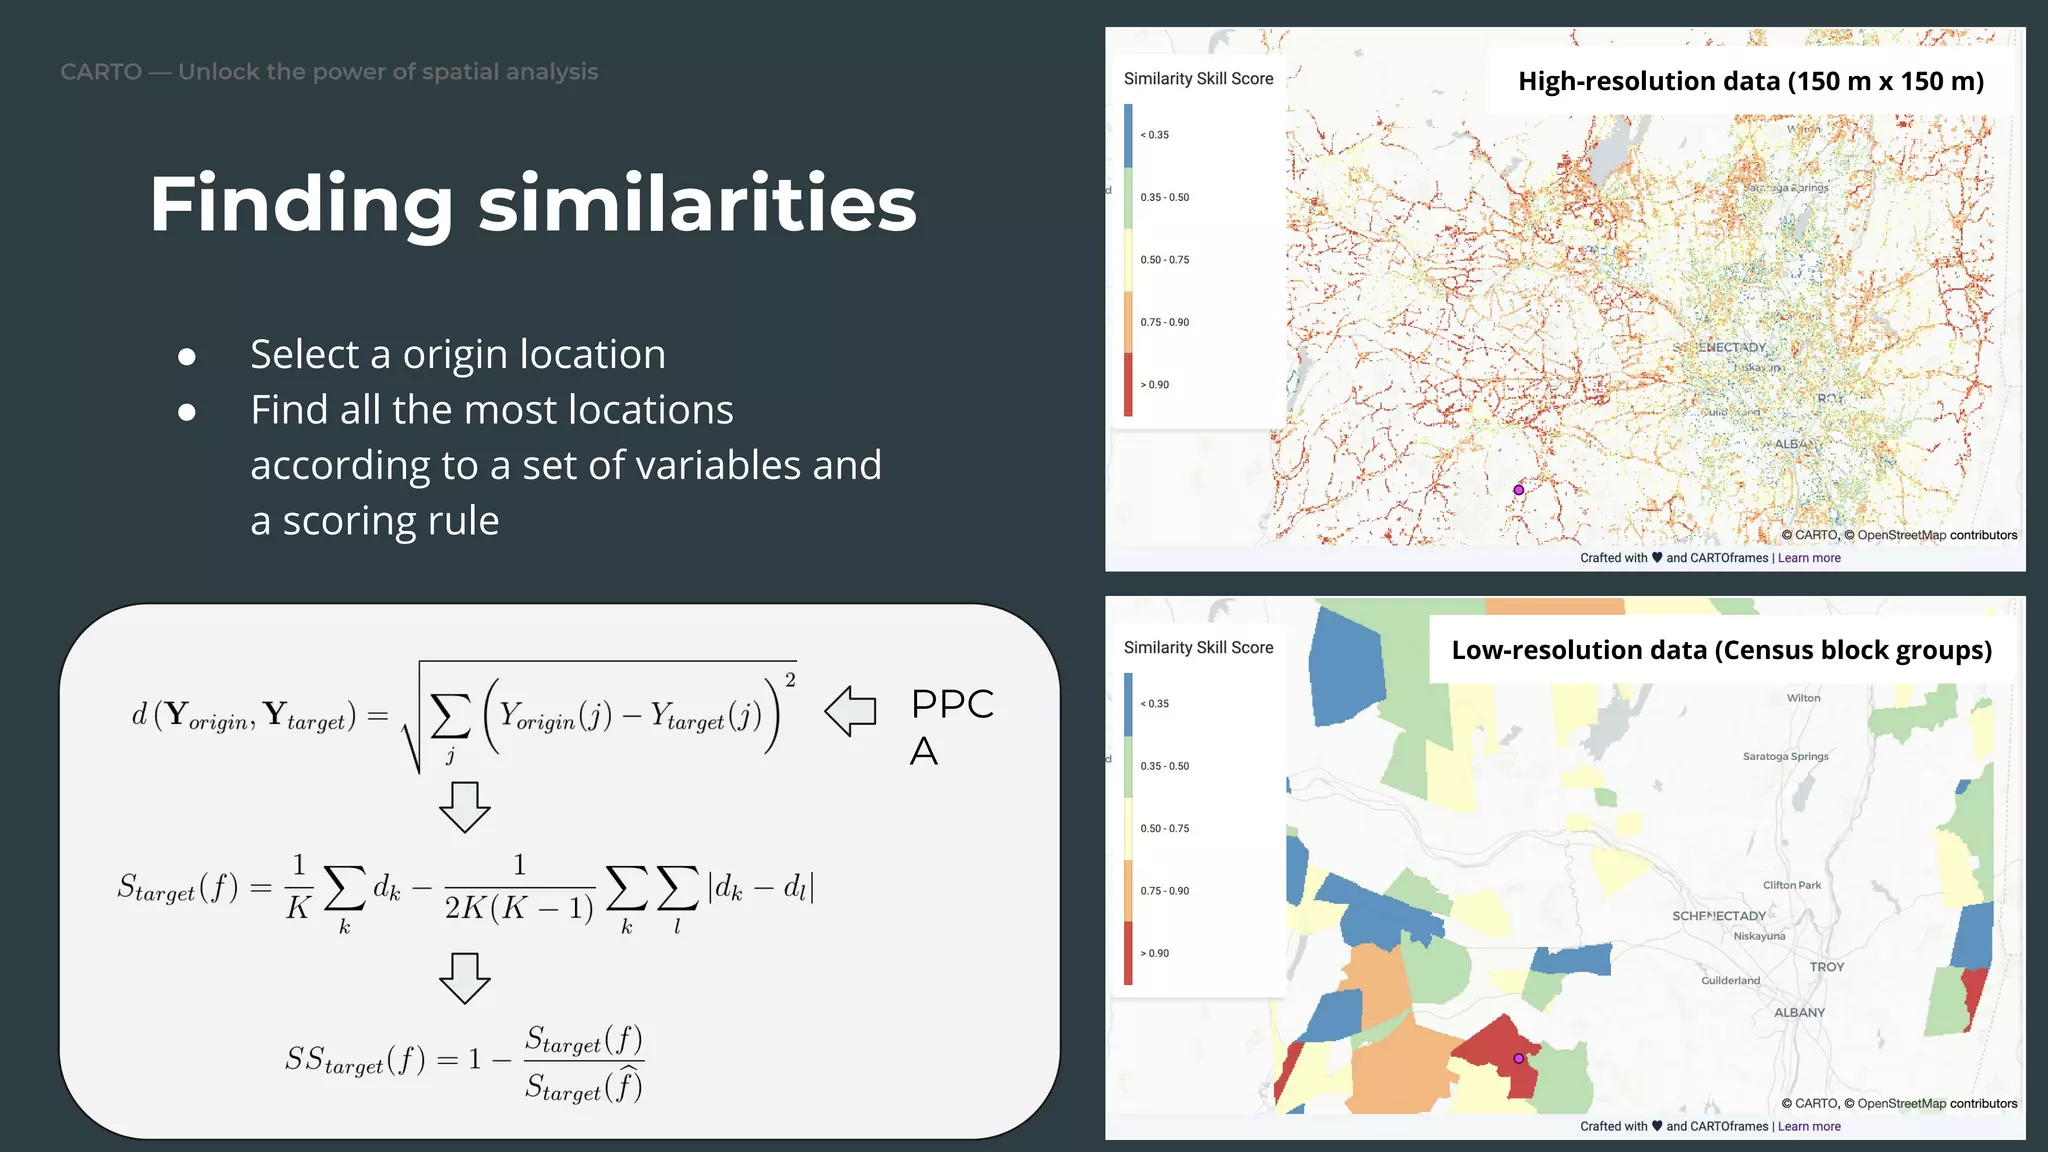
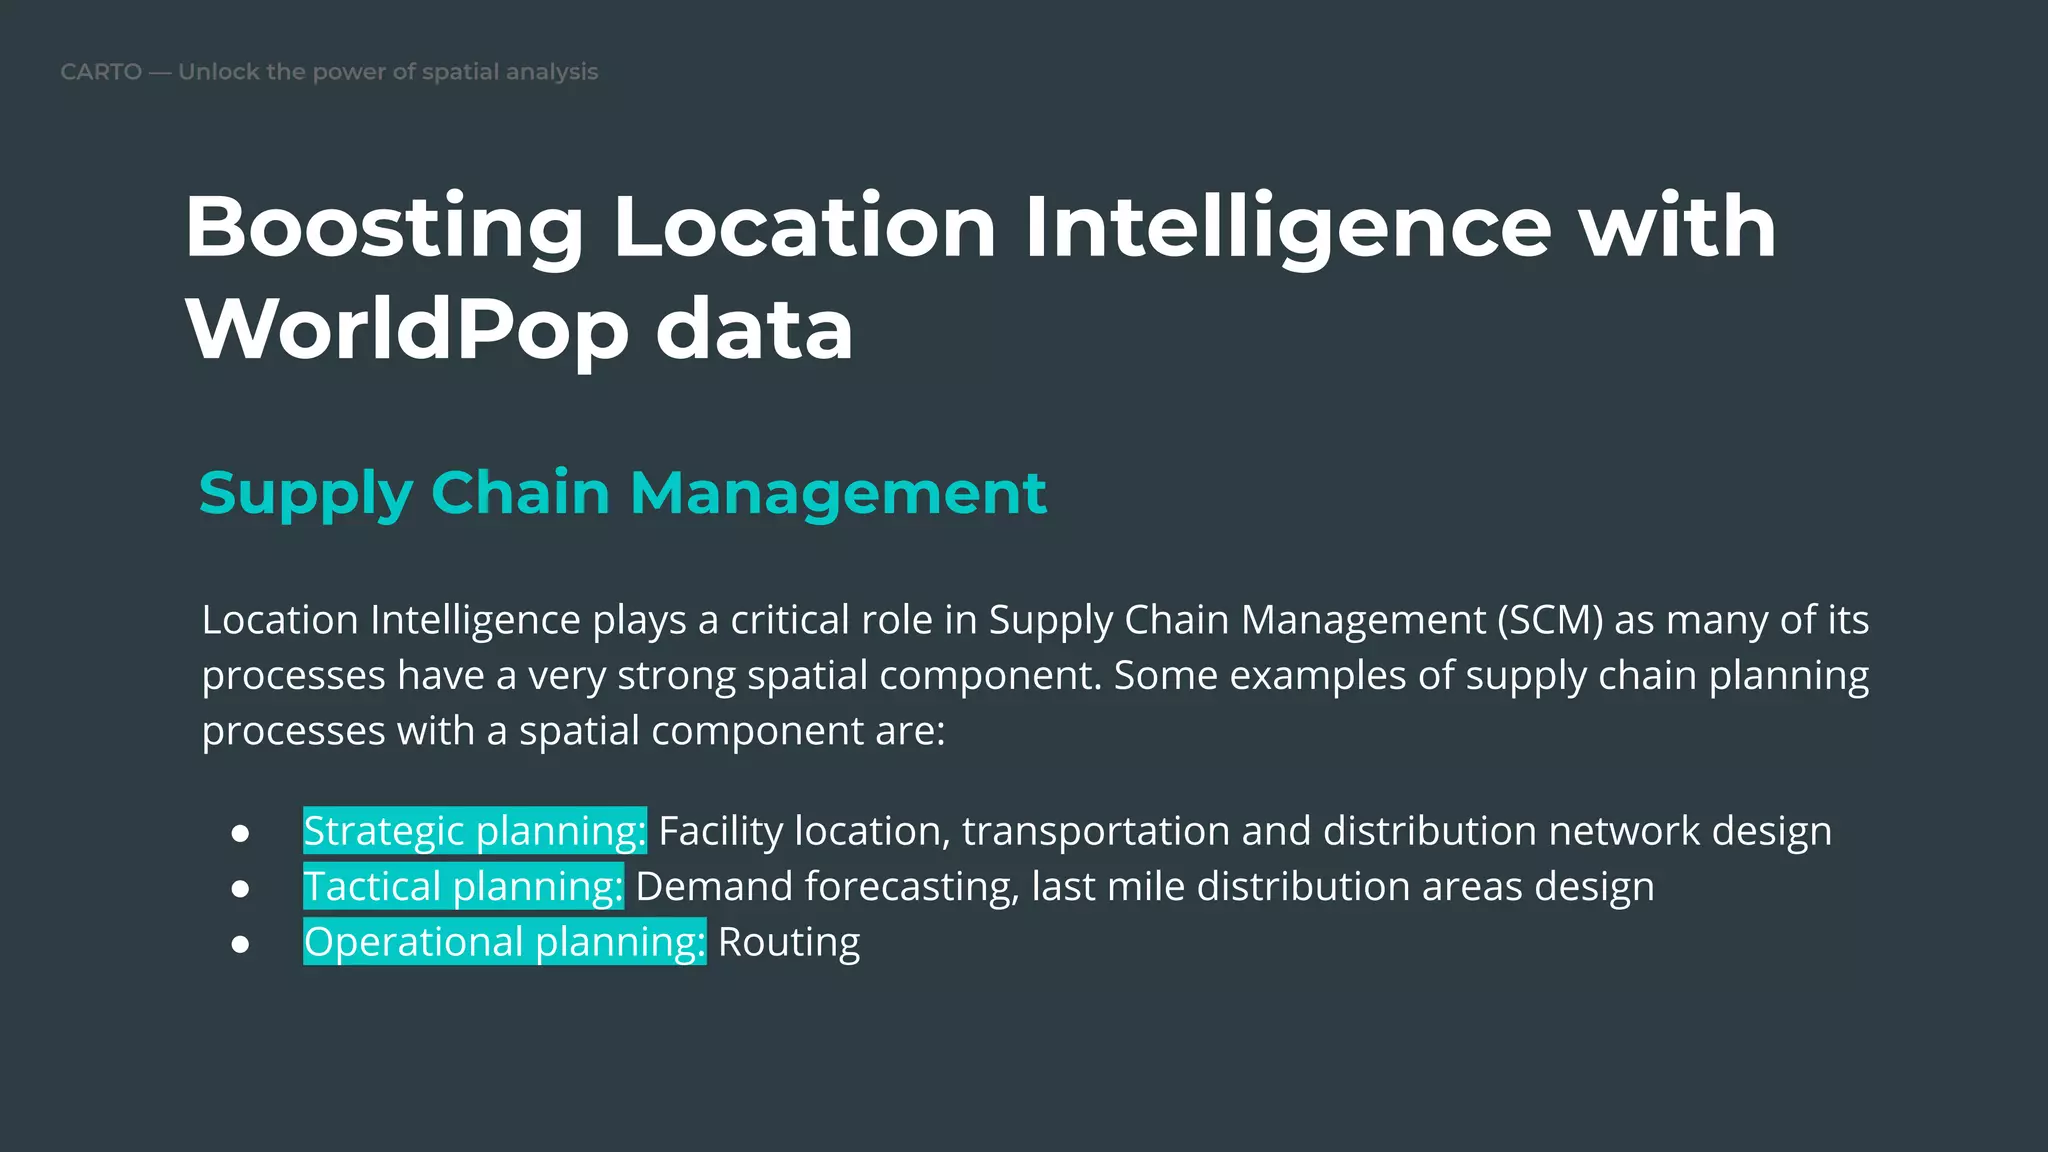
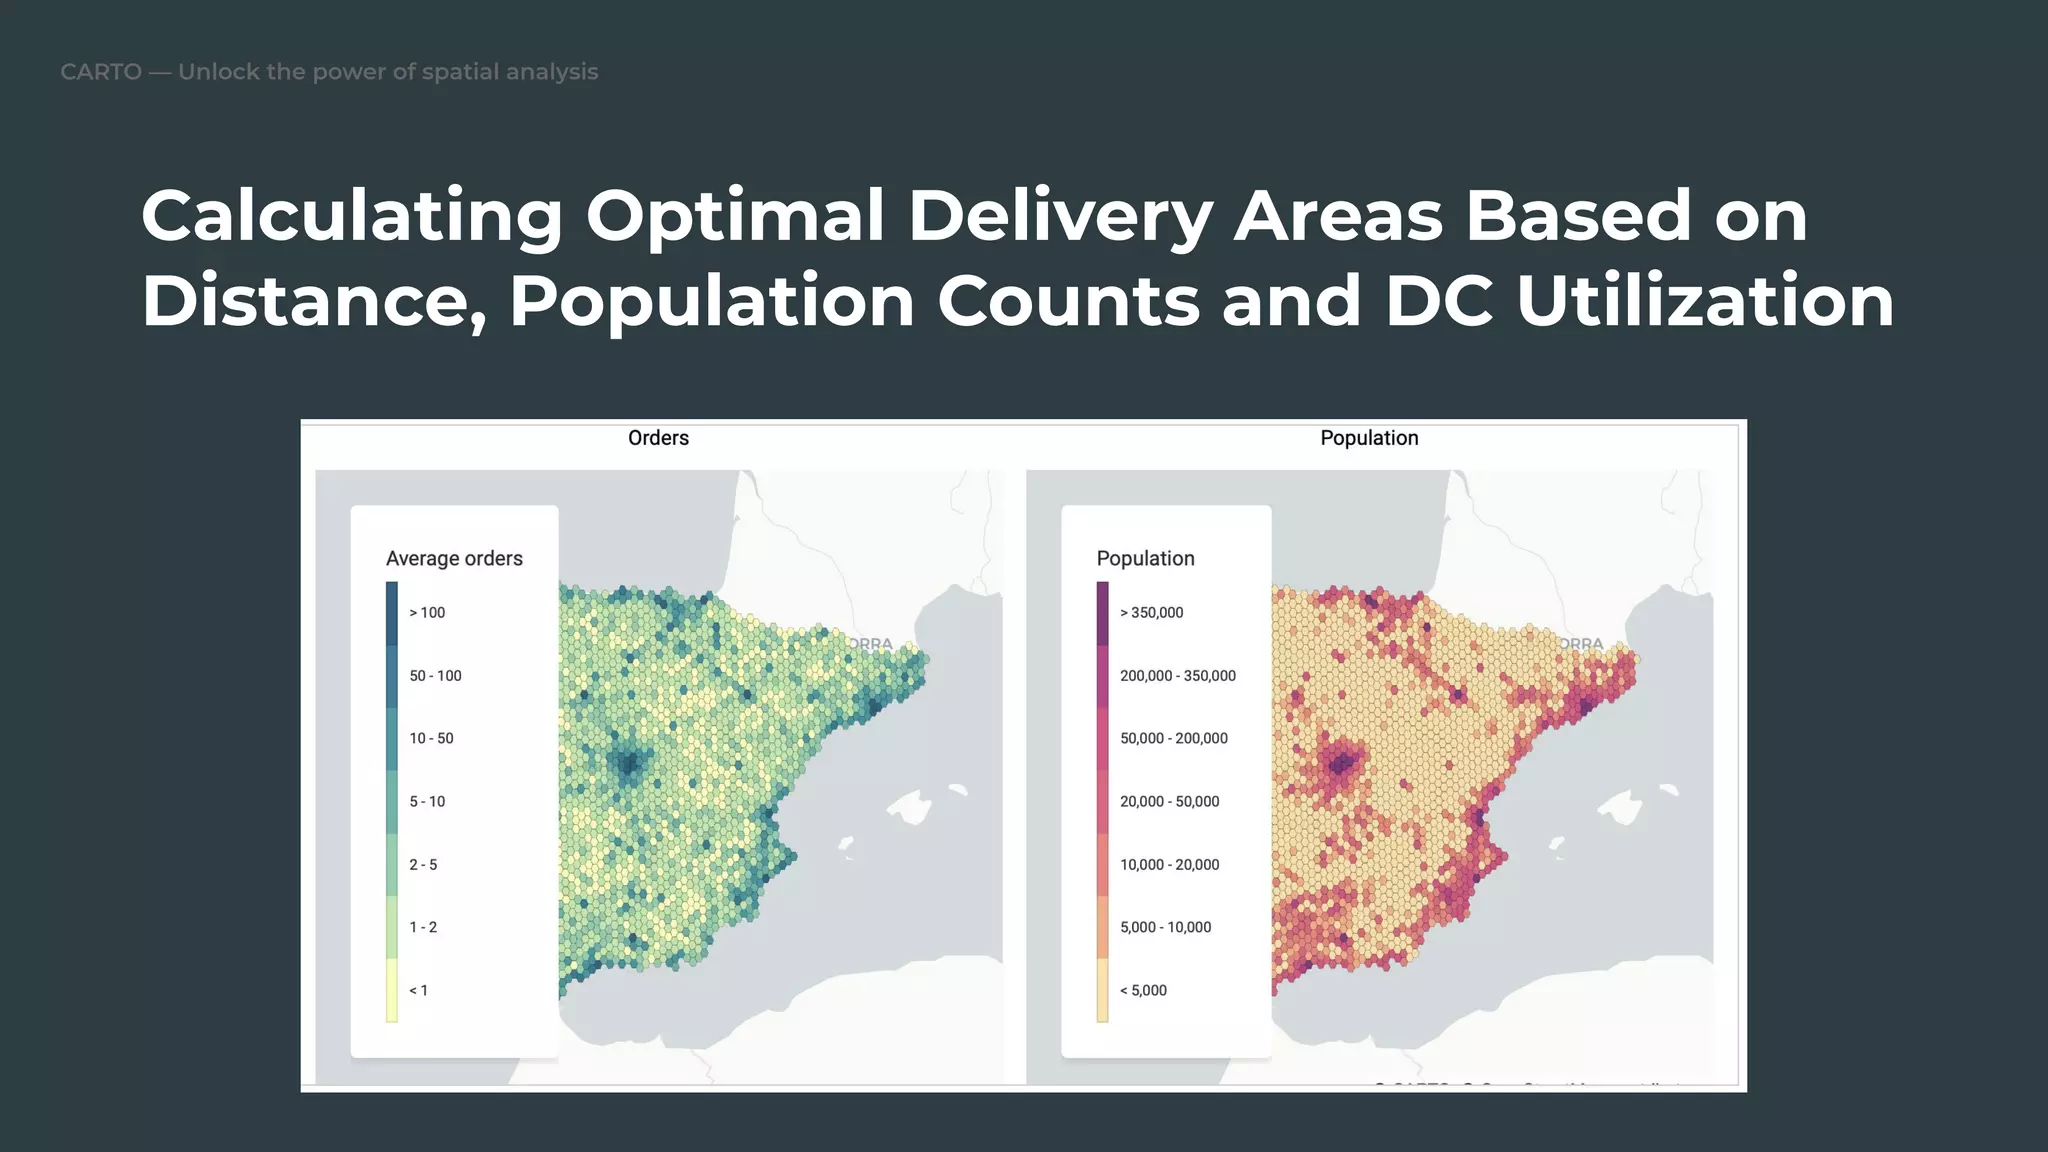
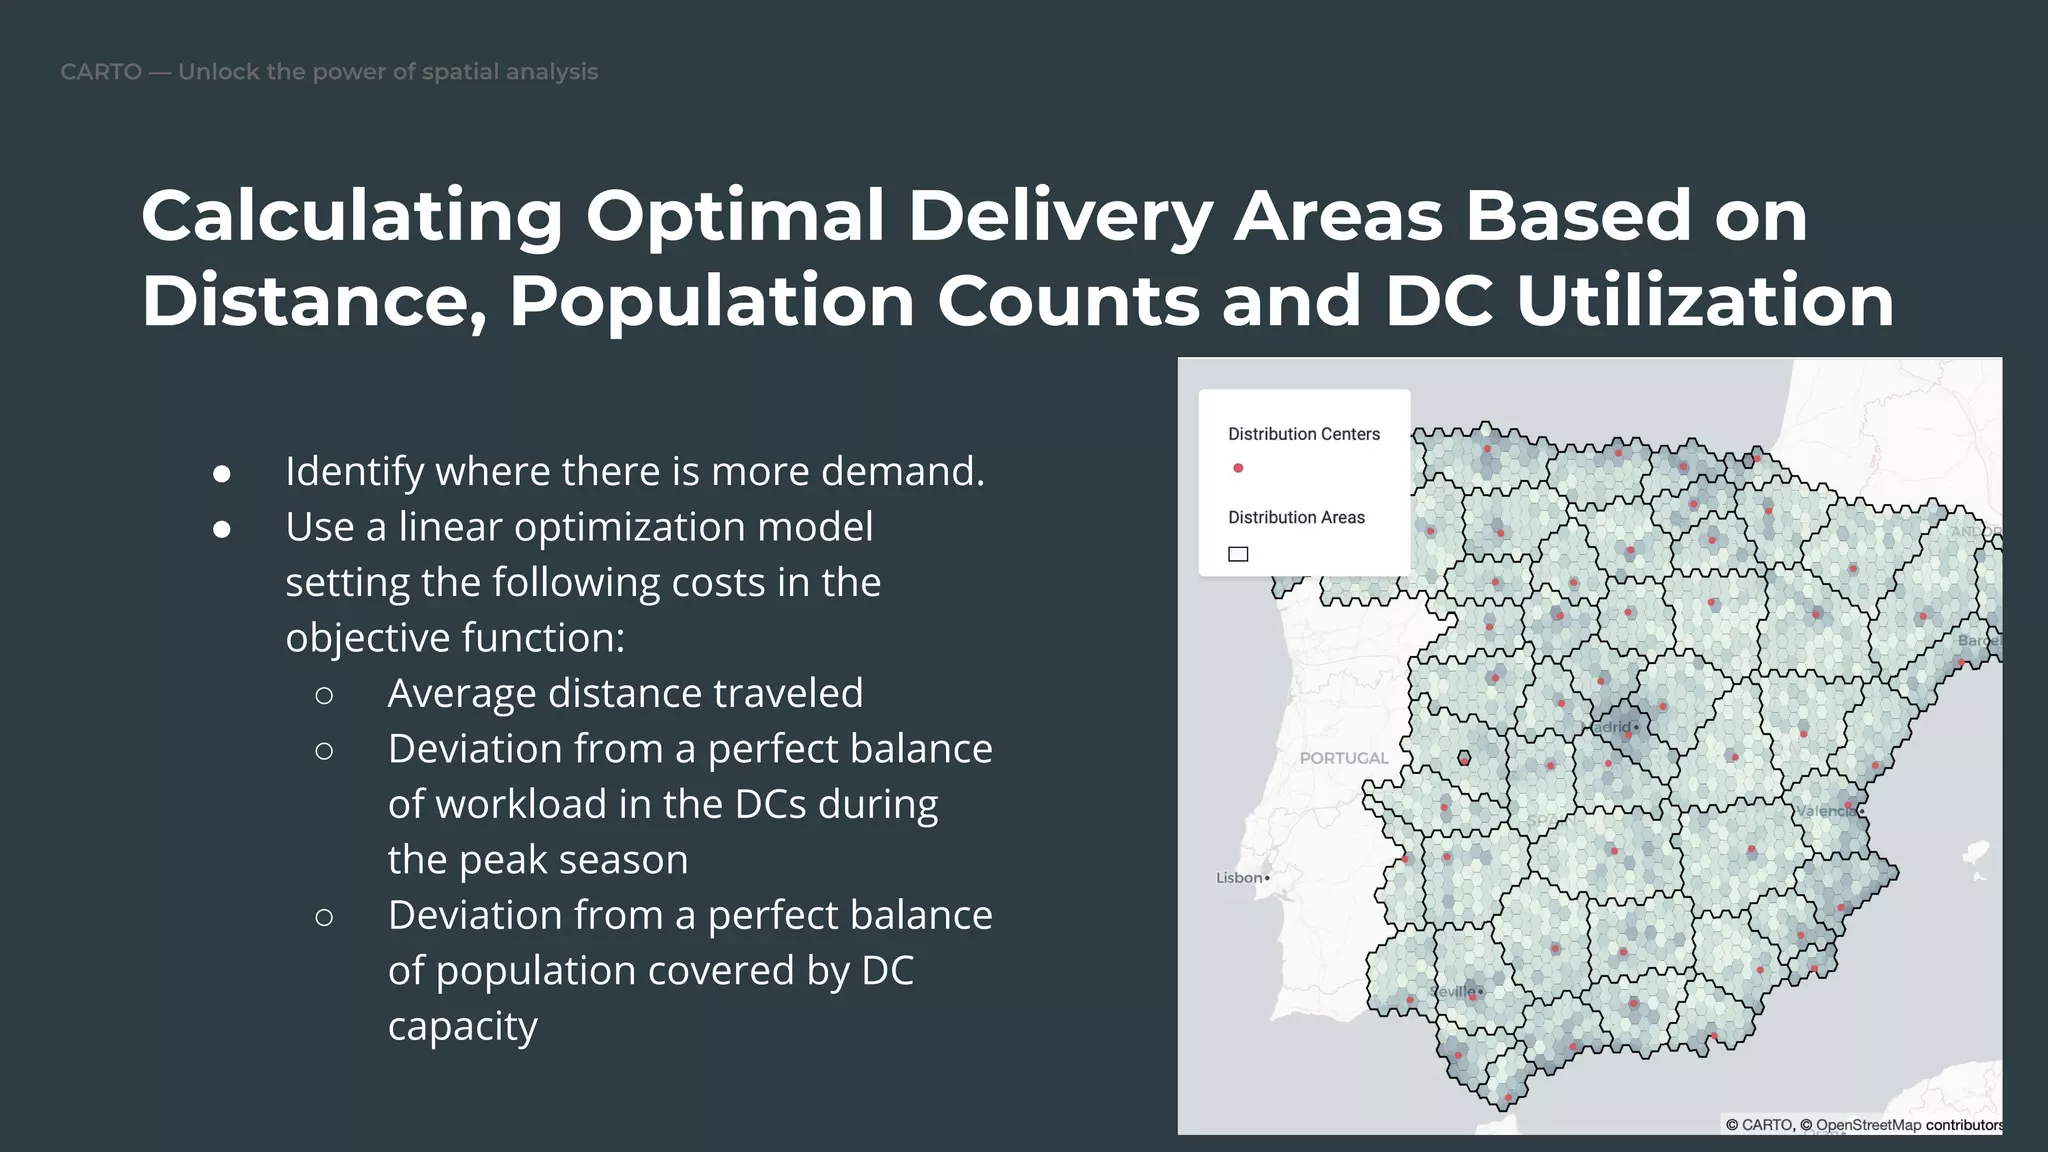


The document discusses the importance of high-resolution spatial data on population for location intelligence, highlighting the role of WorldPop in mapping population distributions and demographics. It covers applications in site planning and supply chain management, emphasizing the need for detailed demographic and socioeconomic data. The document also presents practical sessions for accessing WorldPop data and illustrates how such data can enhance decision-making in various spatial planning scenarios.


![How to Use Spatial Data Science in your Site Planning Process? [CARTOframes]](https://cdn.slidesharecdn.com/ss_thumbnails/webinardeckhowtousespatialdatascienceinyoursiteplanning-190828105208-thumbnail.jpg?width=640&height=640&fit=bounds)


![Unlock the power of spatial analysis using CARTO and python [CARTOframes]](https://cdn.slidesharecdn.com/ss_thumbnails/unlockthepowerofspatialanalysisusingcartoandpython-190927095046-thumbnail.jpg?width=640&height=640&fit=bounds)


![The Sum of our Parts: the Complete CARTO Journey [CARTO]](https://cdn.slidesharecdn.com/ss_thumbnails/recordedwebinarthesumofourpartsthecompletecartojourneydeck-190424092526-thumbnail.jpg?width=640&height=640&fit=bounds)


![Tips and tricks for Working with Demographic Data [CARTOframes & Python]](https://cdn.slidesharecdn.com/ss_thumbnails/webinar-tipsandtricksforworkingwithdemographicdata-190319103145-thumbnail.jpg?width=640&height=640&fit=bounds)


![Think Spatial: Don't Ignore Location in your Models! [CARTOframes]](https://cdn.slidesharecdn.com/ss_thumbnails/cartorecordedwebinar-thinkspatial-deck-190522084544-thumbnail.jpg?width=640&height=640&fit=bounds)


![[DSC Europe 25] Jim Sterne - Adopting Generative AI Capabilities Into the Ent...](https://cdn.slidesharecdn.com/ss_thumbnails/sxhpofuorcagxsaulkmt-3-251204082258-7e66bc48-thumbnail.jpg?width=640&height=640&fit=bounds)


![[DSC Europe 25] Vid Stimac - Policy Parsimony: Between Oversimplifying and Ov...](https://cdn.slidesharecdn.com/ss_thumbnails/eqlepagzqp2rhg3gbluh-dsc-stimac-251120-251205090438-059e7f54-thumbnail.jpg?width=640&height=640&fit=bounds)

![[DSC Europe 25] Dragan Vucic - Building the Learning Organization - How AI Tr...](https://cdn.slidesharecdn.com/ss_thumbnails/8brigo2sbu6qur6gxrra-7-251205085715-6ae07d24-thumbnail.jpg?width=640&height=640&fit=bounds)
![[DSC Europe 25] Nikola Rajovic - Hardware Technologies Under the Hood: RISC-V...](https://cdn.slidesharecdn.com/ss_thumbnails/o2gptrmtoyqndgoshwgq-dsc2025-tenstorrent-rajovic-251205090438-814685f5-thumbnail.jpg?width=640&height=640&fit=bounds)

![[DSC Europe 25] Max Talanov - Non digital NNs.pptx](https://cdn.slidesharecdn.com/ss_thumbnails/wif8tr3gtua74qvtopke-non-digital-nns-251205090438-26b0eea6-thumbnail.jpg?width=640&height=640&fit=bounds)


