
More Related Content
What's hot
What's hot (20)
Viewers also liked
Viewers also liked (20)
Similar to Umts interview qa
Similar to Umts interview qa (20)
Recently uploaded
Recently uploaded (20)
Umts interview qa
- 1. General 1. What is the experience and involvement in your current and previous UMTS design projects? Talk about your current and previous projects, your responsibilities, design objectives, tools used, activities involved, challenges, objectives met, etc. Link Budget 2. What is a typical NodeB sensitivity level? The service and load determines the NodeB sensitivity; in general, in a no-load condition, the sensitivity is between -115dBm to -125dBm. For Ericsson, the NodeB sensitivity level is calculated at around: CS12.2: -124 dBm PS-64: -119 dBm PS-128: -115 dBm PS-384: -115 dBm 3. What is a typical UE sensitivity level? The service and load determines the UE sensitivity; in general, in no-load condition, the sensitivity is between -105dBm and -120dBm. For Ericsson, the UE sensitivity level is calculated at around: CS12.2: -119 dBm PS-64: -112 dBm PS-128: -110 dBm PS-384: -105 dBm HSDPA: -95 dBm 4. What is a typical NodeB maximum output power? The maximum NodeB output power is usually 20W or 40W, that is, 43dBm or 46dBm. 5. What is UE maximum transmit power in your link budget? 21dBm= 2 w 6. What is a typical antenna gain? The antenna gain depends on antenna model; in link budget we use around 17dBi. 7. What is a typical maximum path loss? The maximum path loss is dependent on the service and vendor recommendations; typically it is in between 135 to 140dB for urban areas and between 150 to 160dB for rural areas. 8. What is difference between dBi and dBd? dBi is the gain in dB from isotropic source; dBd is the gain from a dipole source. dBd + 2.15 = dBi. 9. What is the difference between dB and dBm? dBm is a unit of power level, measured in milli-watts in logarithm scale, that is, dBm = 10 * log(W*1000) where W is the power in Watts dB is not a unit, it is the difference in dBm. 10. What is 0dBm? 0dBm = 1 milli-watt. 11. How does TMA work? A TMA reduces system noise, improves uplink sensitivity and leads to longer UE battery life. Sensitivity is the minimum input power needed to get a suitable signal-to-noise ratio (SNR) at the output of the receiver. It is determined by receiver noise figure, thermo noise power and required SNR. Thermo noise power is determined by bandwidth and temperature, SNR is determined by modulation technique, therefore the only variable is noise figure.
- 2. The cascading noise figure can be calculated by Friis equation (Herald Friis): NFt = NF1 + (NF2-1)/G1 + (NF3-1)/(G1*G2) + ... + (NFi-1)/(G1*G2*...*Gi) As the equation shows, the first block imposes the minimum and the most prominent noise figure on the system, and the following blocks imposes less and less impact to the system provided the gains are positive. Linear passive devices have noise figure equal to their loss. A TMA typically has a gain of 12dB. There are typically top jumper, main feeder and a bottom jumper between antenna and BTS. A TMA placed near antenna with a short jumper from antenna provides the best noise figure improvement – the noise figure will be restricted to the top jumper loss (NF1) and TMA ((NF2-1)/G1), and the remaining blocks (main feeder and bottom jumper) have little effect. To summarize, a TMA has a gain that’s close to feeder loss. 12. What are the pros and cons (advantages and disadvantages) of TMA? On the upside, a TMA reduces system noise, improves uplink sensitivity and leads to longer UE battery life. On the downside, TMA imposes an additional insertion loss (typically 0.5dB) on the downlink and increases site installation and maintenance complexity. 13. What is typical TMA gain? TMA typically has a 12 dB gain; however, the effective gain comes from noise figure reduction and the gain is close or equivalent to the feeder loss. 14. Why TMA are installed at the top near the antenna and not the bottom near the NodeB? Based on Friis Equation, having a TMA near the BTS will have the top jumper and main feeder losses (noise figures) cascaded in and a TMA will not be able to help suppress the losses. 15. What is UMTS chip rate? 3.84MHz. 16. What is processing gain? Processing gain is the ratio of chip rate over data bit rate, usually represented in decibel (dB) scale. For example, with 3.84MHz chip rate and 12.2k data rate, the processing gain is: PG12.2k = 10 * log (3,840,000 / 12,200) = 25dB 17. What are the processing gains for CS and PS services? CS12.2: 25dB PS-64: 18dB PS-128: 15dB PS-384: 10dB HSDPA: 2dB 18. How to calculate maximum number of users on a cell? To calculate the maximum number of users (M) on a cell, we need to know: W: chip rate (for UMTS 3,840,000 chips per second) EbNo: Eb/No requirement (assuming 3dB for CS-12.2k) i: other-cell to in-cell interference ratio (assuming 60%) R: user data rate (assuming 12,200 kbps for CS-12.2k) η: loading factor (assuming 50%) Take 12.2kbps as example: M = W / (EnNo * (1 + i) * R) * η = 3,840,000 (3 * (1 + 0.6) * 12,200) * 0.5 = 32.8 The number of users could also be hard-limited by OVSF code space. Take CS12.2k for example: • A CS-12.2k bearer needs 1 SF128 code. • Total available codes for CS-12.2k = 128 – 2 (1 SF64) – 2 (4 SF256) = 124. • Consider soft-handover factor of 1.8 and loading factor of 50%: 124 / 1.8 *.05 = 34 uers/cell. 19. What is Eb/No?
- 3. By definition Eb/No is energy bit over noise density, i.e. is the ratio of the energy per information bit to the power spectral density (of interference and noise) after dispreading. Eb/No = Processing Gain + SIR For example, if Eb/No is 5dB and processing gain is 25dB then the SIR should be -20dB or better. 20. What are the Eb/No targets in your design? The Eb/No targets are dependent on the service: • On the uplink, typically CS is 5 to 6dB and PS is 3 to 4dB – PS is about 2dB lower. • On the downlink, typically CS has 6 to 7dB and PS is 5 to 6dB – PS is about 1dB lower. 21. Why is Eb/No requirement lower for PS than for CS? PS has a better error correction capability and can utilize retransmission, therefore it can afford to a lower Eb/No. CS is real-time and cannot tolerate delay so it needs a higher Eb/No to maintain a stronger RF link. 22. What is Ec/Io? Ec/Io is the ratio of the energy per chip in CPICH to the total received power density (including CPICH itself). 23. Sometimes we say Ec/Io and sometimes we say Ec/No, are they different? Io = own cell interference + surrounding cell interference + noise density No = surrounding cell interference + noise density That is, Io is the total received power density including CPICH of its own cell, No is the total received power density excluding CPICH of its own cell. Technically Ec/Io should be the correct measurement but, due to equipment capability, Ec/No is actually measured. In UMTS, Ec/No and Ec/Io are often used interchangeably. 24. What is RSCP? RSCP stands for Received Signal Code Power – the energy per chip in CPICH averaged over 512 chips. 25. What is SIR? SIR is the Signal-to-Interference Ratio – the ratio of the energy in dedicated physical control channel bits to the power density of interference and noise after dispreading. 26. What is the loading factor in your design? The designed loading typically is 50%; however, sometimes a carrier may want to design up to 75% load. 27. Give a simple definition of pole capacity? The uplink noise increases with the loading exponentially. When the uplink noise approaches infinity then no more users can be added to a cell – and the cell loading is close to 100% and has reached its “pole capacity”. Mathematically, to calculate the uplink pole capacity we need to know: W: chip rate (for UMTS 3,840,000 chips per second) R: user data rate (assuming 12,200 kbps for CS-12.2k) f: other-cell to in-cell interference ratio (assuming 65%) EbNo: Eb/No requirement (assuming 5dB) AF: Activity factor (assuming 50%) Pole Capacity = (W/R) / ((1+f) * AF * 10^(EbNo/10)) = 120.6 To calculate the downlink pole capacity we also need to know: α: downlink channels orthogonality factor (assuming 55%) Pole Capacity = (W/R) / ((1- α +f) * 10^(EbNo/10)) = 64.06 28. What is typical pole capacity for CS-12.2, PS-64, PS-128 and PS-384? With same assumptions as above: • CS-12.2k: 120.6 (UL), 64.1 (DL). • PS-64k: 34.8 (UL), 12.8(DL). • PS-128k: 16.2 (UL), 8.4 (DL). • PS-384k: 16.2 (UL), 2.8 (DL). PS-384k has only 128k on the uplink, therefore the uplink capacity is the same for both.
- 4. 29. How many types of handovers are there in UMTS? Soft handover, softer handover, inter-frequency handover, inter-RAT handover, inter-RAT cell change (UE moving out of UMTS coverage into GSM/GPRS/EGDGE coverage). 30. What is soft handover and softer handover? • Soft handover: when a UE is connected to cells owned by different NodeB. • Softer handover: when a UE is connected to cells owned by the same NodeB. 31. How does soft/softer handover work? • Soft/softer handover downlink: UE rake receiver performs maximum ratio combining, i.e. UE combines multi-path signals and form a stronger signal. • Soft handover uplink: RNC performs selection combining, i.e. RNC selects the better signal coming from multiple NodeB. • Softer handover uplink: NodeB performs maximum ratio combining, i.e. NodeB rake receiver combines signals from different paths and forms a stronger signal. 32. Why is there “soft handover gain”? Soft handover gain comes from the following: • Macro diversity gain over slow fading. • Micro diversity gain over fast fading. • Downlink load sharing over multiple RF links. By maintaining multiple links each link could transmit at a lower power, resulting in lower interference therefore a gain. 33. Brief describe the advantages and disadvantages of soft handover? Advantages: • Overcome fading through macro diversity. • Reduced Node B power which in turn decreases interference and increases capacity. • Reduced UE power (up 4dB), decreasing interference and increasing battery life. Disadvantages: • UE using several radio links requires more channelization codes, and more resources on the Iub and Iur interfaces. 34. What are fast fading and slow fading? Fast fading is also called multi-path fading, as a result of multi-path propagation. When multi-path signals arriving at a UE, the constructive and destructive phases create a variation in signal strength. Slow fading is also called shadowing. When a UE moves away from a cell the signal strength drops down slowly. 35. What are fast fading margin and slow fading margin? To factor in the fast fading and slow fading, we need to have a margin in the link budget and they are called fast fading margin and slow fading margin. In link budget, the fast fading margin is usually set to 2-3; slow fading margin is set to 7-10. 36. What is a typical soft handover gain in your link budget? • CS-12.2k: 3dB (UL), 2dB (DL). • PS-64k: 1dB (UL), 0dB (DL). • PS-128k: 1dB (UL), 0dB (DL). • PS-384k: 1dB (UL), 0dB (DL). 37. What is the percentage in time a UE is expected to be in soft or softer handover? Typically a UE should be in soft handover mode at no more than 35 to 40% of the time; in softer handover mode at about 5% of the time. 38. What is a typical EiRP? The EiRP depends NodeB transmit power, cable and connector loss and antenna gain. With a sample system of 43dBm transmit power, a 3dB cable and connector loss and a 17dBi antenna gain, the EiRP = 43 – 3 + 17 = 57dBm.
- 5. 39. How much power usually a NodeB is allocated to control channels? The power allocated to control channels may depend on equipment vendor recommendation. Typically no more than 20% of the total NodeB power is allocated to control channels, including CPICH. However, if HSDPA is deployed on the same carrier then the total power allocated to control channel may go up to 25 to 30% because of the additional HSDPA control channels required. 40. What is a typical CPICH power? CPICH power typically takes about 10% of the total Node B power. For a 20W (43dBm) NodeB, CPICH is around 2W (33dBm). In urban areas where in-building coverage is taken care of by in-building installations, the CPICH may sometimes go as low as 5% because: • The coverage area is small since users are close to the site, and • More power can be allocated to traffic channels. 41. How much is your HSDPA (max) link power? HSDPA link power is typically 4 to 5dB below the maximum NodeB maximum output power. For example, for 43dBm maximum NodeB power the HSDPA link power is 39dBm. 42. Consider downlink only, what are the major components in calculating maximum path loss, starting from NodeB? • Node B CPICH transmit power. • Jumper and feeder connector loss. • Antenna gain. • Over-the-air loss. • Building / vehicle penetration loss. • Body loss. • Etc. 43. What is maximum path-loss? The maximum path-loss is how much signal is allowed to drop from a transmitter to a receiver and maintains as good signal. 44. Simple link budget: with a 30dBm CPICH and a -100dBm UE sensitivity, ignoring anything in between, what is the maximum path loss? 30 – (–100) = 30 + 100 = 130dB. 45. Suppose I have a maximum path-loss of 130dBm, what is the new path-loss if a 5dB body loss is added? 125dB. 46. What is channelization code? Channelization codes are orthogonal codes used to spread the signal and hence provide channel separation, that is, channelization codes are used to separate channels from a cell. 47. How many channelization codes are available? The number of channelization codes available is dependent on the length of code. In the uplink the length is defined as between 4 and 256. In the downlink the length is defined as between 4 and 512. 48. Are channelization codes mutually orthogonal? If so, why is “Orthogonality Factor” required in the link budget? Yes, channelization codes are mutually orthogonal. Nonetheless, due to multi-path with variable time delay, channels from the same cell are no longer perfectly orthogonal and may interfere with each other. A “Downlink Orthogonality Factor”, typically 50-60%, is therefore needed in the link budget to account for the interference – and hence reduces pole capacity. 49. What is scrambling code? How many scrambling codes there are?
- 6. Scrambling codes are used to separate cells and UEs from each other, that is, each cell or UE should have a unique scrambling code. There are 512 scrambling codes on the downlink and millions on the uplink. 50. What is scrambling “code group”? The 512 scrambling codes are divided into 64 code groups – each code group has 8 scrambling codes. Code group i (i = 0 to 63) has codes from i*8 to (i+1)*8-1, i.e. (0-7) (8-15)…(504-511). 51. Do you divide scrambling code groups into subgroups? Please give an example. Yes, we divide the 64 code groups into subgroups: • Macro layer group: 24 code groups reserved for macro (outdoor) sites. • Micro layer group: 16 code groups reserved for micro (in-building) sites. • Expansion group: 24 code groups reserved for future expansion sites. 52. Which service usually needs higher power, CS or PS? Consider downlink and take CS-12.2 and PS-384k for example. The processing gain is 25 for CS-12.2 and 10 for PS- 384. The Eb/No requirement is 7 for CS-12.2 and 5 for PS-384. Therefore the power requirement is higher for CS- 12.2 than PS-384. 53. What is Eb/No requirement for HSDPA? The Eb/No requirement for HSDPA varies with user bit rate (data rate), typically 2 for 768kbps and 5 for 2Mbps. 54. What is “noise rise”? What does a higher noise rise mean in terms of network loading? For every new user added to the service, additional noise is added to the network. That is, each new user causes a “noise rise”. In theory, the “noise rise” is defined as the ratio of total received wideband power to the noise power. Higher “noise rise” value implies more users are allowed on the network, and each user has to transmit higher power to overcome the higher noise level. This means smaller path loss can be tolerated and the cell radius is reduced. To summarize, a higher noise rise means higher capacity and smaller footprint, a lower noise rise means smaller capacity and bigger footprint. 55. What is “pilot pollution”? Simply speaking, when the number of strong cells exceeds the active set size, there is “pilot pollution” in the area. Typically the active set size is 3, so if there are more than 3 strong cells then there is pilot pollution. Definition of “strong cell”: pilots within the handover window size from the strongest cell. Typical handover window size is between 4 to 6dB. For example, if there are more than 2 cells (besides the strongest cell) within 4dB of the strongest cell then there is pilot pollution. 56. What is a typical handover window size in your network? A handover window size is usually between 4 to 6dB. 57. What is “soft handover” and “softer handover”? “Soft handover” is when UE has connection to multiple cells on different NodeB. “Softer handover” is when UE has connection to multiple cells on same NodeB. In downlink a UE can combine signals from different cells, improving the signal quality. For uplink and soft handover, RNC selects the best signal from different NodeB. For uplink and softer handover, a NodeB combines the signal from different sectors. 58. During a handover, if one cell sends a power down request and two cells send a power up request, shall the UE power up or power down? Power down. As long as a good link can be maintained it is not necessary to power up in order to maintain multiple links. Maintaining unnecessary multiple links increases noise rise and shall be avoided. 59. Suppose we are designing a CS network and a PS network, is there a major difference in the design consideration? Server dominance is the key difference. In a CS network we shall limit the number of strong servers in any given area to no more than the active set size to avoid pilot pollution (in the downlink). In a PS network, however, there isn’t soft
- 7. handover in the downlink so the server dominance is very important – meaning ideally there should be only one dominant server in a given area. What is the active set size on your network? 3. 60. How many fingers does a UE rake receiver have? 4. 61. What is “compressed mode”? Before UE can perform inter-frequency or IRAT handover, it needs to have some time to lock on to the control channel of the other frequency or system and listen to the broadcast information. Certain idle periods are created in radio frames for this purpose and is called “compressed mode”. 62. Describe the power control schemes in UMTS? • Open loop – for UE to access the network, i.e. used at call setup or initial access to set UE transmit power. • Closed outer loop: RNC calculates the SIR target and sends the target to NodeB (every 10ms frame). • Closed inner loop: NodeB sends the TPC bits to UE to increase or decrease the power at 1,500 times a second. 63. What is the frequency of power control (how fast is power control)? • Open loop: depends on parameter setting: T300 – time to wait between RRC retries (100ms to 8000 ms, typical 1500ms) • Closed outer loop: 100 times a second. • Closed inner loop: 1,500 times a second. 64. Briefly describe why open loop power control is needed and how it works? • When a UE needs to access to the network it uses RACH to begin the process. • RACH is a shared channel on the uplink used by all UE, therefore may encounter contention (collision) during multiple user access attempts and interfere with each other. • Each UE must estimate the amount of power to use on the access attempt since no feedback from the NodeB exists as it does on the dedicated channel. • The purpose of open loop power control is to minimize the chance of collision and minimize the initial UE transmit power to reduce interference to other UE. Initial UE transmit power = Primary_CPICH_Power – CPICH_RSCP + UL_Interferrnce + constant_Value_Cprach • Instead of sending the whole message, a “test” (preamble) is sent. • Wait for answer from NodeB. • If no answer from NodeB increase the power. • Try and try until succeed or timeout. 65. What is power control “headroom”? Power control “headroom” is also called “power rise”. In a non-fading channel the UE needs to transmit a certain fixed power. In a fading chennel a UE reacts to power control commands and usually increases the transmit power. The difference between the average power levels of fading and non-fading channels is called “power rise” or “headroom”. 66. When in 3-way soft handover, if a UE receives power down request from one cell and power up request from the other 2 cells, should the UE power up or down and why? Power down. Maintaining one good link is sufficient to sustain a call and having unnecessary stronger links creates more interference. 67. Suppose two UE are served by the same cell, the UE with weaker link (poor RF condition) uses more “capacity”, why does this mean? The UE with weaker RF link will require NodeB to transmit higher traffic power in order to reach the UE, resulting in less power for other UE – therefore consumes more “capacity”.
- 8. 68. Under what circumstances can a NodeB reach its capacity? What are the capacity limitations? NodeB reaches its maximum transmit power, runs out of its channel elements, uplink noise rise reaches its design target, etc. 69. What is “cell breathing” and why? The cell coverage shrinks as the loading increases, this is called cell breathing. In the uplink, as more and more UE are served by a cell, each UE needs to transmit higher power to compensate for the uplink noise rise. As a consequence, the UE with weaker link (UE at greater distance) may not have enough power to reach the NodeB – therefore a coverage shrinkage. In the downlink, the NodeB also needs to transmit higher power as more UE are being served. As a consequence UE with weaker link (greater distance) may not be reachable by the NodeB. 70. Is UMTS an uplink-limited or downlink-limited system? A UMTS system could be either uplink-limited or downlink-limited depending on the loading. In a lightly loaded system, the UE transmit power sets a coverage limitation therefore it is uplink-limited. In a heavily loaded system, the NodeB transmit power limits the number of UEs it can serve therefore it is downlink-limited. 71. What is the impact of higher data rate on coverage? Higher data rate has lower processing gain and therefore a NodeB needs to transmit more power to meet the required Eb/No; this means the coverage is smaller for higher data rate. 72. What is OCNS? OCNS stands for Orthogonal Channel Noise Simulator. It is a simulated network load usually by increasing the noise rise figure in the NodeB. UTRAN 73. What are the interfaces between each UTRAN component? Uu: UE to NodeB Iub: NodeB to RNC Iur: RNC to RNC Iu: RNC to MSC 74. Briefly describe the UE to UTRAN protocol stack (air interface layers). The radio interface is divided into 3 layers: 1. Physical layer (Layer 1, L1): used to transmit data over the air, responsible for channel coding, interleaving, repetition, modulation, power control, macro-diversity combining. 2. Link layer (L2): is split into 2 sub-layers – Medium Access Control (MAC) and Radio Link Control (RLC). • MAC: responsible for multiplexing data from multiple applications onto physical channels in preparation for over-the-air transmition. • RLC: segments the data streams into frames that are small enough to be transmitted over the radio link. 3. Upper layer (L3): vertically partitioned into 2 planes: control plane for signaling and user plan for bearer traffic. • RRC (Radio Resource Control) is the control plan protocol: controls the radio resources for the access network. In implementation: 1. UE has all 3 layers. 2. NodeB has Physical Layer. 3. RNC had MAC layer and RRC layer. 75. Briefly describe UMTS air interface channel types and their functions. There are 3 types of channels across air interface – physical channel, transport channel and logical channel: 1. Physical Channel: carries data between physical layers of UE and NodeB. 2. Transport Channel: carries data between physical layer and MAC layer. 3. Logical Channel: carries data between MAC layer and RRC layer.
- 9. 76. Give some examples of Physical, Transport and Logical channels. 1. Logical Channel: • Control channel: BCCH, PCCH, CCCH, DCCH. • Traffic channel: DTCH, CTCH. 2. Transport Channel: • Common control channel: BCH, FACH, PCH, RACH, CPCH. • Dedicated channel: DCH, DSCH. 3. Physical Channel: • Common control channel: P-CCPCH, S-CCPCH, P-SCH, S-SCH, CPICH, AICH, PICH, PDSCH, PRACH, PCPCH, CD/CA-ICH. • Dedicated channel: DPDCH, DPCCH. 77. What are the RRC operation modes? Idle mode and connected mode. 78. What are the RRC states? There are 4 RRC States: Cell_DCH, Cell_FACH, URA_PCH and Cell_PCH. URA = UTRAN Registration Area. 79. What are transparent mode, acknowledged mode and unacknowledged mode? • Transparent mode corresponds to the lowest service of the RLC layer, no controls and no detection of missing data. • Unacknowledged mode offers the possibility of segment and concatenate of data but no error correction or retransmission therefore no guarantee of delivery. • Acknowledged mode offers, in addition to UM mode functions, acknowledgement of transmission, flow control, error correction and retransmission. 80. Which layer(s) perform ciphering function? RRC – for acknowledged mode (AM) and unacknowledged mode (UM). MAC – for transparent mode (TM). 81. What is OVSF? Orthogonal Variable Spreading Factor. 82. How many OVSF code spaces are available? • Total OVSF codes = 256. • Reserved: 1 SF64 for S-CCPCH, 1 SF256 for CPICH, P-CCPCH, PICH and AICH each. • Total available code space = 256 – 4 (1 SF64) – 4 (4 SF256) = 248. 83. Can code space limit the cell capacity?
- 10. Yes, cell capacity can be hard-limited by code space. Take CS-12.2k for example: • A CS-12.2k bearer needs 1 SF128 code. • Total available codes for CS-12.2k = 128 – 2 (1 SF64) – 2 (4 SF256) = 124. • Consider soft-handover factor of 1.8: 124 / 1.8 = 68 uers/cell. 84. Can a user have OVSF code as “1111”? No, because “1111…” (256 times) is used by CPICH. 85. What are the symbol rates (bits per symbol) for BPSK, QPSK, 8PSK and 16QAM? • BPSK: 1. • QPSK: 2. • 8PSK: 3. • 16QAM: 4. 86. Briefly describe UMTS frame structure. • UMTS frame duration = 10ms. • Each frame is divided into 15 timeslots. • Each timeslot is divided into 2560 chips. • Therefore 2560 chips/TS * 15 TS/frame * (1000ms/10ms) frame/sec = 3,840,000 chip/sec. 87. What is cell selection criterion? Cell selection is based on: • Qmean: the average SIR of the target cell. • Qmin: minimum required SIR. • Pcompensation: a correction value for difference UE classes. S = Qmean - Qmin - Pcompensation • If S>0 then the cell is a valid candidate. • A UE will camp on the cell with the highest S. 88. Briefly describe Capacity Management and its functions: Capacity Management is responsible for the control of the load in the cell. It consists of 3 main functions: • Dedicated Monitored Resource Handling: tracks utilization of critical resources of the system. • Admission Control: accepts/refuses admission requests based on the current load on the dedicated monitored resources and the characteristics of the request • Congestion Control: detects/resolves overload situations Planning 89. What are the major 4 KPIs in propagation model tuning and typical acceptable values? The 4 KPIs are standard deviation error, root mean square error, mean error and correlation coefficient. The typical acceptable values are: • Standard deviation error: the smaller the better, usually 7 to 9dB. • Mean error: the smaller the better, usually 2 to3. • Root mean square error: the smaller the better, usually • Correlation coefficient: the larger the better, usually 70% to 90%. 90. What is the minimum number of bins required for a certain propagation model? The more bins the more likely to come up with a good model. Usually a minimum of 2,000 bines is considered acceptable, but sometimes as low as 500 bins may be accepted. 91. How many scrambling codes are there? There are 512 scrambling codes in the downlink and 16,777,216 codes in the uplink. 92. How many scrambling code groups are there for downlink? There are 64 code groups, each group has 8 scrambling codes.
- 11. 93. Can we assign same scrambling codes to sister sectors (sectors on same site)? No, because scrambling code on the downlink is used for cell identity. As a requirement, scrambling codes have to maintain a safe separation to avoid interference. 94. Are scrambling codes orthogonal? No, scrambling codes are not orthogonal since they are not synchronized at each receiver. They are pseudo random sequences of codes. 95. Can we assign scrambling codes 1, 2 and 3 to sister sectors? Yes. 96. In IS-95 we have a PN reuse factor (PN step size) and therefore cannot use all 512 PN codes, why isn’t it necessary for UMTS scrambling codes? Because IS-95 is a synchronized network, different PN codes have the same code sequence with a time shift, therefore we need to maintain a certain PN step size to avoid multi-path problem. For example, if two sectors in the neighborhood have a small PN separation then signal arriving from cell A may run into the time domain of cell B, causing interference. UMTS, on the other hand, is not a synchronized network and all scrambling codes are mutually orthogonal so no need to maintain a step size. 97. What are coverage thresholds in your UMTS design and why? The coverage thresholds are based on UE sensitivity, fading and penetration loss. Assuming UE sensitivity of -110dBm, fade margin of 5dB: • Outdoor: -110dBm sensitivity + 5dB fade margin = -105dBm. • In-vehicle: -110dBm + 5dB + 8dB in-vehicle penetration loss = -97dBm. • In-building: -110dBm + 5dB + 15dB in-building penetration loss = -90dBm. 98. What is the Ec/Io target in your design? The Ec/Io target typically is between -12 to -14dB. However, if a network is designed for data then the Ec/Io target could go higher to around -10dB because server dominance is more critical for a data network – since there isn’t software in the downlink. 99. What is “Monte Carlo simulation”? Since UMTS coverage is dependent on the loading, static coverage and quality analysis (RSCP and Ec/Io) represents the network performance in no-load condition. Monte Carlo simulation is therefore used to illustrate network performance under simulated loading consition. 100. What is the key difference between a static analysis and a Monte Carlo simulation? Static analysis can only show RSCP and Ec/Io in no-load condition. Monte Carlo simulation not only can show RSCP and Ec/Io in simulated loading condition but also can show many more others: mean served, cell loading, uplink and downlink capacity limits reached, etc. 101. What should be run first (what information should be ready and loaded) before running a Monte Carlo simulation? Before running Monte Carlo simulation, the following should be completed or in place. • Run prediction. • Spread the traffic. • Define terminal types. 102. How many snap shots and iteration do you usually have when running Monte Carlo simulation? (Depend on software tool recommendations). 103. What are the design KPI’s? (RSCP, Ec/Io, mean served, soft handover ratio…) 104. What plots do you usually check after running Monte Carlo for trouble spots?
- 12. (RSCP, Ec/Io, service probability, reasons for failure…) 105. What are the typical reasons of failure in Monte Carlo simulation? • Downlink Eb/No failure (Capacity). • Downlink Eb/No failure (Range). • Uplink Eb/No failure. • Low pilot SIR. • Noise rise limit reached.Etc. 106. What does “traffic spread” mean? “Traffic spread” means spreading traffic (number of terminals) in a cell coverage area. 107. Do you use live traffic or even-load traffic in your design? (Depends). Optimization 108. What are the optimization tools you use? Drive test, analysis, others? 109. Are System Information Blocks (SIB) transmitted all the time? No, system information block is multiplexed with synchronization channel. Synchronization channel occupies the first time slot (TS) and SIB occupies the other 9 time slots. 110. How does UE camp (synchronize) to a NodeB? 1. UE uses the primary synchronization channel (P-SCH) for slot alignment (TS synchronization). 2. After aligning to NodeB time slot, UE then uses secondary synchronization channel (S-SCH) to obtain frame synchronization and scrambling code group identification. 3. UE then uses scrambling code ID to obtain CPICH, thus camping to a NodeB. 111. What could be the cause of soft handover failure? • UE issue. • Resource unavailable at target NodeB. • Inadequate SHO threshold defined. • Etc. 112. What are the three sets in handover? The 3 sets in handover are: • Active set – the list of cells which are in soft handover with UE. • Monitored set – the list of cells not in active set but RNC has told UE to monitor. • Detected set – list of cells detected by the UE but not configured in the neighbor list. 113. What are the major differences between GSM and UMTS handover decision? GSM: • Time-based mobile measures of RxLev and RxQual – mobile sends measurement report every SACH period (480ms). • BSC instructs mobile to handover based on these reports. UMTS: • Event-triggered reporting – UE sends a measurement report only on certain event “triggers”. • UE plays more part in the handover decision. 114. What are the events 1a, 1b, 1c, etc.? • e1a – a Primary CPICH enters the reporting range, i.e. add a cell to active set. • e1b – a primary CPICH leaves the reporting range, i.e. removed a cell from active set. • e1c – a non-active primary CPICH becomes better than an active primary CPICH, i.e. replace a cell.
- 13. • e1d: change of best cell. • e1e: a Primary CPICH becomes better than an absolute threshold. • e1f: a Primary CPICH becomes worse than an absolute threshold. 115. What are event 2a-2d and 3a-3d? Events 2a-2d are for inter-frequency handover measurements and events 3a-3d are for IRAT handover measurements. • e3a: the UMTS cell quality has moved below a threshold and a GSM cell quality had moved above a threshold. • e3b: the GSM cell quality has moved below a threshold. • e3c: the GSM cell quality has moved above a threshold. • e3d: there was a change in the order of best GSM cell list. 116. What may happen when there’s a missing neighbor or an incorrect neighbor? • Access failure and handover failure: may attempt to access to a wrong scrambling code. • Dropped call: UE not aware of a strong scrambling code, strong interference. • Poor data throughput. • Poor voice quality. • Etc. 117. What can we try to improve when access failure is high? When access failure is high we can try the following to improve RACH performance: • Increase maximum UE transmit power allowed: Max_allowed_UL_TX_Power. • Increase power quickly: power_Offset_P0. • Increase number of preambles sent in a given preamble cycle: preamble_Retrans_Max. • Increase the number of preamble cycles: max_Preamble_Cycle. • Increase number of RRC Connection Request retries: N300. 118. What are the conditions you typically set to trigger IRAT handover? RSCP and Ec/Io are used to trigger IRAT handover: • RSCP ≤ -100dBm. • Ec/Io ≤ -16dBm. 119. What are the typical KPIs you use to measure a network and what criteria? • Access failure rate (≤ 2%). • Call setup time (CS: over 95% of the time < 6-second for mobile-to-PSTN, 9-second for mobile-mobile. PS: over 95% of the time < 5-second). • Dropped call rate (≤ 2%). • BLER: over 95% of the blocks ≤ 2%. • Average DL/UL throughput for PSD: 210kbps for loaded, 240kbps for unloaded. 120. What is the typical UE transmit power? Varies - most of the time below 0dBm. 121. Have your used Ericsson TEMS? If so: • Do you know how to create command sequence? • What are the call sequences you typically have? CS long call, CS short call, PSD call, etc. • What are the typical commands you have for CS and PS call? • Do you regularly stop and restart a new log file? Why and when to stop and start a new file? • How do you stop a log file? Stop command sequence first, wait and make sure all equipment are in idle mode before stop logging. 122. Did you work on neighbor prioritization? 123. What is the typical event sequence of IRAT Handover from 3G to 2G
- 14. • Event 2d – entering into compressed mode – measurement of 2G candidates – Event 3a – Verification of 2G resources – Handover from UTRAN Command from 3G RNC to UE 124. What are the possible causes for an IRAT Failure? • Missing 2G relations • Non availability of 2G Resources • Poor 2G Coverage • Missing 3G Relations 125. What is Paging Success Ratio? What is the typical PSR that you have seen in a UMTS network? • PSR – Paging Responses to the Paging Attempts • About 90% 126. What are the possible causes for a lower PSR? • Non-continuous RF Coverage – UE going in and out of coverage area frequently • Very High ‘Periodic Location Update Timer’ – Keeping UEs in VLR long time after it moved out of coverage • Lower Paging Channel Power • Access Channel Parameter Issues • Delayed Location Update when crossing the LA / CN Boundaries 127. What are the possible causes for a Drop Call on a UMTS network? • Poor Coverage (DL / UL) • Pilot Pollution / Pilot Spillover • Missing Neighbor • SC Collisions • Delayed Handovers • No resource availability (Congestion) for Hand in • Loss of Synchronization • Fast Fading • Delayed IRAT Triggers • Hardware Issues • External Interference 128. A UE is served by 2 or 3 SC in AS. It is identifying a SC from 3rd tier, Stronger and meets the criteria for Event1a or Event1c. But SHO did not happen because of missing neighbor relations? How do you optimize this issue? • Study the Pilot spillover from the 3rd Tier SC and control its coverage • Even after controlling the coverage, if the spillover is there, Add the neighbor. 129. A UE is served by 2 SC in AS, a SC is coming in to Monitored Set and Event1a is triggered. But UE is not receiving Active Set Update from NodeB and the call drops. What could be possible causes for this drop? • Delayed Handover • Loss of Synchronization • Fast Fading • Pilot Pollution / Spillover issues 130. What is Hard Handover in UMTS? When will it happen? • Hard Handover in UMTS is a break before make type Handover • It can happen in the inter RNC boundaries where there is no Iur link. 131. What is the typical Call Setup Time for a 3G UE to 3G UE Call? What are the possible RF related causes for a delayed CST in this type of call?
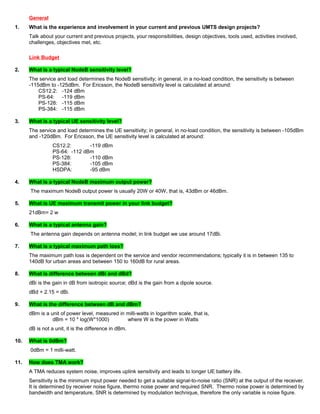
- 15. • 6 to 9 seconds • Multiple RRC Attempts (UE is on poor coverage – need more than Access Attempt) • Delayed Page Responses • High Load on Paging and/or Access Channel • Paging / Access Parameters 132. What is Soft Handover Overhead? What is the typical value in UMTS network? • Soft Handover Overhead is calculated in two ways. 1) Average Active Set Size – Total Traffic / Primary Traffic. 2) Secondary / Total Traffic • Typical Values are like 1.7 (Avg Active Set Size) or 35% (Secondary / Total ) 133. What will happen to the Soft Handover Overhead when you apply OCNS on the network? And Why? • With OCNS, the interference (load) increases. This leads to reduction in Ec/Io of a Pilot, which reduces the pilot spillovers. Reduction in Pilot Spillover will reduce the Soft Handover Overhead. 134. What are the possible causes for an Access Failure in UMTS? • Missing Neighbors • Poor Coverage • Pilot Pollution / Spillover • Poor Cell Reselection • Core Network Issues • Non – availability of resources. Admission Control denies • Hardware Issues • Improper RACH Parameters • External Interference 135. (FOR ERICSSON EXPERIENCED) What is RTWP? What is the significance of it? • Received Total Wide-band Power • It gives the Total Uplink Power (Interference) level received at Node B 136. (FOR ERICSSON EXPERIENCED) What is the System Reference Point at which all the Power Levels are measured in Ericsson Node B? • System Ref Point for E/// NodeB is at the output of TMA (Between TMA and Antenna) 137. What are the typical values for ‘reportingrange1a’ and ‘reportingrange1b’? • 3 dB and 5 dB respectively. 138. What will be the impact when you change ‘reportingrange1a’ from 3 to 4 dB and ‘timetotrigger1a’ 100 to 320 ms, without changing any other parameters? • Reduction in number of Event1a • Delayed Event1a trigger • Reduction in Average Active Set Size • Delay in Event1a could increase DL interference, which could lead to a drop call or increase in Average Power Per User (reduction in cell capacity) 139. What is Admission Control? • Admission Control is an algorithm which controls the Resource Allocation for a new call and additional resource allocation for an existing call. Incase, if a cell is heavily a loaded and enough resources in terms of power, codes or CEs are not available, admission control denies permission for the additional resource requirement. 140. What is Congestion Control?
- 16. • Congestion Control monitors the dynamic utilization of specific cell resources and insures that overload conditions do not occur. If overload conditions do occur, Congestion Control will immediately restrict Admission Control from granting additional resources. In addition, Congestion Control will attempt to resolve the congestion by either down switching, or terminating existing users. Once the congestion is corrected, the congestion resolution actions will cease, and Admission Control will be enabled. DL Transmitted Carrier Power 100 % pwrAdm - beMarginDlPwr pwrAdm pwrAdm + pwrAdmOffset85 % 75 % 65 % Admit: (All Guaranteed) & (All Non-Guaranteed) & (All Guaranteed-HS) Admit: (All Guaranteed) & (Non-Guaranteed/Handover) & (All Guaranteed-HS) Admit: (Guaranteed/Handover) & (All Guaranteed-HS) maximumTransmissionPower Power Reserved for Power Control Congestion Triggered Congestion Resolved pwrAdm + pwrAdmOffset +pwrOffset90 % DL Transmitted Carrier Power 100 % pwrAdm - beMarginDlPwr pwrAdm pwrAdm + pwrAdmOffset85 % 75 % 65 % Admit: (All Guaranteed) & (All Non-Guaranteed) & (All Guaranteed-HS) Admit: (All Guaranteed) & (Non-Guaranteed/Handover) & (All Guaranteed-HS) Admit: (Guaranteed/Handover) & (All Guaranteed-HS) maximumTransmissionPower Power Reserved for Power Control Congestion Triggered Congestion Resolved pwrAdm + pwrAdmOffset +pwrOffset90 % 141. What is the maximum number of Channelization Codes that can be allocated for HS, as per 3GPP standard? • 15 codes of SF 16. • 142. What is ‘Code Multiplexing’ in HSDPA? • Sharing the HS Channelization Codes among more than one HS users within the 2ms TTI period. 143. (FOR ERICSSON EXPERIENCED) In Ericsson System, how is the Power allocated for HSDPA> • Power unutilized by R99 PS, CS and Comman Channels, is used for HS (PHS = Pmax - hsPowerMargin - Pnon-HS) 144. What are Events that can trigger the HSDPA Cell Change? • Event 1d HS – Change of Best Cell in the Active Set • Event 1b or Event 1c – Removal of the Best Cell from the Active Set 145. How is typically the Call Setup Time of a CSV call calculated in UMTS using L3 messages? • CST is calculated as the time difference between ‘Alerting’ and the first RRC Connection Request (Call Initiation) messages. 146. Functions of RNC: Assign and release radio channels, monitors connection quality, controls handovers, fault and configuration management. 147. Macro diversity: connected two or more cell, reduced transmit power.