1) The document describes different types of nonlinearities that can occur in systems. It classifies nonlinearities based on their magnitude (incidental or intentional) and frequency (limit cycles, jump resonance, etc.).
2) Some common types of nonlinearities described include saturation, dead zones, backlash, relays, harmonics, and chaotic behavior.
3) Nonlinearities can cause issues like degradation of system performance, limit cycles, and even destabilization of systems. Understanding different nonlinear effects is important for analyzing system behavior.
Nonlinearity
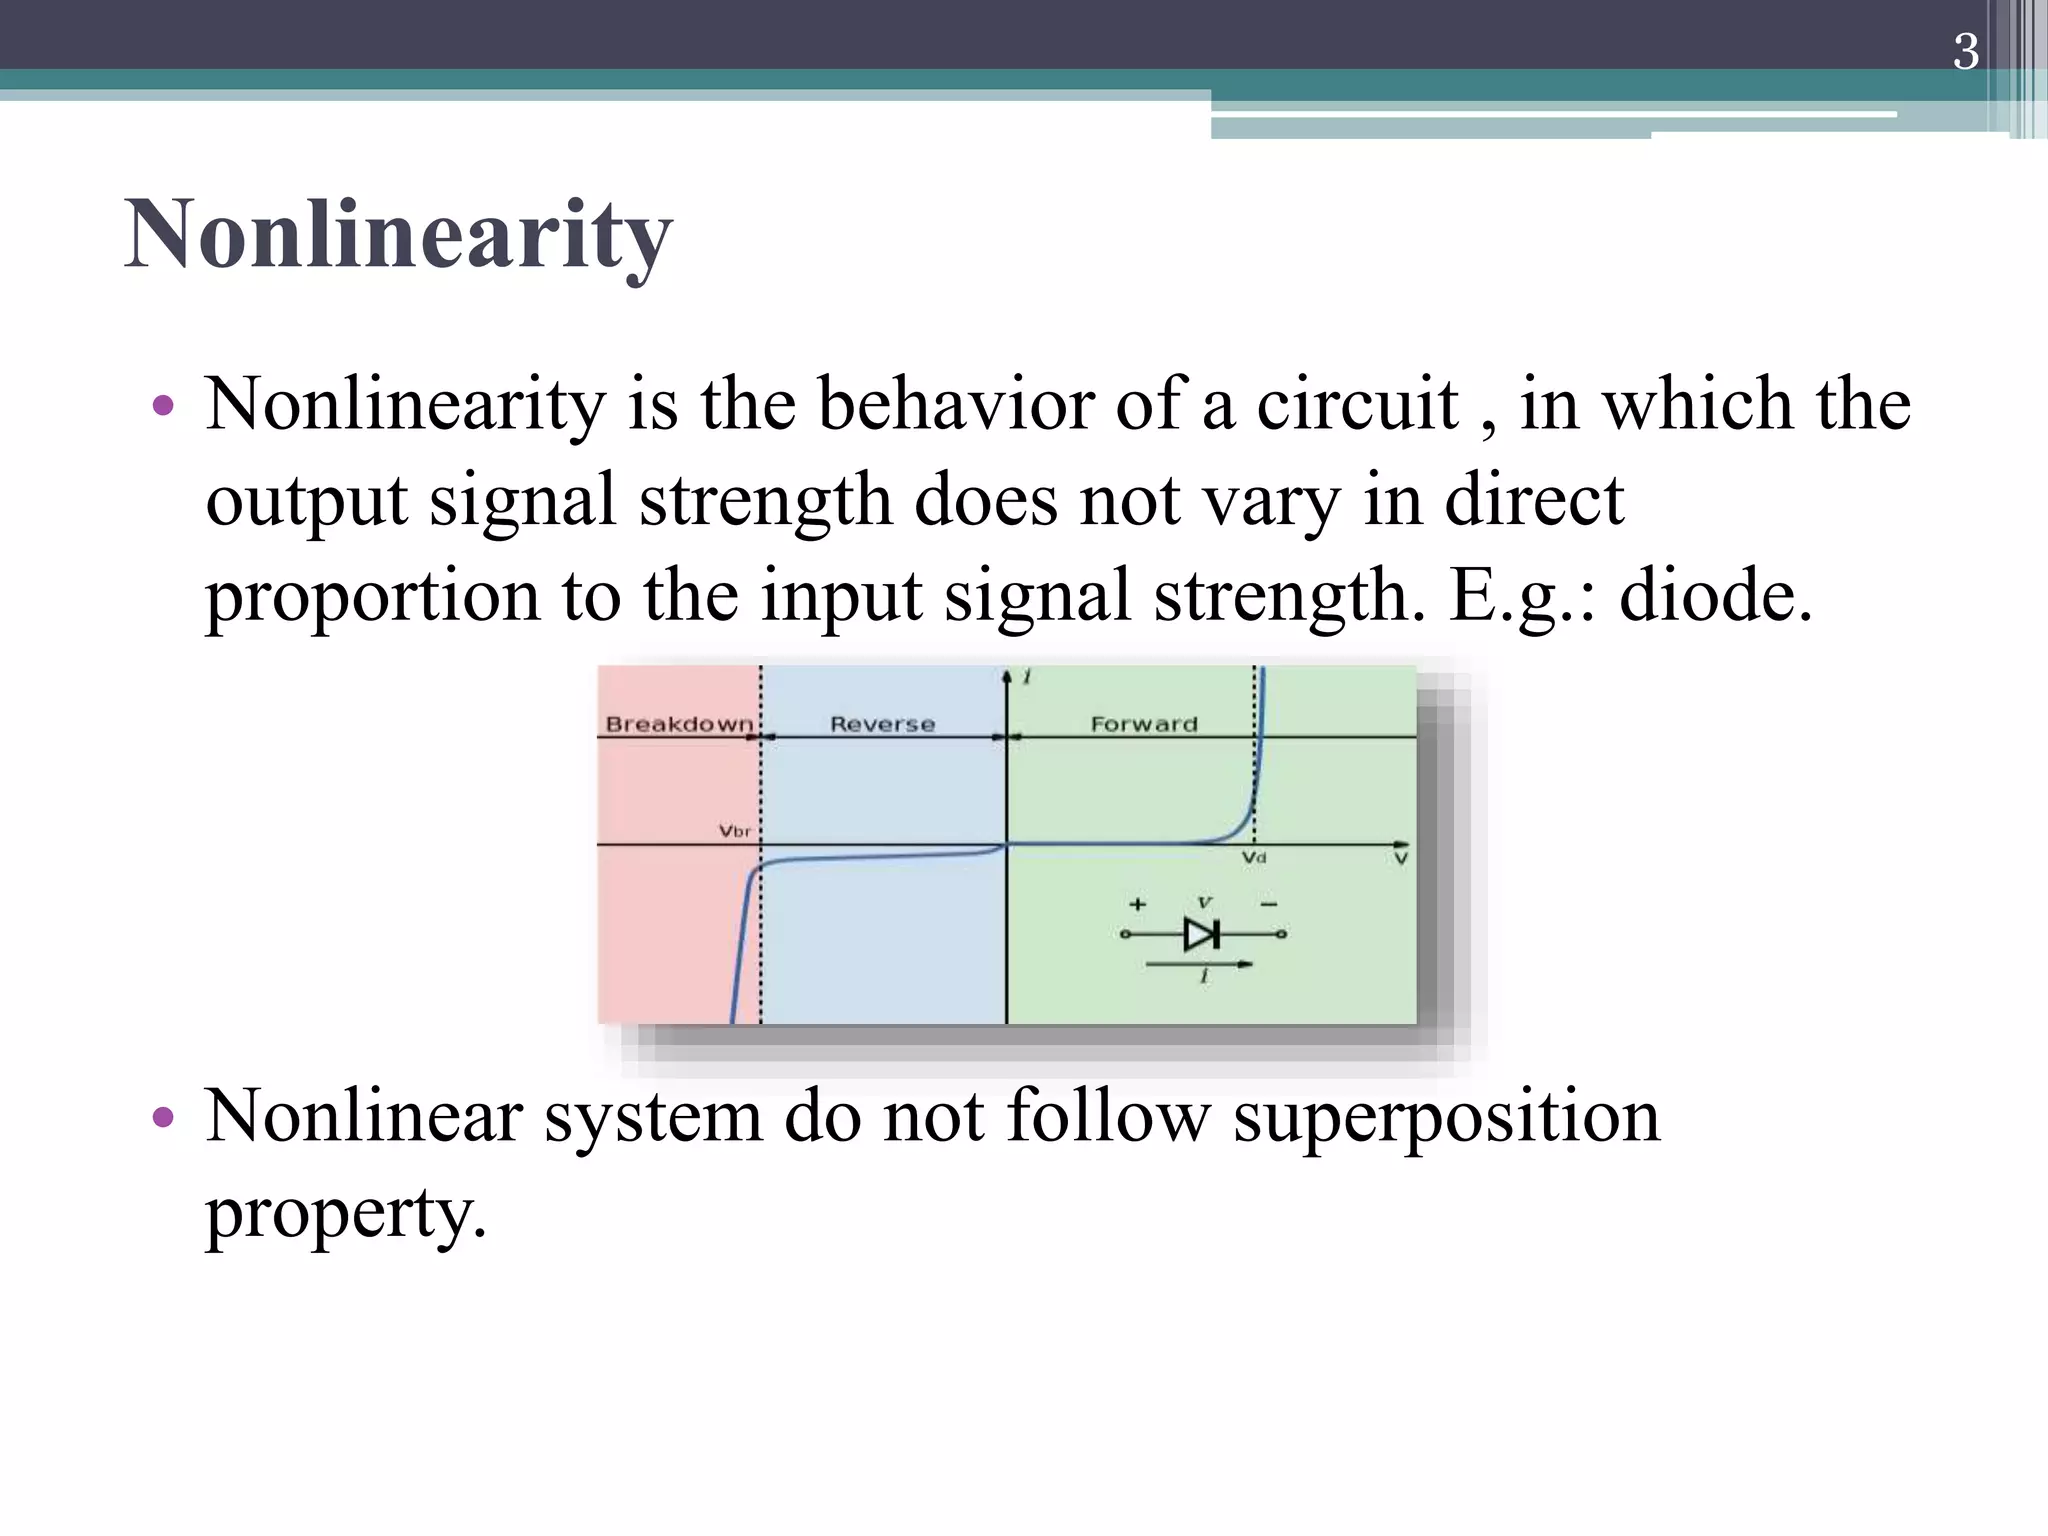
• Nonlinearity isthe behavior of a circuit , in which the
output signal strength does not vary in direct
proportion to the input signal strength. E.g.: diode.
• Nonlinear system do not follow superposition
property.
3
4.
Classification of Nonlinearities
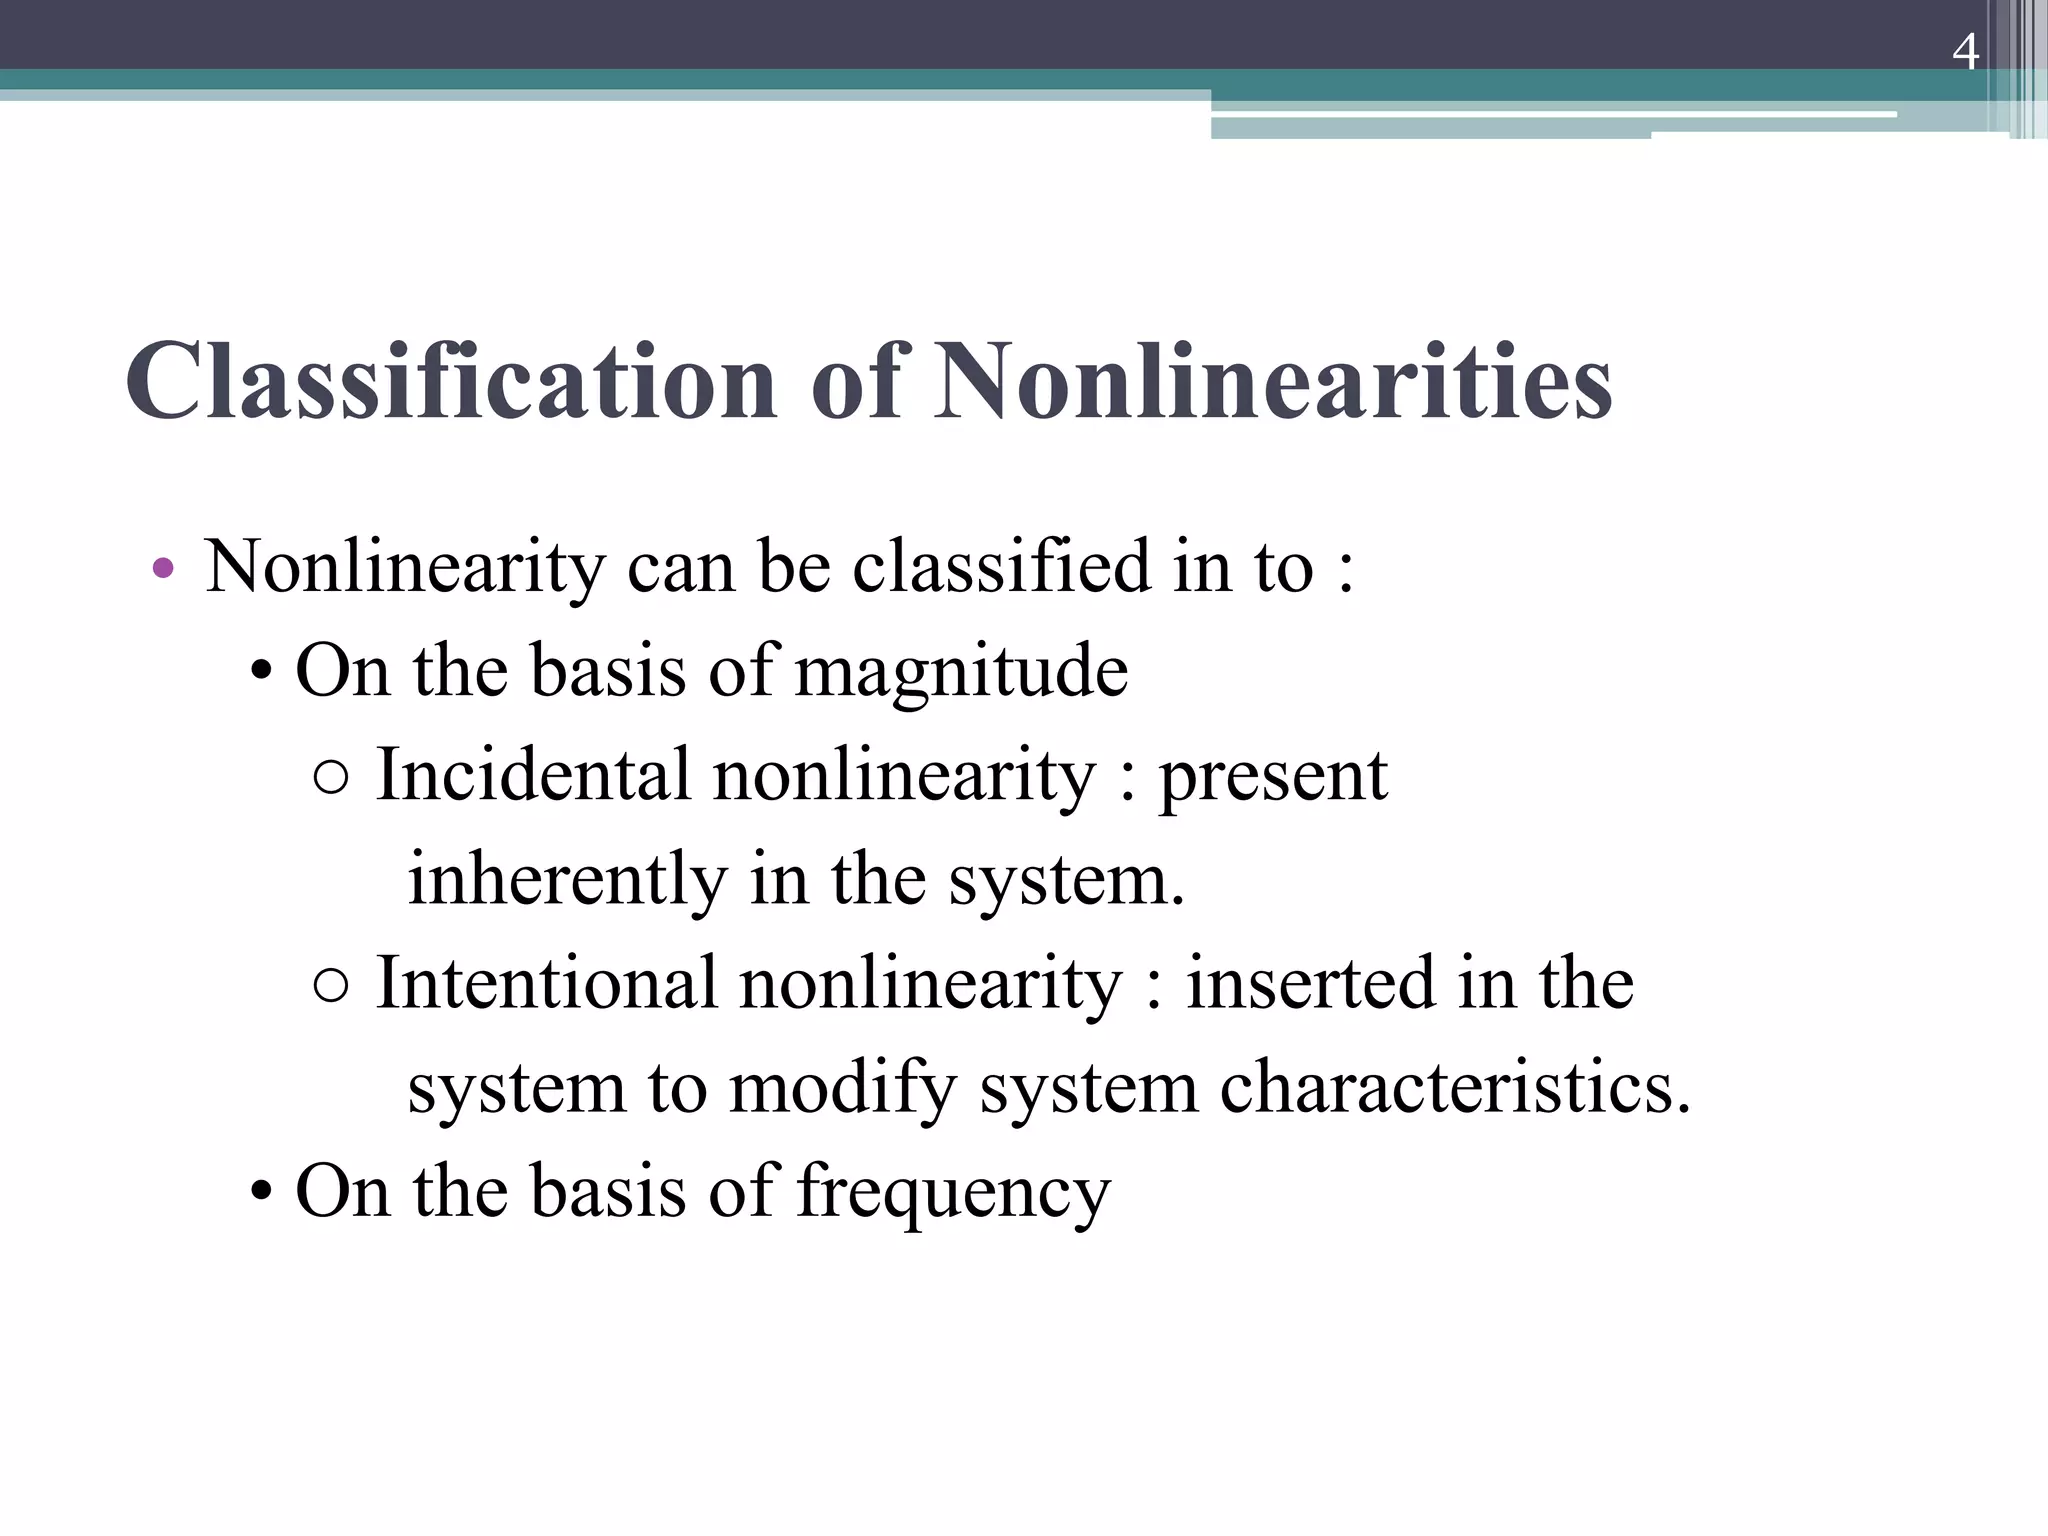
•Nonlinearity can be classified in to :
• On the basis of magnitude
○ Incidental nonlinearity : present
inherently in the system.
○ Intentional nonlinearity : inserted in the
system to modify system characteristics.
• On the basis of frequency
4
5.
On the basisof
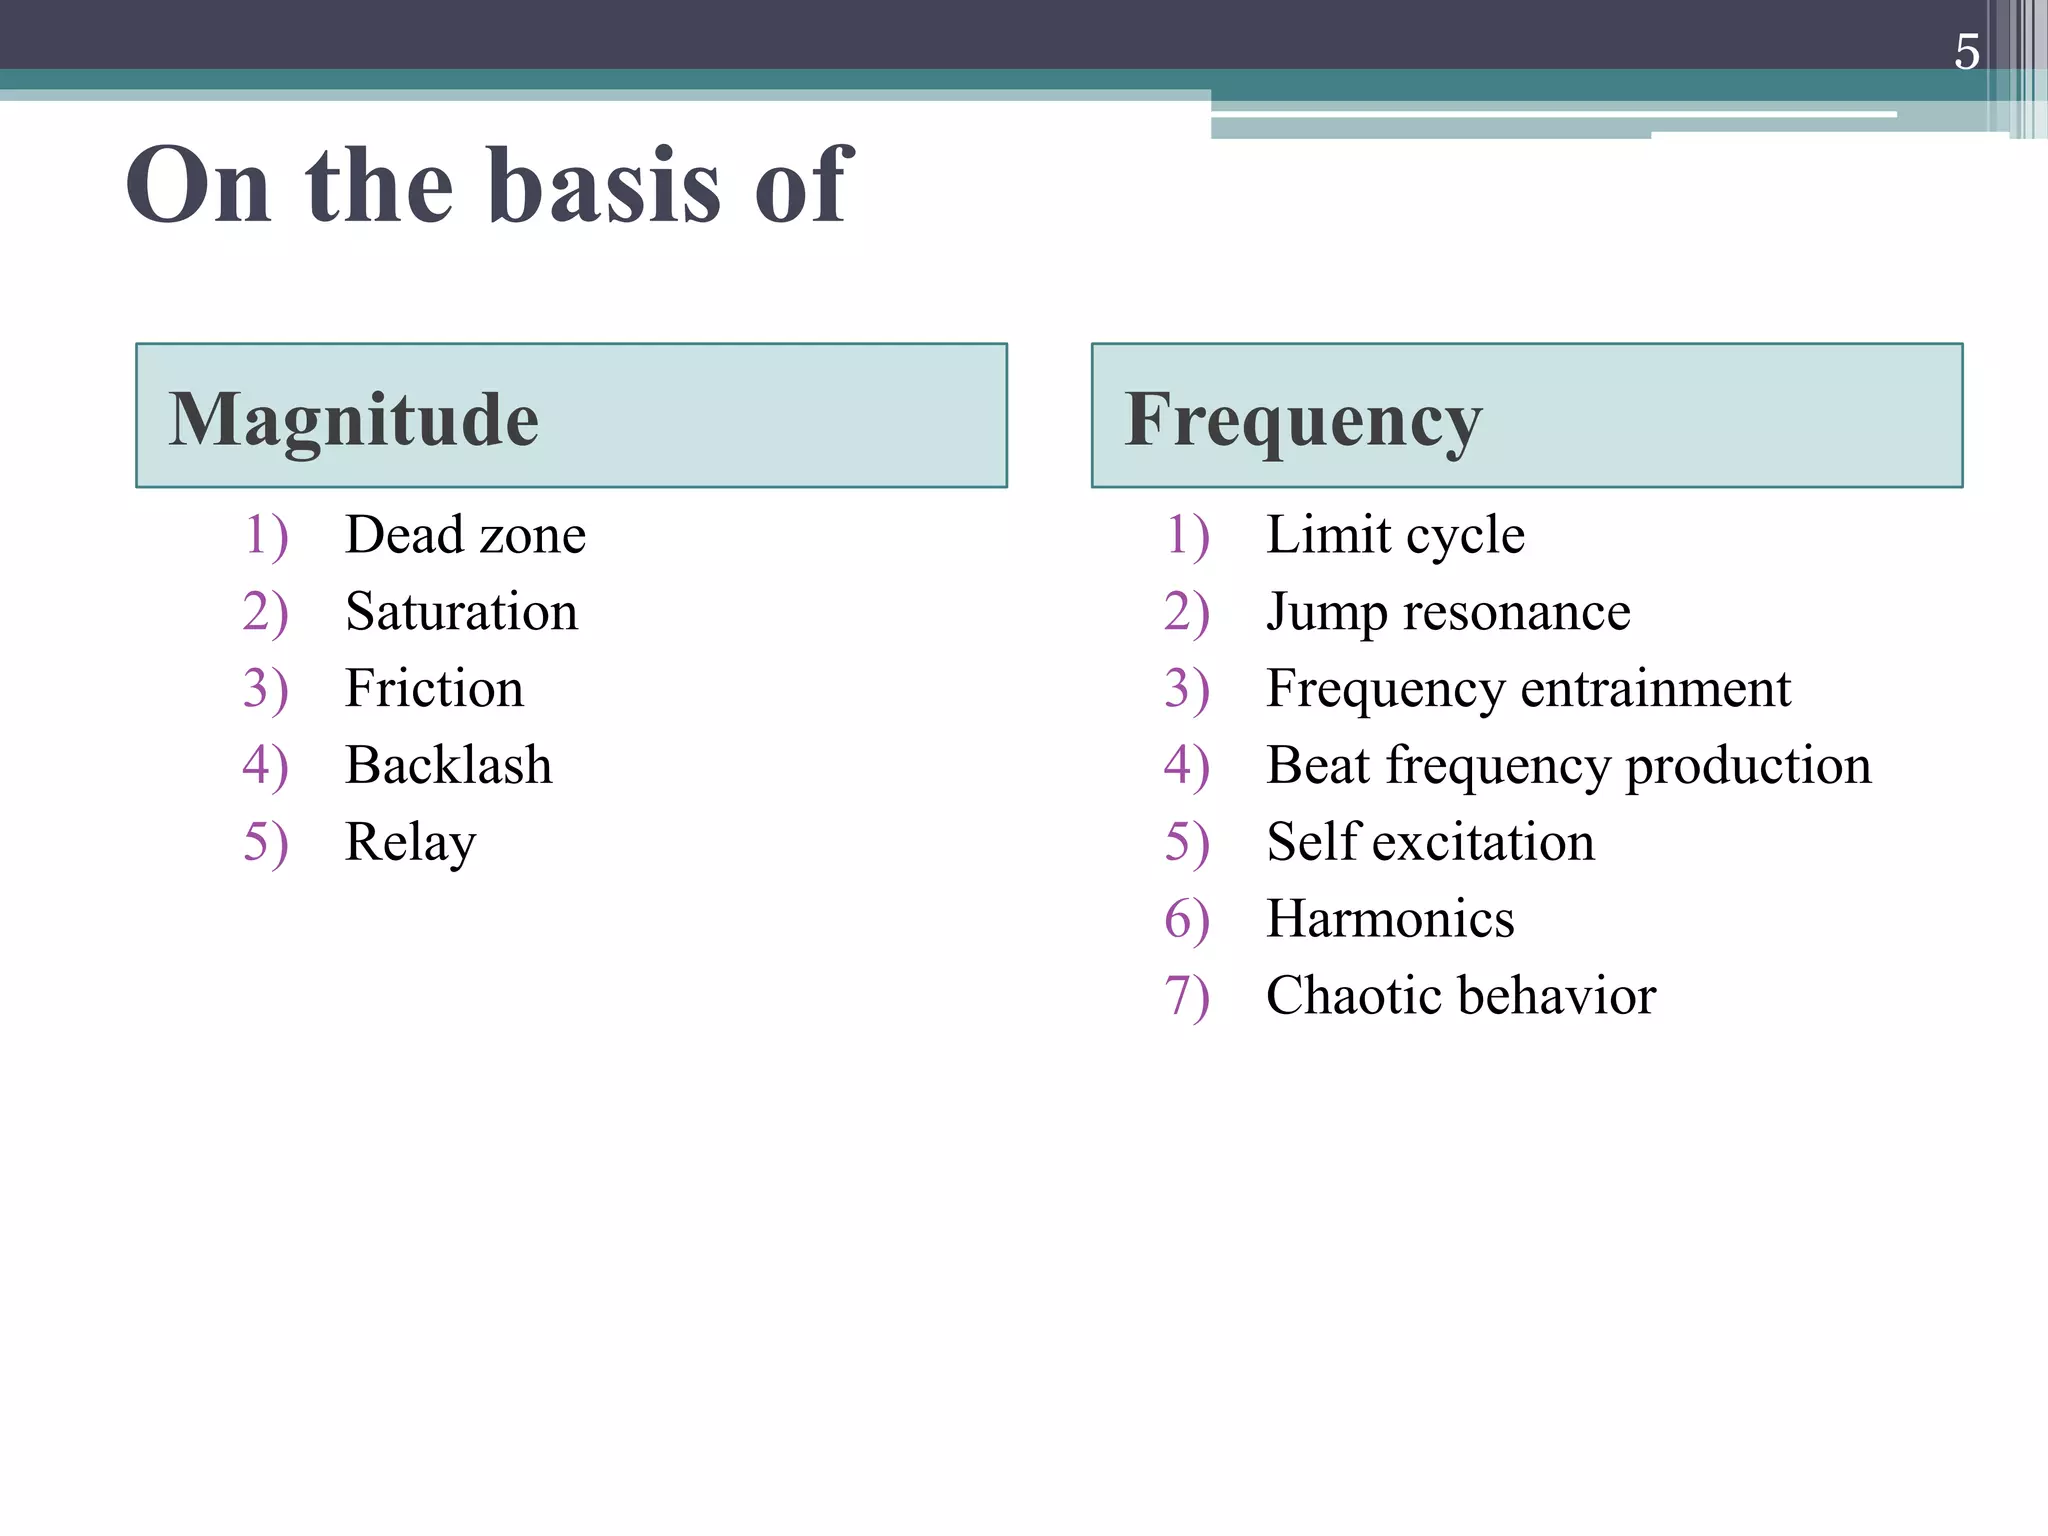
Magnitude Frequency
1) Dead zone
2) Saturation
3) Friction
4) Backlash
5) Relay
1) Limit cycle
2) Jump resonance
3) Frequency entrainment
4) Beat frequency production
5) Self excitation
6) Harmonics
7) Chaotic behavior
5
6.
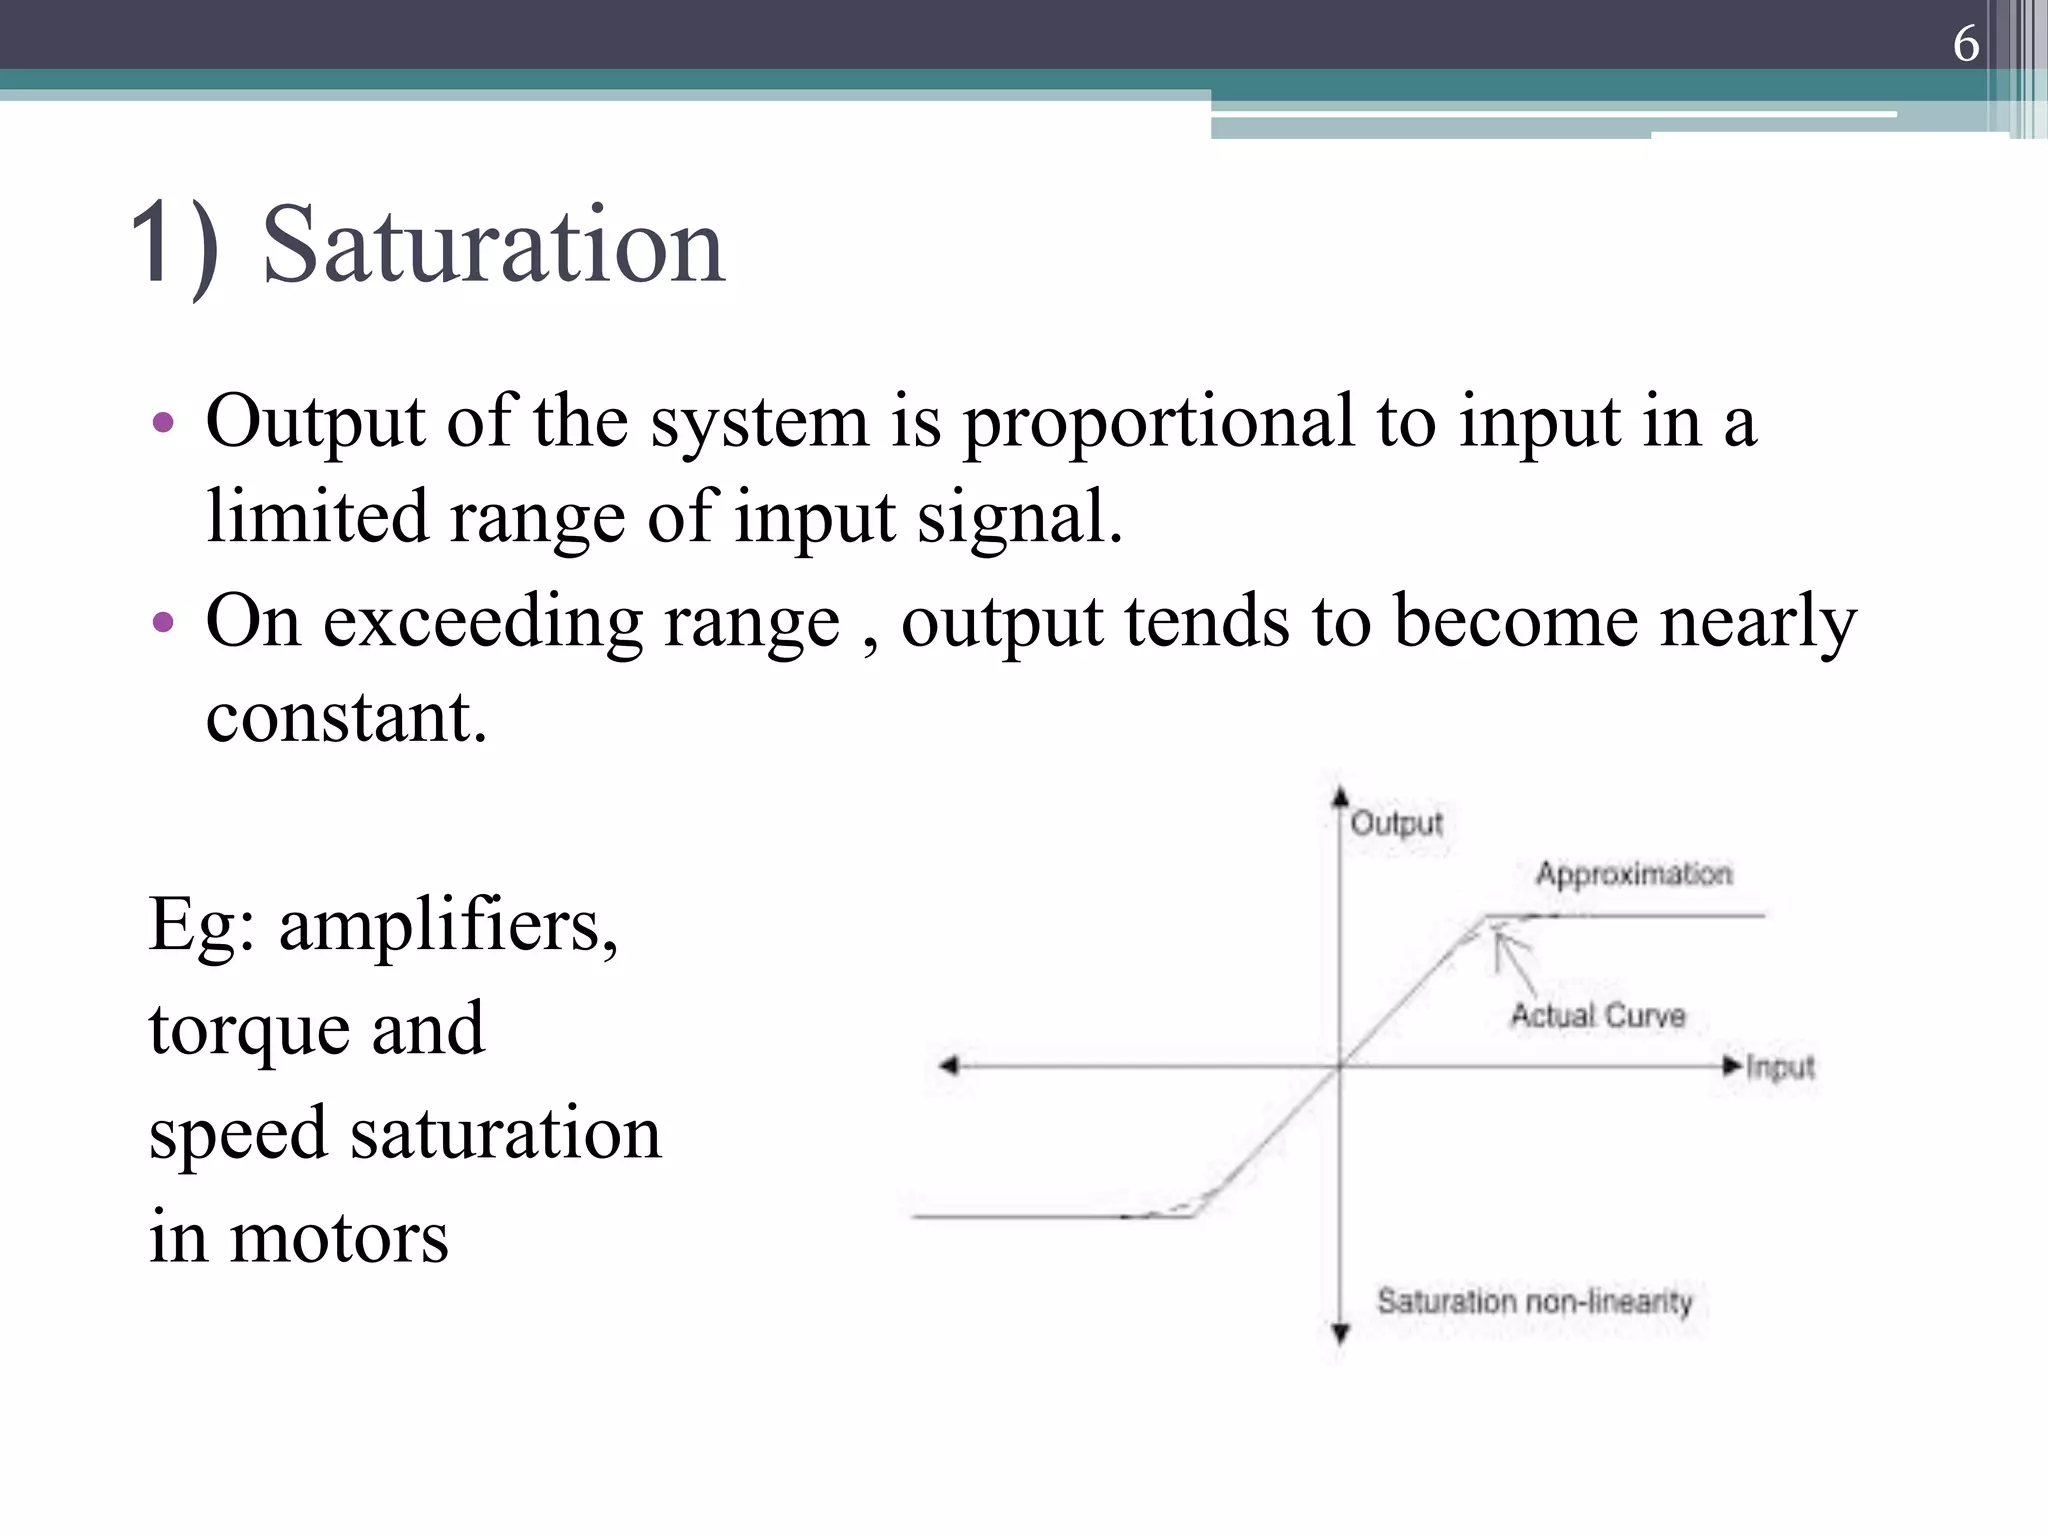
1) Saturation
• Outputof the system is proportional to input in a
limited range of input signal.
• On exceeding range , output tends to become nearly
constant.
Eg: amplifiers,
torque and
speed saturation
in motors
6
7.
• Limits max.achievable magnetic field in system
containing electromagnetic components
• In electronic circuits ferromagnetic core inductor- on
applying AC signal , nonlinearity can cause harmonics
and intermodulation distortion so we have to limit the
level of signal accordingly.
• Used to limit the current in saturable core transformer,
arc welding and ferroresonant transformer which serve
as voltage regulator.
7
8.
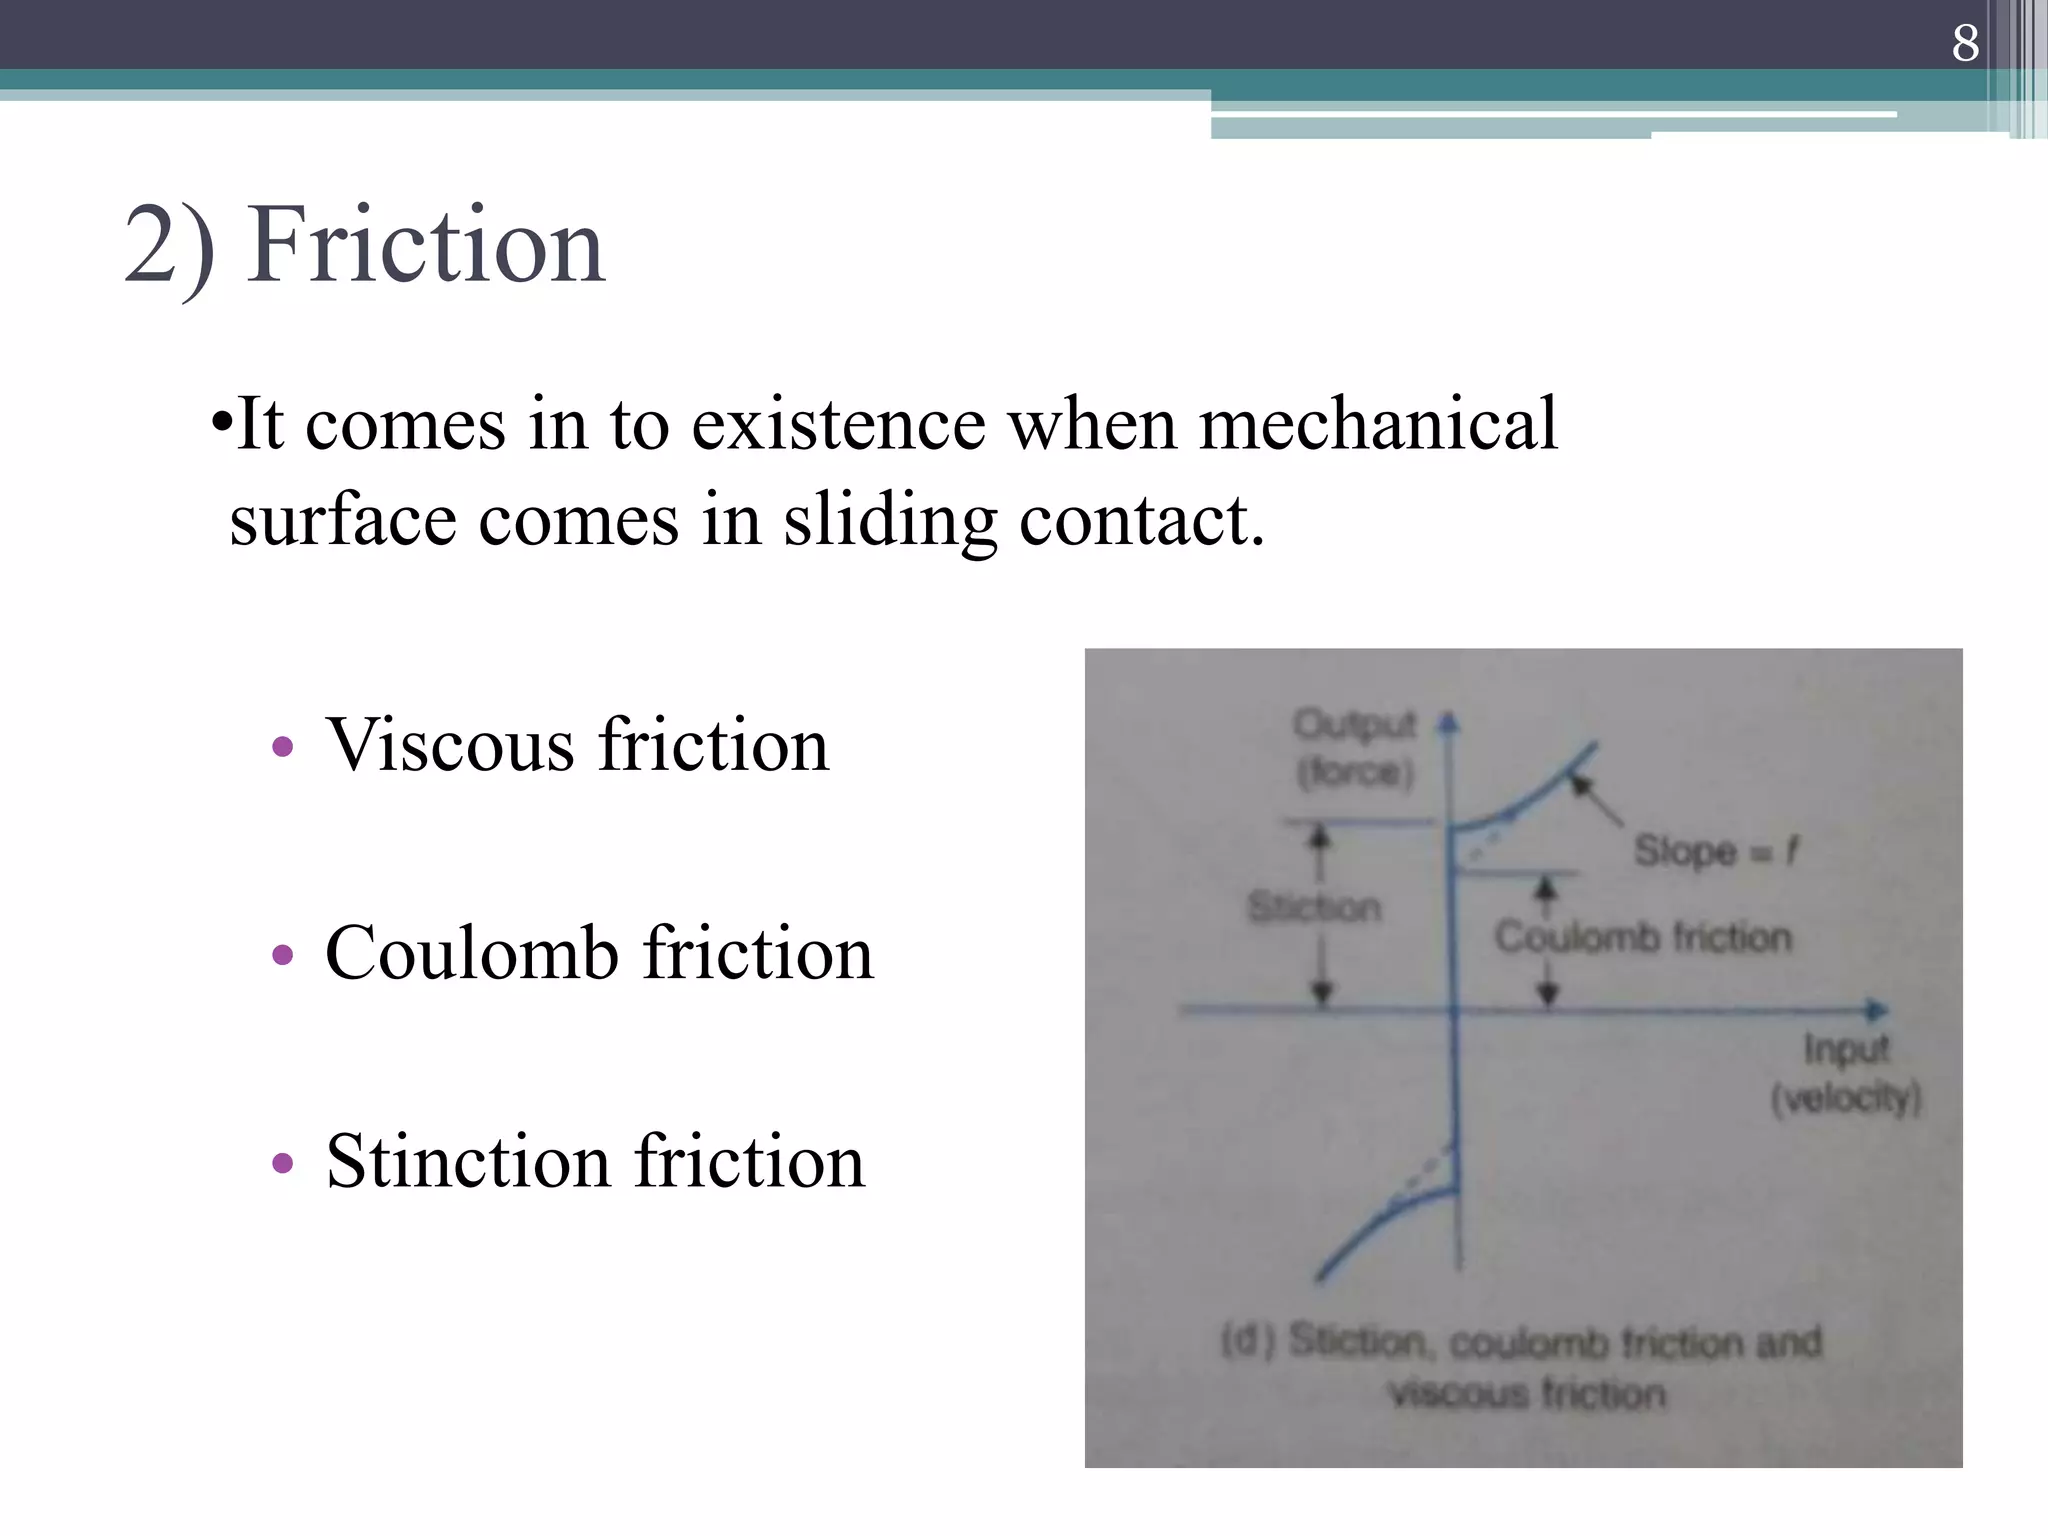
2) Friction
• Viscousfriction
• Coulomb friction
• Stinction friction
8
•It comes in to existence when mechanical
surface comes in sliding contact.
9.
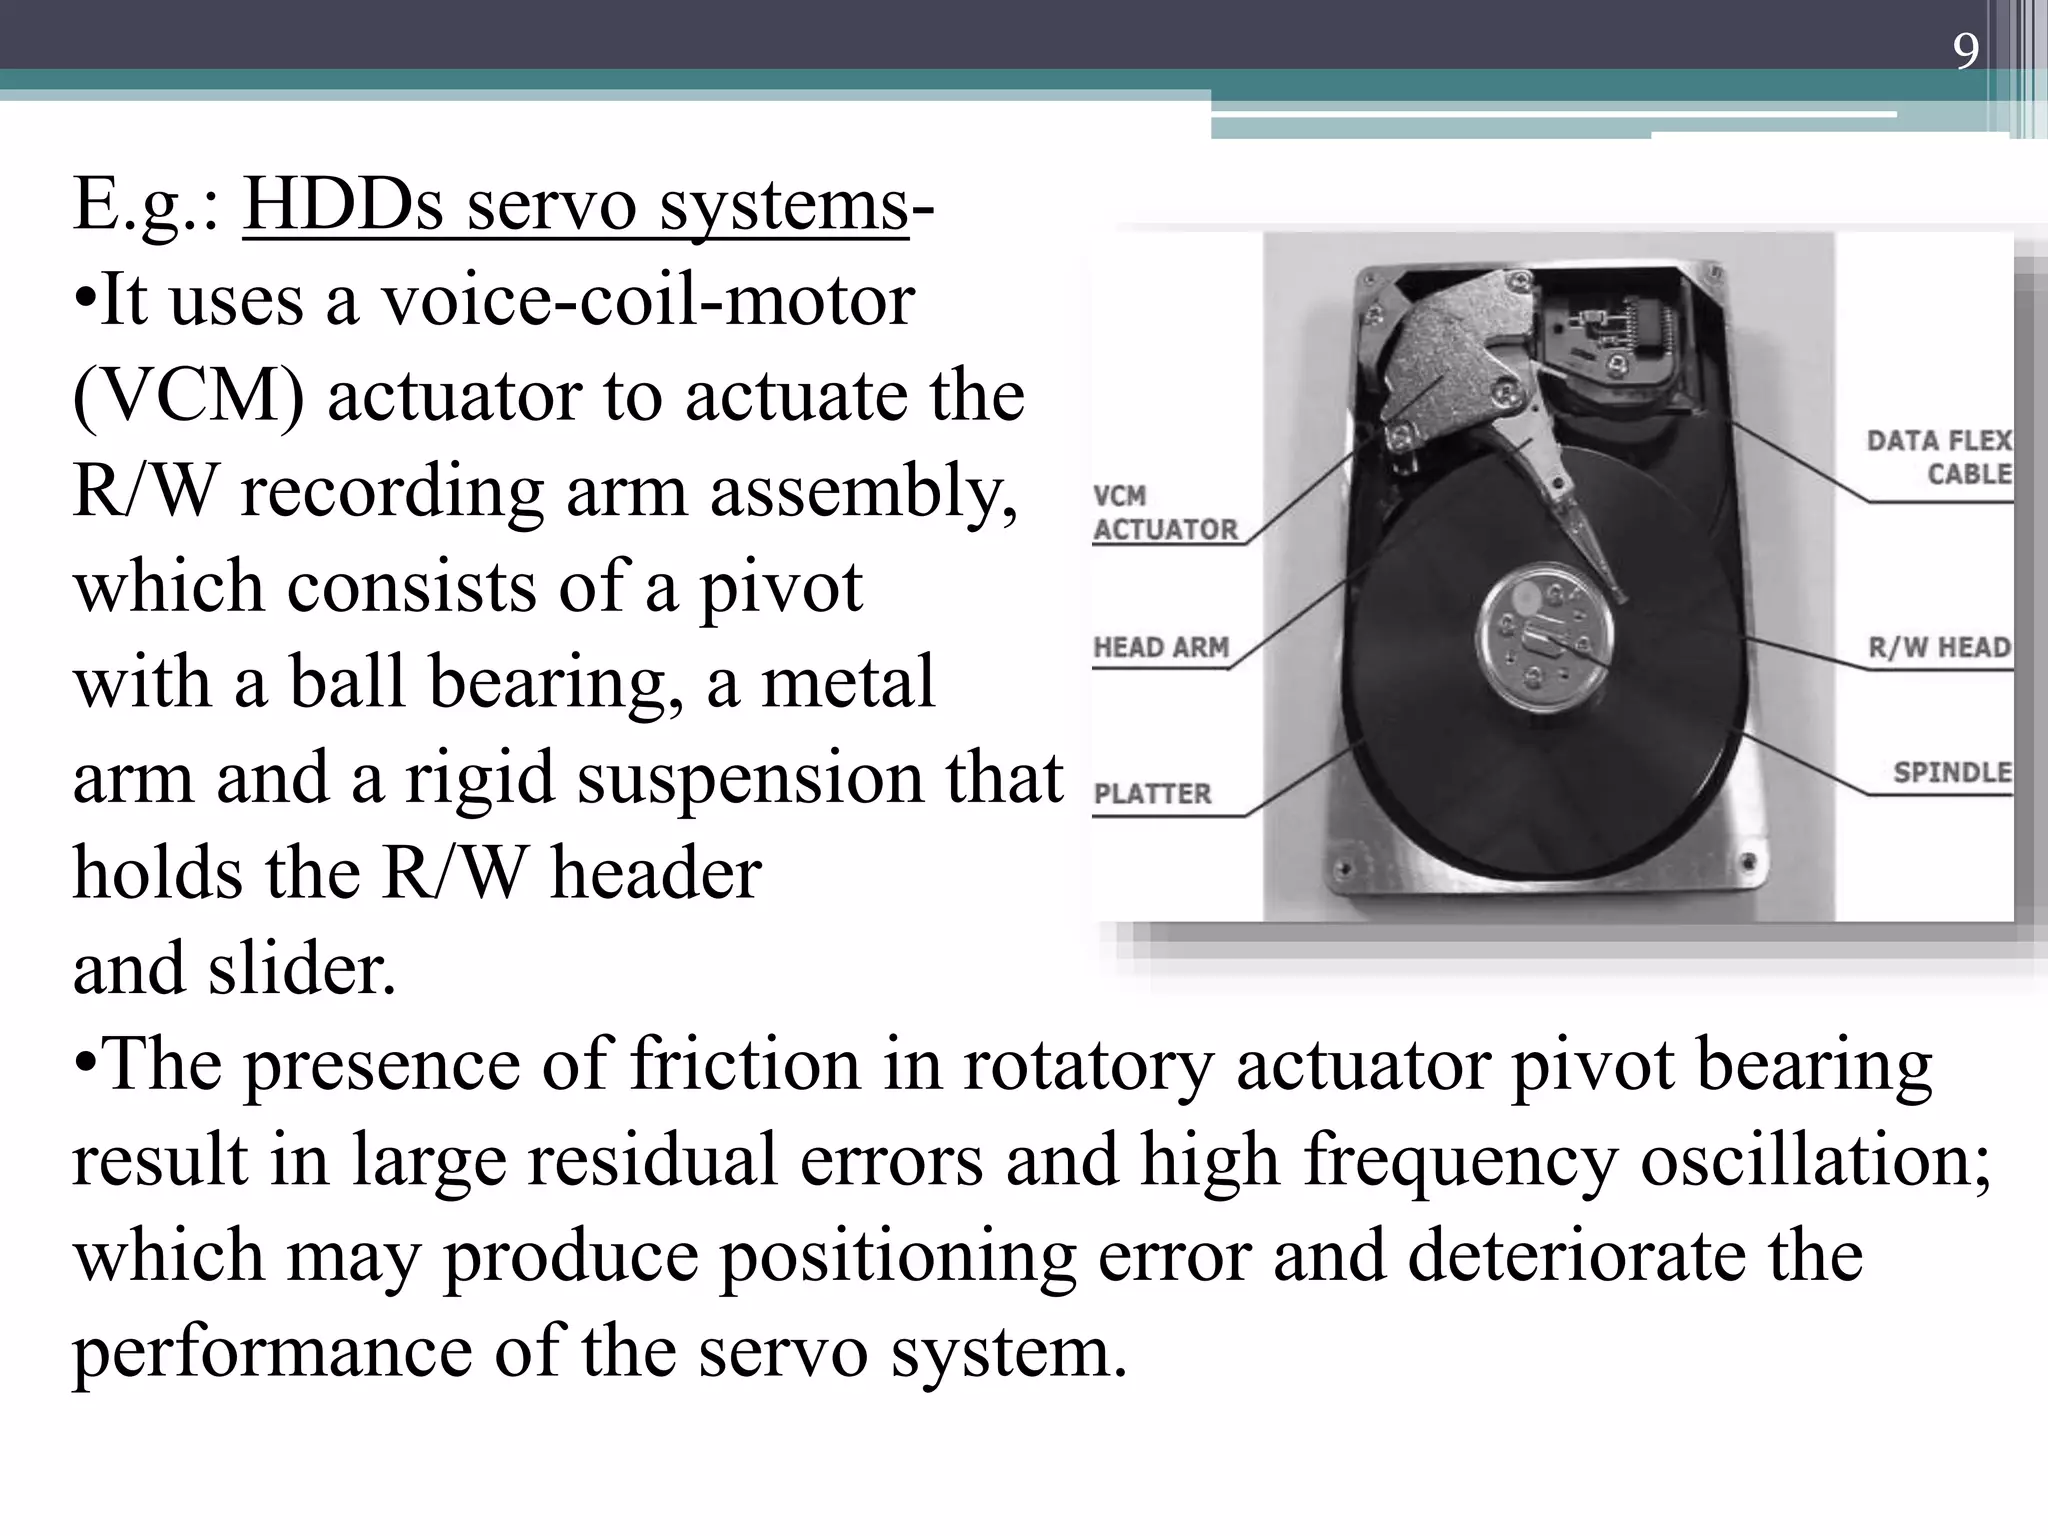
E.g.: HDDs servosystems-
•It uses a voice-coil-motor
(VCM) actuator to actuate the
R/W recording arm assembly,
which consists of a pivot
with a ball bearing, a metal
arm and a rigid suspension that
holds the R/W header
and slider.
•The presence of friction in rotatory actuator pivot bearing
result in large residual errors and high frequency oscillation;
which may produce positioning error and deteriorate the
performance of the servo system.
9
10.
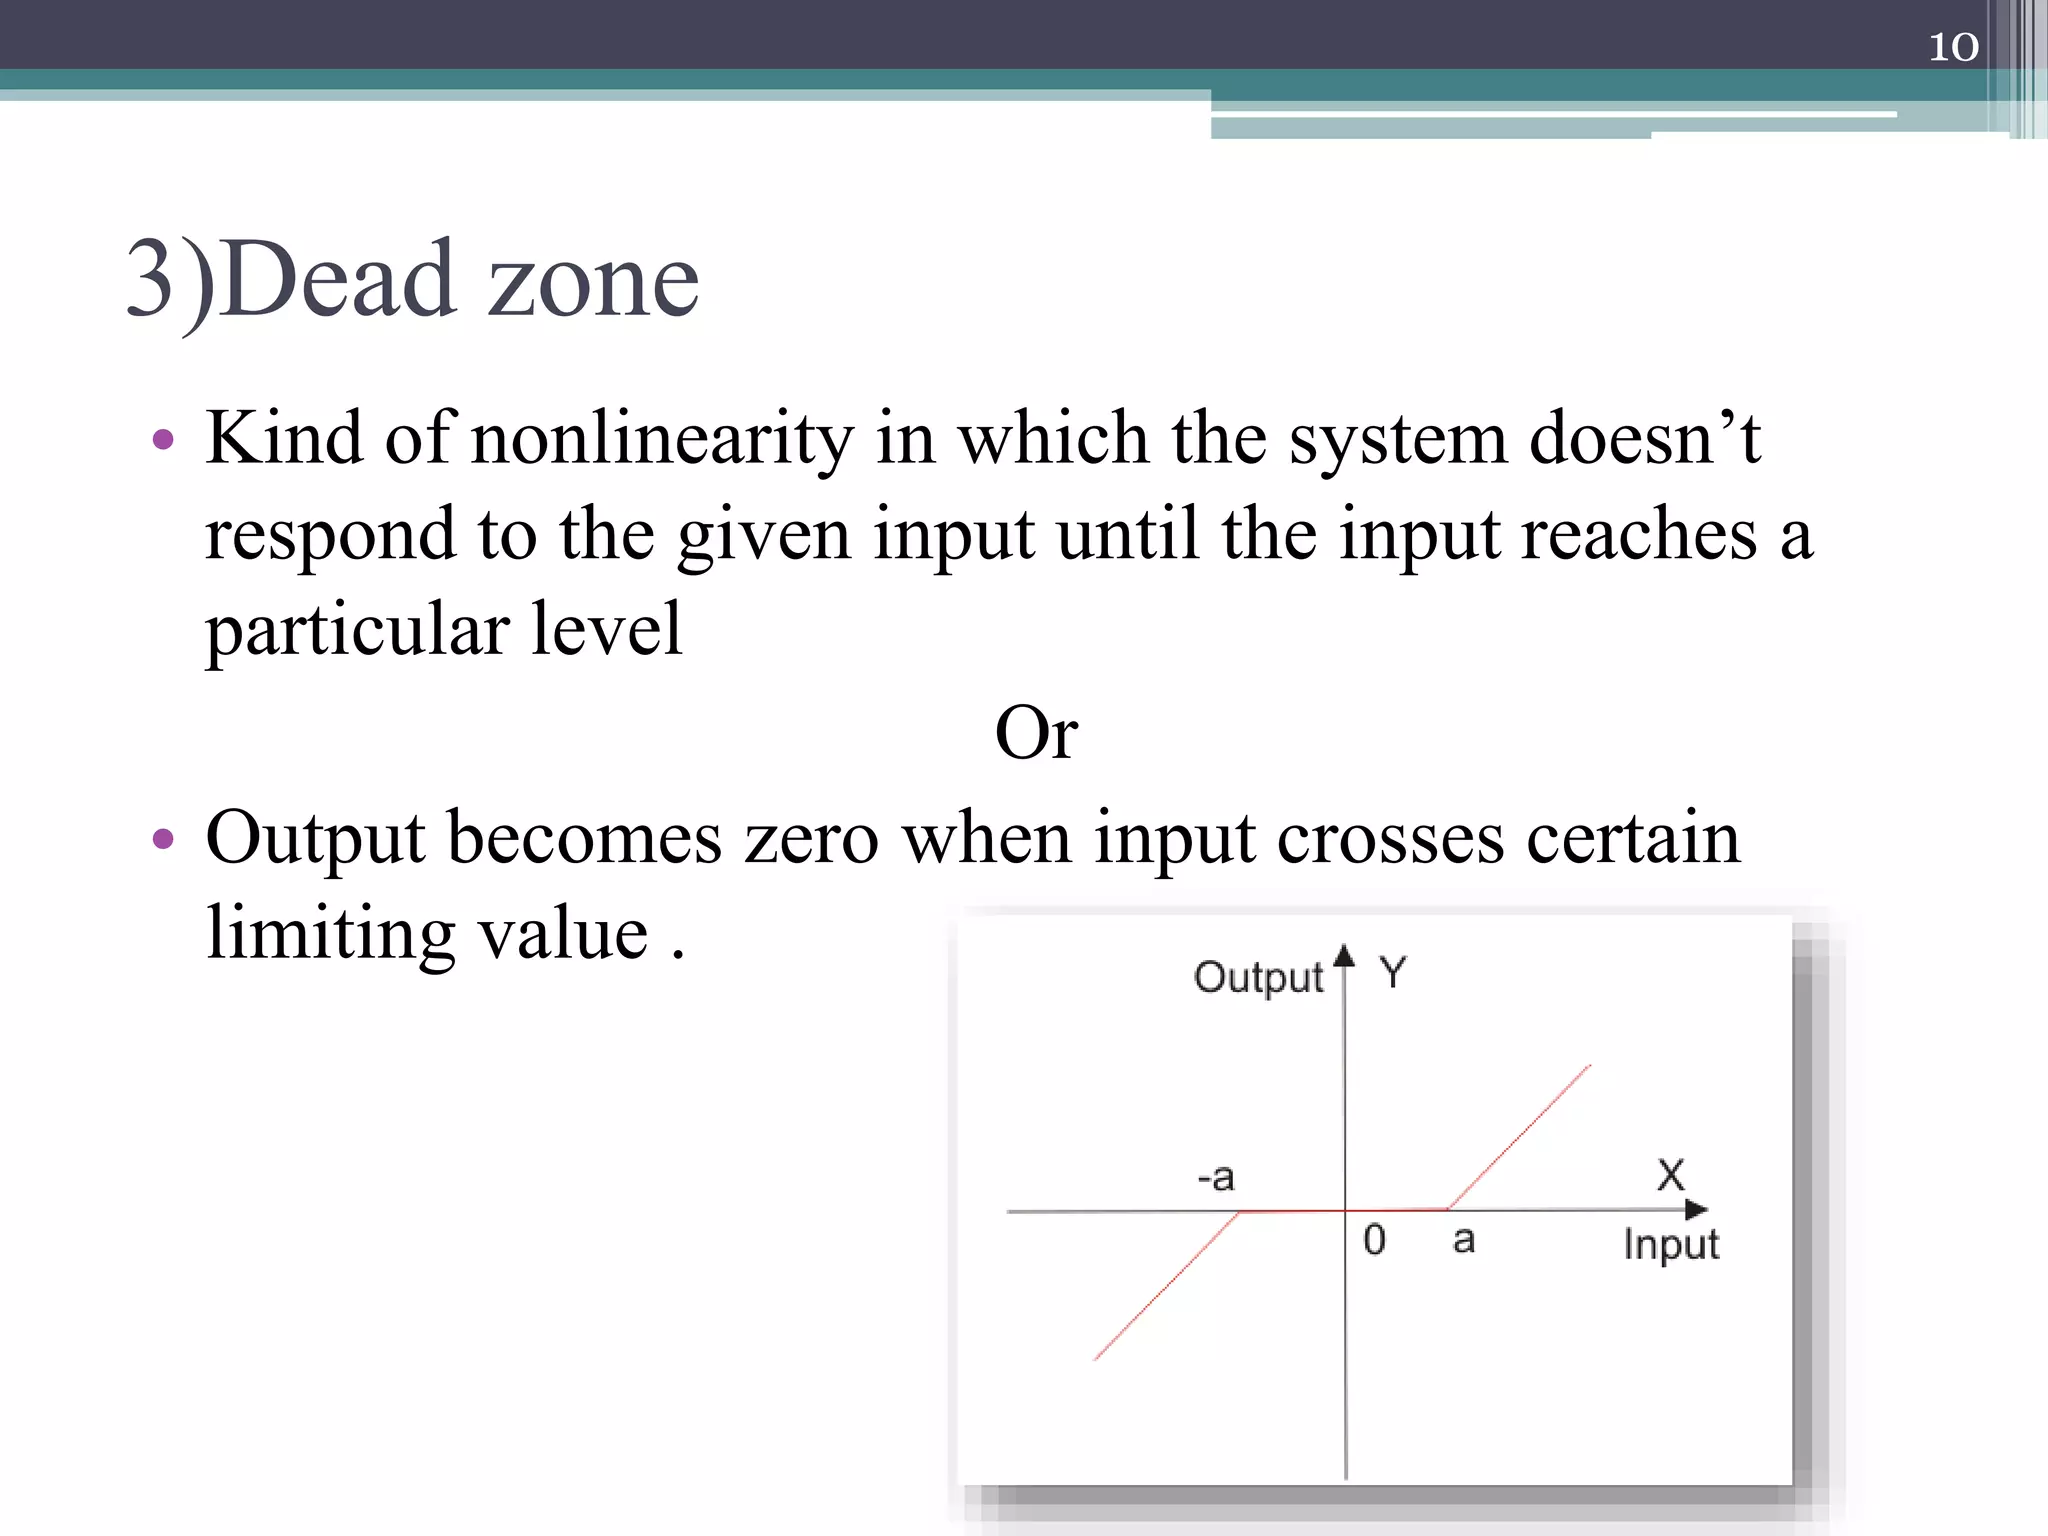
3)Dead zone
• Kindof nonlinearity in which the system doesn’t
respond to the given input until the input reaches a
particular level
Or
• Output becomes zero when input crosses certain
limiting value .
10
11.
• Effect ofdead zone:
• system performance degradation
• reduced positioning accuracy
• may destabilize system
• E.g.:
• Dead zone in actuators, such as hydraulic servo
valves, give rise to limit cycle and instability.
• Electronic devices like diode.
11
12.
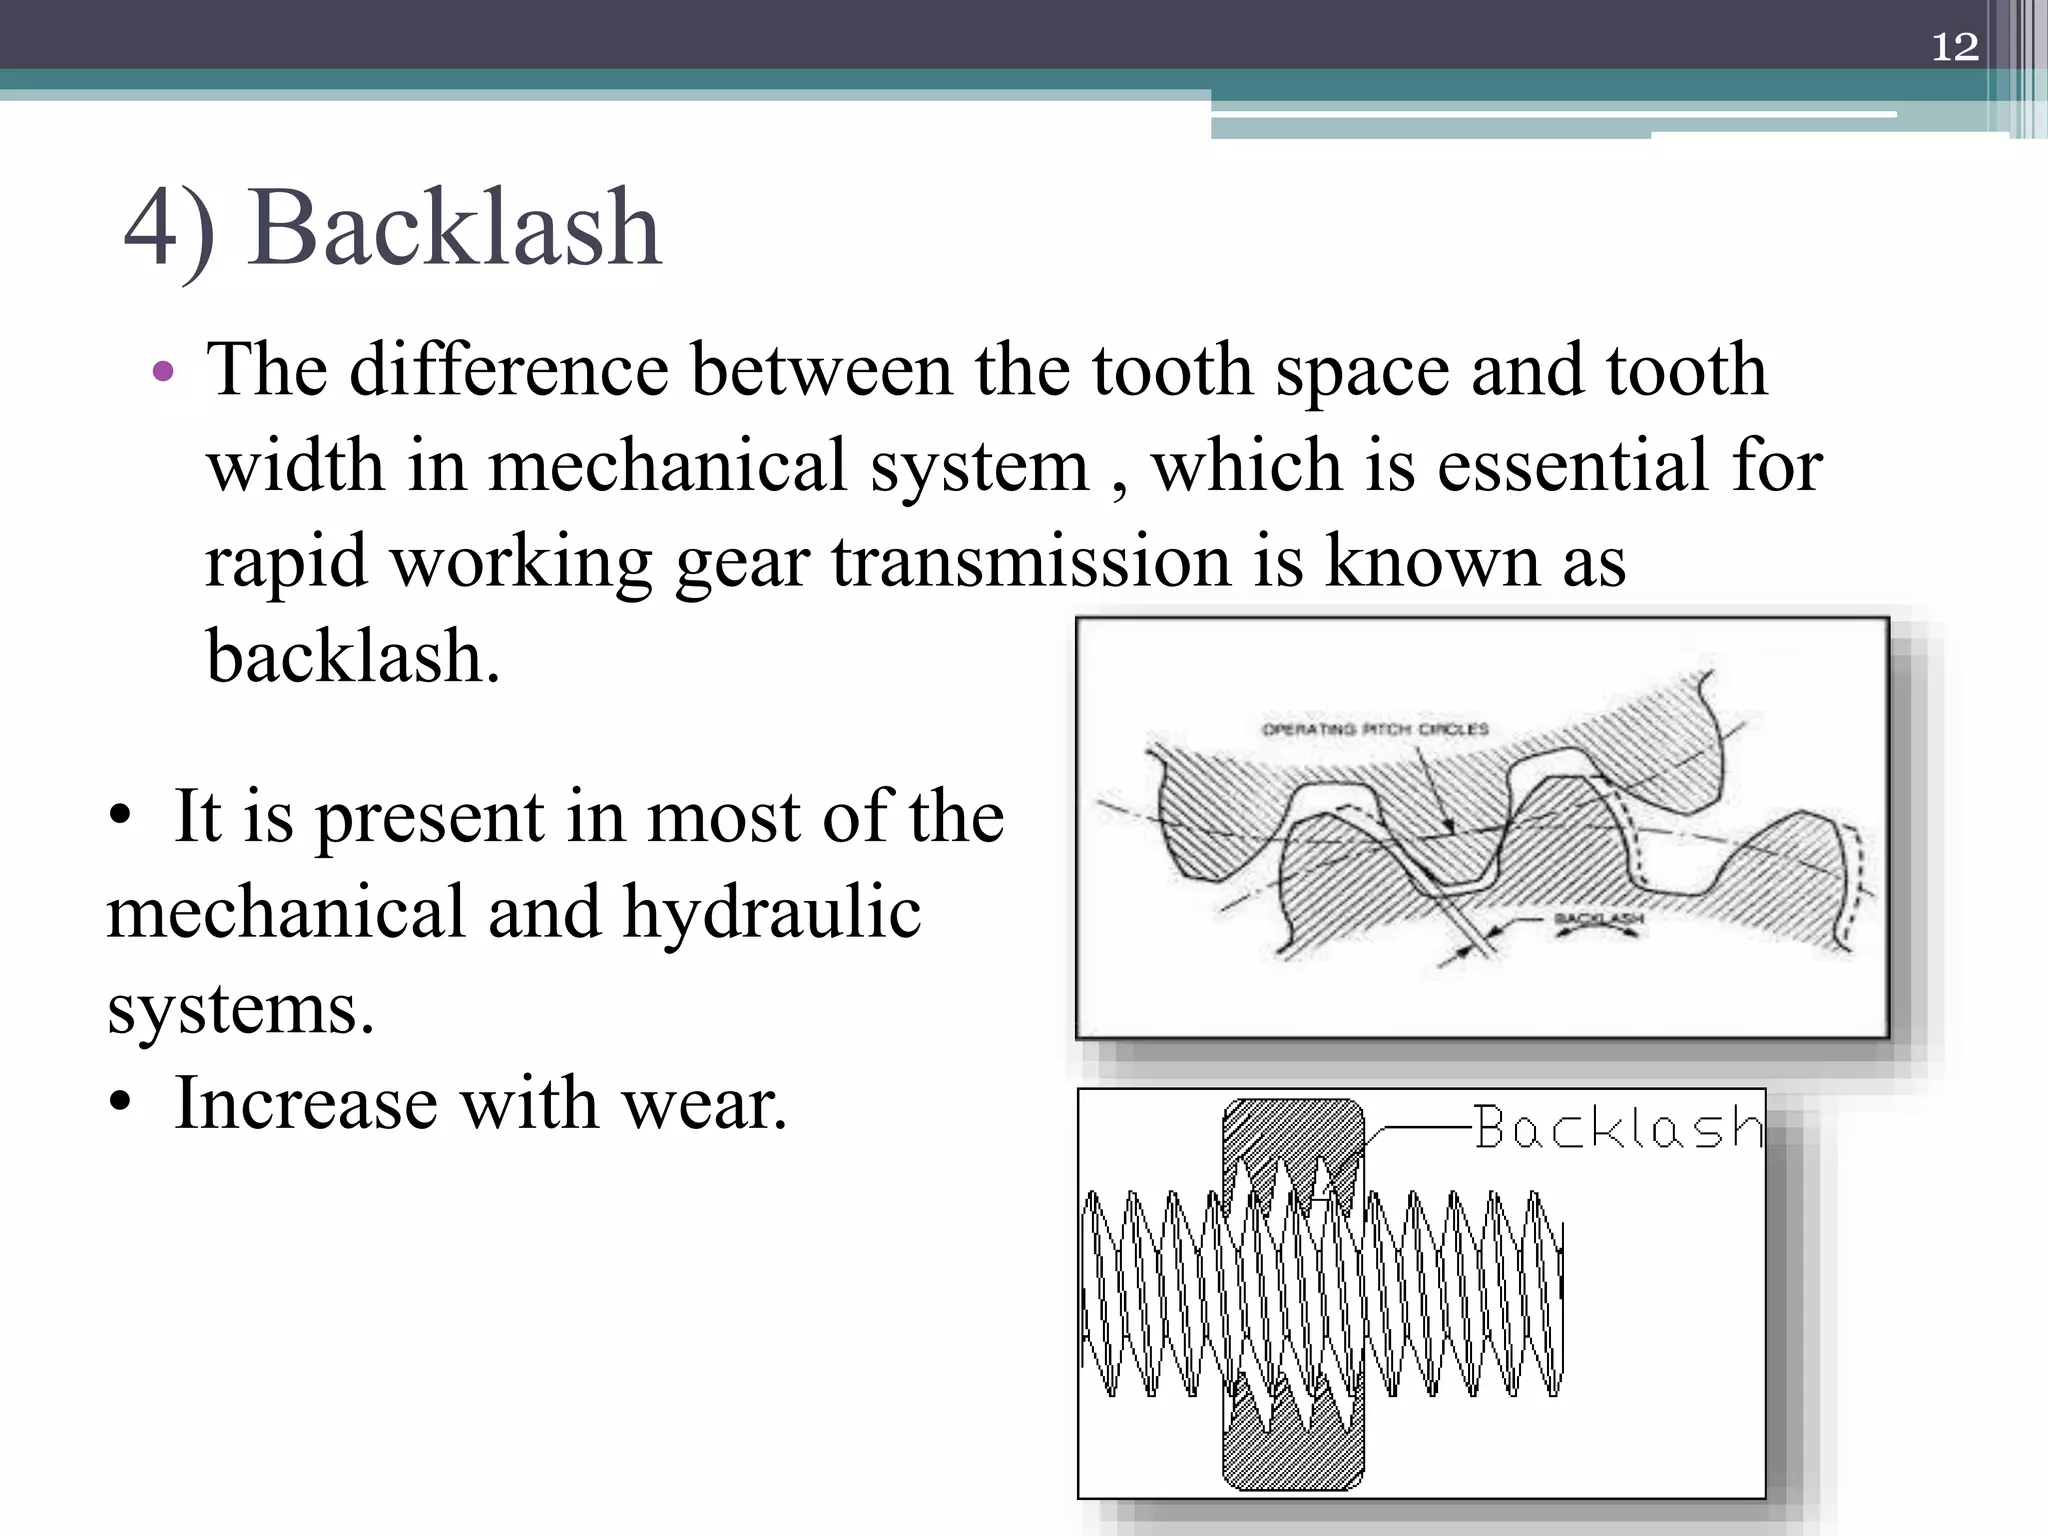
4) Backlash
• Thedifference between the tooth space and tooth
width in mechanical system , which is essential for
rapid working gear transmission is known as
backlash.
12
• It is present in most of the
mechanical and hydraulic
systems.
• Increase with wear.
13.
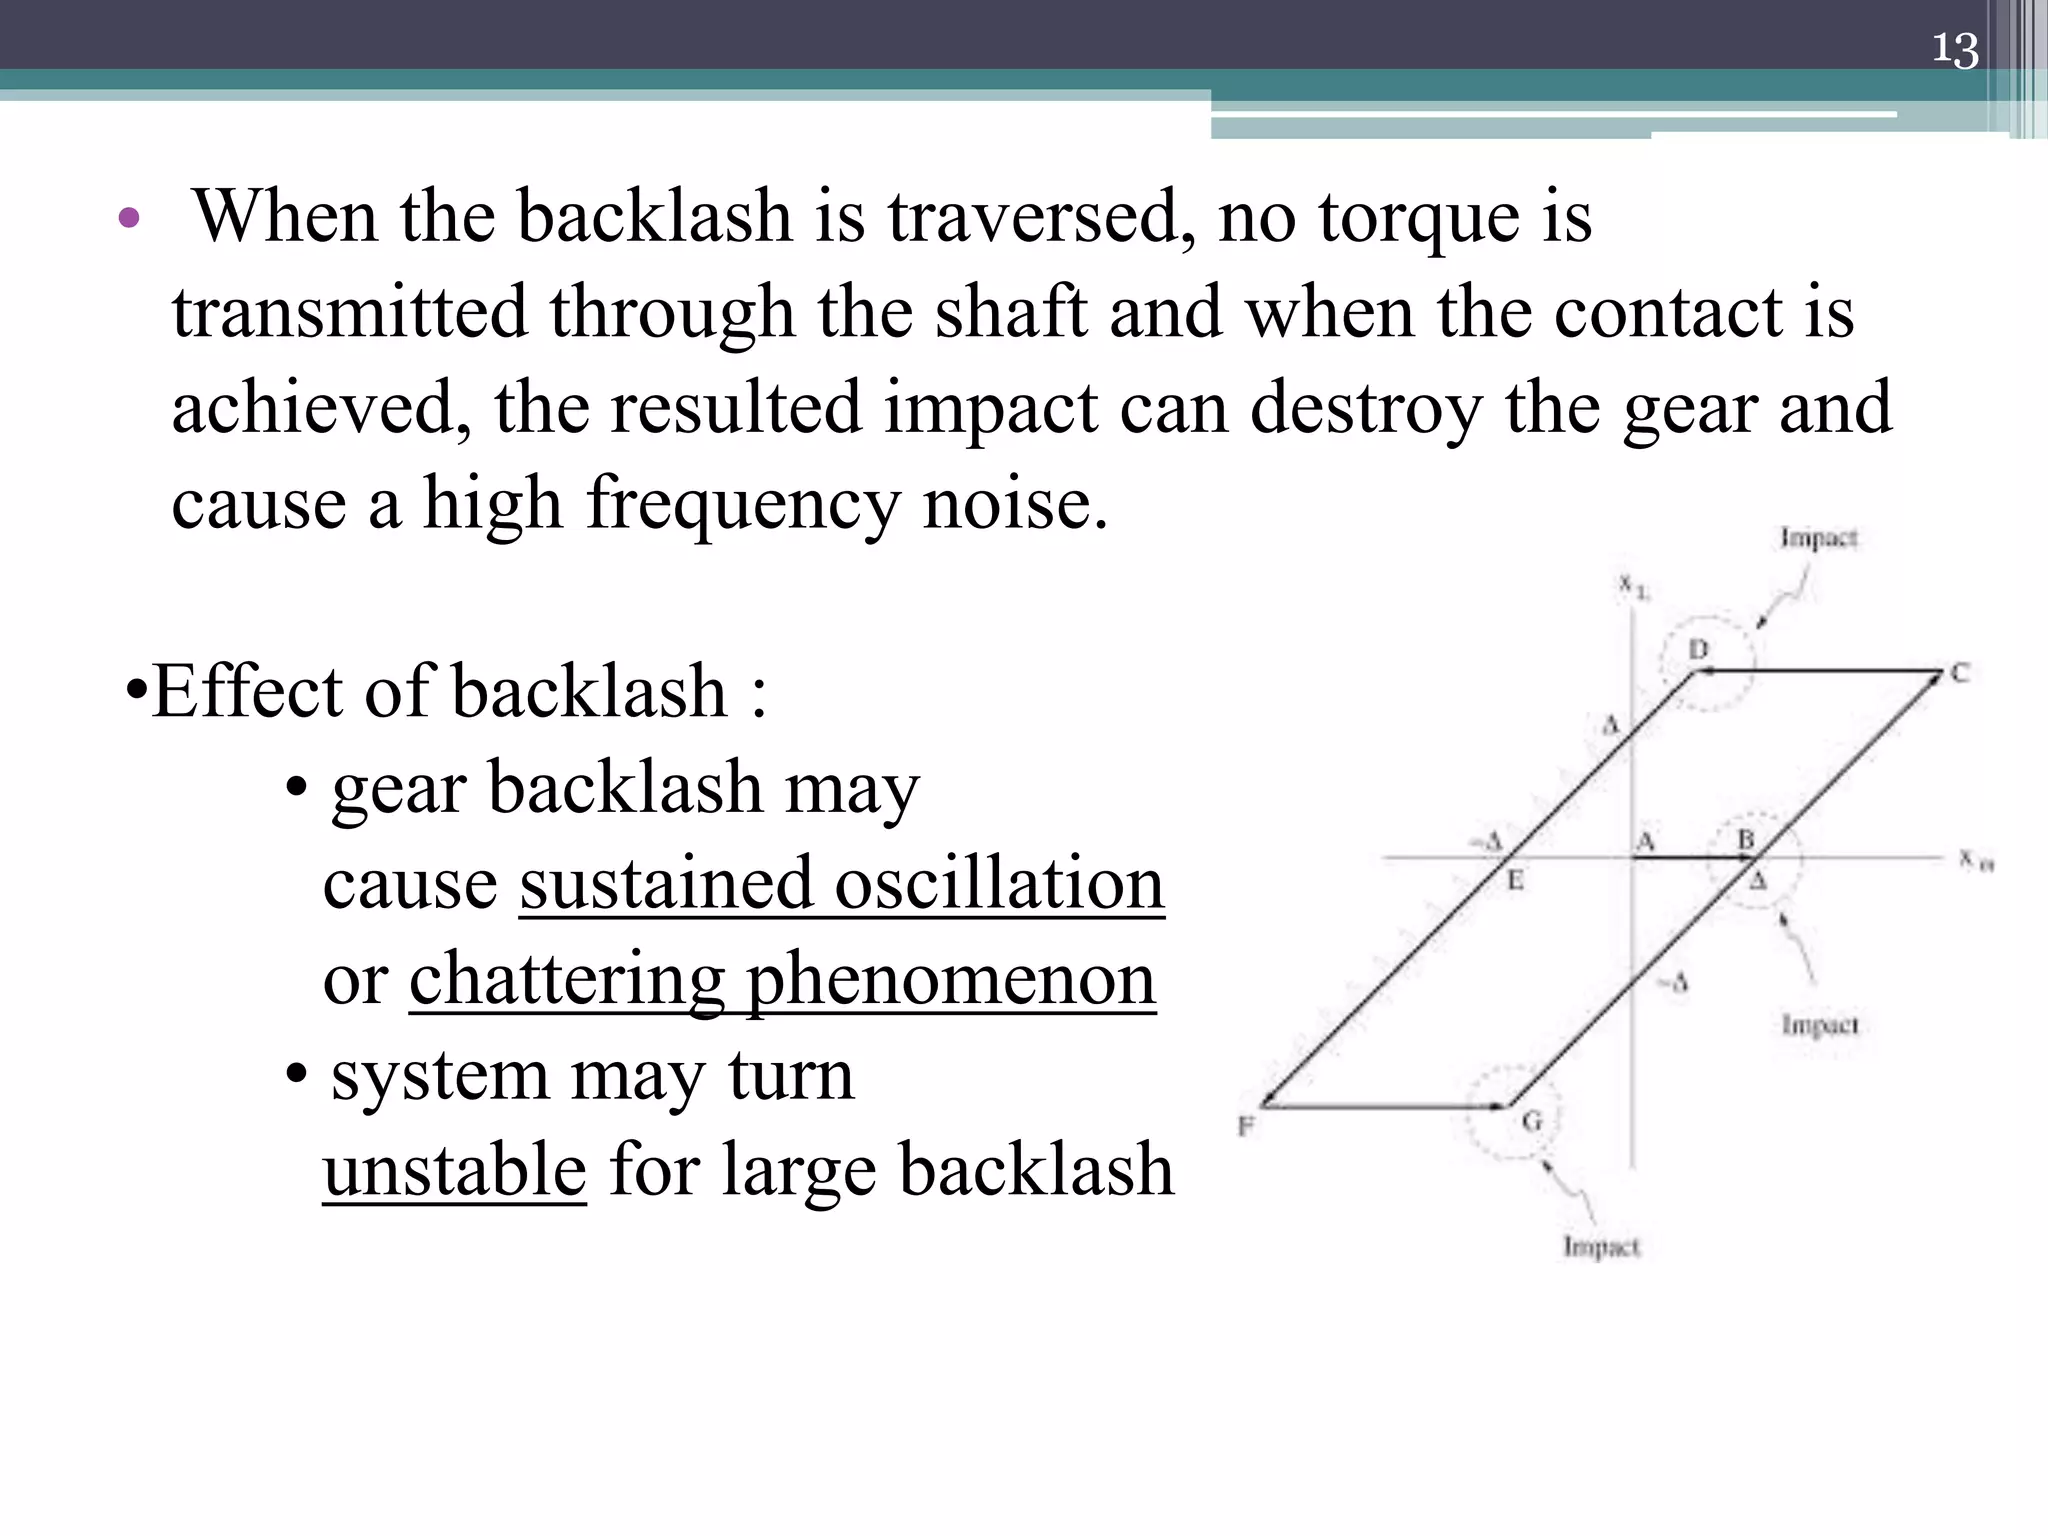
• When thebacklash is traversed, no torque is
transmitted through the shaft and when the contact is
achieved, the resulted impact can destroy the gear and
cause a high frequency noise.
13
•Effect of backlash :
• gear backlash may
cause sustained oscillation
or chattering phenomenon
• system may turn
unstable for large backlash
14.
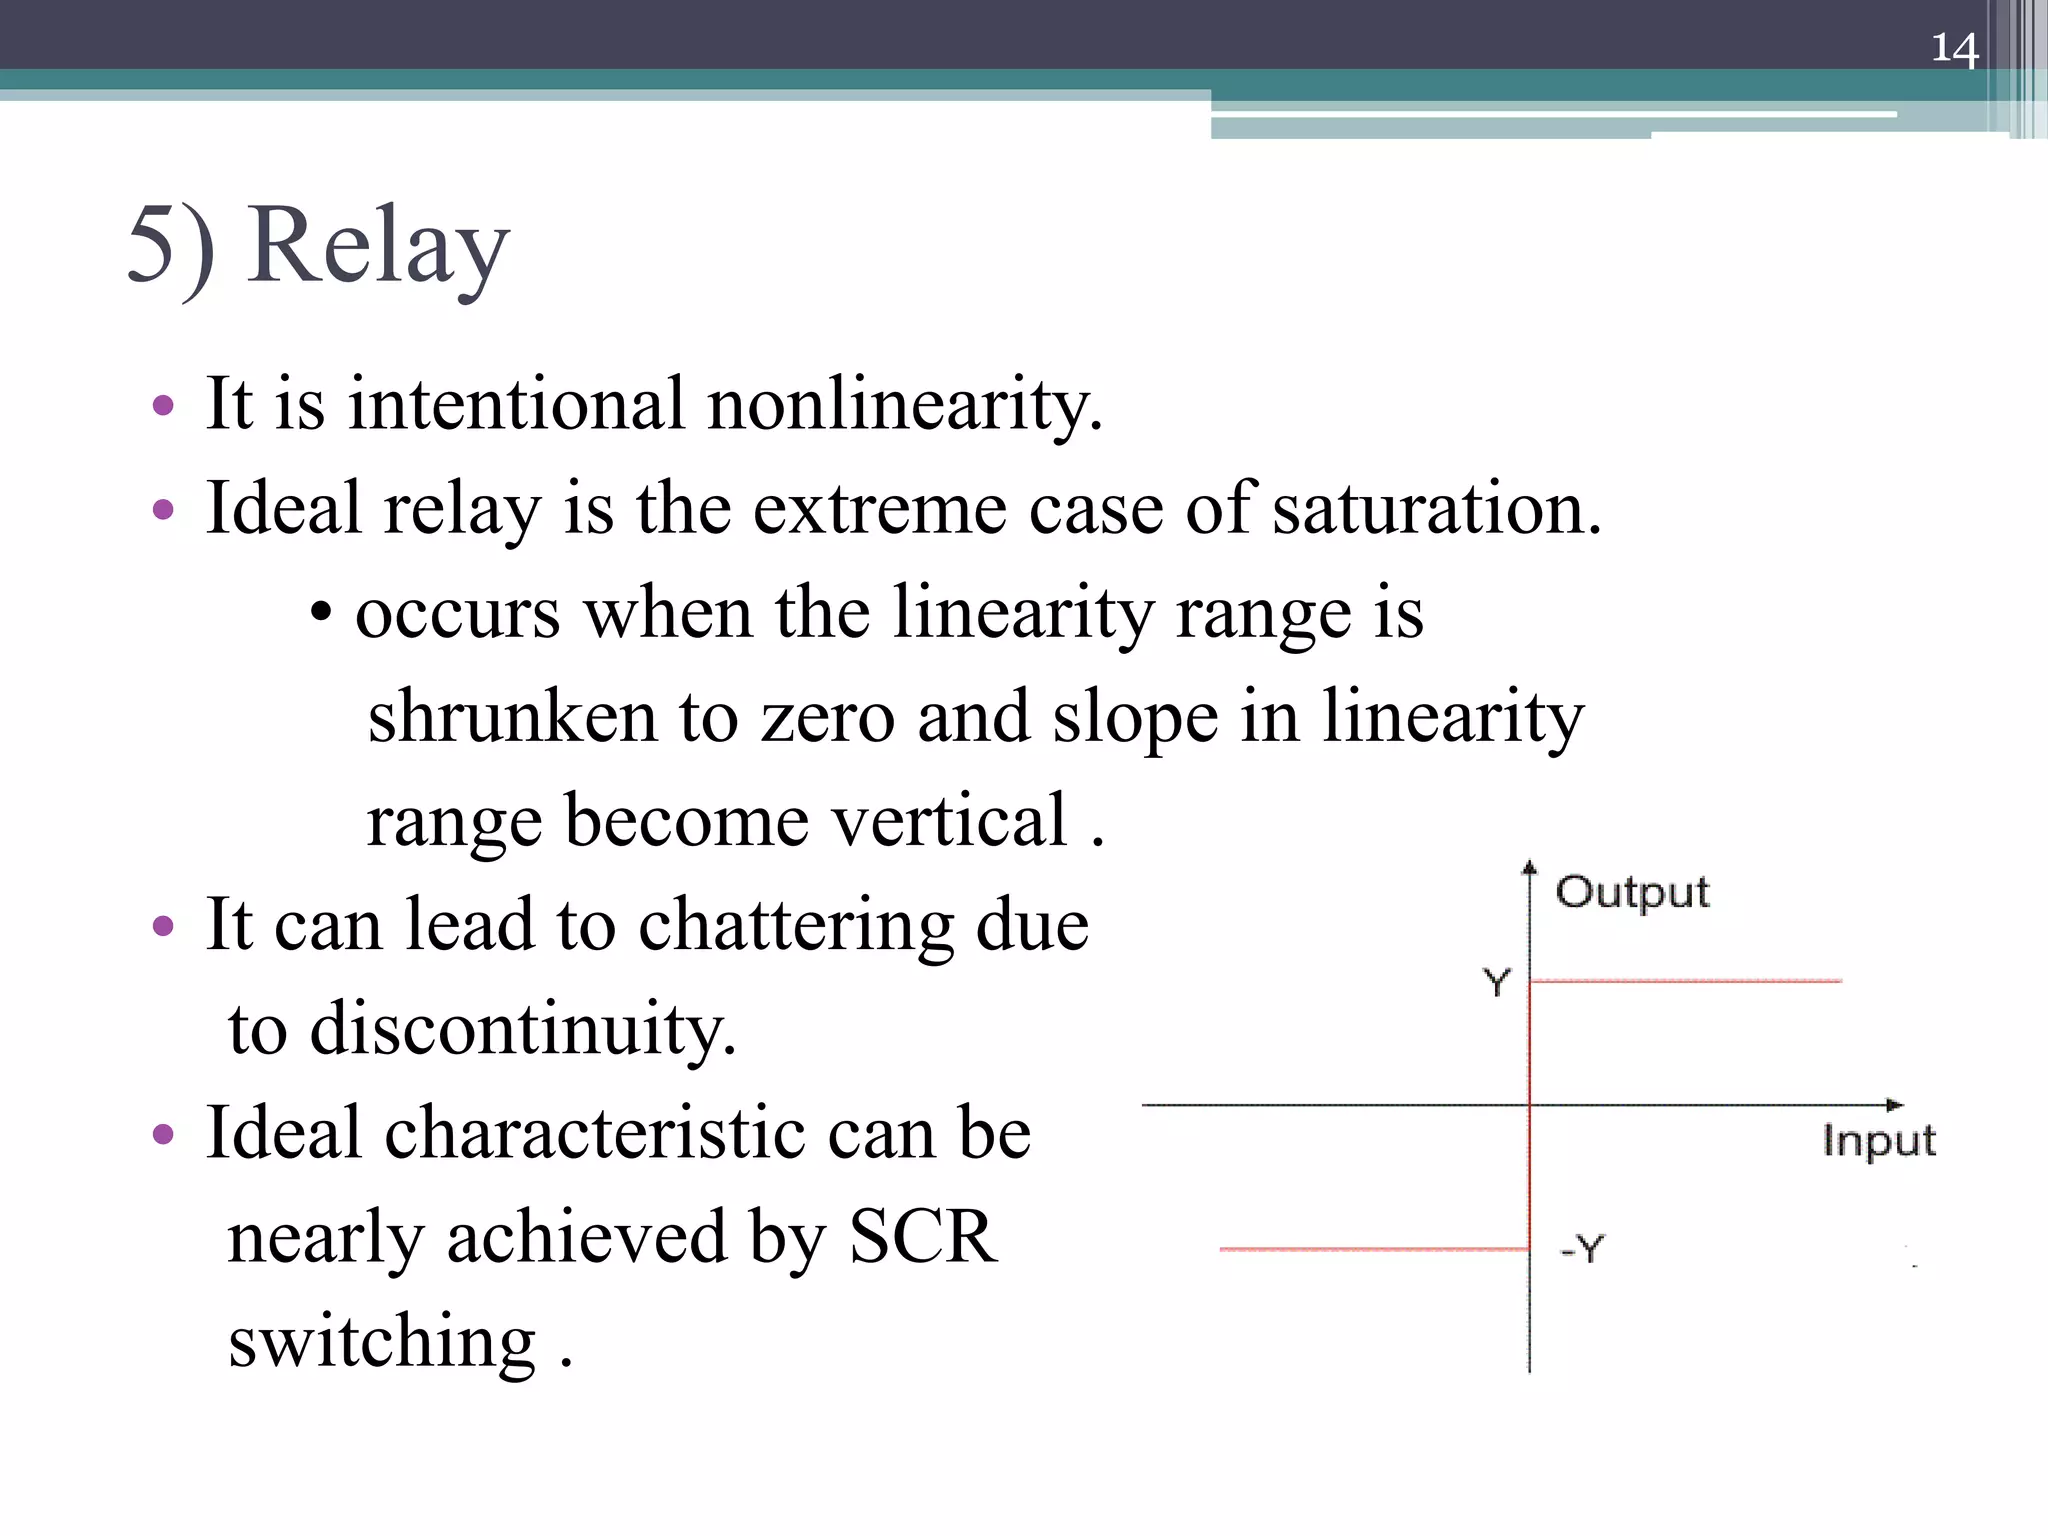
5) Relay
• Itis intentional nonlinearity.
• Ideal relay is the extreme case of saturation.
• occurs when the linearity range is
shrunken to zero and slope in linearity
range become vertical .
• It can lead to chattering due
to discontinuity.
• Ideal characteristic can be
nearly achieved by SCR
switching .
14
15.
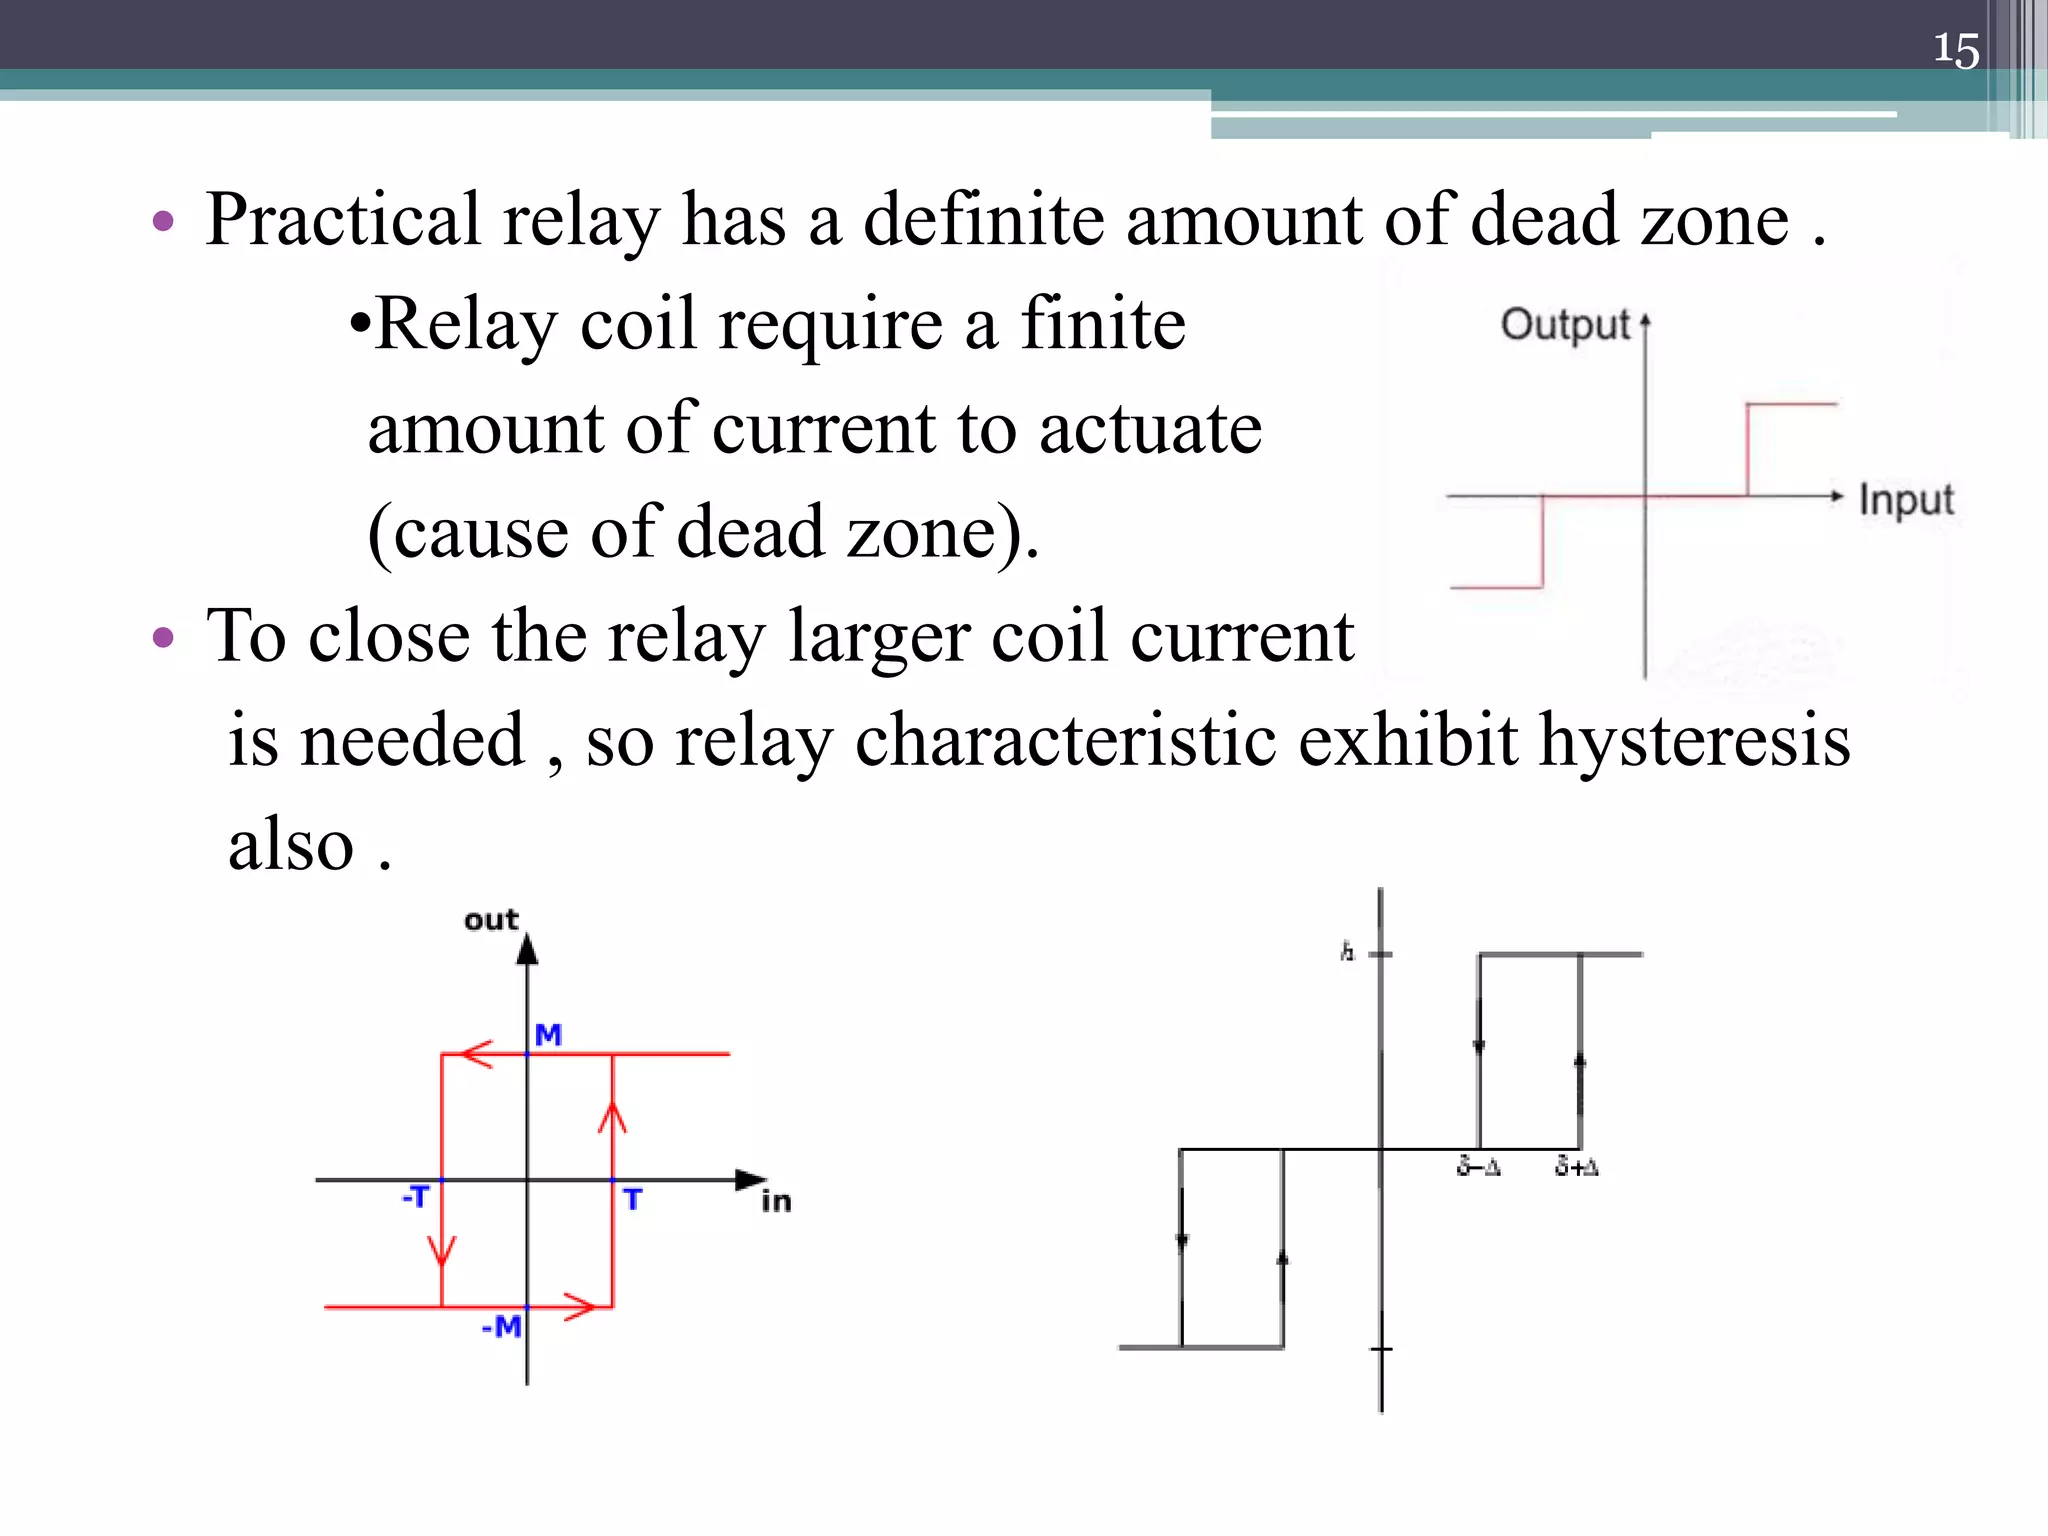
• Practical relayhas a definite amount of dead zone .
•Relay coil require a finite
amount of current to actuate
(cause of dead zone).
• To close the relay larger coil current
is needed , so relay characteristic exhibit hysteresis
also .
15
16.
• Relay canbe switched abruptly in any of these 3
states :
•off
•full forward
•full reverse
Therefore are used widely in control field .
• Application: • temperature control system
• aircraft and missile control system
• space-vehicle attitude control system
• power system
16
17.
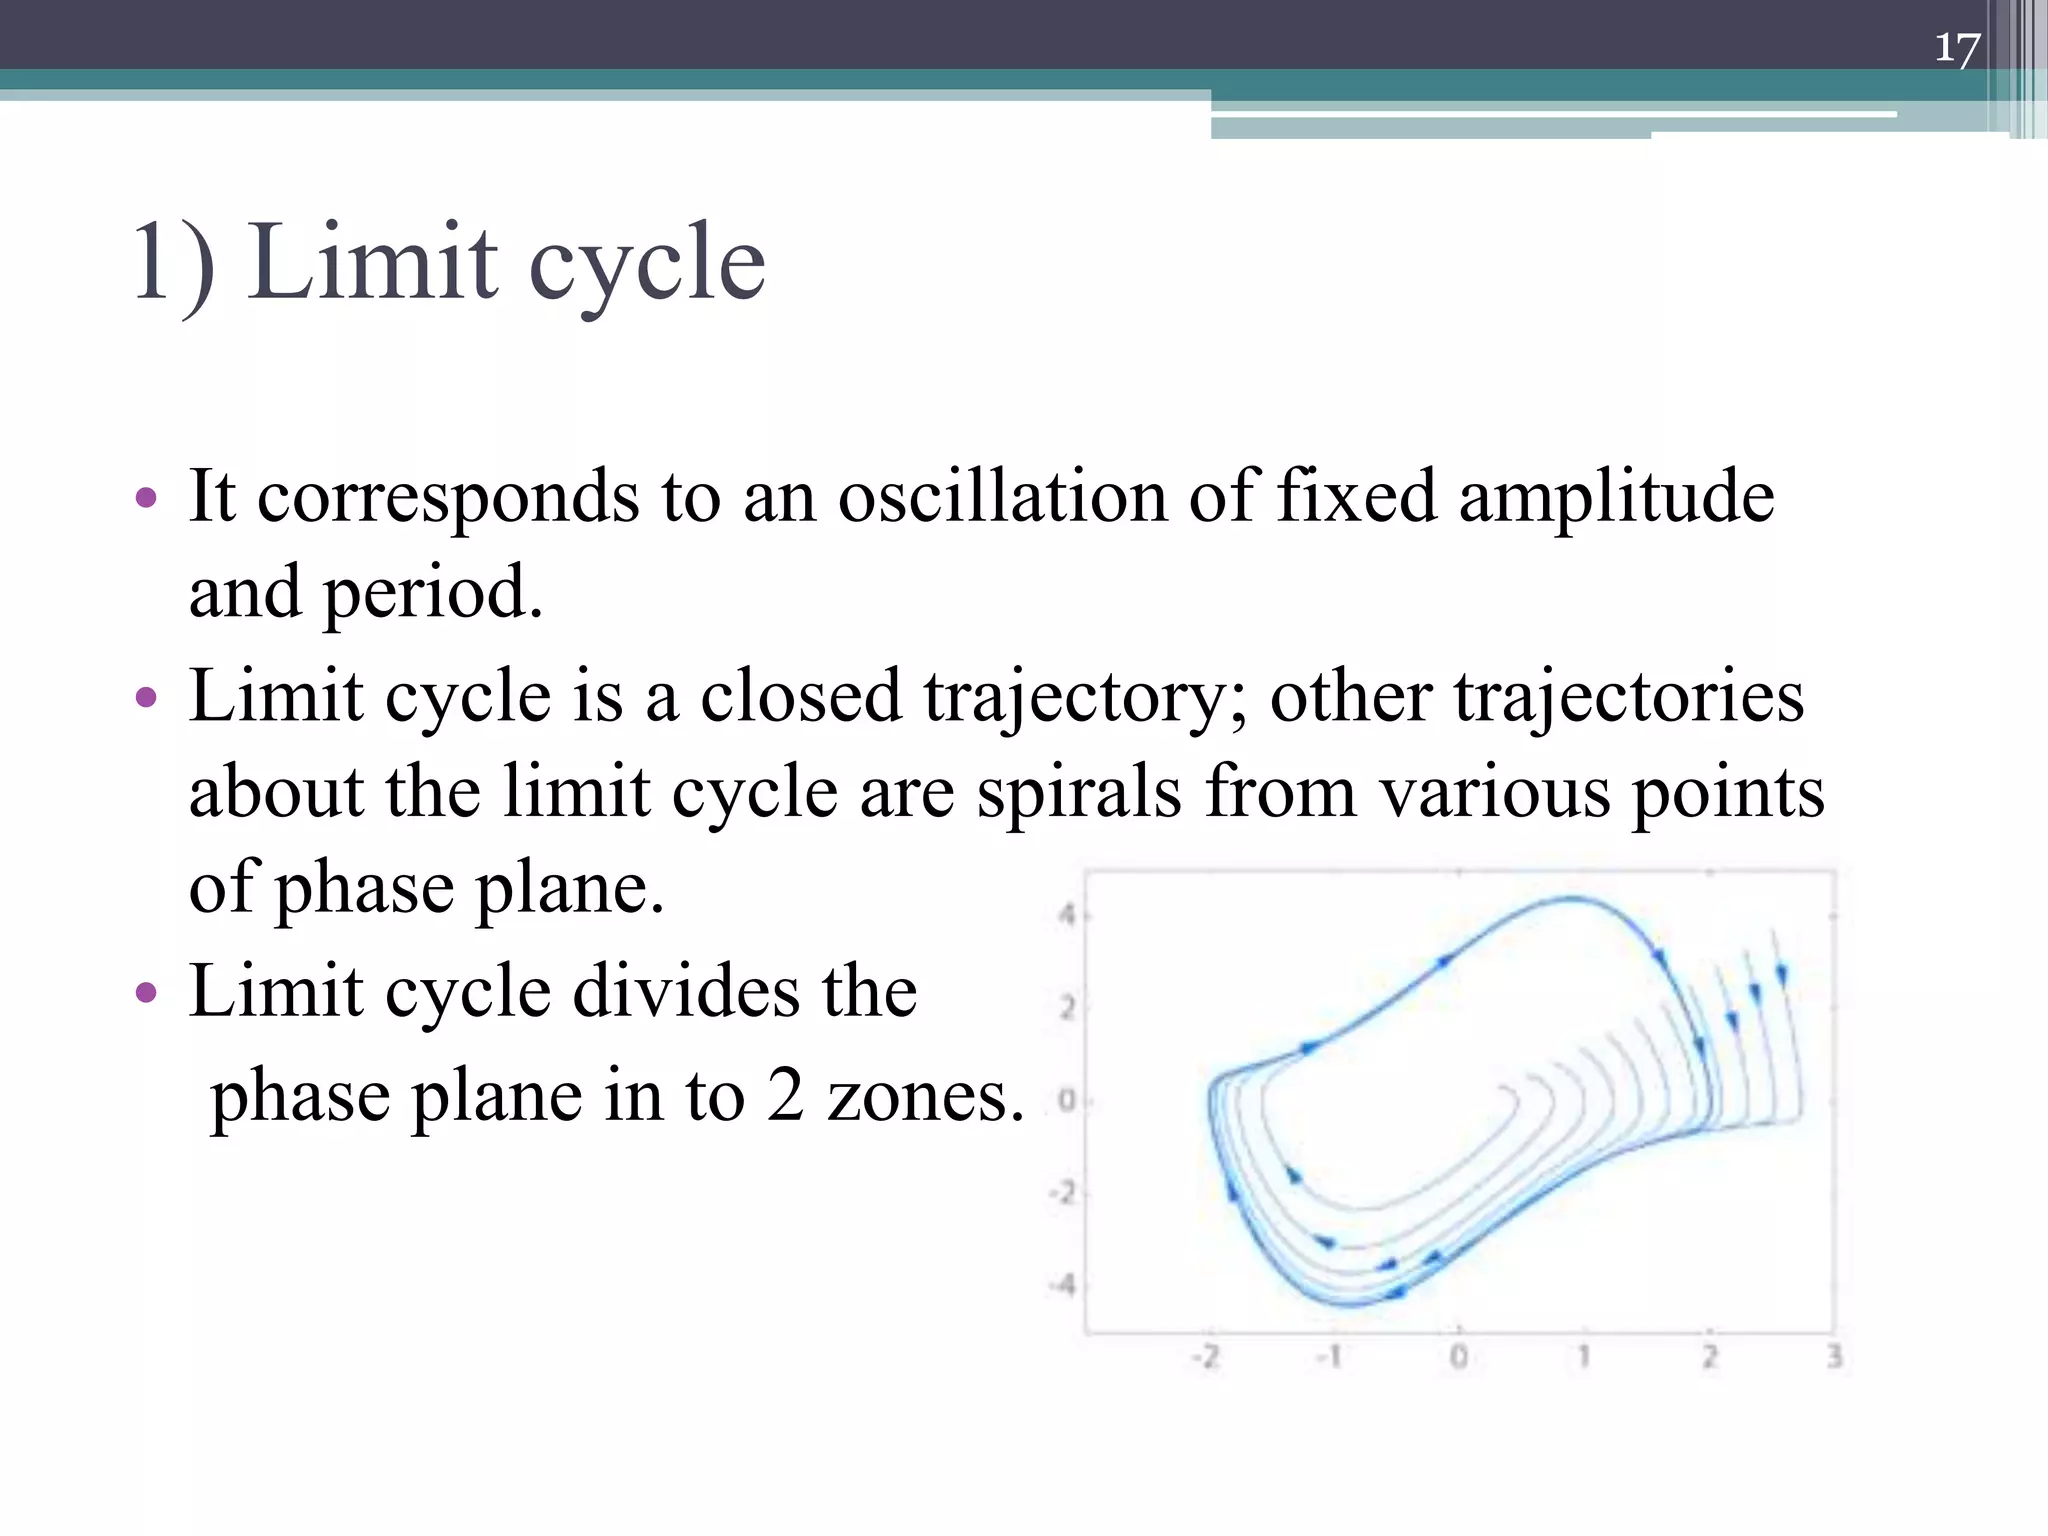
1) Limit cycle
•It corresponds to an oscillation of fixed amplitude
and period.
• Limit cycle is a closed trajectory; other trajectories
about the limit cycle are spirals from various points
of phase plane.
• Limit cycle divides the
phase plane in to 2 zones.
17
18.
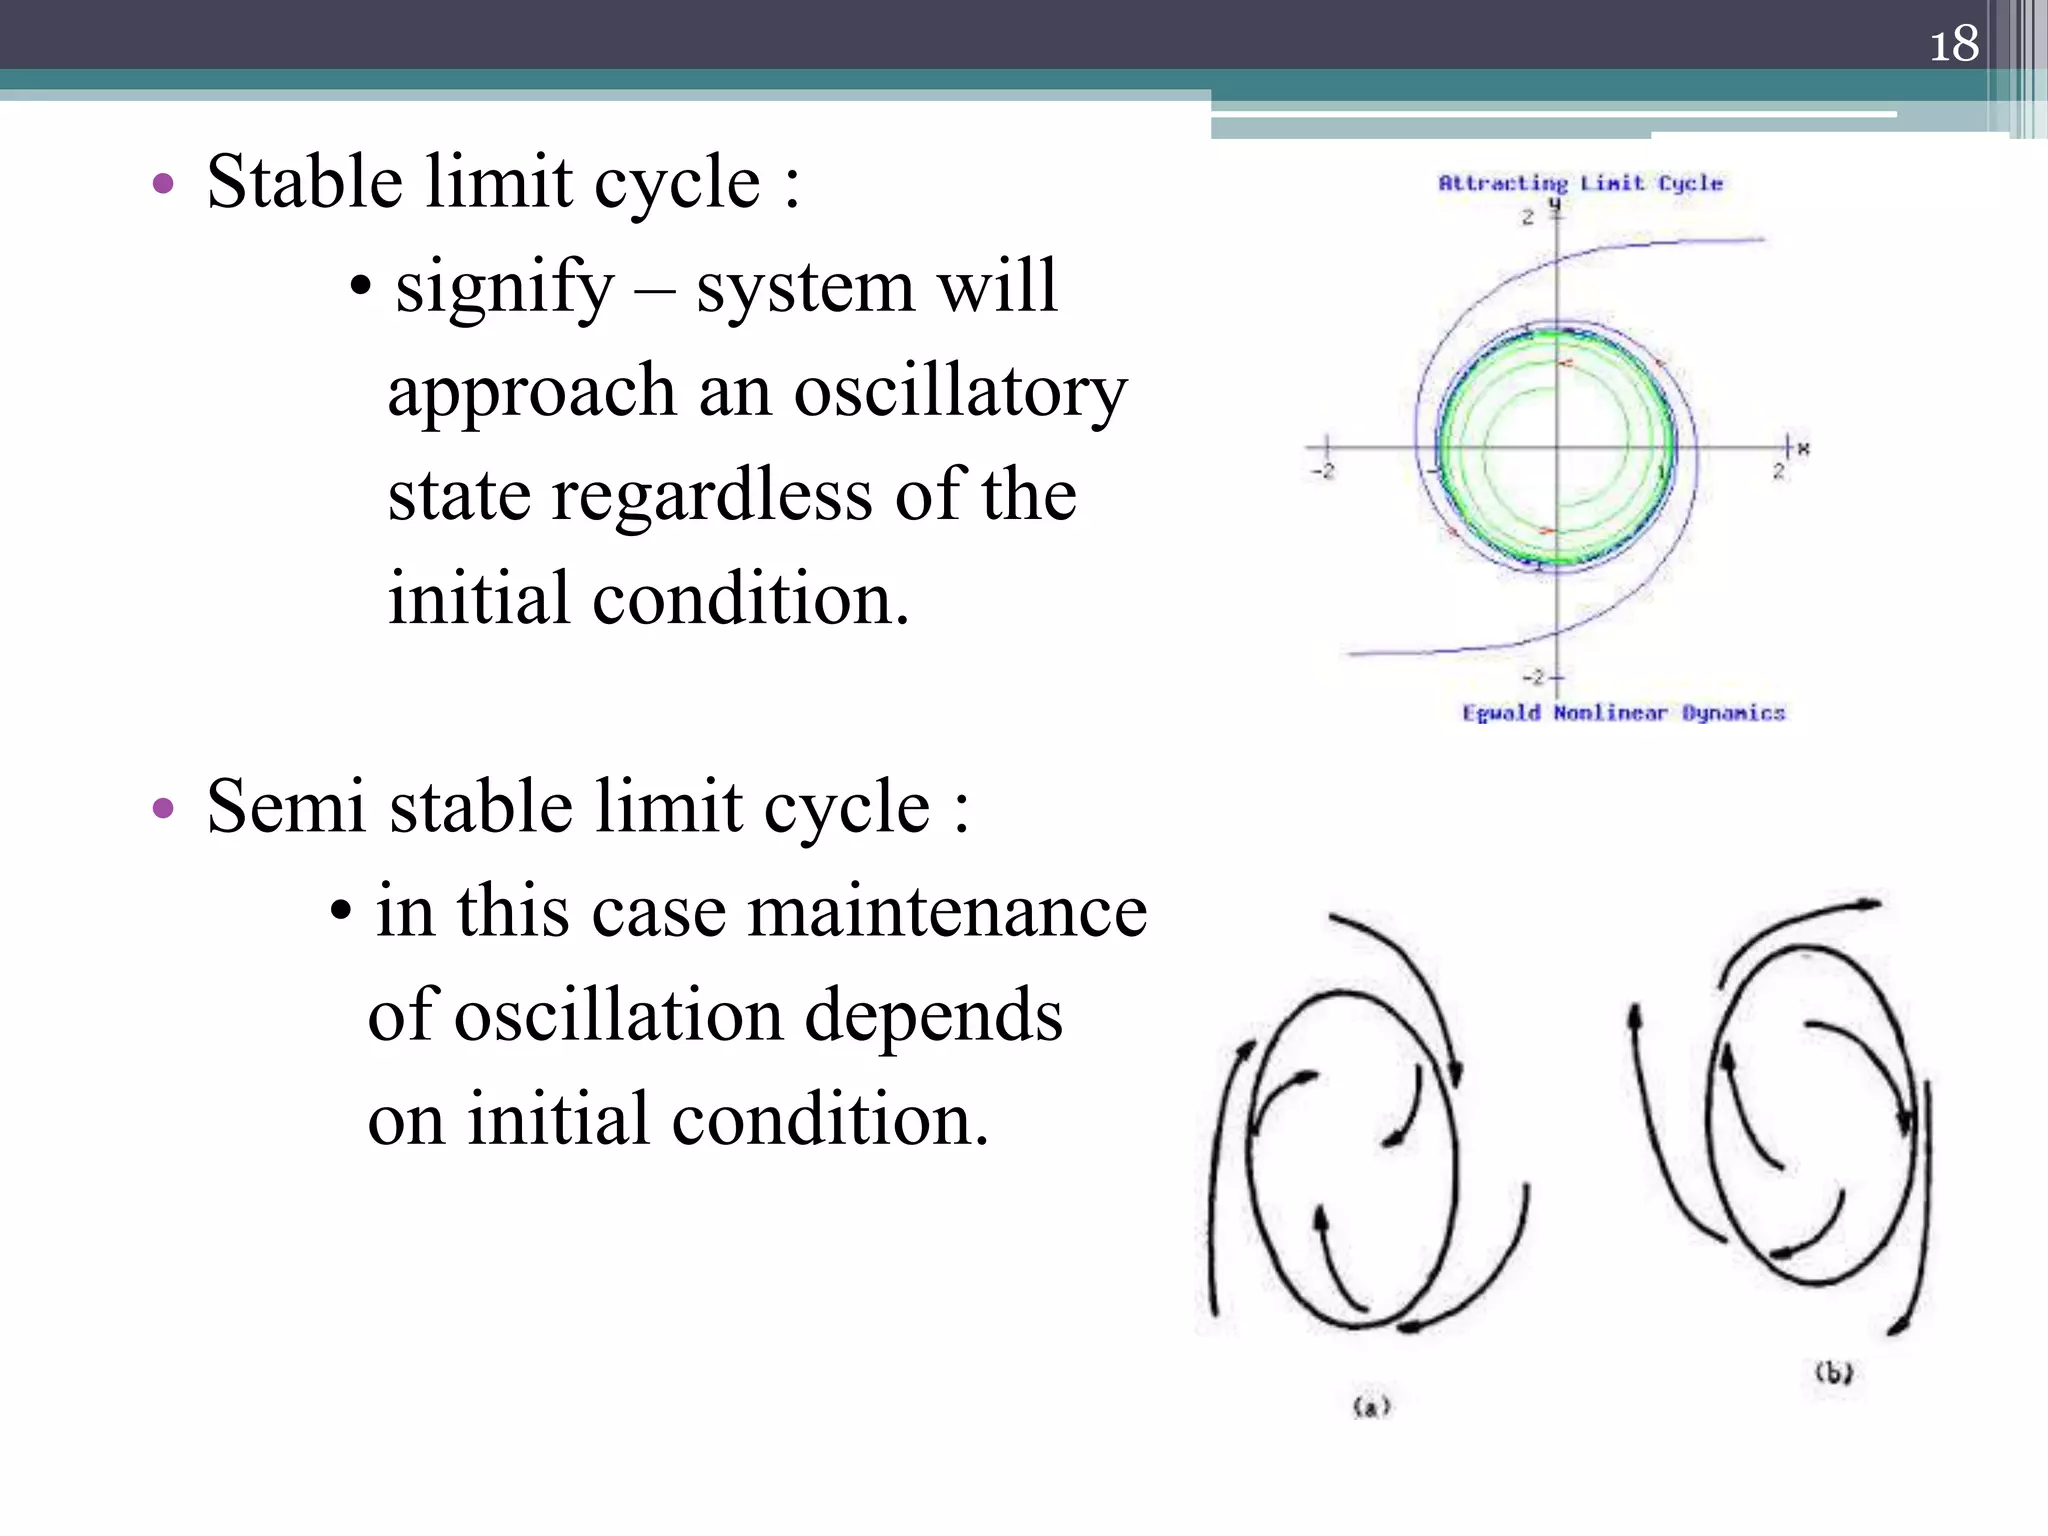
• Stable limitcycle :
• signify – system will
approach an oscillatory
state regardless of the
initial condition.
• Semi stable limit cycle :
• in this case maintenance
of oscillation depends
on initial condition.
18
19.
• Unstable limitcycle :
• Limit cycles are usually less sensitive to system
parameter variations.
• Although L.C. can be sustained over a finite range of
system parameters.
• E.g.: squealing door hinges, electric wires whistling
in the wind ,whirling shafts.
19
20.
2) Jump resonance
•It is a discontinuous change in the steady state
response of the system when a parameter (forcing
frequency) is slowly varied.
• Its produced around the system’s resonant frequency.
• Consist of multiple values of the amplitude and phase
of input signal when the amplitude or frequency of
the harmonic input signal is varied slowly.
20
21.
• E.g. :hard spring
• As input frequency is increased
gradually from 0 ,response
follow curve ABC .
• At ‘C’- increment in frequency
resulted in discontinuous jump down to ‘D’.
• Further increase – response curve follows through
DE.
• If frequency is now decreased – curve EDF is
followed with a jump up to B from the point F and
then to A .
21
22.
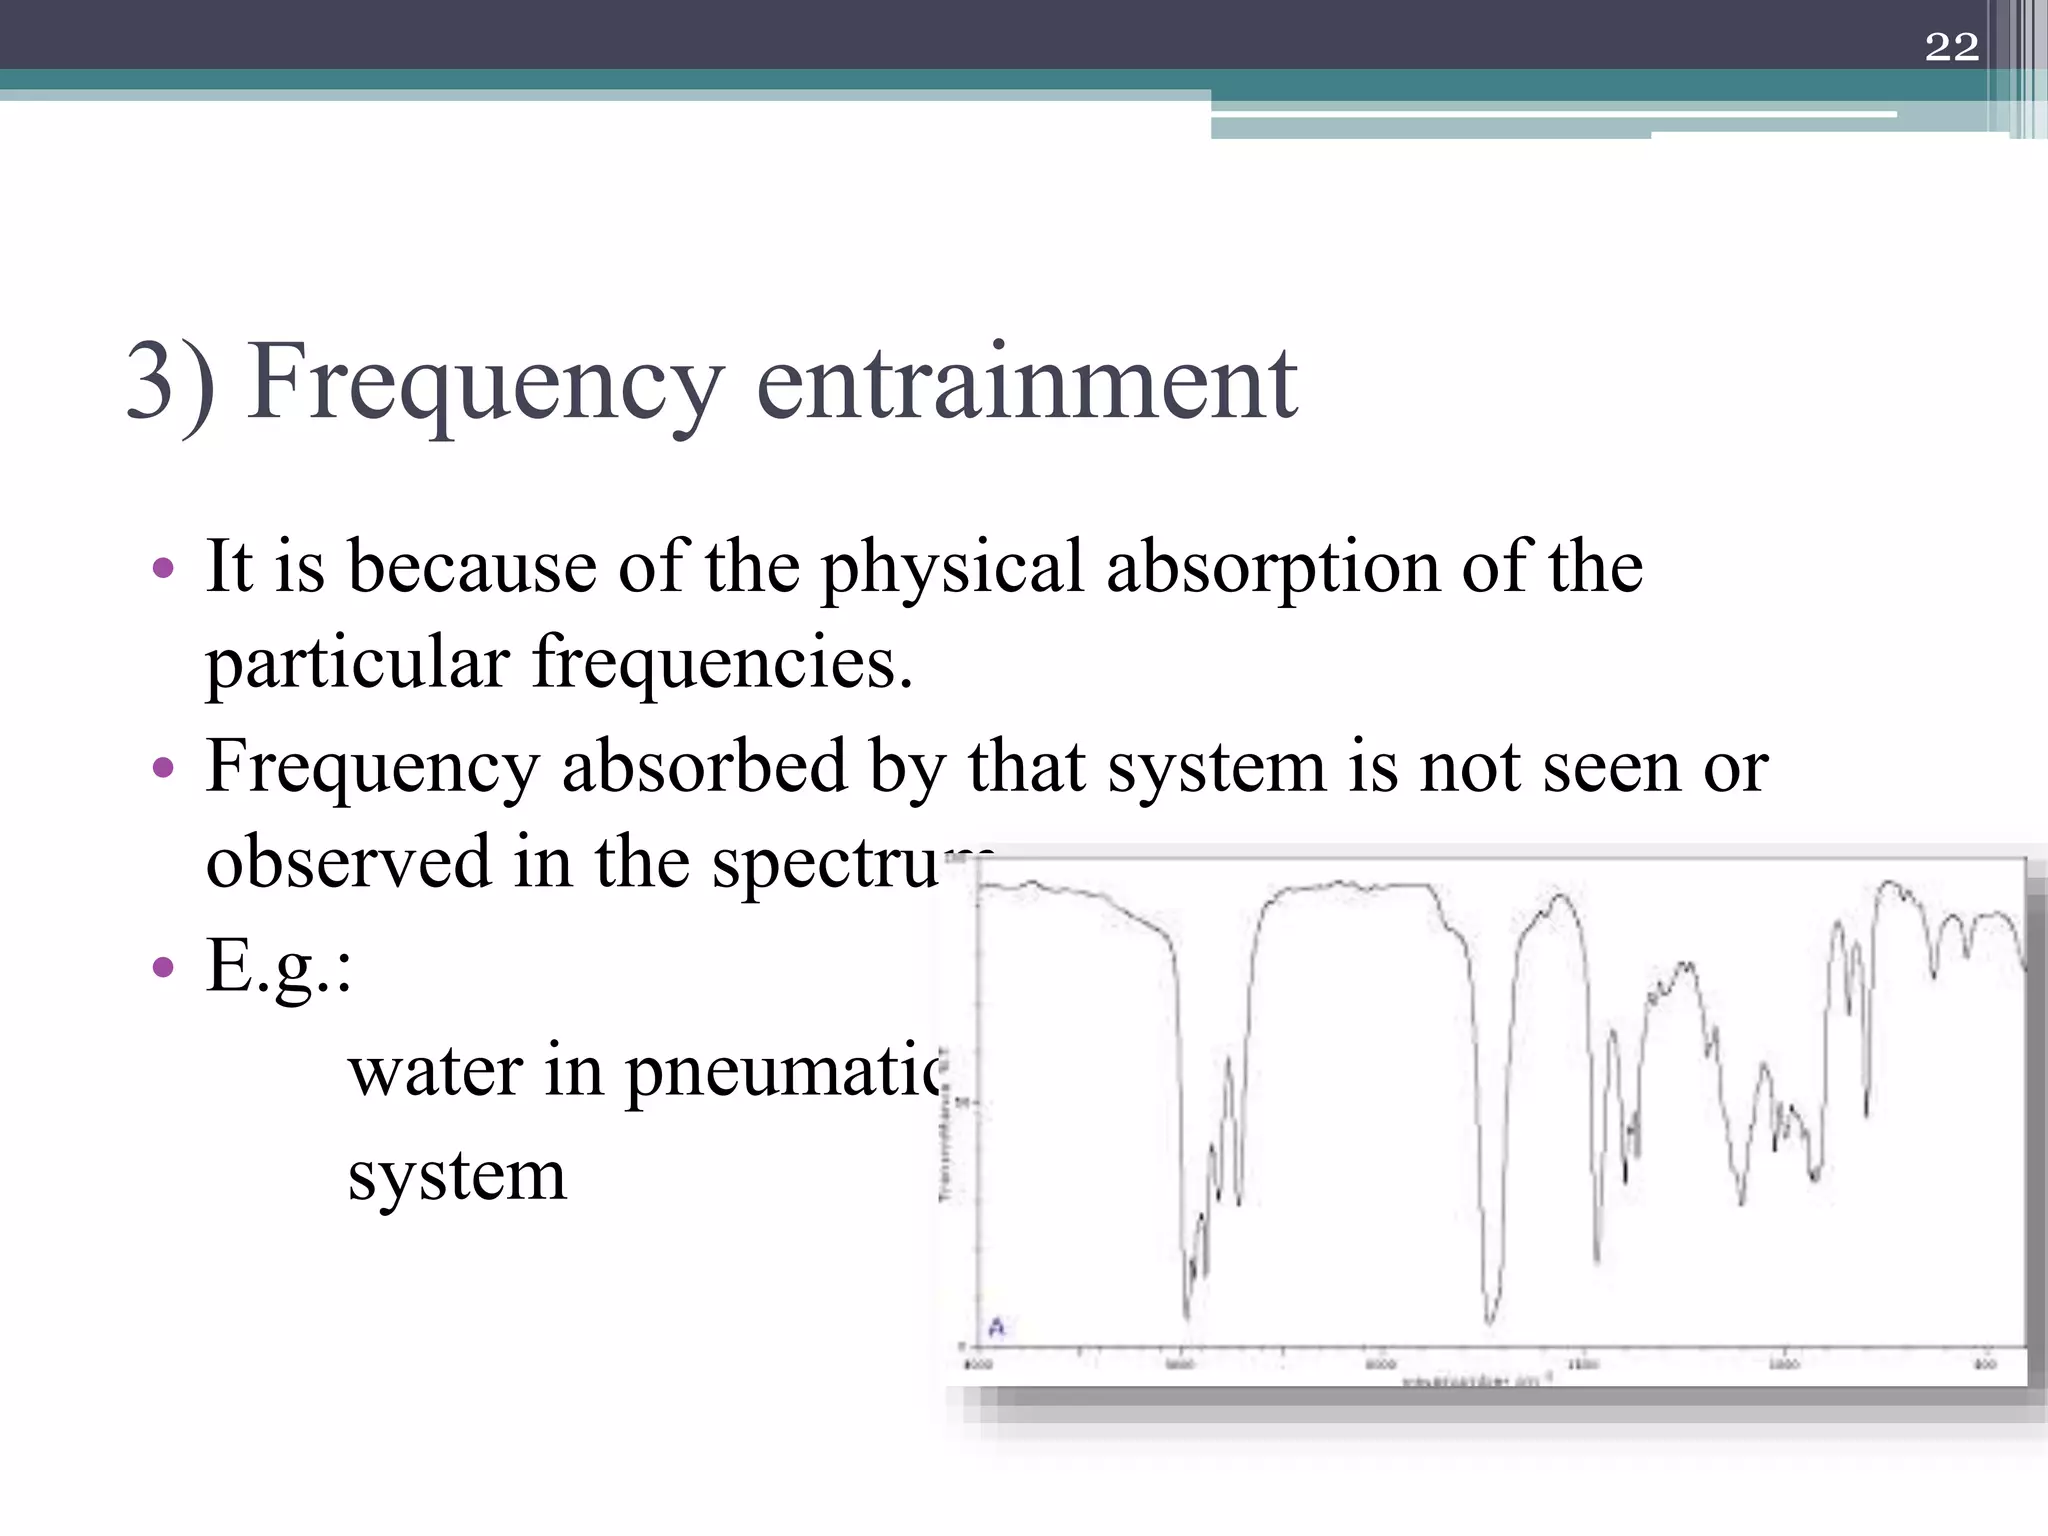
3) Frequency entrainment
•It is because of the physical absorption of the
particular frequencies.
• Frequency absorbed by that system is not seen or
observed in the spectrum .
• E.g.:
water in pneumatic
system
22
23.
4) Beat frequency
•The system is sensitive to some
frequency only.
• E.g.:
guitar
sonometer
23
24.
5)Self excitation
• Itmay occur without any external or internal periodic
forcing.
• It appears due to specific internal properties of a
system.
• It is of 2 types:
• soft self excitation
• hard self excitation
24
25.
• Soft selfexcitation :
•represented in phase space by a stable limit cycle.
• Hard self excitation :
•represented by unstable limit cycle.
•depending on initial conditions trajectory tends to
equilibrium point or to infinite; therefore this
type
is called catastrophic .
• E.g.: fluttering of airplane wings, shimming of
vehicle wheel , unwanted vibration during machining
processes (chatter).
25
26.
6) Harmonics
• Nonlinearsystem may contain frequencies other than
forcing frequency in input
• These frequencies are multiple of forcing frequency.
• If f(t)= A sin ωt
then oscillatory phenomenon of frequency ᾤ may
appear at certain points
here ω not equal to ᾤ
when ᾤ > ω it is superharmonic
when ᾤ < ω it is subharmonic
26
27.
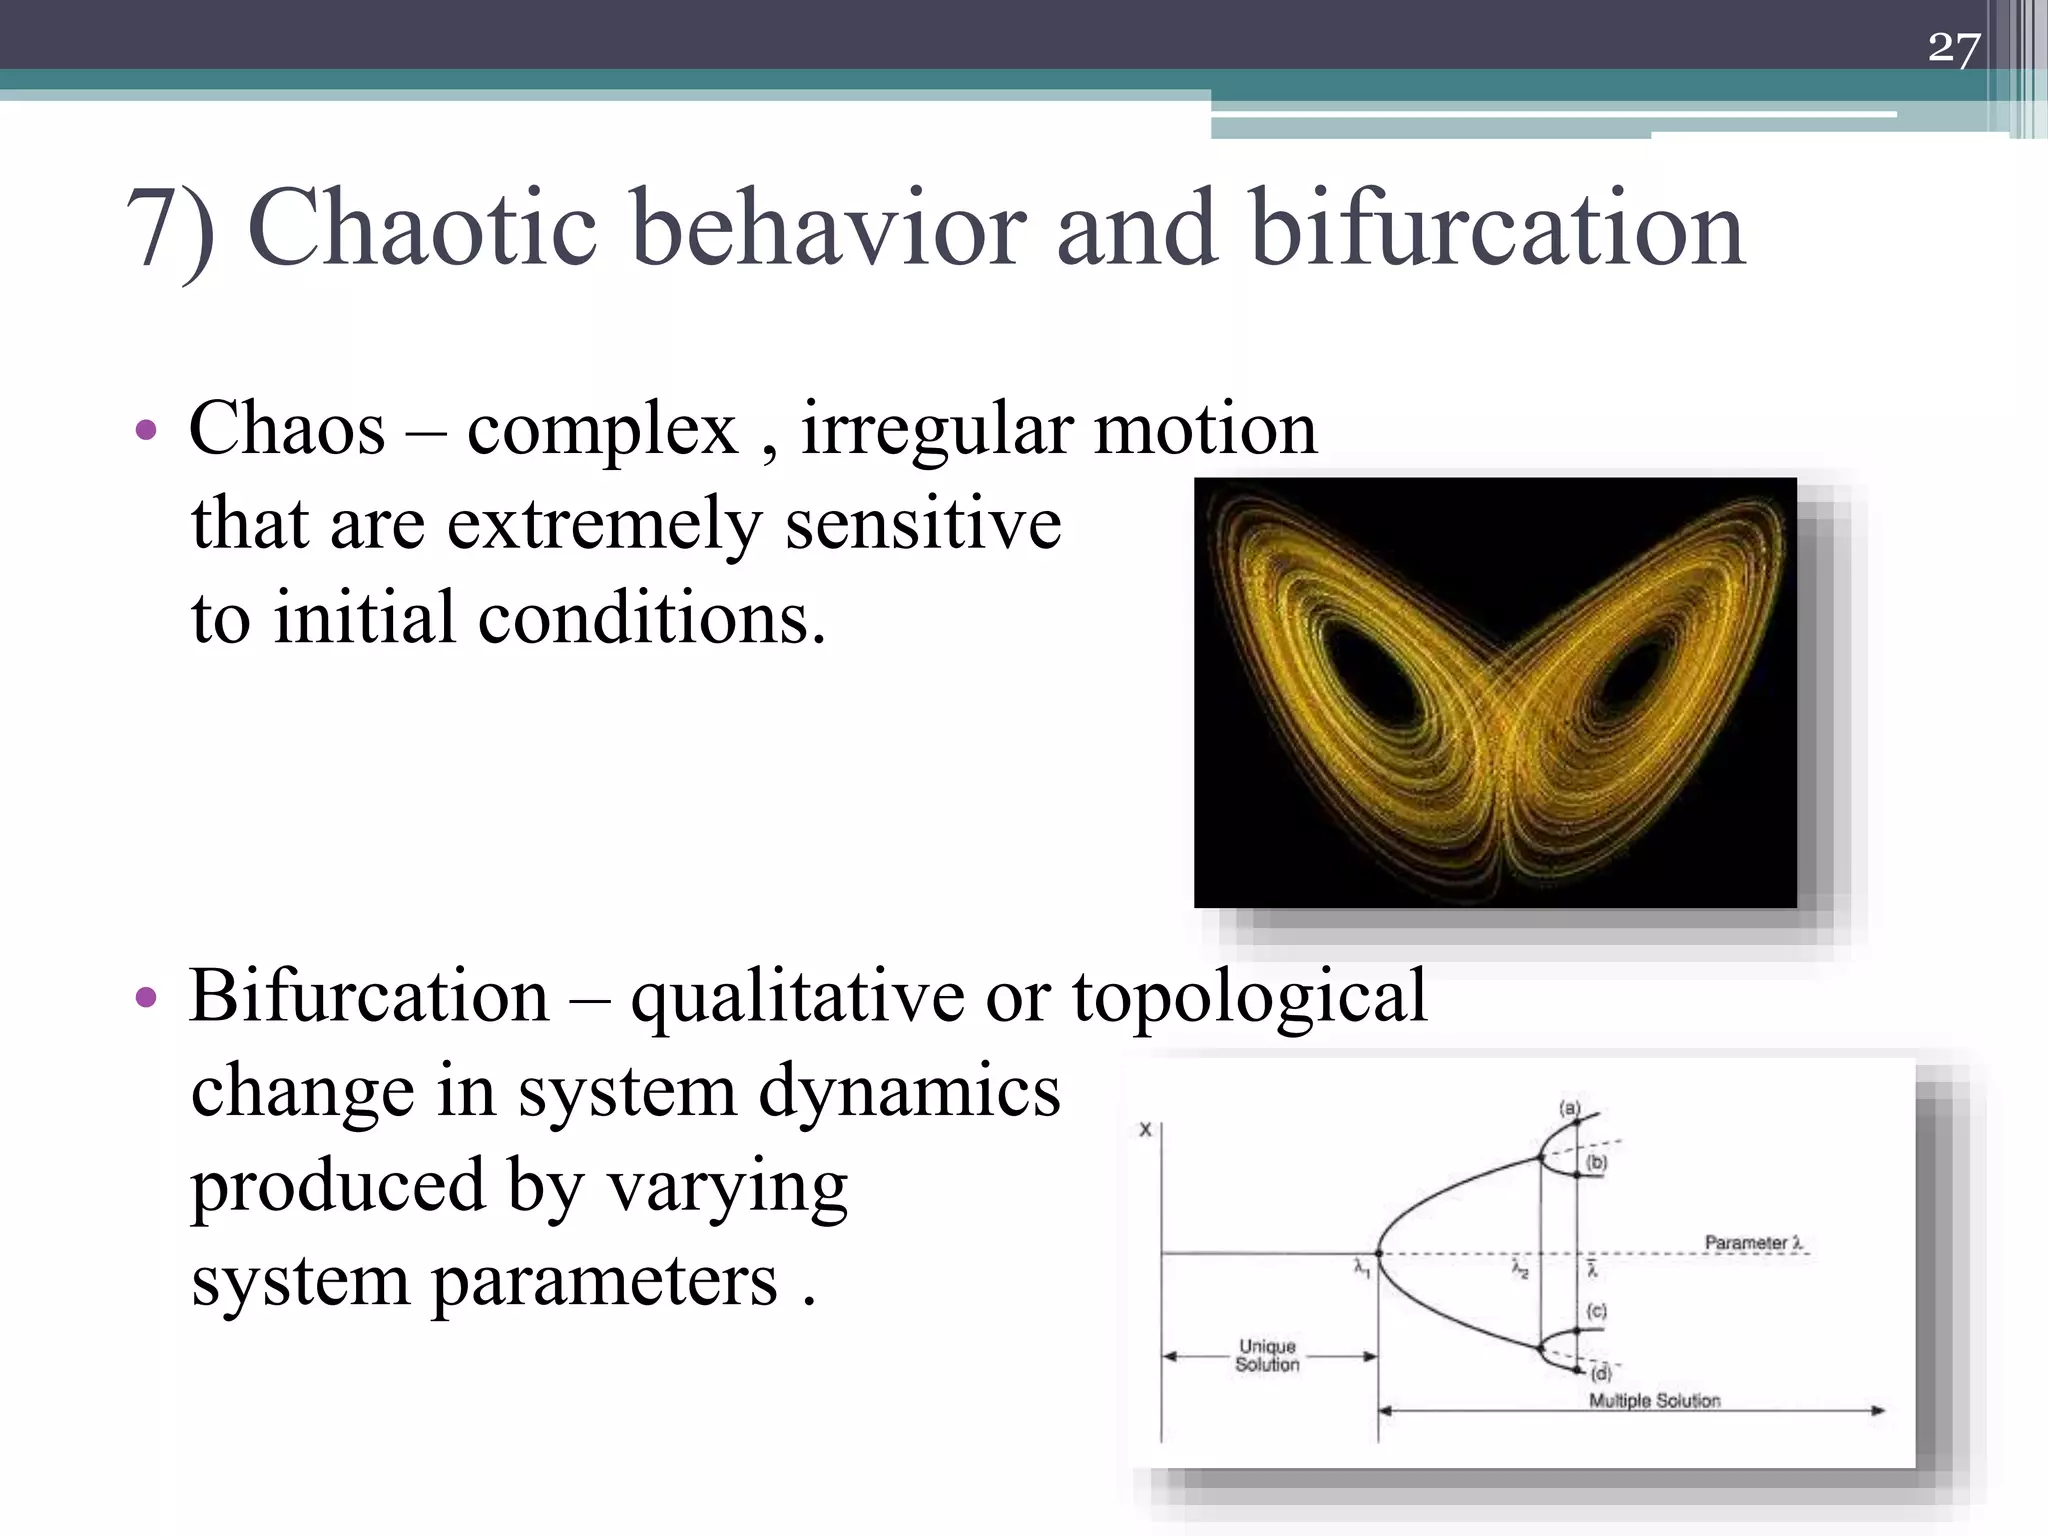
7) Chaotic behaviorand bifurcation
• Chaos – complex , irregular motion
that are extremely sensitive
to initial conditions.
• Bifurcation – qualitative or topological
change in system dynamics
produced by varying
system parameters .
27
28.
• Bifurcation –periodic doubling
• chaos – series of periodic doubling
• The illustration above shows a bifurcation diagram of
the logistic map obtained by plotting as a function of a
series of values for obtained by starting with a random
value ,
28
29.
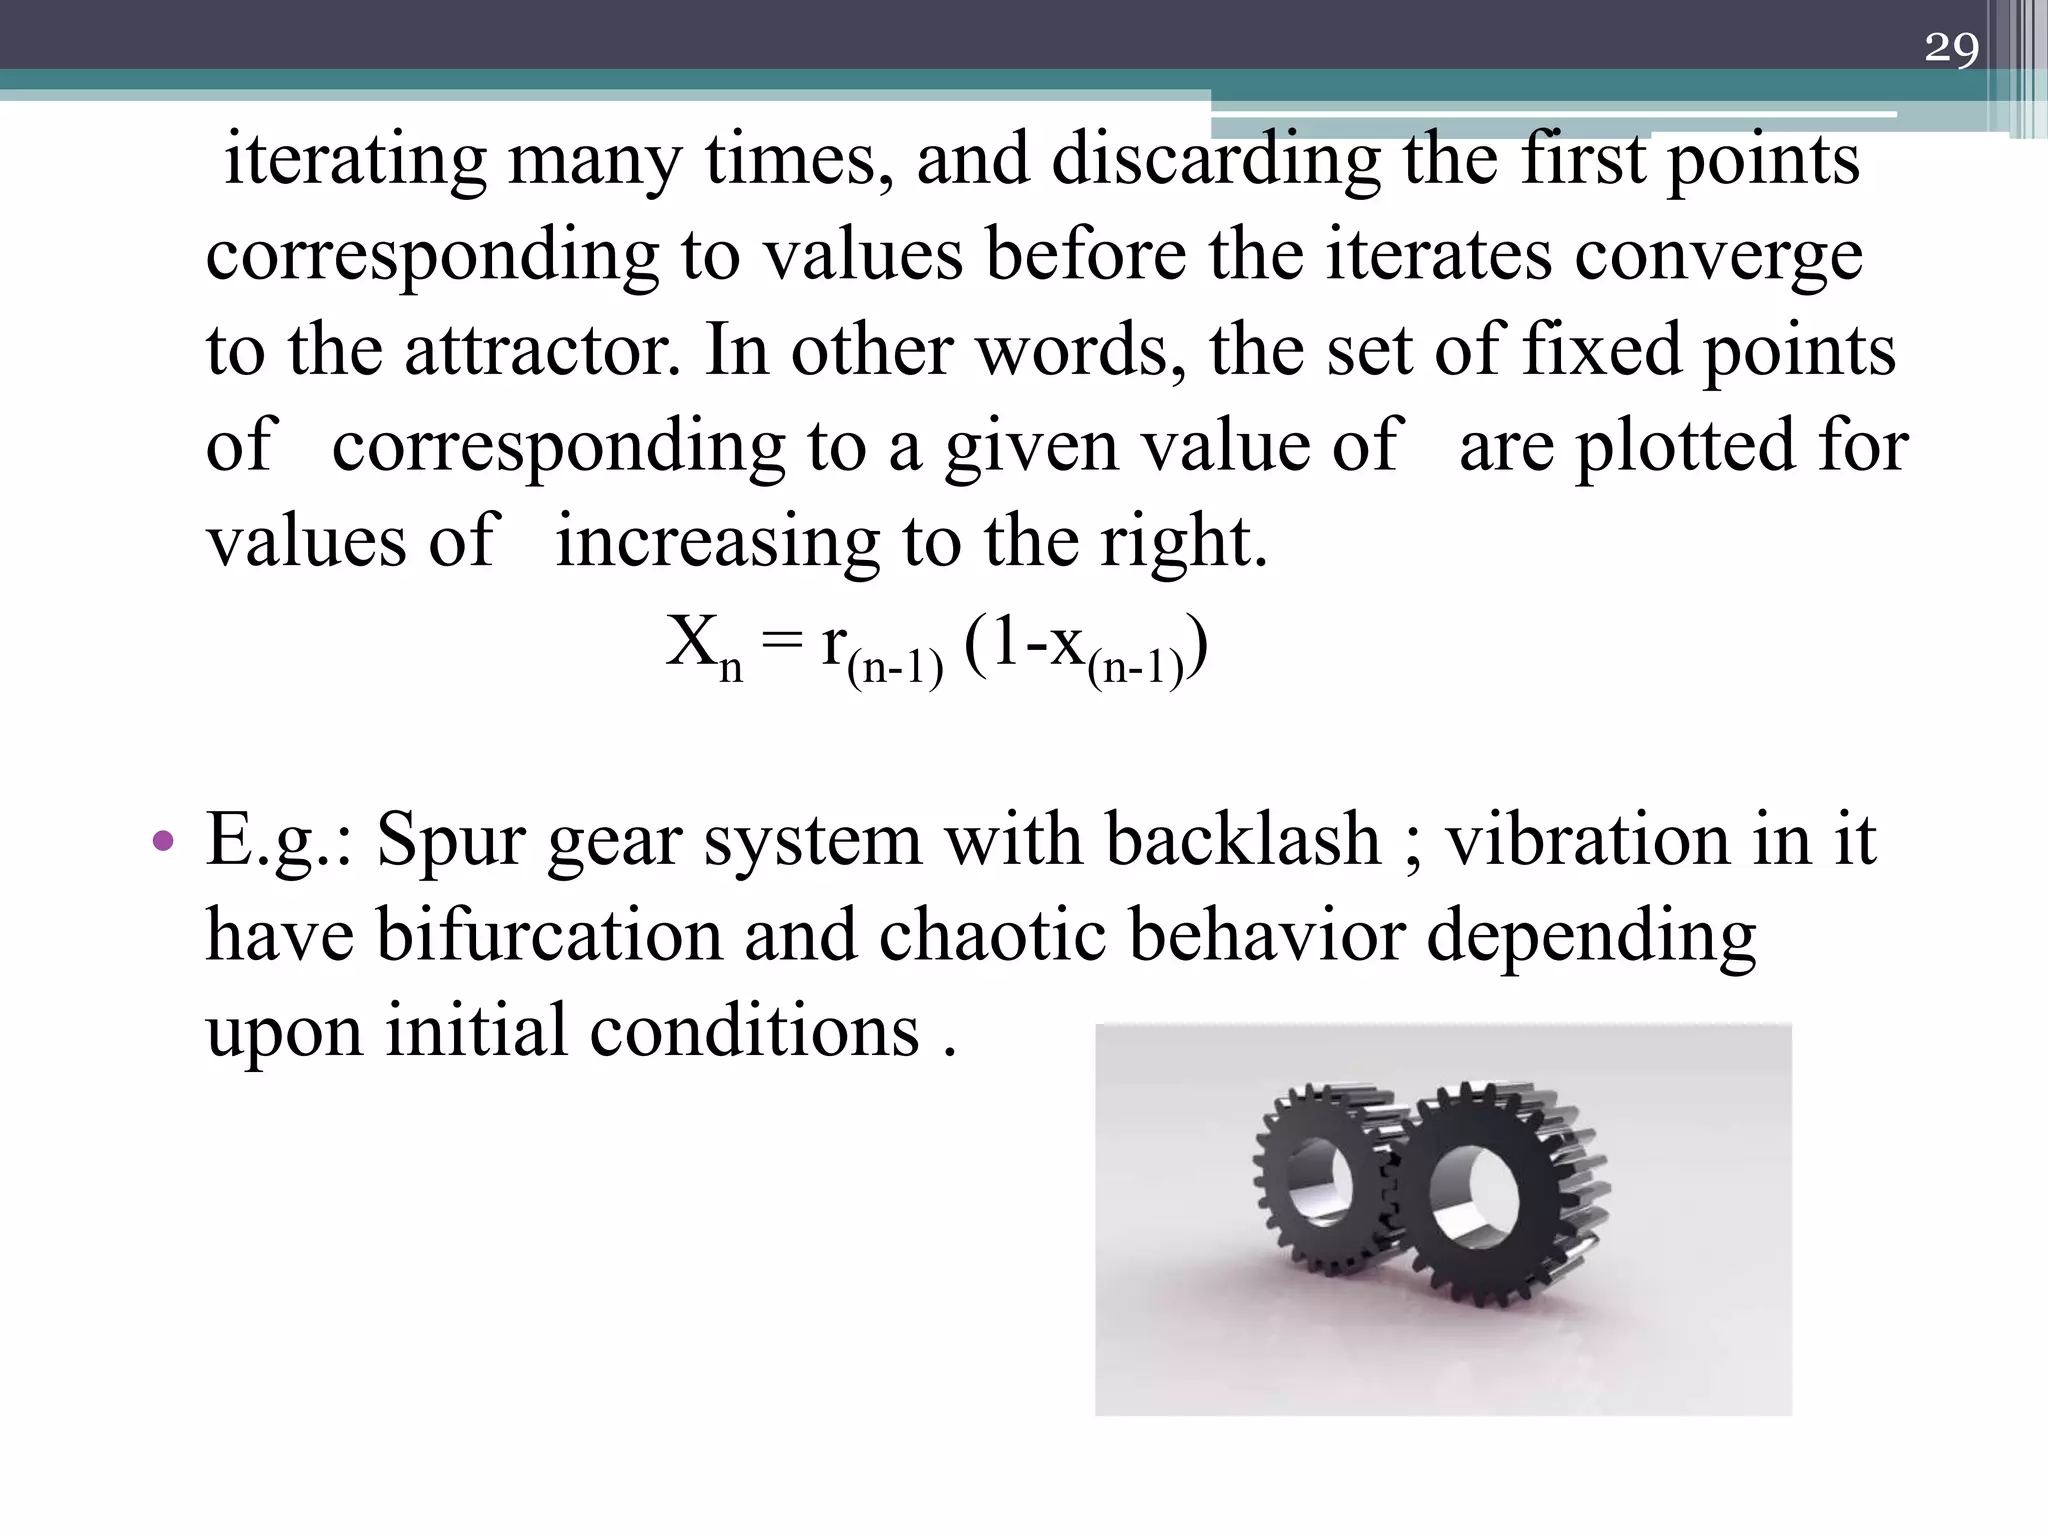
iterating many times,and discarding the first points
corresponding to values before the iterates converge
to the attractor. In other words, the set of fixed points
of corresponding to a given value of are plotted for
values of increasing to the right.
Xn = r(n-1) (1-x(n-1))
• E.g.: Spur gear system with backlash ; vibration in it
have bifurcation and chaotic behavior depending
upon initial conditions .
29