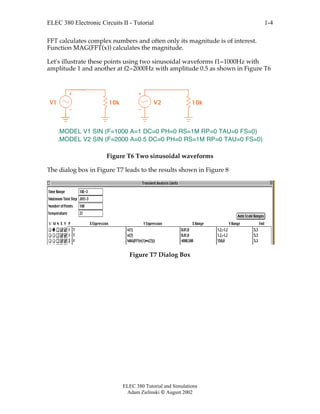
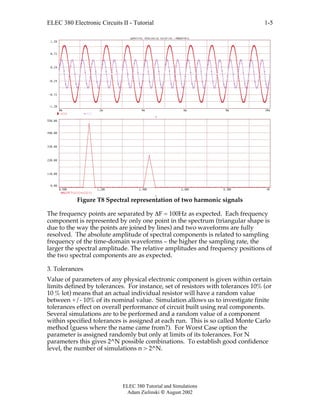
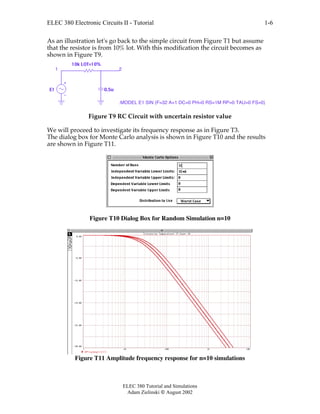
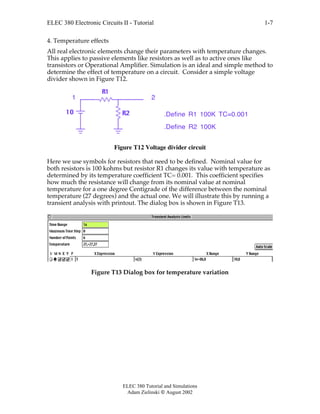
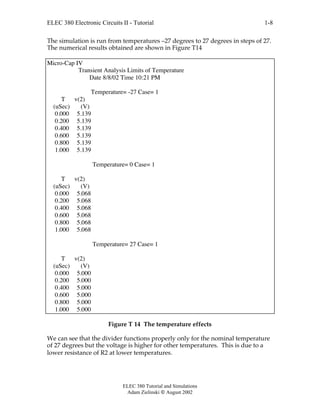
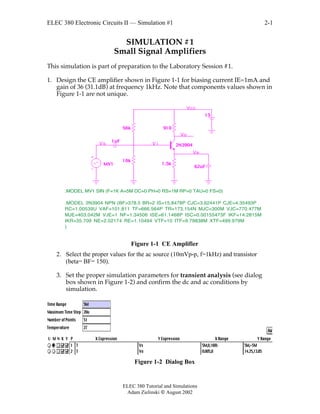
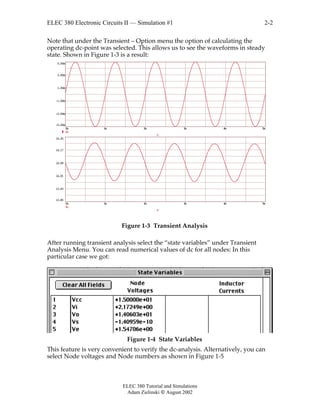
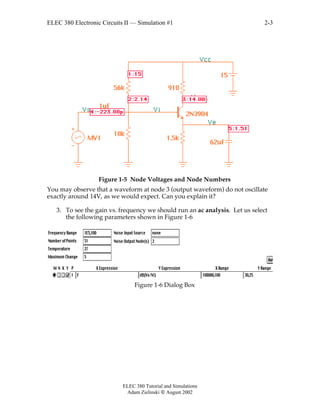
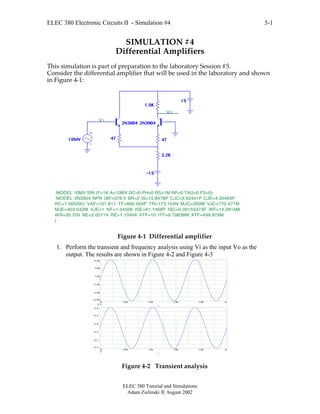
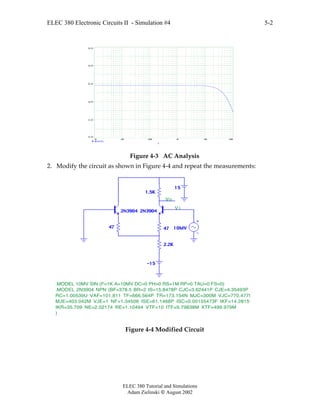
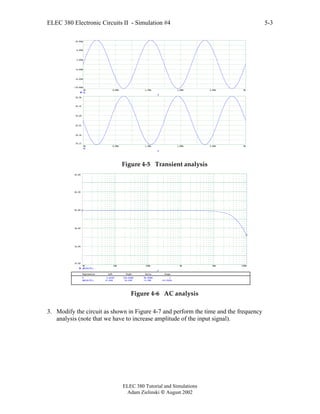
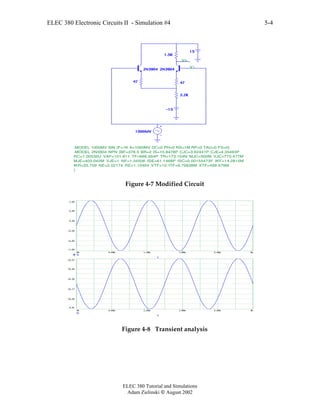
This document provides a tutorial for using Micro-Cap IV simulation software to analyze electronic circuits. It includes examples and explanations of various analysis types, including: AC analysis of a simple RC circuit to determine its frequency response; spectral analysis of two sinusoidal signals to view their frequency components; investigating the effects of component tolerances using Monte Carlo analysis; and determining the impact of temperature variation on a voltage divider circuit by running transient analysis across a temperature range. The tutorial is intended to explore useful Micro-Cap IV features relevant to material covered in an Electronic Circuits course.
The document discusses current transformers (CTs) and their basics according to IEEE standards. It covers various types of CT construction including the common "doughnut" type using an iron core wound with secondary turns. It explains key CT concepts such as transformer ratio, polarity, rating factors, accuracy classes for metering and relaying purposes, burden calculations, and factors that can influence accuracy such as frequency, current ratio, and burden. CT saturation and DC offset are also addressed.
This document contains 16 questions related to diode circuits and rectifiers. The questions cover topics such as:
1) Calculating the minimum load resistance needed to limit ripple voltage to a specified value for a half wave rectifier.
2) Determining the required filter capacitor value to prevent the output voltage of a full wave rectifier from dropping below a specified level.
3) Drawing output voltage waveforms for various rectifier circuits given input voltage waveforms and specifications about diode cut-in voltages and time constants.
4) Plotting output voltage and current versus input voltage or time for circuits containing diodes with specified piecewise linear parameters.
5) Calculating output voltages, currents, and required capacitor values
This document contains 6 sample question papers for an exam on Linear Integrated Circuits. Each paper contains 3-6 questions with multiple parts assessing various concepts related to operational amplifiers, filters, instrumentation amplifiers, timers and oscillators using op-amps and IC 555. The questions include topics like ideal op-amp characteristics, filter design and analysis, signal conditioning circuits, timer applications and phase locked loops. Students are required to draw circuits, derive expressions and describe concepts with diagrams to solve the problems.
This document discusses mathematical modeling of electrical circuits. It covers passive networks using components like resistors, capacitors and inductors with no internal energy source. Analysis methods for passive networks include mesh analysis, nodal analysis and voltage division. Operational amplifiers are also covered, noting their differential input, high input/low output impedance, and high constant gain characteristics. Types of operational amplifiers include inverting and non-inverting configurations.
Hodgkin-Huxley & the nonlinear dynamics of neuronal excitabilitySSA KPI
The document discusses the Hodgkin-Huxley model of neuronal excitability and its analysis using nonlinear dynamics and phase plane methods. It describes how the Hodgkin-Huxley model dissects the action potential into fast and slow processes. It also discusses models of repetitive and phasic firing, including the Morris-Lecar model, and references software tools for neuronal modeling and simulation.
This document discusses transistor small signal analysis using the transistor re model. It begins by introducing the re model and its components, including the input resistance r1, output resistance r0, and current gain β. It then provides examples of applying the re model to analyze various common transistor amplifier configurations, such as common-emitter fixed bias and common-emitter voltage divider bias. For each configuration, it derives the expressions for input impedance, output impedance, voltage gain, and current gain. Approximations are also provided assuming r0 is much larger than other resistances in the circuit.
The document discusses transistor modeling for small-signal analysis. It introduces two common transistor models - the hybrid equivalent model and the re model. The re model represents the transistor with a diode and controlled current source. Important small-signal parameters for analysis are also defined, including input impedance Zi, output impedance Zo, voltage gain Av, and current gain Ai. The phase relationship between input and output signals is also addressed.
- The natural response of a circuit refers to the behavior of the circuit when external sources are removed. This allows the stored energy in inductors and capacitors to dissipate.
- The general solution for the natural response of RL and RC circuits is an exponential decay from an initial value to a final value, with the decay rate determined by the circuit time constant.
- For an RL circuit, the inductor current decays exponentially with time constant L/R. For an RC circuit, the capacitor voltage decays exponentially with time constant RC.
This document discusses PN junctions and their properties. It covers:
1) The basic structure of a PN junction, including the depletion region and built-in potential.
2) How the depletion region width, built-in potential, and electric field vary with doping concentration and applied bias.
3) Poisson's equation and how it relates charge density to the electric field in the depletion region.
4) The capacitance-voltage characteristics of a PN junction and how this can be used to determine doping concentrations.
5) Breakdown mechanisms in PN junctions including Zener tunneling and avalanche breakdown.
This document provides an overview of key concepts in semiconductor physics. It begins by introducing the crystal structure of silicon and how dopants can create an excess or deficiency of electrons (N-type or P-type silicon). It then discusses the energy band model and defines important terms like the band gap, Fermi energy level, density of states, and thermal equilibrium. The document derives expressions for the concentrations of electrons and holes as a function of doping, temperature, and the Fermi level position. It also examines intrinsic carrier concentration and how doping affects charge neutrality. Overall, the document establishes fundamental principles for understanding how electrons and holes behave in semiconductors.
This document summarizes the principles and design of temperature stable voltage references. It discusses how to generate voltages with positive temperature coefficients (PTAT) and negative temperature coefficients (CTAT) using diodes and resistors. The key principle is that a temperature independent reference voltage can be achieved by cancelling a PTAT voltage with a CTAT voltage using the appropriate ratio of resistor values. Two common configurations - series and parallel - are presented along with examples of calculating resistor ratios to achieve temperature independence.
This document discusses loop analysis of resistive circuits using Kirchhoff's voltage law. It begins by introducing mesh or loop analysis and defining key terms. Loop analysis provides a general method for circuit analysis using KVL. Key steps include drawing the circuit without crossovers, labeling mesh currents clockwise, and writing mesh equations for each loop by inspecting the circuit. Loops are analyzed by writing KVL equations and solving the system of equations for the unknown currents. Several examples demonstrate applying these steps to solve for unknown voltages and currents.
This document summarizes a chapter on resistors in series circuits. It begins by stating the lesson objectives, which are to apply Ohm's Law to calculate voltages, currents and resistances in series circuits. It then provides examples of calculating total resistance, current, and voltages across individual resistors for series circuits. It also describes the characteristics of series circuits, such as the current being the same through all resistors and the total voltage equaling the sum of individual voltages. Finally, it discusses voltage dividers and provides an example of calculating voltages across resistors in a potential divider configuration.
This document provides 116 technical questions covering a wide range of topics including integrated circuits, amplifiers, transistors, digital logic, microprocessors, C programming, electronics, and instrumentation. The questions test knowledge of concepts like heat dissipation, gain calculations, transistor characteristics, digital logic gates, microprocessor instruction cycles, data types, and more.
This document summarizes the specifications of the TDA7386, a quad channel 40W car audio amplifier integrated circuit. It can provide up to 4 x 45W of power into 4 ohm loads with low distortion. It has protections for overheating, short circuits, inductive loads, and overvoltage. It requires few external components due to its integrated gain and compensation.
Temple, San Jose Interconnection App Stamped (1)John Turner
This document provides specifications and calculations for photovoltaic and electrical system components for a 3013.92 kW solar project located at 3636 Murillo Ave, San Jose. It includes specifications for solar modules, inverters, and calculations to determine voltage, current, and conductor sizing in accordance with NEC regulations. Key specifications and results include: the system will include 13,104 solar modules in 936 strings, 5 inverters each with a maximum output of 500kW, DC system voltage of 566.2V, maximum short circuit current of 2016A, and AC conductor sizes between inverters and the point of interconnection of 500 kcmil aluminum.
This document provides a tutorial on semiconductor diodes with 20 practice problems. It covers topics such as determining diode resistance and capacitance from characteristic curves, calculating diffusion current density, and solving circuits that include diodes and zener diodes. The problems involve calculating values such as current, voltage, resistance, capacitance, and concentrations using semiconductor properties, characteristic curves, and circuit equations.
Lab 4 EEL 3552 Amplitude Modulation with MATLAB SimulationsKatrina Little
This document summarizes an experiment on amplitude modulation, demodulation, and envelope detection. An AM signal was generated by modulating a carrier wave with a message signal, then demodulated using two different methods. First, low-pass filtering was used for demodulation, which successfully recovered the original sine and triangle wave signals. Second, a synchronous detector with the carrier signal was used, which also recovered the original signals despite noise issues due to a malfunctioning signal generator. The experiment demonstrated the principles of AM modulation and different demodulation techniques.
This document summarizes key concepts from a chapter on the motion and recombination of electrons and holes in semiconductors.
[1] Carriers in semiconductors undergo both thermal motion due to temperature as well as drift motion in the presence of an electric field. The drift velocity depends on factors like carrier mobility and the electric field.
[2] Carriers can also diffuse from regions of higher concentration to lower concentration. The diffusion current depends on the diffusion constant which is related to carrier mobility via the Einstein relation.
[3] When carriers recombine, they restore equilibrium conditions by decaying over time with a characteristic lifetime. Recombination involves traps and centers that facilitate the process.
Neuroengineering Tutorial: Integrate and Fire neuron modelingZubin Bhuyan
Outline:
Introduction (neurons and models)
Integrate and fire based neuron model
Leaky integrate and fire based neuron model
Spike-Response Model
Mathematical Formulation
Simulating Refractoriness
Fitting to Experimental Data
Variations of SRM
Effects not captured by SRM
Adaptive Exponential Integrate-and-Fire Model
Definition
Adaptation, Delayed spiking, Voltage Response, Initial bursting
Fitting to real Neurons’ data
This document discusses pure resistive, inductive, and capacitive circuits. For each type of circuit:
1) It defines the phase relationship between the voltage and current waveforms. For resistors they are in phase, for inductors the current lags the voltage by 90 degrees, and for capacitors the current leads the voltage by 90 degrees.
2) It presents the equations that define the voltage and current as sinusoidal functions of time.
3) It shows the phasor diagrams that illustrate the phase relationships between voltage and current.
4) It calculates the average power consumed in each type of circuit.
- LEDs emit light when forward biased due to electron-hole recombination in materials like gallium arsenide. The color emitted depends on the material used, with variations in elements like gallium, phosphorus, and arsenic producing different colors.
- Tunnel diodes exhibit negative resistance between peak and valley voltages due to quantum mechanical tunneling effects. This property can be used for oscillation in tunnel diode oscillators.
- Varactor diodes act as variable capacitors, with capacitance varying inversely with applied reverse voltage, allowing them to be used for voltage-controlled oscillation.
This document provides data on axial lead Schottky barrier rectifier devices, specifically models 1N5817, 1N5818, and 1N5819. The key specifications and ratings of the devices are given, including maximum voltage and current ratings, thermal characteristics, and electrical characteristics. Guidelines are provided for determining maximum operating temperatures and voltages based on thermal properties and average forward/reverse power dissipation. Mounting and thermal resistance data is also included to help with heat sinking considerations.
This document discusses transmission lines and the Telegrapher's equation. It begins by introducing transmission lines and their parameters such as resistance, inductance, conductance and capacitance per unit length. It then derives the Telegrapher's equation that describes voltage and current on a transmission line. It shows how the equation can be used to find the propagation constant and solve for voltage and current as a function of position and time. It also discusses phase velocity and provides examples of calculating attenuation constant, phase constant, and phase velocity for different transmission line scenarios.
This document discusses uniform and non-uniform quantization as it relates to PCM systems. It begins with a review of uniform quantization, quantization noise, and signal-to-noise ratio calculations. It then discusses how uniform quantization negatively impacts low amplitude signals like voice. Non-uniform quantization through companding is introduced to increase quantization levels for low amplitudes. The document provides examples of compressors, quantizers, and expanders used in non-uniform quantization systems and examines their effects on voice signals. It concludes with discussions of quantizing noise and designing PCM systems for telephone networks.
This document introduces second-order circuits, which contain two energy storage elements (ESLs) such as capacitors or inductors. Examples include RLC, RL, and RC circuits. Analyzing second-order circuits involves determining initial conditions such as voltage and current values as well as their derivatives. Two examples are provided to demonstrate how to find the initial conditions, transient responses, and final steady-state values for simple RLC circuits when components are switched or sources are changed. The document focuses on source-free circuits initially to examine natural responses before adding independent sources to analyze both transient and steady-state behavior.
'47 Brand is a company founded in 1947 by twin brothers to create athletic apparel and headwear. They have licenses with major sports leagues and colleges. Their products are known for quality craftsmanship and attention to detail. The document provides an overview of '47 Brand's history and values, and previews their Fall/Winter 2013 headwear collection which includes caps, knit hats, and accessories for men, women, and kids in a variety of styles.
Este documento proporciona información sobre la diabetes. Explica que la diabetes ocurre cuando el cuerpo no produce suficiente insulina para transportar el azúcar de la sangre a las células, lo que puede causar complicaciones si no se trata. Detalla los dos principales tipos de diabetes, sus causas y síntomas. Además, enfatiza la importancia de tomar decisiones saludables como mantener un peso saludable, hacer ejercicio y comer bien para prevenir y controlar la diabetes.
This document provides commentary on Isaiah 22, which contains a prophecy about Jerusalem. The commentary discusses the meaning and context of various phrases in the prophecy. It explains that Jerusalem is called "the valley of vision" because it was surrounded by hills and was the place where God revealed visions to the prophets. The prophecy describes the people of Jerusalem fleeing in panic to the flat rooftops of their houses to look for the approaching enemy army. Though confident in their defenses, the city's leaders would be captured and taken away without a battle. The commentary provides historical and cultural context to understand what was being foretold.
Este documento contiene reflexiones de Madre Teresa de Calcuta sobre la importancia de servir a los demás con amor y alegría. Ella enfatiza que debemos tratar a todos los que atendemos con amor para aumentar su esperanza y felicidad, y que el fruto final del servicio desinteresado es la paz.
A empresa de tecnologia anunciou um novo produto, um smartphone com câmera avançada e bateria de longa duração. O aparelho custará menos do que modelos similares e estará disponível em lojas no mês que vem. O lançamento faz parte da estratégia da empresa de oferecer tecnologia de ponta a preços acessíveis.
LDD Southern Summit 2013 - Adido - Creating perfect marriage between offline...Adido
The document discusses how to create an effective marriage between offline and online media for a brand. It emphasizes the importance of communication, shared goals, understanding, compromise, and equality between online and offline campaigns. A successful example is given of Coca-Cola's "Share a Coke" campaign which had creativity, strategy, and synergy across its media. Divorces between online and offline occur when there is no communication, connection, or integration between the channels. The key is for all media to work together with the same messaging and tone of voice.
O documento descreve um sistema CardSplitter que permite dividir o sinal de um cartão de TV paga entre vários receptores. O sistema funciona por cabo ou sem fios e suporta os principais sistemas de codificação. Os testes realizados mostraram que o sistema permite descodificar vários canais simultaneamente em diferentes receptores sem atrasos ou interferências.
Este documento contiene las respuestas de Francisca Pineda a un examen SIMCE de 8o año. En total hay 42 preguntas con respuestas que van desde la letra A hasta la D. Las preguntas parecen cubrir diversos temas de ciencias como química, física y biología.
Pasarela de Reinas y Princesas con animales de la Selva, Ciudad Manuel Doblado Guanajuato, agosto 2014, Periódico el caudillo el periódico de Ciudad Manuel Doblado Guanajuato, Mexico
Este documento es un tributo a un abuelo amoroso recordando los momentos especiales que pasaron juntos y las formas en que siempre estuvo ahí para apoyar a sus nietos, a pesar de sus defectos. Aunque ya falleció, el autor nunca lo olvidará por lo bueno que fue.
This document provides information about the 5th Annual Unmanned Aircraft Systems conference taking place from May 18-21, 2009 in the Washington DC area. The conference will feature panels on warfighter perspectives, OEM technologies, and programs from the various military branches involved in UAS. It will also include focus days on sense and respond systems and UAS subsystems and platforms. The document provides an agenda that highlights speakers and topics to be covered each day, including updates on UAS programs in the US Army and Air Force, homeland security applications, integration into the national airspace, and European defence activities related to UAS.
Este documento presenta la propuesta de continuidad de la gestión actual en Racing Club. Se detallan los logros alcanzados en los últimos tres años en áreas como fútbol profesional, legales, infraestructura, marketing y desarrollo, y se proponen objetivos futuros como finalizar obras en predio y estadio e impulsar el crecimiento del club. La propuesta enfatiza la importancia de mantener la continuidad, profesionalidad y pasión mostradas.
This document summarizes an experiment on the transient response of an RL circuit with a DC input. The experiment aims to study the step response of first-order circuits and understand the concept of the time constant. For an RL circuit with a step voltage input, the output can be expressed by an equation involving the initial and final circuit responses, and the time constant, which is the time required for the response to reach 63% of its final value. The time constant is equal to the inductance divided by the resistance. The circuit diagram and procedures for the experiment are provided.
November 21, 20131How a Diode WorksA diode is an electrica.docxhenrymartin15260
November 21, 2013
1
How a Diode Works
A diode is an electrical device allowing current to flow through in only one direction. The term “diode” is used if I ≤ 1 A. If I>1A, we use the term “rectifier,” although both terms are commonly considered interchangeable.
November 21, 2013
2
Theoretical Analysis of the Rectifier Circuit
Given the circuit below, R1=1.0 kΩ. Sketch theoretical waveforms for the input (CH-1) signal and the output (CH-2) signal when a 10 VPP 1.0 kHz sine wave is applied to the circuit. Predict the result.
November 21, 2013
3
Theoretical Analysis of the Rectifier Circuit- What should we observe (frequency? Amplitude?)
CH-1 (input signal):
(>>t=0:0.00001:6/2000; y=5*sin(2*pi*1000*t); plot(t,y), grid on)
What should be the output signal???
November 21, 2013
4
Simulation of the Rectifier Circuit – Record the Result
Adjust the settings
of the function generator
Accordingly
November 21, 2013
5
Construct the Rectifier Circuit – Record the Result
Compare the theoretical, simulation, and hardware circuit results and make your comments
November 21, 2013
6
Construct the Rectifier Circuit – the O-Scope Display
Hardware circuit oscilloscope display
November 21, 2013
7
Theoretical Analysis of the Filtered Rectifier Circuit
Given the circuit below, R1=1.0 kΩ, C1=10 uF. Sketch theoretical waveforms for the input (CH-1) signal and the output (CH-2) signal when a 10 VPP 1.0 kHz sine wave is applied to the circuit. Predict the result.
November 21, 2013
8
Theoretical Analysis of the Filtered Rectifier Circuit – Output Signal
Given input signal below, what should we observe at the output?
The diode is to change the AC to DC signal
The capacitor is to “smoothen” the DC signal
November 21, 2013
9
Simulation of the Filtered Rectifier Circuit – Record the Result
Adjust the settings
of the function generator
Accordingly
November 21, 2013
10
Construct the Filtered Rectifier Circuit – Record the Result
Compare the theoretical, simulation, and hardware circuit results and make your comments
November 21, 2013
11
Construct the Filtered Rectifier Circuit – O-Scope Display
Hardware circuit oscilloscope display (notice scale change for Channel 2 for better viewing of the output signal)
November 21, 2013
12
Voltage Regulation using Zener Diode – The Circuit
November 21, 2013
13
How a Zener Diode Works
Zener diodes are special diodes which work reverse-biased at breakdown - specific voltage (“Zener voltage”). They are designed to work continuously at that specific voltage - anywhere from 1.8 to 200 V.
November 21, 2013
14
How a Zener Diode Works – The Circuit Example
For the circuit below, the voltage across the Zener diode will be maintained at 10V.
November 21, 2013
15
Voltage Regulation using Zener Diode – MultiSim Simulation (Change Scale on Channel B to view signal more clearly)
Adjust the settings
of the function generator
Accordingly
November 21, 2013
16
Voltage Regulation using the Voltage.
1. The document describes a final project to build an analog PID control circuit using op-amps. It includes objectives, a list of components, and detailed instructions on assembling the circuit and testing it.
2. Key steps include deriving the transfer functions for the proportional, derivative, and integral controllers. Tests are done to observe input-output waveforms for each section alone and for the combined PID controller.
3. Optional tests include modifying the derivative and integral sections, testing with different input signals, closed-loop simulations, and integrating the PID controller into a double integrator plant model.
This document provides an overview of PSPICE and how to use it to simulate analog circuits. It describes the different types of input files for PSPICE, how to define circuit components and models, and the various analysis statements like .OP, .DC, .AC, and .TRAN to set up DC operating point, DC sweep, AC, and transient analyses respectively. It also covers topics like subcircuits, semiconductor device models, and scale factors for numbers in PSPICE.
This paper provides a new approach to reducing high-order harmonics in 400 Hz inverter using a three-level neutral-point clamped (NPC) converter. A voltage control loop using the harmonic compensation combined with NPC clamping diode control technology. The capacitor voltage imbalance also causes harmonics in the output voltage. For 400 Hz inverter, maintain a balanced voltage between the two input (direct current) (DC) capacitors is difficult because the pulse width modulation (PWM) modulation frequency ratio is low compared to the frequency of the output voltage. A method of determining the current flowing into the capacitor to control the voltage on the two balanced capacitors to ensure fast response reversal is also given in this paper. The combination of a high-harmonic resonator controller and a neutral-point voltage controller working together on the 400 Hz NPC inverter structure is given in this paper.
The document summarizes an experiment on analyzing series and parallel RLC circuits. It describes:
1) Calculating the theoretical resonance frequency of a series RLC circuit as 18.8 kHz, but measuring it experimentally as 16.73 kHz, a difference of 11.1%.
2) Plotting the output voltage versus frequency, which reaches a minimum at the theoretical resonance point.
3) Analyzing the phase relationship and impedance characteristics at resonance, finding the voltage and current are in phase.
Detection of Power Line Disturbances using DSP TechniquesKashishVerma18
This document summarizes Kashish Verma's presentation on detecting power line disturbances using digital signal processing techniques. It discusses using Simulink models to simulate normal and disturbed power systems. Various DSP techniques for frequency estimation like Prony analysis, FFT, SVD, MUSIC, and ESPIRIT are described along with their advantages and drawbacks. Detection of faults during power swings using methods like Prony analysis, wavelet transform, and ANFIS is also summarized. Overall, the document provides an overview of modeling power systems and applying DSP for fault detection and frequency estimation.
Assignment 1 Description Marks out of Wtg() Due date .docxfredharris32
Assignment 1
Description Marks out of Wtg(%) Due date
Assignment 1 200 20 28 August 2015
Part A: Comparators and Switching (5%)
(1) Signal limit detector
Use a 339 comparator, a single 74LS02 quad NOR gate and a +5V power supply only to
design a circuit which will detect when a voltage goes outside the range +2.5V to +3.5V
and such that an LED lights and stays lit. Provide a manual reset to extinguish the LED.
Design hints
1. The circuit has an analog input and a digital output so some form of comparator circuit
is required. There are two thresholds so two comparators are required, with the analog
input applied to both. This arrangement is sometimes known as a window detector.
2. Arrange the output of the comparators to be +5V logic levels, and combine the two
outputs logically to produce one signal which is for example, high for out-of-range, and
low for within-range.
3. Latch the change from in-range to out-of-range.
Design procedure
1. Start at the output and work backwards.
2. Select a latch circuit (flip-flop) and determine what combinations of inputs are needed to
latch and then reset it, ensuring that the LED is connected correctly with regard to both
logic and current flow.
3. Determine the logic needed to combine two comparator outputs in such a way as to
correctly operate the latch.
4. Choose comparator outputs which will correctly drive the logic. Remember that the
reference voltage at the input of the comparator may be at either the + or – input.
5. Choose resistors to provide the correct reference voltages.
Note: You will need to consult data for both the 74LS02 and the 339 (see data sheets).
Test
It is strongly recommended that you assemble and test your circuit.
(2) MOSFET Switching
Find out information on the operation of, and configuring of, MOSFETs to be used in
switching circuits. In particular note the differences between BJTs and MOSFETs in this
role. Draw up a table to highlight the differences and hence the pros and cons on each
device for particular situations (eg. Switching high-to-low or low-to-high (ie. P or N type),
high or low current switching, low or high voltage switching).
Consider the following BJT switching circuit. Analyse the operation of the circuit to
understand the parameters involved. Choose suitable replacement MOSFETs to be used
ELE2504 – Electronic design and analysis 2
instead of the output switching BJTs in the given circuit. Include any necessary circuit
changes for the new devices to operate so as to maintain the circuit’s required parameters.
Where Vcc = 12V and Relay resistance = 15Ω .
ELE2504 – Electronic design and analysis 3
Part B: Transistor amplifier design (6%)
Design and test a common emitter amplifier using the circuit shown and the selected
specifications.
Specifications
Get your own spec ...
The document provides instructions for 14 experiments in analog communications lab, including voltage feedback amplifier, amplitude modulation and demodulation, class A power amplifier, RC phase shift oscillator, Hartley and Colpitts oscillators, complementary symmetry push-pull amplifier, DSBSC modulation and demodulation, SSBSC modulation and demodulation, frequency modulation and demodulation, pre-emphasis - de-emphasis circuits, verification of sampling theorem, PAM and reconstruction, PWM and PPM generation and reconstruction, and the effect of noise on communication channels. The experiments are designed to help students learn important concepts in analog signal processing and analog communications systems.
This document summarizes a research paper that proposes using artificial neural networks to generate optimal switching functions for voltage and harmonic control of three-phase inverters. Specifically:
1) A new training algorithm is developed for an artificial neural network to determine switching angles without using pre-computed desired angles. Instead, it uses the desired solution of harmonic elimination equations.
2) Theoretical analysis of the proposed solving algorithm with neural networks is provided. Simulation results show the high performance and advantages of the developed modulator.
3) An artificial neural network is trained using a backpropagation algorithm. Training data comes from optimal switching angles determined through selective harmonic elimination equations for different modulation indices.
This document discusses using artificial neural networks to solve the harmonics elimination problem in three-phase voltage-controlled inverters. It presents a new training algorithm for an ANN that does not use pre-computed switching angles from classical harmonic elimination methods. Instead, it trains the ANN by using the desired solution of the harmonic elimination equations, with the first harmonic equal to the modulation index and higher harmonics equal to zero. Theoretical analysis and simulation results show the high performance of using this ANN approach for generating optimal switching functions to control harmonics in inverters.
The document describes the design and testing of an inverting Schmitt trigger circuit. It begins with the theory of Schmitt trigger operation, explaining that it is an inverting comparator with positive feedback that eliminates noise and causes faster output transitions. It defines the upper and lower threshold voltages and hysteresis width. The experiment aims to design a Schmitt trigger circuit for a given hysteresis value and saturation voltage. The procedure involves building the circuit, applying an input signal, and measuring the output and threshold voltages to verify the designed hysteresis width.
The document discusses regulated DC power supplies and their components. It explains that a regulated DC power supply consists of a step-down transformer, rectifier, filter, and voltage regulator. The transformer steps down AC voltage, the rectifier converts it to DC, the filter smooths the output, and the regulator sets the output to a fixed voltage. It then discusses half-wave and full-wave rectifiers in detail, deriving their key parameters such as DC output voltage and current, ripple factor, and efficiency.
The document summarizes the key components and operation of a regulated DC power supply. It consists of a step-down transformer, rectifier, filter, and voltage regulator. The transformer steps down AC voltage, the rectifier converts it to DC but with variation, the filter smooths the output, and the regulator sets the output to a fixed voltage. Rectifiers are then discussed in more detail, including half-wave and full-wave rectifiers. Key rectifier parameters like DC output voltage and current, ripple factor, and efficiency are defined. Half-wave rectifier operation and analysis is explained through derivations of these parameters.
The document describes the operation and analysis of a series resonant inverter. It consists of three modes: 1) firing thyristor T1, 2) both thyristors off, and 3) firing thyristor T2. The series resonant circuit must be underdamped for proper operation. Several examples are provided to analyze the basic resonant inverter circuit including determining resonant frequency, turn-off time, capacitor voltage, load current, output power, and thyristor currents. Diagrams are included to illustrate the circuit operation.
Achievement of ac voltage traceability and uncertainty of nis, egypt through ...Alexander Decker
This document describes how the National Institute for Standards (NIS) in Egypt achieved traceability of AC voltage measurements through collaboration with the National Institute of Standards and Technology (NIST) in the United States. NIS used thermal voltage converters and micropotentiometers calibrated by NIST to measure AC voltages from 50mV to 200V over a range of frequencies. A bilateral comparison between NIS and NIST found good agreement between their measurement results, within 0.4-13.3 parts per million. Electrical modeling and simulation helped characterize the devices and understand measurement uncertainties. The collaboration helped strengthen NIS's capabilities for traceable AC voltage measurements.
Transient analysis examines how circuit voltages and currents change during a transition between steady state conditions. When a change occurs, such as a switch opening or closing, the circuit moves from one steady state to another.
The summary discusses transient analysis of RC circuits. In a source-free RC circuit, the capacitor voltage decays exponentially with a time constant of RC after a switch change. In a driven RC circuit with a voltage source, the capacitor voltage reaches a final value that is the combination of an exponentially decaying complementary solution and a steady-state particular solution.
Design and Implementation of Schmitt Trigger using Operational AmplifierIJERA Editor
This document describes the design and implementation of a Schmitt trigger circuit using an operational amplifier. A Schmitt trigger is a comparator that detects when a voltage crosses a reference level and has two stable output states. It is useful for conditioning signals. The circuit was designed using an op-amp IC μA-741 to generate a rectangular output waveform from a sinusoidal input. Simulation and experimental results matched and showed the output transitioning at upper and lower threshold points with hysteresis. The Schmitt trigger provides noise immunity and converts analog signals to digital waveforms needed for digital circuits.
MBA Project Report on Impact of Exchange Rate on Balance of Payment (BoP) by ...Moez Ansary
The document is a project report that analyzes the impact of exchange rates on Bangladesh's balance of payments. It includes an introduction outlining the background, objectives, methodology, and limitations of the study. The theoretical aspects chapter defines key terms like balance of payments and exchange rates. It also outlines the major components of Bangladesh's balance of payments accounts, including the current account, capital account, and official reserves account. The study results chapter analyzes correlations between exchange rates and factors like exports, imports, foreign direct investment, and portfolio investment. It also reviews Bangladesh's balance of payments statement and analyzes trends in exports and imports. The conclusion provides recommendations and finds that currency devaluation in Bangladesh has generally increased exports and foreign investment but also
This presentation summarizes a case study about the boom in the software industry in Bangalore, India. It provides an overview of how globalization and economic policy changes enabled the growth of India's software industry and exports. It then answers three questions: 1) why India was able to build a thriving software industry, 2) how the industry will impact future exports and employment, and 3) what can be done to address shortages of qualified workers. The presentation concludes by emphasizing the need to take pragmatic actions to properly utilize opportunities and close gaps between plans and the present situation.
An accounting information system (AIS) is a system that collects records, stores and process data to produce information for decision makers. An accounting information system is generally a computer-based method for tracking accounting activity in conjunction with information technology resources. Generally two types of operational systems are contained in AIS that are manual process and computerized process. Useful accounting information system has some characteristics, principles and key components.
A proper structural Accounting Information System (AIS) is so important part of a banking organization. All banks maintain separate department for Accounting Information System (AIS). For performing their activities they need the help of Information Technology Department (IT). IT department help them by providing computerized and technological support. Banking organizations maintain different AIS than other organizations and their accounting information system is complex. They maintain both manual and computerized AIS, and web based accounting information system. To maintain multi types of accounting information system Banks face some problems in AIS. In manual system records are kept on papers and it’s done by paper-pen work, which required more manpower and time. On the other side in computerized accounting information system data are decentralized for that there is a risk of break down of the systems, stuck of transactions, loss of secrecy and possibility of hacking.
Banks should develop better software to increase the effectiveness of AIS. They should give more emphasis on internal control system, safeguarding assets and information generation or reporting system. In case of external reporting and internal reporting their actives have lots of gap. In comparing with the developed foreign banking sector some banks basically government owned commercial banks should put more emphasis on web based transaction and individual online banking system.
Internship Report on Financial Statements Analysis of FSIBL by Moez AnsaryMoez Ansary
This is helpful for Business Students. Full Internship Report is prepared by Moez Ansary after completing 3 months Internship program in First Security Islami Bank Ltd. (FSIBL) at Amborkhana branch. This report is about Financial Statements Analysis focusing on Islamic banks in Bangladesh. The financial statements are analyzed by horizontal, vertical & ratio analysis. This Internship Report by Moez Ansary is useful for Accounting & Finance Students. This Report was closely supervised by Mr. Iehit Sharma, Senior Lecturer of Business Administration at Leading University.
This document summarizes the real estate business in Sylhet, Bangladesh. It discusses the types of real estate businesses, including land development, apartment development, and renting. It profiles 5 major real estate companies in Sylhet: Next Plan Development Limited, Batayan Shahjalal Developers Ltd., Merline Builders, Royal Homes Limited, and North Surma Syndicate. It analyzes these companies' focuses, business types, reputations and projects. Finally, it examines factors that influence customers' real estate purchasing behaviors, such as economic conditions, motivation, knowledge, personality, lifestyle and social references.
The document discusses real estate business in Sylhet, Bangladesh. It provides an overview of several real estate companies operating in Sylhet, including Next Plan Development Limited, Batayan Shahajalal Developers Ltd., and Merline Builders (Pvt.) Ltd. The document also examines customers' behavior and perceptions regarding real estate purchases. Key factors that influence customers include economic conditions, lifestyle, culture and awareness of potential developer companies. Location is an important consideration for both customers and real estate companies in Sylhet.
Real Estate Business in Sylhet by moez ansaryMoez Ansary
The document discusses real estate business in Sylhet, Bangladesh. It mentions several major real estate companies in Sylhet, including Next Plan Development Limited, Batayan Shahjalal Developers Ltd., Merline Builders (Pvt.) Ltd., Royal Homes Limited, and North Surma Syndicate (Pvt.) Ltd. It also discusses customers' behavior and preferences in purchasing real estate, such as how economic conditions, personality, lifestyle, and culture influence their decisions. Real estate companies aim to understand customer behavior to better meet their needs.
Real Estate Business in Sylhet by moez ansaryMoez Ansary
Several real estate companies operate in Sylhet, Bangladesh, developing residential and commercial properties. These include Next Plan Development Limited, Batayan Shahajalal Developers Ltd., Merline Builders (Pvt.) Ltd., Royal Homes Limited, and North Surma Syndicate (Pvt.) Ltd. The real estate business in Sylhet focuses on developing apartments, housing projects, and other developments to address the growing demand for housing and address the housing shortage issue in urban areas. Customers' purchasing behaviors are influenced by their economic conditions, preferences, motivations, and other demographic and social factors.
This presentation summarizes information about Partex Group, a conglomerate established in Bangladesh in 1959. It provides an overview of Partex Group's history and growth over time to operate in over 10 industries. It details the various sub-units and their product lines, including beverages, food products, furniture, plastics and more. Maps of Partex Group's sales distribution network and corporate goals to expand sales and innovation through research are also presented.
This document is the user's guide for Micro-Cap 10, an electronic circuit analysis software program. It provides an overview of the software's history and development. Key features were added in each new version, with Micro-Cap 10 introducing additional analysis capabilities and an improved schematic editor. The guide is intended to help new users understand how to use the basic features of Micro-Cap 10 to analyze and simulate electronic circuits.
This document provides a 3-page summary of the contents and structure of the Micro-Cap 10 circuit analysis software reference manual. It includes the copyright information, a brief table of contents that lists the 27 chapters and their topics, and a few example sections and commands that are described in the manual.
This tutorial provides instructions on how to use Micro-Cap 10 circuit simulation software. It discusses how to draw schematics by placing components, wiring them together, and setting component properties. Examples are provided to demonstrate diode and transistor I-V characteristic analysis using DC analysis, as well as node voltage analysis over time using transient analysis. The tutorial concludes with an example of setting up two sinusoidal voltage sources with different frequencies.
This document provides an overview of Dutch-Bangla Bank Limited (DBBL) in Bangladesh. It discusses that DBBL is a joint venture private commercial bank established in 1996. It offers various banking services including deposits, loans, SME banking, corporate banking, letters of credit, debit/credit cards, and corporate social responsibility programs. The document provides financial details of DBBL and lists its board of directors and branch locations.
Case study on bella's for analysis of job satisfaction & eeMoez Ansary
This document discusses job satisfaction and employee engagement at a beauty salon called Bella's. Bella's was founded 12 years ago and was successful for over a decade under general manager Lynne Gibson. However, when Lynne left to pursue her master's degree and the owner Illa Fitzgerald took over management duties, profits decreased by 12% due to a lack of management experience. The new general manager Kris Jenkins surveyed employees and found high dissatisfaction with their jobs and the owner-employee relationship. The document provides definitions of job satisfaction and employee engagement and their importance for organizational success. It also gives suggestions for improving job satisfaction at different employee levels at Bella's.
The document discusses intellectual property rights (IPR) in Bangladesh. It provides background on IPR, noting its origins in the 19th century. Problems with protecting IPR in Bangladesh include piracy, internet challenges, immorality, profit motives, and lack of strong IPR laws. IPR can also create issues like monopoly and hindering development. The report aims to analyze IPR in Bangladesh, effectiveness of laws, and impacts of IPR. Limitations include the complexity of IPR, time constraints, and reliance on secondary data due to political conditions.
Impact of IPR slide by Moez Al Azim AnsaryMoez Ansary
The document discusses intellectual property rights (IPR) in Bangladesh. It covers the definition of IPR, relevant laws in Bangladesh, types of IPR including patents, copyrights, trademarks and industrial designs. It also discusses problems with enforcing IPR like piracy, impacts of IPR on innovation and the economy, and criticisms of IPR stifling access. The document presents results of research finding high rates of piracy in Bangladesh despite existing IPR laws, and provides recommendations to better protect and promote IPR.
Real Estate Business In Sylhet provided by MoezMoez Ansary
Real estate companies in Sylhet differentiate themselves through business strategies, type (developer vs. seller), and architectural design. Merline Builders and Royal Homes have good reputations, while North Surma Syndicate is known for design. Customers are influenced by internal factors like preferences and external factors like culture. Their post-purchase behaviors depend on satisfaction, actions, and use of the property. Both companies and customers consider location popularity, environment, and amenities when selecting properties.
BGIC Ltd. is the first general insurance company in Bangladesh, established in 1984. It is headquartered in Dhaka with a branch in Sylhet. BGIC offers various insurance policies including fire, marine cargo and hull, motor vehicle, and liability. Premium rates vary based on property value and risk level. In the event of a loss, BGIC conducts surveys to determine compensation. However, BGIC faces challenges like a lack of trained staff and low public awareness of insurance. Steps are needed to address these issues in order to strengthen the insurance sector in Bangladesh.
In his public lecture, Christian Timmerer provides insights into the fascinating history of video streaming, starting from its humble beginnings before YouTube to the groundbreaking technologies that now dominate platforms like Netflix and ORF ON. Timmerer also presents provocative contributions of his own that have significantly influenced the industry. He concludes by looking at future challenges and invites the audience to join in a discussion.
UiPath Test Automation using UiPath Test Suite series, part 5DianaGray10
Welcome to UiPath Test Automation using UiPath Test Suite series part 5. In this session, we will cover CI/CD with devops.
Topics covered:
CI/CD with in UiPath
End-to-end overview of CI/CD pipeline with Azure devops
Speaker:
Lyndsey Byblow, Test Suite Sales Engineer @ UiPath, Inc.
Pushing the limits of ePRTC: 100ns holdover for 100 daysAdtran
At WSTS 2024, Alon Stern explored the topic of parametric holdover and explained how recent research findings can be implemented in real-world PNT networks to achieve 100 nanoseconds of accuracy for up to 100 days.
Building RAG with self-deployed Milvus vector database and Snowpark Container...Zilliz
This talk will give hands-on advice on building RAG applications with an open-source Milvus database deployed as a docker container. We will also introduce the integration of Milvus with Snowpark Container Services.
GraphSummit Singapore | The Future of Agility: Supercharging Digital Transfor...Neo4j
Leonard Jayamohan, Partner & Generative AI Lead, Deloitte
This keynote will reveal how Deloitte leverages Neo4j’s graph power for groundbreaking digital twin solutions, achieving a staggering 100x performance boost. Discover the essential role knowledge graphs play in successful generative AI implementations. Plus, get an exclusive look at an innovative Neo4j + Generative AI solution Deloitte is developing in-house.
Sudheer Mechineni, Head of Application Frameworks, Standard Chartered Bank
Discover how Standard Chartered Bank harnessed the power of Neo4j to transform complex data access challenges into a dynamic, scalable graph database solution. This keynote will cover their journey from initial adoption to deploying a fully automated, enterprise-grade causal cluster, highlighting key strategies for modelling organisational changes and ensuring robust disaster recovery. Learn how these innovations have not only enhanced Standard Chartered Bank’s data infrastructure but also positioned them as pioneers in the banking sector’s adoption of graph technology.
Climate Impact of Software Testing at Nordic Testing DaysKari Kakkonen
My slides at Nordic Testing Days 6.6.2024
Climate impact / sustainability of software testing discussed on the talk. ICT and testing must carry their part of global responsibility to help with the climat warming. We can minimize the carbon footprint but we can also have a carbon handprint, a positive impact on the climate. Quality characteristics can be added with sustainability, and then measured continuously. Test environments can be used less, and in smaller scale and on demand. Test techniques can be used in optimizing or minimizing number of tests. Test automation can be used to speed up testing.
Unlocking Productivity: Leveraging the Potential of Copilot in Microsoft 365, a presentation by Christoforos Vlachos, Senior Solutions Manager – Modern Workplace, Uni Systems
A tale of scale & speed: How the US Navy is enabling software delivery from l...sonjaschweigert1
Rapid and secure feature delivery is a goal across every application team and every branch of the DoD. The Navy’s DevSecOps platform, Party Barge, has achieved:
- Reduction in onboarding time from 5 weeks to 1 day
- Improved developer experience and productivity through actionable findings and reduction of false positives
- Maintenance of superior security standards and inherent policy enforcement with Authorization to Operate (ATO)
Development teams can ship efficiently and ensure applications are cyber ready for Navy Authorizing Officials (AOs). In this webinar, Sigma Defense and Anchore will give attendees a look behind the scenes and demo secure pipeline automation and security artifacts that speed up application ATO and time to production.
We will cover:
- How to remove silos in DevSecOps
- How to build efficient development pipeline roles and component templates
- How to deliver security artifacts that matter for ATO’s (SBOMs, vulnerability reports, and policy evidence)
- How to streamline operations with automated policy checks on container images
Securing your Kubernetes cluster_ a step-by-step guide to success !KatiaHIMEUR1
Today, after several years of existence, an extremely active community and an ultra-dynamic ecosystem, Kubernetes has established itself as the de facto standard in container orchestration. Thanks to a wide range of managed services, it has never been so easy to set up a ready-to-use Kubernetes cluster.
However, this ease of use means that the subject of security in Kubernetes is often left for later, or even neglected. This exposes companies to significant risks.
In this talk, I'll show you step-by-step how to secure your Kubernetes cluster for greater peace of mind and reliability.
“An Outlook of the Ongoing and Future Relationship between Blockchain Technologies and Process-aware Information Systems.” Invited talk at the joint workshop on Blockchain for Information Systems (BC4IS) and Blockchain for Trusted Data Sharing (B4TDS), co-located with with the 36th International Conference on Advanced Information Systems Engineering (CAiSE), 3 June 2024, Limassol, Cyprus.
Maruthi Prithivirajan, Head of ASEAN & IN Solution Architecture, Neo4j
Get an inside look at the latest Neo4j innovations that enable relationship-driven intelligence at scale. Learn more about the newest cloud integrations and product enhancements that make Neo4j an essential choice for developers building apps with interconnected data and generative AI.
Generative AI Deep Dive: Advancing from Proof of Concept to ProductionAggregage
Join Maher Hanafi, VP of Engineering at Betterworks, in this new session where he'll share a practical framework to transform Gen AI prototypes into impactful products! He'll delve into the complexities of data collection and management, model selection and optimization, and ensuring security, scalability, and responsible use.
Unlock the Future of Search with MongoDB Atlas_ Vector Search Unleashed.pdfMalak Abu Hammad
Discover how MongoDB Atlas and vector search technology can revolutionize your application's search capabilities. This comprehensive presentation covers:
* What is Vector Search?
* Importance and benefits of vector search
* Practical use cases across various industries
* Step-by-step implementation guide
* Live demos with code snippets
* Enhancing LLM capabilities with vector search
* Best practices and optimization strategies
Perfect for developers, AI enthusiasts, and tech leaders. Learn how to leverage MongoDB Atlas to deliver highly relevant, context-aware search results, transforming your data retrieval process. Stay ahead in tech innovation and maximize the potential of your applications.
#MongoDB #VectorSearch #AI #SemanticSearch #TechInnovation #DataScience #LLM #MachineLearning #SearchTechnology
In the rapidly evolving landscape of technologies, XML continues to play a vital role in structuring, storing, and transporting data across diverse systems. The recent advancements in artificial intelligence (AI) present new methodologies for enhancing XML development workflows, introducing efficiency, automation, and intelligent capabilities. This presentation will outline the scope and perspective of utilizing AI in XML development. The potential benefits and the possible pitfalls will be highlighted, providing a balanced view of the subject.
We will explore the capabilities of AI in understanding XML markup languages and autonomously creating structured XML content. Additionally, we will examine the capacity of AI to enrich plain text with appropriate XML markup. Practical examples and methodological guidelines will be provided to elucidate how AI can be effectively prompted to interpret and generate accurate XML markup.
Further emphasis will be placed on the role of AI in developing XSLT, or schemas such as XSD and Schematron. We will address the techniques and strategies adopted to create prompts for generating code, explaining code, or refactoring the code, and the results achieved.
The discussion will extend to how AI can be used to transform XML content. In particular, the focus will be on the use of AI XPath extension functions in XSLT, Schematron, Schematron Quick Fixes, or for XML content refactoring.
The presentation aims to deliver a comprehensive overview of AI usage in XML development, providing attendees with the necessary knowledge to make informed decisions. Whether you’re at the early stages of adopting AI or considering integrating it in advanced XML development, this presentation will cover all levels of expertise.
By highlighting the potential advantages and challenges of integrating AI with XML development tools and languages, the presentation seeks to inspire thoughtful conversation around the future of XML development. We’ll not only delve into the technical aspects of AI-powered XML development but also discuss practical implications and possible future directions.
Removing Uninteresting Bytes in Software FuzzingAftab Hussain
Imagine a world where software fuzzing, the process of mutating bytes in test seeds to uncover hidden and erroneous program behaviors, becomes faster and more effective. A lot depends on the initial seeds, which can significantly dictate the trajectory of a fuzzing campaign, particularly in terms of how long it takes to uncover interesting behaviour in your code. We introduce DIAR, a technique designed to speedup fuzzing campaigns by pinpointing and eliminating those uninteresting bytes in the seeds. Picture this: instead of wasting valuable resources on meaningless mutations in large, bloated seeds, DIAR removes the unnecessary bytes, streamlining the entire process.
In this work, we equipped AFL, a popular fuzzer, with DIAR and examined two critical Linux libraries -- Libxml's xmllint, a tool for parsing xml documents, and Binutil's readelf, an essential debugging and security analysis command-line tool used to display detailed information about ELF (Executable and Linkable Format). Our preliminary results show that AFL+DIAR does not only discover new paths more quickly but also achieves higher coverage overall. This work thus showcases how starting with lean and optimized seeds can lead to faster, more comprehensive fuzzing campaigns -- and DIAR helps you find such seeds.
- These are slides of the talk given at IEEE International Conference on Software Testing Verification and Validation Workshop, ICSTW 2022.
Mind map of terminologies used in context of Generative AI
Tutorial simulations-elec 380
1. ELEC 380 Electronic Circuits II
Tutorial and Simulations for Micro-Cap IV
By
Adam Zielinski
(Posted at: http://wwwece.uvic.ca/~adam/)
Version: August 22, 2002
2. ELEC 380 Electronic Circuits II - Tutorial
ELEC 380 Tutorial and Simulations
Adam Zielinski August 2002
1-1
TUTORIAL
This manual is written for Micro-Cap IV - Electronic Circuit Analysis Program
for Macintosh computers. The PC Version of the program is available at:
www.spectrum-soft.com. Prior to proceeding please familiarize yourself with
the Simulation Tutorial for ELEC 330 posted at:
http://www.ece.uvic.ca/~adam/. In this Tutorial we will explore other
interesting features of the Micro-Cap IV that are relevant to the material covered
in the class. The simulations #1 to #6 are part of preparation to the laboratory
sessions and must be completed before the laboratory and obtained presented to
the laboratory instructor.
1. AC Analysis
The AC analysis allows us to see a frequency response or AC transfer function
H(jω) of a linear circuit. You can imagine that a sinusoidal voltage source with
amplitude 1 volt is applied to a specified node of a circuit (input) and that
voltage and relative phase is measured at a different specified node (output) of
the same circuit. The voltage ratio or voltage gain and relative phase shift
between these two voltages depend on frequency applied. The gain (often
expressed in decibels or dBs) and phase are plotted vs. frequency over the
specified frequency range. Frequency often is displayed in logarithmic scale. In
such scale distance between two frequencies, one 10 times larger than the other is
constant irrespective of absolute frequency and is called a decade. Similarly,
distance between two frequencies - one twice the other is constant irrespectively
of absolute frequency and is called an octave. Such plots are called frequency
responses (amplitude and phase) of a linear circuit.
In electronic circuits we frequently encounter nonlinear elements such as
transistors. For frequency response analysis (AC analysis) such elements are
linearized prior to AC analysis. Any nonlinear circuit can be approximated by a
linear circuit if the signal applied is sufficiently small.
As an illustration let us consider a simple RC circuit shown in Figure T1.
10k
0.5uE1
1 2
.MODEL E1 SIN (F=32 A=1 DC=0 PH=0 RS=1M RP=0 TAU=0 FS=0)
Figure T1. RC Circuit
The voltage source should be added but will not play a role in AC analysis. The
output voltage phasor V(2) at node 2 is equivalent to H(jω), which is a complex
quantity. To get the amplitude response, we need to plot magnitude of H(jω) or
mag(V(2)) which is most frequently expressed in dB. This is reflected in the
dialog box shown in Figure T2 that also includes phase response PH(V(@)). The
3. ELEC 380 Electronic Circuits II - Tutorial
ELEC 380 Tutorial and Simulations
Adam Zielinski August 2002
1-2
frequency range set is from 100 kHz to 1 Hz (if you think that this is a strange
order, I agree)
Figure T2. Dialog Box
The resulting plot in logarithmic frequency axis is shown in Figure T3 with the
cursor.
1 10 100 1K 10K
-40.00
-32.00
-24.00
-16.00
-8.00
0.00
20*log(mag(v(2)))
F
1 10 100 1K 10K
-90.00
-72.00
-54.00
-36.00
-18.00
0.00
PH(V(2))
F
Expression Left Right Delta SlopeExpression Left Right Delta Slope
20*log(mag(v(2))) -3.032 -49.943 -46.911 -4.706m
F 0.032K 10.000K 9.968K 1
Figure T3. The frequency response; amplitude and phase
We can observe that the amplitude frequency response represents a low-pass
filter that attenuates signal at higher frequencies. At a certain frequency the
response reaches linear asymptote with slope of -20dB/decade. We also can see
that a –3dB-point occurs at 32 Hz. This is consistent with so-called 3dB or corner
frequency for RC circuit fc = 1/2πRC. This result can be verified in time domain
by performing transient analysis for signal frequency at fc=32 Hz with set up as
shown in dialog box in Figure T4.
4. ELEC 380 Electronic Circuits II - Tutorial
ELEC 380 Tutorial and Simulations
Adam Zielinski August 2002
1-3
Figure T4 Dialog Box
The results are shown in Figure T5 with cursor activated. We can see that the
output waveform - v(2) has reduced amplitude to 0.707 volts, which corresponds
to 3 dB attenuation as expected. Note also a phase shift between waveforms.
Figure T5 Time domain responses
2. Spectral Analysis
Spectral analysis of a periodic waveform can be performed on time domain data
x(t) using Fast Fourier Transform FFT(x) algorithm. You can think of FFT as a
Fourier Series of an infinite duration periodic waveform made of infinite
repetitions of the time domain waveform of duration T. The fundamental
frequency of Fourier Series of such constructed waveform is equal to 1/T. This
will determine the frequency resolution of spectral analysis based on FFT, that is
∆F=1/T. In order to obtain valid results using FFT it is important to place
complete number of cycles of the waveform within the observation window T.
0m 20m 40m 60m 80m 100m
-1.00
-0.60
-0.20
0.20
0.60
1.00
v(1)
T
v(2)
Expression Left Right Delta Slope
v(1) 0.705 0.951 0.246 4.318
T 42.984m 100.000m 57.016m 1
v(2) 0.705 0.318 -0.387 -6.783
5. ELEC 380 Electronic Circuits II - Tutorial
ELEC 380 Tutorial and Simulations
Adam Zielinski August 2002
1-4
FFT calculates complex numbers and often only its magnitude is of interest.
Function MAG(FFT(x)) calculates the magnitude.
Let's illustrate these points using two sinusoidal waveforms f1=1000Hz with
amplitude 1 and another at f2=2000Hz with amplitude 0.5 as shown in Figure T6
V1 10k V2 10k
.MODEL V1 SIN (F=1000 A=1 DC=0 PH=0 RS=1M RP=0 TAU=0 FS=0)
.MODEL V2 SIN (F=2000 A=0.5 DC=0 PH=0 RS=1M RP=0 TAU=0 FS=0)
Figure T6 Two sinusoidal waveforms
The dialog box in Figure T7 leads to the results shown in Figure 8
Figure T7 Dialog Box
6. ELEC 380 Electronic Circuits II - Tutorial
ELEC 380 Tutorial and Simulations
Adam Zielinski August 2002
1-5
Figure T8 Spectral representation of two harmonic signals
The frequency points are separated by ∆F = 100Hz as expected. Each frequency
component is represented by only one point in the spectrum (triangular shape is
due to the way the points are joined by lines) and two waveforms are fully
resolved. The absolute amplitude of spectral components is related to sampling
frequency of the time-domain waveforms – the higher the sampling rate, the
larger the spectral amplitude. The relative amplitudes and frequency positions of
the two spectral components are as expected.
3. Tolerances
Value of parameters of any physical electronic component is given within certain
limits defined by tolerances. For instance, set of resistors with tolerances 10% (or
10 % lot) means that an actual individual resistor will have a random value
between +/- 10% of its nominal value. Simulation allows us to investigate finite
tolerances effect on overall performance of circuit built using real components.
Several simulations are to be performed and a random value of a component
within specified tolerances is assigned at each run. This is so called Monte Carlo
method (guess where the name came from?). For Worst Case option the
parameter is assigned randomly but only at limits of its tolerances. For N
parameters this gives 2^N possible combinations. To establish good confidence
level, the number of simulations n > 2^N.
7. ELEC 380 Electronic Circuits II - Tutorial
ELEC 380 Tutorial and Simulations
Adam Zielinski August 2002
1-6
As an illustration let's go back to the simple circuit from Figure T1 but assume
that the resistor is from 10% lot. With this modification the circuit becomes as
shown in Figure T9.
10k LOT=10%
0.5uE1
1 2
.MODEL E1 SIN (F=32 A=1 DC=0 PH=0 RS=1M RP=0 TAU=0 FS=0)
Figure T9 RC Circuit with uncertain resistor value
We will proceed to investigate its frequency response as in Figure T3.
The dialog box for Monte Carlo analysis is shown in Figure T10 and the results
are shown in Figure T11.
Figure T10 Dialog Box for Random Simulation n=10
Figure T11 Amplitude frequency response for n=10 simulations
8. ELEC 380 Electronic Circuits II - Tutorial
ELEC 380 Tutorial and Simulations
Adam Zielinski August 2002
1-7
4. Temperature effects
All real electronic elements change their parameters with temperature changes.
This applies to passive elements like resistors as well as to active ones like
transistors or Operational Amplifier. Simulation is an ideal and simple method to
determine the effect of temperature on a circuit. Consider a simple voltage
divider shown in Figure T12.
R1
R210
1 2
.Define R2 100K
.Define R1 100K TC=0.001
Figure T12 Voltage divider circuit
Here we use symbols for resistors that need to be defined. Nominal value for
both resistors is 100 kohms but resistor R1 changes its value with temperature as
determined by its temperature coefficient TC= 0.001. This coefficient specifies
how much the resistance will change from its nominal value at nominal
temperature for a one degree Centigrade of the difference between the nominal
temperature (27 degrees) and the actual one. We will illustrate this by running a
transient analysis with printout. The dialog box is shown in Figure T13.
Figure T13 Dialog box for temperature variation
9. ELEC 380 Electronic Circuits II - Tutorial
ELEC 380 Tutorial and Simulations
Adam Zielinski August 2002
1-8
The simulation is run from temperatures –27 degrees to 27 degrees in steps of 27.
The numerical results obtained are shown in Figure T14
Micro-Cap IV
Transient Analysis Limits of Temperature
Date 8/8/02 Time 10:21 PM
Temperature= -27 Case= 1
T v(2)
(uSec) (V)
0.000 5.139
0.200 5.139
0.400 5.139
0.600 5.139
0.800 5.139
1.000 5.139
Temperature= 0 Case= 1
T v(2)
(uSec) (V)
0.000 5.068
0.200 5.068
0.400 5.068
0.600 5.068
0.800 5.068
1.000 5.068
Temperature= 27 Case= 1
T v(2)
(uSec) (V)
0.000 5.000
0.200 5.000
0.400 5.000
0.600 5.000
0.800 5.000
1.000 5.000
Figure T 14 The temperature effects
We can see that the divider functions properly only for the nominal temperature
of 27 degrees but the voltage is higher for other temperatures. This is due to a
lower resistance of R2 at lower temperatures.
10. ELEC 380 Electronic Circuits II — Simulation #1
ELEC 380 Tutorial and Simulations
Adam Zielinski August 2002
2-1
SIMULATION #1
Small Signal Amplifiers
This simulation is part of preparation to the Laboratory Session #1.
1. Design the CE amplifier shown in Figure 1-1 for biasing current IE=1mA and
gain of 36 (31.1dB) at frequency 1kHz. Note that components values shown in
Figure 1-1 are not unique.
56k
10k
910
1uF
62uF
15
1.5k
2N3904
MV1
.MODEL 2N3904 NPN (BF=378.5 BR=2 IS=15.8478P CJC=3.62441P CJE=4.35493P
RC=1.00539U VAF=101.811 TF=666.564P TR=173.154N MJC=300M VJC=770.477M
MJE=403.042M VJE=1 NF=1.34506 ISE=61.1468P ISC=0.00155473F IKF=14.2815M
IKR=35.709 NE=2.02174 RE=1.10494 VTF=10 ITF=9.79838M XTF=499.979M
)
.MODEL MV1 SIN (F=1K A=5M DC=0 PH=0 RS=1M RP=0 TAU=0 FS=0)
V iVs
Vcc
Vo
Ve
Figure 1-1 CE Amplifier
2. Select the proper values for the ac source (10mVp-p, f=1kHz) and transistor
(beta= BF= 150).
3. Set the proper simulation parameters for transient analysis (see dialog
box shown in Figure 1-2) and confirm the dc and ac conditions by
simulation.
Figure 1-2 Dialog Box
11. ELEC 380 Electronic Circuits II — Simulation #1
ELEC 380 Tutorial and Simulations
Adam Zielinski August 2002
2-2
Note that under the Transient – Option menu the option of calculating the
operating dc-point was selected. This allows us to see the waveforms in steady
state. Shown in Figure 1-3 is a result:
0m 1m 2m 3m 4m 5m
-5.00m
-3.00m
-1.00m
1.00m
3.00m
5.00m
Vs
T
0m 1m 2m 3m 4m 5m
13.85
13.93
14.01
14.09
14.17
14.25
Vo
T
Figure 1-3 Transient Analysis
After running transient analysis select the “state variables” under Transient
Analysis Menu. You can read numerical values of dc for all nodes: In this
particular case we got:
Figure 1-4 State Variables
This feature is very convenient to verify the dc-analysis. Alternatively, you can
select Node voltages and Node numbers as shown in Figure 1-5
12. ELEC 380 Electronic Circuits II — Simulation #1
ELEC 380 Tutorial and Simulations
Adam Zielinski August 2002
2-3
Figure 1-5 Node Voltages and Node Numbers
You may observe that a waveform at node 3 (output waveform) do not oscillate
exactly around 14V, as we would expect. Can you explain it?
3. To see the gain vs. frequency we should run an ac analysis. Let us select
the following parameters shown in Figure 1-6
Figure 1-6 Dialog Box
13. ELEC 380 Electronic Circuits II — Simulation #1
ELEC 380 Tutorial and Simulations
Adam Zielinski August 2002
2-4
The result is shown in Figure 1-7
100 1K 10K 100K
25.00
26.00
27.00
28.00
29.00
30.00
dB(Vo/Vi)
F
Figure 1-7 Frequency response
You can see from the graph the gain becomes independent of frequency from
approximately 1kHz.The lower freq. of operation is frequently defined as
frequency when the gain drops by 3dB compare to the flat portion of the
frequency response. In this case we have the lower frequency of operation at 150
Hz.
5. Investigate the effects of temperature on the gain by ac analysis and
temperature variation from 0 to 100 degrees in 50 degree steps. What
parameters in the circuit is temperature dependent? The results are shown in
Figure 1-8
14. ELEC 380 Electronic Circuits II — Simulation #1
ELEC 380 Tutorial and Simulations
Adam Zielinski August 2002
2-5
100 1K 10K 100K
25.00
26.00
27.00
28.00
29.00
30.00
dB(Vo/Vi)
F
Expression Left Right Delta Slope
dB(Vo/Vi) 25.669 27.355 1.686 16.879u
F 0.100K 100.000K 99.900K 1
Figure 1-8 Frequency response with a realistic component
15. ELEC 380 Electronic Circuits II —Simulation #2
ELEC 380 Tutorial and Simulations
Adam Zielinski August 2002
3-1
SIMULATION #2
Large Signal Amplifiers
This simulation replaces the Procedures part of the Laboratory Session #3 and
should be done prior to the lab. We will introduce here the Fourier Analysis
(FFT) in Micro-Cap IV
1. Consider the same circuit as in Simulation #1 and shown in Figure 2-1
R1
R2
RC
C1
C2
VCC
RE
C3
RLV s
2N3904
.MODEL Vs SIN (F=10K A=15M DC=0 PH=0 RS=1M RP=0 TAU=0 FS=0)
.MODEL 2N3904 NPN (BF=378.5 BR=2 IS=15.8478P CJC=3.62441P CJE=4.35493P
RC=1.00539U VAF=101.811 TF=666.564P TR=173.154N MJC=300M VJC=770.477M
MJE=403.042M VJE=1 NF=1.34506 ISE=61.1468P ISC=0.00155473F IKF=14.2815M
IKR=35.709 NE=2.02174 RE=1.10494 VTF=10 ITF=9.79838M XTF=499.979M
)
Vo
V i
Ve
Vc
.DEFINE RL 1K
.DEFINE RC 5K
.DEFINE RE 1K
.DEFINE VCC 9
f=10kHz
Figure 2-1 Large Signal Amplifier
Design the amplifier shown in Figure 2-1 for the maximum output compliance.
Note: the analytic results in this case will not be accurate because of large
distortion present for a large signal applied to CE amplifier. Assume: RL=1k,
RC=5k, RE=1k and frequency of operation f=10kHz. In this simulation the values
of some resistors and capacitors are not given and must be found to obtain:
Voltage gain: 42.2 or 32.2dB
Output compliance: PP=2.2V
2. Simulate the circuit you have designed. Investigate the gain of the amplifier
and all dc-voltages in the circuit.
First we check the frequency response of the circuit using ac analysis. Result is
shown in Figure 2-2.
16. ELEC 380 Electronic Circuits II —Simulation #2
ELEC 380 Tutorial and Simulations
Adam Zielinski August 2002
3-2
100 1K 10K 100K
20.00
24.00
28.00
32.00
36.00
40.00
dB(Vo/Vi)
F
Expression Left Right Delta Slope
dB(Vo/Vi) 3.085 28.874 25.790 258.155u
F 0.100K 100.000K 99.900K 1
Figure 2-2 Frequency Response of the Amplifier
As we can see the amplifier has the gain is 29 dB, which is less than expected.
Investigate and comment of this discrepancy possibly caused by an error in the
software.
2. Now perform the transient analysis.
3.
The maximum calculated input signal to avoid output clipping is 55 mV p-p but
we will drive the input with signal 30mVp-p. In simulation select the dc-point
calculation in order to avoid transients due to capacitances in the circuit.
The result are shown in Figure 2-3
17. ELEC 380 Electronic Circuits II —Simulation #2
ELEC 380 Tutorial and Simulations
Adam Zielinski August 2002
3-3
0u 60u 120u 180u 240u 300u
-15.00m
-9.00m
-3.00m
3.00m
9.00m
15.00m
Vs1
T
0u 60u 120u 180u 240u 300u
1.00
1.40
1.80
2.20
2.60
3.00
Vc
T
Figure 2-3 Input and output signals
Note that the output waveform is quite distorted. This is due to nonlinear
characteristic of the transistor that shows up for large signal operation. The peak-
to-peak output in this case is 0.8 Vp-p.
4. Spectral (Fourier) Analysis
5.
The Fourier analysis performs Fourier series expansion of the analyzed signal
using FFT algorithm as discussed in Tutorial. As noted it is important that you
select a complete number of cycles to assure smooth boundary between
repetitions. If the boundary contains discontinuity, higher order harmonics will
be computed which are not present in the actual waveform.
Perform the transient analysis and select the following parameters as shown in
Figure 2-4. The display will show magnitude of FFT vs. selected range of
frequencies.
Figure 2-4 Parameters for FFT
18. ELEC 380 Electronic Circuits II —Simulation #2
ELEC 380 Tutorial and Simulations
Adam Zielinski August 2002
3-4
The result is shown in Figure 2-5
0K 10K 20K 30K 40K 50K
0.00
140.00
280.00
420.00
560.00
700.00
mag((FFT(Vc)))
F
Figure 2-5 The Results of FFT
We can see a dc-component is present at zero frequency; fundamental frequency
component is present at 10kHz and higher harmonics at multiple of 10 kHz. We
can access the numerical values by selecting the “N” option in “Transient
Analysis Limits” and the results are shown in Figure 2-6
Figure 2-6 The numerical Results of FFT
You can see that the second harmonic distortion in this case is (4.281/52.49) x
100% = 8%. Would you by a stereo with such distortion? What is the acceptable
value?
19. ELEC 380 Electronic Circuits II — Simulation #3
ELEC 380 Tutorial and Simulations
Adam Zielinski August 2002
4-1
SIMULATION #3
Frequency Response
This simulation is part of preparation to the laboratory Session #4.
1. Consider the circuit similar to that used in Simulation #2 and shown in Figure
3-1:
R1
R2
RC
C1
C2V s
VCC
1K
C3
1K
2N3904
50
f=10kHz
.MODEL 2N3904 NPN (BF=378.5 BR=2 IS=15.8478P CJC=3.62441P CJE=4.35493P
RC=1.00539U VAF=101.811 TF=666.564P TR=173.154N MJC=300M VJC=770.477M
MJE=403.042M VJE=1 NF=1.34506 ISE=61.1468P ISC=0.00155473F IKF=14.2815M
IKR=35.709 NE=2.02174 RE=1.10494 VTF=10 ITF=9.79838M XTF=499.979M
)
.MODEL Vs SIN (F=10K A=15MV DC=0 PH=0 RS=50 RP=0 TAU=0 FS=0)
V i
VoVc
Ve
Vs1
Figure 3-1 Amplifier
The input is Vs1 and the output is Vo. The resistor Rs=50 represents the internal
resistance of the driving source.
2. Design the amplifier for 3dB lower frequency fL=10 kHz and midband
gain Vo/Vs of 20 (or 26dB). Assume and set the following parameters for
the transistor.
3. Confirm you design by simulation.
Simulations.
Run the ac analysis. Figure 3-2 shows what you might obtain
20. ELEC 380 Electronic Circuits II — Simulation #3
ELEC 380 Tutorial and Simulations
Adam Zielinski August 2002
4-2
1K 10K 100K 1M
10.00
14.00
18.00
22.00
26.00
30.00
dB(Vo/Vi)
F
Expression Left Right Delta Slope
dB(Vo/Vi) -2.735 23.182 25.917 25.942u
F 0.001M 1.000M 0.999M 1
Figure 3-2 Frequency Response of the amplifier
4. Assume the transistor parameters as given in the model and predict the
upper frequency of operation of your amplifier. Compare it with the result
obtained by simulation and shown in Figure 3-3:
1K 10K 100K 1M 10M 100M 1G
10.00
14.00
18.00
22.00
26.00
30.00
dB(Vo/Vi)
F
Expression Left Right Delta Slope
dB(Vo/Vi) 23.178 8.186 -14.991 -14.994n
F 0.199M 1000.000M 999.801M 1
Figure 3-3 Lower and upper frequency of operation
21. ELEC 380 Electronic Circuits II - Simulation #4
ELEC 380 Tutorial and Simulations
Adam Zielinski August 2002
5-1
SIMULATION #4
Differential Amplifiers
This simulation is part of preparation to the laboratory Session #5.
Consider the differential amplifier that will be used in the laboratory and shown
in Figure 4-1:
1.5K
10MV
15
47 47
2N3904 2N3904
2.2K
-15
.MODEL 2N3904 NPN (BF=378.5 BR=2 IS=15.8478P CJC=3.62441P CJE=4.35493P
RC=1.00539U VAF=101.811 TF=666.564P TR=173.154N MJC=300M VJC=770.477M
MJE=403.042M VJE=1 NF=1.34506 ISE=61.1468P ISC=0.00155473F IKF=14.2815M
IKR=35.709 NE=2.02174 RE=1.10494 VTF=10 ITF=9.79838M XTF=499.979M
)
.MODEL 10MV SIN (F=1K A=10MV DC=0 PH=0 RS=1M RP=0 TAU=0 FS=0)
V i
Vo
Figure 4-1 Differential amplifier
1. Perform the transient and frequency analysis using Vi as the input Vo as the
output. The results are shown in Figure 4-2 and Figure 4-3
0m 0.60m 1.20m 1.80m 2.40m 3m
-10.00m
-6.00m
-2.00m
2.00m
6.00m
10.00m
Vi
T
0m 0.60m 1.20m 1.80m 2.40m 3m
10.12
10.17
10.21
10.26
10.31
10.36
Vo
T
Figure 4-2 Transient analysis
22. ELEC 380 Electronic Circuits II - Simulation #4
ELEC 380 Tutorial and Simulations
Adam Zielinski August 2002
5-2
1K 10K 100K 1M 10M 100M
10.00
14.00
18.00
22.00
26.00
30.00
dB(Vo/Vi)
F
Figure 4-3 AC Analysis
2. Modify the circuit as shown in Figure 4-4 and repeat the measurements:
1.5K
10MV
15
47 47
2N3904 2N3904
2.2K
-15
.MODEL 2N3904 NPN (BF=378.5 BR=2 IS=15.8478P CJC=3.62441P CJE=4.35493P
RC=1.00539U VAF=101.811 TF=666.564P TR=173.154N MJC=300M VJC=770.477M
MJE=403.042M VJE=1 NF=1.34506 ISE=61.1468P ISC=0.00155473F IKF=14.2815M
IKR=35.709 NE=2.02174 RE=1.10494 VTF=10 ITF=9.79838M XTF=499.979M
)
.MODEL 10MV SIN (F=1K A=10MV DC=0 PH=0 RS=1M RP=0 TAU=0 FS=0)
V i
Vo
Figure 4-4 Modified Circuit
23. ELEC 380 Electronic Circuits II - Simulation #4
ELEC 380 Tutorial and Simulations
Adam Zielinski August 2002
5-3
0m 0.60m 1.20m 1.80m 2.40m 3m
-10.00m
-6.00m
-2.00m
2.00m
6.00m
10.00m
Vi
T
0m 0.60m 1.20m 1.80m 2.40m 3m
10.11
10.16
10.21
10.26
10.31
10.36
Vo
T
Figure 4-5 Transient analysis
1K 10K 100K 1M 10M 100M
10.00
14.00
18.00
22.00
26.00
30.00
dB(Vo/Vi)
F
Expression Left Right Delta Slope
dB(Vo/Vi) 21.834 16.438 -5.395 -53.952n
F 0.001M 100.000M 99.999M 1
Figure 4-6 AC analysis
3. Modify the circuit as shown in Figure 4-7 and perform the time and the frequency
analysis (note that we have to increase amplitude of the input signal).
24. ELEC 380 Electronic Circuits II - Simulation #4
ELEC 380 Tutorial and Simulations
Adam Zielinski August 2002
5-4
1.5K
1000MV
15
47 47
2N3904 2N3904
2.2K
-15
.MODEL 2N3904 NPN (BF=378.5 BR=2 IS=15.8478P CJC=3.62441P CJE=4.35493P
RC=1.00539U VAF=101.811 TF=666.564P TR=173.154N MJC=300M VJC=770.477M
MJE=403.042M VJE=1 NF=1.34506 ISE=61.1468P ISC=0.00155473F IKF=14.2815M
IKR=35.709 NE=2.02174 RE=1.10494 VTF=10 ITF=9.79838M XTF=499.979M
)
.MODEL 1000MV SIN (F=1K A=1000MV DC=0 PH=0 RS=1M RP=0 TAU=0 FS=0)
V i
Vo
Figure 4-7 Modified Circuit
0m 0.60m 1.20m 1.80m 2.40m 3m
-1.00
-0.60
-0.20
0.20
0.60
1.00
Vi
T
0m 0.60m 1.20m 1.80m 2.40m 3m
9.91
10.04
10.17
10.30
10.44
10.57
Vo
T
Figure 4-8 Transient analysis
25. ELEC 380 Electronic Circuits II - Simulation #4
ELEC 380 Tutorial and Simulations
Adam Zielinski August 2002
5-5
1K 10K 100K 1M
-20.00
-16.00
-12.00
-8.00
-4.00
0.00
dB(Vo/Vi)
F
Expression Left Right Delta Slope
dB(Vo/Vi) -9.612 -9.602 0.010 10.186n
F 0.001M 1.000M 0.999M 1
Figure 4-9 AC analysis
4. Interpret all the results obtained and compare them with calculations
26. ELEC 380 Electronic Circuits II - Simulation #5
ELEC 380 Tutorial and Simulations
Adam Zielinski August 2002
6-1
SIMULATION #5
Instrumentation Amplifier using Op. Amp
This simulation is part of preparation to the Laboratory Session #7. We will
investigate the effects of finite tolerances on the circuit performance.
The basic data for a general purpose Op. Amp like LM 741 and for comparison
for a better performance LM 107 are given in Figure 5-1
Figure 5-1 LM741 and LM 107 Data Sheets
Task:
An instrumentation amplifier with differential gain of 10 is required to operate in
the frequency band from 1kHz to 10kHz. Design such an amplifier using 1%
resistors and 741 Op. Amp with finite tolerances of its parameters.
Confirm is operation and specify the tolerance of the differential gain and the
minimum CMRR your amplifier can provide within the specified band.
27. ELEC 380 Electronic Circuits II - Simulation #5
ELEC 380 Tutorial and Simulations
Adam Zielinski August 2002
6-2
1. We will start by designing a simple instrumentation amplifier and check its
differential gain using the circuit below. The first stage serves only as an
inverter to generate inverted signal needed to drive the amplifier with the
differential signal only. You might check that it does not introduce any error
in the frequency band of interest.
LM74110K
10K
1K
1K 10K
10K
V
LM301A
18
18
18
18
.MODEL V SIN (F=1MEG A=1 DC=0 PH=0 RS=1M RP=0 TAU=0 FS=0)
Vs Vo
.MODEL LM741 OPA (LEVEL=2 ROUTAC=50 ROUTDC=75 IOFF=20N IBIAS=80N
VEE=-18 VCC=18 VPS=16 VNS=-16 CMRR=31.6228K)
.MODEL LM301A OPA (LEVEL=2 TYPE=3 A=160K ROUTAC=50 ROUTDC=75
VOFF=2M IOFF=3N IBIAS=70N VEE=-18 VCC=18 VPS=14 VNS=-14)
Figure 5-2 Instrumentation Amplifier
Its frequency response is shown in Figure 5-3.
28. ELEC 380 Electronic Circuits II - Simulation #5
ELEC 380 Tutorial and Simulations
Adam Zielinski August 2002
6-3
100 1K 10K 100K
10.00
14.00
18.00
22.00
26.00
30.00
db(vo/vs)
F
Figure 5-3 Frequency Response
2. Proceed by allowing finite tolerance in the components used to built the
amplifier.
This is done by specifying the value of a component (resistors in our case) from a
5% LOT
Proceed with the simulation. If only one run is selected, the nominal values for
components are assumed. For M runs tolerance limits are randomly selected. For
N parameters this gives 2^N possible combinations. To establish a good
confidence level M>>2^N.
The result obtained for 30 runs is shown in Figure 5-4.
29. ELEC 380 Electronic Circuits II - Simulation #5
ELEC 380 Tutorial and Simulations
Adam Zielinski August 2002
6-4
100 1K 10K 100K
10.00
14.00
18.00
22.00
26.00
30.00
DB(Vo/Vs)
F
Figure 5-4 Frequency response with random parameters
3. Modify the circuit as shown in Figure 5-5 to drive it with common mode
signal only and perform the ac analysis:
30. ELEC 380 Electronic Circuits II - Simulation #5
ELEC 380 Tutorial and Simulations
Adam Zielinski August 2002
6-5
LM74110K
10K
1K
1K 10K
10K
V
LM301A
18
18
18
18
.MODEL V SIN (F=1MEG A=1 DC=0 PH=0 RS=1M RP=0 TAU=0 FS=0)
Vs Vo
.MODEL LM741 OPA (LEVEL=2 ROUTAC=50 ROUTDC=75 IOFF=20N IBIAS=80N
VEE=-18 VCC=18 VPS=16 VNS=-16 CMRR=31.6228K)
.MODEL LM301A OPA (LEVEL=2 TYPE=3 A=160K ROUTAC=50 ROUTDC=75
VOFF=2M IOFF=3N IBIAS=70N VEE=-18 VCC=18 VPS=14 VNS=-14)
Figure 5-5 Common Mode Signal
The Common Mode AC response is shown in Figure 5-6.
100 1K 10K 100K
-110.00
-95.00
-80.00
-65.00
-50.00
-35.00
db(vo/vs)
F
Figure 5-6 Common Mode response
4. From your plots deduce all the required parameters of the inst. amp and
comment on the results obtained.
31. ELEC 380 Electronic Circuits II —Simulation #6
ELEC 380 Tutorial and Simulations
Adam Zielinski August 2002
7-1
SIMULATION #6
Design of a low – pass filter
This simulation replaces Laboratory Session #10.
Tasks:
1. Design the 3rd
order LP Butterworth filter with 3dB bandwidth of 10kHz and
gain of 10
2. Check your design by simulation with the exact component values.
3. Select components with 5% tolerances and check the envelope of the frequency
response for 50 runs.
4. Apply square waveform of 8kHz to your filter and observe the output.
Shown in Figure 6-1 is a sample circuit:
10K
10K
10K
10K
40K
10K
1.59NF1.59NF
1.59NF
10K
V
LM741
LM741
18
18
18
18
.MODEL V SIN (F=1MEG A=1 DC=0 PH=0 RS=1M RP=0 TAU=0 FS=0)
Vs
Vo
.MODEL LM741 OPA (LEVEL=2 ROUTAC=50 ROUTDC=75 IOFF=20N IBIAS=80N
VEE=-18 VCC=18 VPS=16 VNS=-16 CMRR=31.6228K)
Figure 6-1 Low-pass filter
32. ELEC 380 Electronic Circuits II —Simulation #6
ELEC 380 Tutorial and Simulations
Adam Zielinski August 2002
7-2
The frequency response for the exact components’ values is presented in
Figure 6-2.
1K 10K 100K
2.00
6.00
10.00
14.00
18.00
22.00
db(Vo/Vs)
F
Figure 6-2 Frequency response of the filter
Filter response with the 5% components and 50 runs with randomly varying
parameters is shown in Figure 6-3
1K 10K 100K
2.00
6.00
10.00
14.00
18.00
22.00
db(Vo/Vs)
F
Figure 6-3 Frequency response with finite tolerances