The document discusses a study on building a multi-headed model for detecting various types of online toxicity, including threats, obscenity, insults, and identity-based hate. It details the methodology, including the use of a Wikipedia corpus dataset for training, feature engineering, and the evaluation of different classifiers like logistic regression and random forest. The conclusion suggests that while standard machine learning methods achieve a certain level of accuracy, deep learning techniques are necessary to significantly improve performance.


![International Journal of Trend in Scientific Research and Development (IJTSRD) @ www.ijtsrd.com eISSN: 2456-6470
@ IJTSRD | Unique Paper ID - IJTSRD23464 | Volume – 3 | Issue – 4 | May-Jun 2019 Page: 27
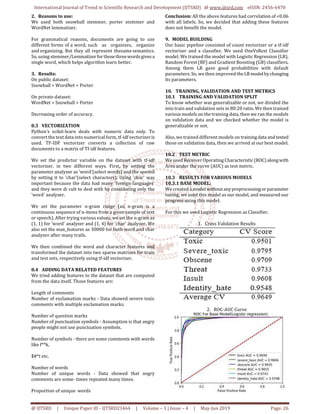
10.3.2 Random Forest:
Next, we created our model using Random Forest. We used
n_estimators = 10 and random_state = 1 as parameters.
We observed the following results:
1. Cross Validation Results
2. ROC – AUC Curve
From the Cross Validation results table and ROC-AUC Curve,
it is clear that Random Forest performs poorly compared to
our base model itself, so we proceeded to tune parameters
for Logistic Regression for better accuracy.
10.3.3 LOGISTIC REGRESSION
I. We created one model using C = 4 as parameter. The
following results were observed.
1. Cross Validation Results
2. ROC –AUC Curve
II. We created another Logistic Regression by selecting the
best parameters by cross - validating the following
parameters.
3. Cross Validation Results
4. ROC – AUC Curve
Though, (i) gave better score compared to (ii) on validation
set, with difference in order of 0.0001. When run on the
actual data (ii) was found to better than (i).
11. CONCLUSION
After checking the kaggle discussion board of the actual
competition, standard Machine Learning approaches yield a
maximum score of 0.9792, irrespective of any approach. In
order to get a large margin over this score one has to employ
Deep Learning (DL) techniques.
12. REFERENCES
[1] https://blog.citizennet.com/blog/2
012/11/10/random-forests-ensembles-and-performa
[2] https://www.data-to-viz.com/
[3] https://www.kaggle.com/jagangupt a/stop-the-s-toxic-
comments-eda](https://image.slidesharecdn.com/7toxiccommentclassification-190703120819/85/Toxic-Comment-Classification-4-320.jpg)