Download to read offline
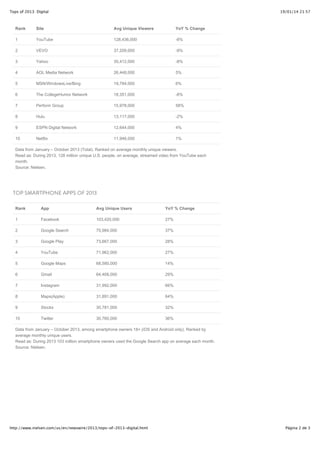
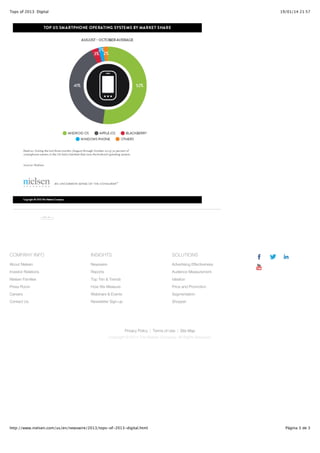

Digital media continued to grow in 2013, with online video viewing and smartphone use increasing. YouTube remained the top source for online video streaming, viewed by 128 million Americans each month. Facebook was the most used smartphone app, on 103 million devices monthly. Instagram saw the fastest growth among top apps, with unique users up 66%. Google remained the top online brand but saw declines along with other major sites like Facebook and Yahoo.