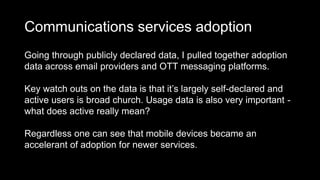
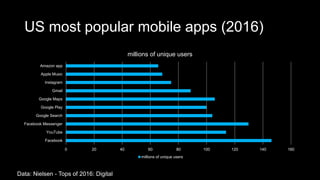
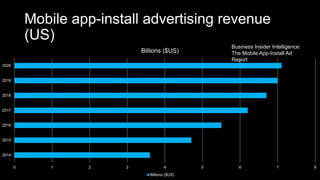
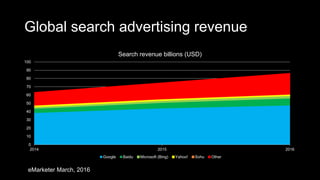
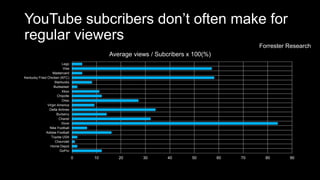
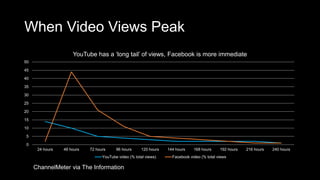
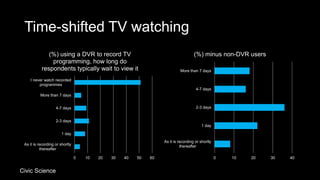
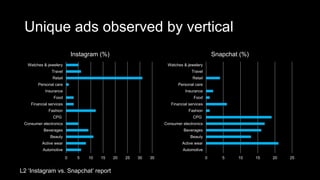
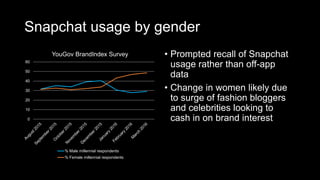
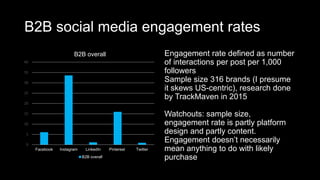
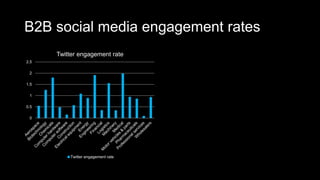
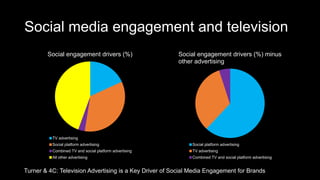
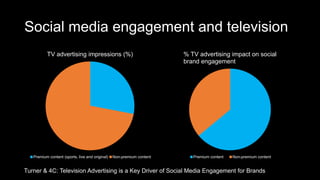
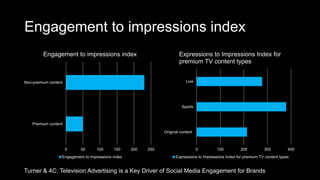
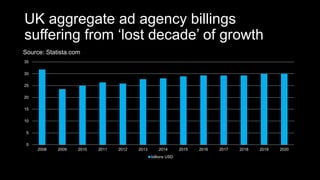
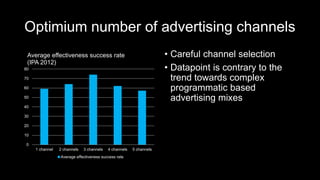
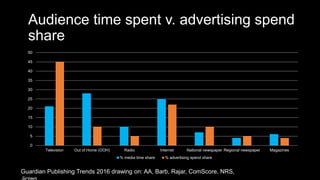
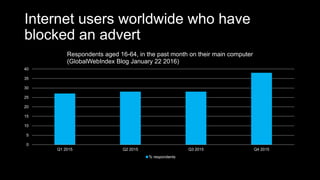
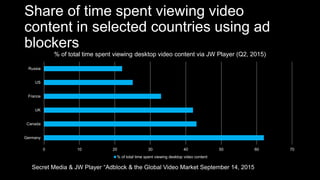
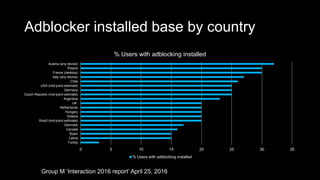
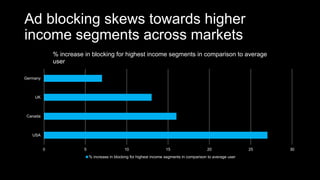
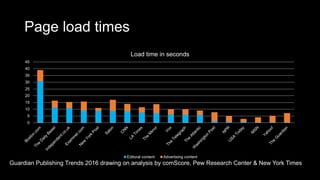
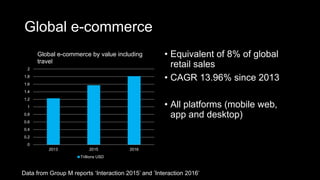
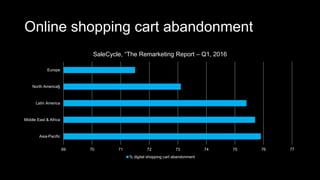
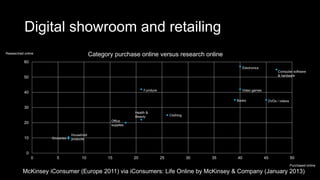
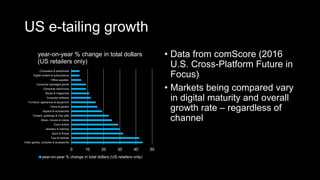
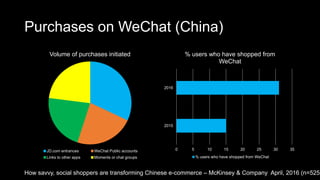
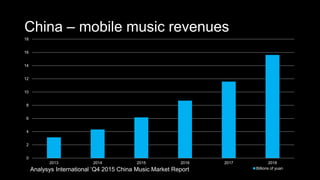
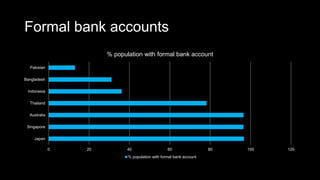
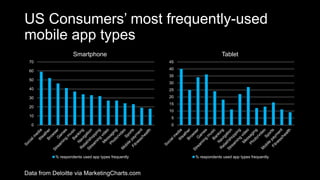
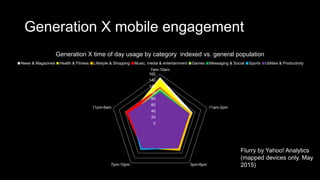
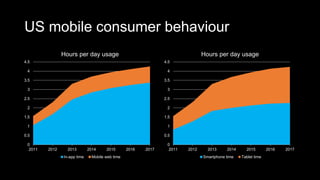
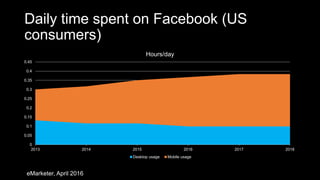
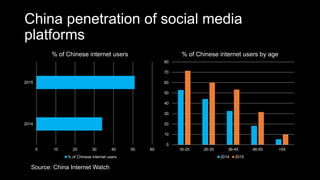
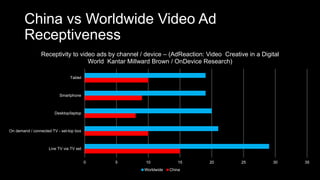
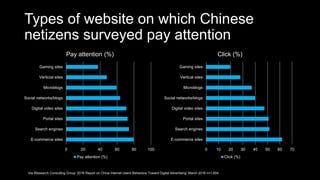
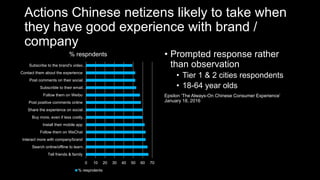
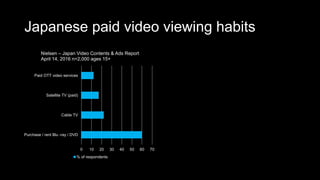
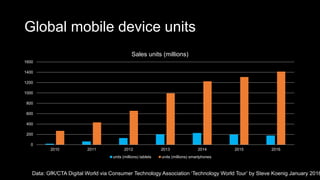
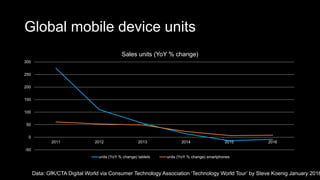
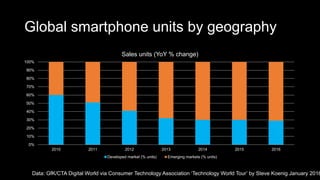
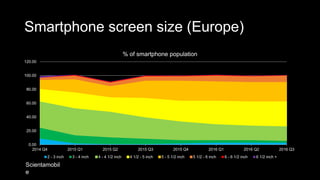
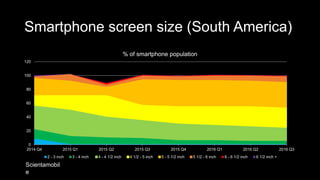
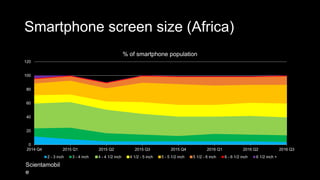
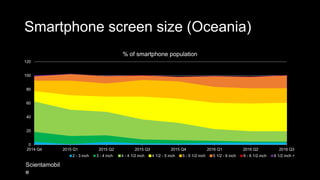
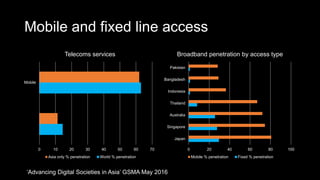
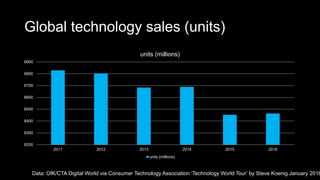
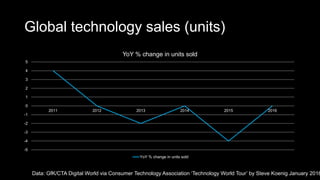
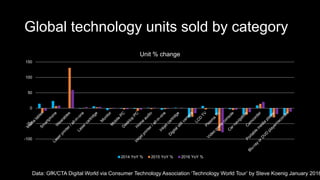
Online marketing &
technology data points
January 2017
Ged Carroll
renaissancechambara.jp
About presentation
Over time, I have had to compile data and visualise it based on
desk and primary research. I thought that these slides may be of
use to other people so have compiled them here. As I have time I
will update them with data. Each diagram has an accompanying
slide with an explanation where appropriate.
Platforms
DEC-97
APR-98
AUG-98
DEC-98
APR-99
AUG-99
DEC-99
APR-00
AUG-00
DEC-00
APR-01
AUG-01
DEC-01
APR-02
AUG-02
DEC-02
APR-03
AUG-03
DEC-03
APR-04
AUG-04
DEC-04
APR-05
AUG-05
DEC-05
APR-06
AUG-06
DEC-06
APR-07
AUG-07
DEC-07
APR-08
AUG-08
DEC-08
APR-09
AUG-09
DEC-09
APR-10
AUG-10
DEC-10
APR-11
AUG-11
DEC-11
APR-12
AUG-12
DEC-12
APR-13
AUG-13
DEC-13
APR-14
AUG-14
DEC-14
APR-15
AUG-15
DEC-15
APR-16
AUG-16
Communications services adoption (active users)
Gmail active Users Hotmail / Live Yahoo! Mail Whatsapp WeChat QQ IM KakaoTalk LINE Facebook Messenger
Communications services adoption
Going through publicly declared data, I pulled together adoption
data across email providers and OTT messaging platforms.
Key watch outs on the data is that it’s largely self-declared and
active users is broad church. Usage data is also very important -
what does active really mean?
Regardless one can see that mobile devices became an
accelerant of adoption for newer services.
Income and online behaviour
0
200
400
600
800
1000
1200
0-15K 15-25K 25-35K 35-50K 50-75K 75-100K 100K+
Average monthly minutes vs household income ($US)
2008 2013
The Empirical Economics of Online Attention by Boik, Greenstein & Prince, NBER (July, 2016)
US most popular mobile apps (2016)
0 20 40 60 80 100 120 140 160
Facebook
YouTube
Facebook Messenger
Google Search
Google Play
Google Maps
Gmail
Instagram
Apple Music
Amazon app
millions of unique users
Data: Nielsen - Tops of 2016: Digital
Mobile app-install advertising revenue
(US)
0 1 2 3 4 5 6 7 8
2014
2015
2016
2017
2018
2019
2020
Billions ($US)
Billions ($US)
Business Insider Intelligence:
The Mobile App-Install Ad
Report
Mobile app growth (global)
0
50
100
150
200
250
300
350
2015 2016 2017 2018 2019 2020
Billions of downloads – App Annie
APAC EMEA Americas
Chinese web platforms
0 100 200 300 400 500 600 700 800
WeChat
QQ
Taobao
Tencent Video
Baidu
Alipay
Weibo
iQiyi
QQ Browser
Kugou Music
Data Quest Mobile (March 2016)
Millions of MAUs (monthly active users)
Global search advertising revenue
0
10
20
30
40
50
60
70
80
90
100
2014 2015 2016
Search revenue billions (USD)
Google Baidu Microsoft (Bing) Yahoo! Sohu Other
eMarketer March, 2016
Google global search volume
0
500,000,000,000
1,000,000,000,000
1,500,000,000,000
2,000,000,000,000
2,500,000,000,000
1999 2000 2001 2002 2003 2004 2005 2006 2007 2008 2009 2010 2011 2012 2013 2014 2015 2016
Number of Searches
Number of Searches
Source: SearchEngineLand - Google now handles at least 2 trillion searches per year (May 24, 2016)
App Constellations
0
10
20
30
40
50
60
70
Daum Kakao
Corp
Dropbox Facebook Google LINE (Naver
Japan)
Microsoft Naver (Korea) Netease Tencent
‘Mobile apps that share a single login and have app-to-app linking built in’ –
Fred Wilson, Union Square Ventures
2014 2016
Data: renaissancechambara.jp April 2014, April 2016 – audit of Apple iTunes app store
YouTube subcribers don’t often make for
regular viewers
0 10 20 30 40 50 60 70 80 90
GoPro
Home Depot
Chevrolet
Toyota USA
Adidas Football
Nike Football
Dove
Chanel
Burberry
Delta Airlines
Virgin America
Oreo
Chipotle
Xbox
Budweiser
Starbucks
Kentucky Fried Chicken (KFC)
Mastercard
Visa
Lego
Average views / Subcribers x 100(%)
Forrester Research
When Video Views Peak
0
5
10
15
20
25
30
35
40
45
50
24 hours 48 hours 72 hours 96 hours 120 hours 144 hours 168 hours 192 hours 216 hours 240 hours
YouTube has a ‘long tail’ of views, Facebook is more immediate
YouTube video (% total views) Facebook video (% total views
ChannelMeter via The Information
Time-shifted TV watching
0 10 20 30 40 50 60
As it is recording or shortly
thereafter
1 day
2-3 days
4-7 days
More than 7 days
I never watch recorded
programmes
(%) using a DVR to record TV
programming, how long do
respondents typically wait to view it
0 10 20 30 40
As it is recording or shortly
thereafter
1 day
2-3 days
4-7 days
More than 7 days
(%) minus non-DVR users
Civic Science
Unique ads observed by vertical
0 5 10 15 20 25 30 35
Automotive
Active wear
Beauty
Beverages
Consumer electronics
CPG
Fashion
Financial services
Food
Insurance
Personal care
Retail
Travel
Watches & jewelery
Instagram (%)
0 5 10 15 20 25
Automotive
Active wear
Beauty
Beverages
Consumer electronics
CPG
Fashion
Financial services
Food
Insurance
Personal care
Retail
Travel
Watches & jewelery
Snapchat (%)
L2 ‘Instagram vs. Snapchat’ report
Snapchat usage by gender
0
10
20
30
40
50
60
YouGov BrandIndex Survey
% Male millennial respondents
% Female millennial respondents
• Prompted recall of Snapchat
usage rather than off-app
data
• Change in women likely due
to surge of fashion bloggers
and celebrities looking to
cash in on brand interest
Snapchat growth
0
20
40
60
80
100
120
140
160
May 2014 June 2014 September
2014
December
2014
March 2015 June 2015 September
2015
December
2015
May 2016 June 2016
Millions of daily users (Statista)
Global
Snapchat user behaviour
0 20 40 60 80
Snap/stories from people you know
Chat with people you know
Snap/stories from celebrities
Snap/stories from people you don't
know
Snap/stories from brands (not
Discover)
Discover stories
Chat with people you don't know
Live stories (local and events)
% surveyed who used feature at least
daily, if not more
% surveyed who used feature at least daily, if not more
US-based survey (18-24 year
olds) by Defy Media for Variety
magazine
Sample size 1,117 respondents
Snapchat user behaviour
0 10 20 30 40 50 60
Buzzfeed
Comedy Central
iHeart Radio
Food Network
ESPN
People
Cosmopolitan
CNN
National Geographic
IGN
Daily Mail
sweet
Vice
Mashable
Tastemade
Vox
Fusion
Refinery 29
WSJ
None
Which Discover stories do you usually
view? (%)
Which Discover stories do you usually view? (%)
0 10 20 30 40 50 60 70
Messaging friends
Short videos
Keeping up with celebrities
Entertainment news
Current news events
Snapchat is my primary source for…
(%)
Snapchat is my primary source for… (%)
Facebook Post Reactions
0 20 40 60 80 100 120
Like
Angry
Sad
Wow
Haha
Love
Quintly: Facebook Reactions Study (May 3, 2016)
% of Reactions
Facebook interaction rates by industry
0 0.5 1 1.5 2 2.5 3 3.5 4
Retailing
Media & entertainment
Travel
Automotive
Technology
Financial services
Facebook interaction rate (%) via Adobe Digital Index – US Best of the Best
2015
Total industry average Top performers
B2B social media engagement rates
0
5
10
15
20
25
30
35
40
Facebook Instagram LinkedIn Pinterest Twitter
B2B overall
B2B overall
Engagement rate defined as number
of interactions per post per 1,000
followers
Sample size 316 brands (I presume
it skews US-centric), research done
by TrackMaven in 2015
Watchouts: sample size,
engagement rate is partly platform
design and partly content.
Engagement doesn’t necessarily
mean anything to do with likely
purchase
B2B social media engagement rates
0
5
10
15
20
25
30
35
40
45
50
Facebook engagement rate
0
5
10
15
20
25
30
35
40
45
50
Instagram engagement rate
B2B social media engagement rates
0
0.5
1
1.5
2
2.5
3
LinkedIn engagement rate
0
10
20
30
40
50
60
70
80
Pinterest engagement rate
B2B social media engagement rates
0
0.5
1
1.5
2
2.5
Twitter engagement rate
Social media engagement and
how television advertising
affects it
Social media engagement and television
Social engagement drivers (%)
TV advertising
Social platform advertising
Combined TV and social platform advertising
All other advertising
Social engagement drivers (%) minus
other advertising
Social platform advertising
TV advertising
Combined TV and social platform advertising
Turner & 4C: Television Advertising is a Key Driver of Social Media Engagement for Brands
Social media engagement and television
TV advertising impressions (%)
Premium content (sports, live and original) Non-premium content
% TV advertising impact on social
brand engagement
Premium content Non-premium content
Turner & 4C: Television Advertising is a Key Driver of Social Media Engagement for Brands
Engagement to impressions index
0 50 100 150 200 250
Premium content
Non-premium content
Engagement to impressions index
0 100 200 300 400
Original content
Sports
Live
Expressions to Impressions Index for
premium TV content types
Expressions to Impressions Index for premium TV content types
Turner & 4C: Television Advertising is a Key Driver of Social Media Engagement for Brands
Engagement to cost index
0 50 100 150 200
Premium content
Non-premium content
Engagement to cost index
0 50 100 150 200 250 300
Original content
Sports
Live
Reaility
Expressions to Impressions Index for
premium content types
Expressions to Impressions Index
Turner & 4C: Television Advertising is a Key Driver of Social Media Engagement for Brands
Advertising
UK aggregate ad agency billings
suffering from ‘lost decade’ of growth
0
5
10
15
20
25
30
35
2008 2009 2010 2011 2012 2013 2014 2015 2016 2017 2018 2019 2020
Source: Statista.com
billions USD
24/05/16 Initial presentation for SteelHouse 34
Optimium number of advertising channels
• Careful channel selection
• Datapoint is contrary to the
trend towards complex
programmatic based
advertising mixes
0
10
20
30
40
50
60
70
80
1 channel 2 channels 3 channels 4 channels 5 channels
Average effectiveness success rate
(IPA 2012)
Average effectiveness success rate
Audience time spent v. advertising spend
share
0
5
10
15
20
25
30
35
40
45
50
Television Out of Home (OOH) Radio Internet National newspaper Regional newspaper Magazines
% media time share % advertising spend share
Guardian Publishing Trends 2016 drawing on: AA, Barb, Rajar, ComScore, NRS,
Audience time spent v. advertising spend
share - China
0
5
10
15
20
25
30
35
40
45
50
Mobile (non-voice) Desktop / laptop
computing
Television Radio Newspapers Magazines
% media time share % advertising spend share
eMarketer April 2016
Digital ad spend by region (2016)
0
20
40
60
80
100
120
140
160
180
North America Western Europe Latin America Asia Pacific Central & Eastern
Europe
Middle East & Africa
(US$ per capita)
(US$ per capita)
Strategy Analytics
Advertising spend trends
0
5
10
15
20
25
30
35
40
45
50
2014 2015 2016 2017 2018 2019 2020
Share of US advertising spend
TV Digital Print
Radio Out-of-home Directories
0
2
4
6
8
10
12
14
16
18
20
2014 2015 2016 2017 2018 2019 2020
Share of US advertising spend for
print categories
Pinrt (overall)
Newspapers (print only)
Magazines (print editions only)
Directories (print only)
eMarketer.com March, 2016
Advertising spend trends
0
5
10
15
20
25
30
35
40
45
50
2014 2015 2016 2017 2018 2019 2020
Share of US advertising spend for
digital channels
Digital Mobile
0
5
10
15
20
25
30
35
40
45
2014 2015 2016 2017 2018 2019 2020
Share of US advertising spend for
broadcast categories
Television Radio (excluding catch-up and digital
eMarketer.com March, 2016
Desktop display ad viewability by market
0 10 20 30 40 50 60
Australia
Brazil
Canada
France
Italy
Germany
Spain
UK
US
comScore vCE Benchmarks, Global, Q1 2016
% Viewable
Video ad viewability rates
0
10
20
30
40
50
60
70
80
90
100
YouTube Rest of web and apps
Tablet
Tablet % viewability
Google DoubleClick Global
State of Play report (July 2016)
Video ad viewability rates
0
10
20
30
40
50
60
70
80
90
100
YouTube Rest of web and apps
Desktop
Desktop % viewability
0
10
20
30
40
50
60
70
80
90
100
YouTube Rest of web and apps
Mobile
Mobile % viewability
Video has lower viewability than display
36 38 40 42 44 46 48 50
US desktop display
US desktop video
comScore vCE Benchmarks, US, Q1 2016
% Viewability
Apparently due to high invalid traffic on programmatic exchanges where video is commonly traded.
Programmatic magnifies invalid traffic
problem
0 1 2 3 4 5 6 7
Direct
Programmatic
% Invalid traffic US desktop display
ads
% Invalid traffic US desktop display ads
0 2 4 6 8 10
Direct
Programmatic
% invalid traffic US desktop video ads
comScore vCE Benchmarks, US, Q1 2016
Ad targeting and ad blocking
Attitudes to ad-targeting by generation
0 10 20 30 40
It's about time advertisers
recognised that my generation
shops too
I am more likely to click on an
advertisement aimed specifically at
my generation
I feel like my generation is often
forgotten about by advertisers
I am more likely to purchase a
product from a brand whose ad is
targeted specifically at my
generation
Millennial respondents (%)
Millenial respondents (%)
0 5 10 15 20 25 30 35
I am more likely to purchase a
product from a brand whose ad is
targeted specifically at my
generation
I am more likely to click on an
advert aimed specifically at my
generation
I feel like my generation is often
forgotten about by advertisers
I am more likely to purchase a
product from a brand whose ad is
targeted specifically at my
generation
Boomer respondents (%)
Audience Theory / Yahoo! Quantative November 2015 – Yahoo! /Ipsos Gen X Survey Adults 35-54 n=853 US
Attitudes to ad-targeting by generation
0 10 20 30 40
It's about time advertisers
recognised that my generation
shops too
I am more likely to click on an
advertisement aimed specifically at
my generation
I feel like my generation is often
forgotten about by advertisers
I am more likely to purchase a
product from a brand whose ad is
targeted specifically at my
generation
Generation-X respondents (%)
0 10 20 30 40 50
I am more likely to purchase a
product from a brand whose ad is
targeted specifically at my
generation
I am more likely to click on an
advert aimed specifically at my
generation
I feel like my generation is often
forgotten about by advertisers
I am more likely to purchase a
product from a brand whose ad is
targeted specifically at my
generation
Generation-X parents respondents (%)
Audience Theory / Yahoo! Quantative November 2015 – Yahoo! /Ipsos Gen X Survey Adults 35-54 n=853 US
Ad blocking software
0
20000000
40000000
60000000
80000000
100000000
120000000
140000000
160000000
180000000
200000000
Jan-10 Jan-11 Jan-12 Jan-13 Jan-14 Jan-15
Installed base of ad blockers
Data from Pagefair & Adobe, 2015 Ad Blocking Report via Guardian Publishing Trends 2016. 800% growth in
user base over a 5 year period.
Ad blocking millennials
0 20 40 60 80 100 120
Male millennial
Female millennial
% likelihood to ad block compared to population as a whole
% likelihood to ad block
comScore Custom Analytics, US, 2015
Internet users worldwide who have
blocked an advert
0
5
10
15
20
25
30
35
40
Q1 2015 Q2 2015 Q3 2015 Q4 2015
Respondents aged 16-64, in the past month on their main computer
(GlobalWebIndex Blog January 22 2016)
% respondents
Share of time spent viewing video
content in selected countries using ad
blockers
0 10 20 30 40 50 60 70
Germany
Canada
UK
France
US
Russia
% of total time spent viewing desktop video content via JW Player (Q2, 2015)
% of total time spent viewing desktop video content
Secret Media & JW Player “Adblock & the Global Video Market September 14, 2015
Adblocker installed base by country
0 5 10 15 20 25 30 35
Turkey
Latvia
Spain
Canada
Denmark
Brazil (mid-point estimate)
Greece
Hungary
Netherlands
UK
Argentina
Czech Republic (mid-point estimate)
Germany
USA (mid-point estimate)
Chile
Italy (any device)
France (desktop)
Poland
Austria (any device)
% Users with adblocking installed
Group M ‘Interaction 2016 report’ April 25, 2016
Ad blocking skews towards higher
income segments across markets
0 5 10 15 20 25 30
USA
Canada
UK
Germany
% increase in blocking for highest income segments in comparison to average
user
% increase in blocking for highest income segments in comparison to average user
comScore Custom Analytics, Global, 2015
Page load times
0
5
10
15
20
25
30
35
40
45
Load time in seconds
Editoral content Advertising content
Guardian Publishing Trends 2016 drawing on analysis by comScore, Pew Research Center & New York Times
E-tailing
Global e-commerce
0
0.2
0.4
0.6
0.8
1
1.2
1.4
1.6
1.8
2
2013 2015 2016
Global e-commerce by value including
travel
Trillions USD
• Equivalent of 8% of global
retail sales
• CAGR 13.96% since 2013
• All platforms (mobile web,
app and desktop)
Data from Group M reports ‘Interaction 2015’ and ’Interaction 2016’
Online shopping cart abandonment
69 70 71 72 73 74 75 76 77
Asia-Pacific
Middle East & Africa
Latin America
North America§
Europe
SaleCycle, “The Remarketing Report – Q1, 2016
% digital shopping cart abandonment
Digital showroom and retailing
0
10
20
30
40
50
60
0 5 10 15 20 25 30 35 40 45 50
Category purchase online versus research online
Purchased online
Researched online
Computer software
& hardware
DVDs / videos
Electronics
Video games
Books
Furniture
Clothing
Groceries
Household
products
Office
supplies
Health &
Beauty
McKinsey iConsumer (Europe 2011) via iConsumers: Life Online by McKinsey & Company (January 2013)
US e-tailing growth
0 10 20 30 40 50
Video games, consoles & accessories
Toys & hobbies
Sport & fitness
Jewelery & watches
Event tickets
Music, movies & videos
Flowers, greetings & misc gifts
Apparel & accessories
Home & garden
Furniture, appliances & equipment
Computer software
Books & magazines
Consumer electronics
Consumer packaged goods
Office supplies
Digital content & subscriptions
Computers & peripherals
year-on-year % change in total dollars
(US retailers only)
year-on-year % change in total dollars (US retailers only)
• Data from comScore (2016
U.S. Cross-Platform Future in
Focus)
• Markets being compared vary
in digital maturity and overall
growth rate – regardless of
channel
Purchases on WeChat (China)
Volume of purchases initiated
JD.com entrances WeChat Public accounts
Links to other apps Moments or chat groups
0 5 10 15 20 25 30 35
2015
2016
% users who have shopped from
WeChat
% users who have shopped from WeChat
How savvy, social shoppers are transforming Chinese e-commerce – McKinsey & Company April, 2016 (n=525)
China – mobile music revenues
0
2
4
6
8
10
12
14
16
18
2013 2014 2015 2016 2017 2018
Billions of yuanAnalysys International ‘Q4 2015 China Music Market Report
Formal bank accounts
0 20 40 60 80 100 120
Japan
Singapore
Australia
Thailand
Indonesia
Bangladesh
Pakistan
% population with formal bank account
Mobile payments in developing countries
0 20 40 60 80 100
Europe & Central Asia
Middle East & North Africa
East Asia & Pacific
Latin American & Caribbean
South Asia
Sub-Saharan Africa
% of population with access to mobile
payments
% of population with access to mobile payments
0 20 40 60 80 100
Lower income economies
Low-middle-income economies
Upper-middle-income economies
% population with access to mobile
payments
% population with access to mobile payments
Data from: ‘Advancing Digital Societies in Asia’ GSMA (May 2016)
Consumer behaviour
UK adult daily media consumption
0
2
4
6
8
10
12
2012 2013 2014 2015 2016 2017 2018
UK adults: average time spent per day
on media
Digital TV (non digital) Radio (non digital) Print
0
1
2
3
4
5
6
2012 2013 2014 2015 2016 2017 2018
UK adults: average time spent per
day on digital media
Smartphone Tablet Featurephone Desktop / laptop
Source: eMarketer, April 2016
US digital video advertising
0 20 40 60 80 100
YouTube
Cable / satellite TV
Instagram
Blu-ray / DVD
Hulu
Amazon Prime Video
Tumblr
Twitch
Sling TV
Platforms on which US 13-24 yr olds
view video (Defy Media Acumen
Report: Youth Video diet March 31,
2016)
% of respondents
0 20 40 60 80
Google / YouTube
Facebook
Hulu
ABC
Yahoo!
ESPN
Twitter
NBC
A&E
CN
iAd
Where US marketers intend to use for
digital video advertising (Advertiser
Perceptions , Video Advertising Report
Wave 4, Winder 2016 – April 13, 2016)
% Respondents
Share of content category time spent by
platform
0%
10%
20%
30%
40%
50%
60%
70%
80%
90%
100%
comScore Media Metrix Multi-Platform US December, 2015
Desktop Mobile
Share of time spend on their top apps for
US mobile users
0 20 40 60 80 100
Most used app
Top two apps
Top three
Top four
Top five
Smartphone
% of time spent
0 20 40 60 80 100
Most used app
Top two apps
Top three
Top four
Top five
Tablet
% of time
Data: comScore Mobile App Report 2015
Growth in Digital Media Time Spent in
Minutes (MM)
0
200000
400000
600000
800000
1000000
1200000
1400000
1600000
Dec 2013 Dec 2014 Dec 2015
comScore Media Metrix Multi-Platform & Mobile Metrix US Dec 2015 vs. Dec 2014 vs. Dec 2013
Desktop Smartphone Tablet
Which app notifications users tune out
0 10 20 30 40 50 60 70 80 90
Shopping
Social networking
Finance
News
Food & drink
Data by Apptentive based on a panel of 7,000 mobile apps
% of users who interacted with notification sent via app
Global smartphone ownership
0
10
20
30
40
50
60
70
80
90
100
Data from Pew Research Spring 2015 Global Attitudes survey Q71 & Q72
% of survey respondents who claim to own a smartphone
US Consumers’ most frequently-used
mobile app types
0
10
20
30
40
50
60
70
Smartphone
% respondents used app types frequently
0
5
10
15
20
25
30
35
40
45
Tablet
% respondents used app types frequently
Data from Deloitte via MarketingCharts.com
Generation X mobile engagement
0
20
40
60
80
100
120
140
160
7am-10am
11am-2pm
3pm-6pm7pm-10pm
11pm-6am
Generation X time of day usage by category indexed vs. general population
News & Magazines Health & Fitness Lifestyle & Shopping Music, media & entertainment Games Messaging & Social Sports Utilities & Productivity
Flurry by Yahoo! Analytics
(mapped devices only. May
2015)
US mobile consumer behaviour
0
0.5
1
1.5
2
2.5
3
3.5
4
4.5
2011 2012 2013 2014 2015 2016 2017
Hours per day usage
In-app time Mobile web time
0
0.5
1
1.5
2
2.5
3
3.5
4
4.5
2011 2012 2013 2014 2015 2016 2017
Hours per day usage
Smartphone time Tablet time
US mobile consumer behaviour
0
1
2
3
4
5
6
2011 2012 2013 2014 2015 2016 2017
In-app usage hours per day usage
Smartphone time Tablet time
0
0.1
0.2
0.3
0.4
0.5
0.6
0.7
0.8
0.9
1
2011 2012 2013 2014 2015 2016 2017
Mobile web hours per day usage
Smartphone time Tablet time
Daily time spent on Facebook (US
consumers)
0
0.05
0.1
0.15
0.2
0.25
0.3
0.35
0.4
0.45
2013 2014 2015 2016 2017 2018
Hours/day
Desktop usage Mobile usage
eMarketer, April 2016
US digital users 2014-2020
0
50
100
150
200
250
300
2014 2015 2016 2017 2018 2019 2020
Millions US internet users
Desktop / laptop only users Dual desktop / laptop and mobile internet users Mobile only internet users
eMarketer February, 2016
US TV multitasking behaviour
0 10 20 30 40 50 60
Browse & surf the web
Use a social network
Read email
Text message
Browse for products/services
online
Play video games
Don't multitask - just watch TV
26-32 year olds 19-25 year olds 14-18 year olds
Data from
MarketingCharts.com via
Deliotte from a behaviour
survey they had commissioned
in 2015
Watchouts: data is based on
recalled behaviour rather than
observation
Millennials
US simultaneous internet & TV user
penetration (% by device)
0.00%
10.00%
20.00%
30.00%
40.00%
50.00%
60.00%
70.00%
80.00%
90.00%
2014 2015 2016 2017 2018
Source: eMarketer, May 2016
Smartphone internet & TV users Desktop/laptop internet & TV users Tablet internet & TV users
US TV multitasking behaviour
0 5 10 15 20 25 30 35
Browse & surf the web
Use a social network
Read email
Text message
Browse for products / services
online
Play video games
Don't multitask - just watch TV
Generation X (33-49 year olds)
0 5 10 15 20 25 30
Browse & surf the web
Use a social network
Read email
Text message
Browse for products / services
online
Play video games
Don't multitask - just watch TV
Baby boomers (50-68 year olds)
Reasons for shopping via mobile phone
amongst APAC internet users
0
10
20
30
40
50
60
70
80
Convenience Shopping can be done on-
the-go
More and more apps that
make it easy to shop online
Good way to pass time Common amongst friends
% of respondents
China Hong Kong Japan South Korea Taiwan
MasterCard ‘Mobile Shopping Survey 2016 Asia Pacific’ February 18, 2016
Average time spent with media/day by
Chinese adults
0
1
2
3
4
5
6
7
2012 2013 2014 2015 2016 2017
Time in hours
Digital TV (excluding digital) Radio (excluding digital) Print
0
0.5
1
1.5
2
2.5
3
3.5
2012 2013 2014 2015 2016 2017
Time in hours spent on digital media
Smartphone Tablet Feature phone Desktop / laptop computer
Device adoption amongst Chinese digital
consumers
0
20
40
60
80
100
120
2015 2016
Online shopping
PC only users PC& mobile device users Mobile only users
0
20
40
60
80
100
120
2015 2016
Social network usage
PC only users PC and mobile users Mobile only users
How savvy, social shopppers are transforming Chinese e-commerce – McKinsey April, 2016
Chinese mobile use
-50 0 50 100 150 200 250 300
Photography
Health & Fitness
Travel & Navigation
Lifestyle & Shopping
Messaging & Social
Utilities & Productivity
Music, Media & Entertainment
Games
Data at Flurry Analytics
% incease (year-on-year)
Most often used payment methods by
Chinese netizens
0 10 20 30 40 50 60 70
Third-party online payment
Third-party mobile payment
E-bank
PoS machine
Mobile banking
WeChat bank
Pre-paid card payment
Research from Tencent (2014)
% of netizens
Frequency with Which Chinese Smartphone
Users Use Mobile Payments for In-Store
Purchases
0 5 10 15 20 25 30 35 40 45 50
Only when I have a promotional discount
Never
Always
Most of the time
Sometimes
Economist Corporate Network (ECN) / Admaster – The Road to Everywhere: The Omni-
Journey’ of the Chinese Consumer March 16, 2016
% respondents
Chinese online population
0
10
20
30
40
50
60
70
2014 2015 2016 2017 2018 2019 2020
% population online (eMarketer, April 2016)
Male population online % Female population online % Overall population online %
China penetration of social media
platforms
0 10 20 30 40 50 60
2014
2015
% of Chinese internet users
0
10
20
30
40
50
60
70
80
16-25 26-35 36-45 46-55 >55
% of Chinese internet users by age
2014 2015
Source: China Internet Watch
China vs Worldwide Video Ad
Receptiveness
0 5 10 15 20 25 30 35
Live TV via TV set
On demand / connected TV - set-top box
Desktop/laptop
Smartphone
Tablet
Receptivity to video ads by channel / device – (AdReaction: Video Creative in a Digital
World Kantar Millward Brown / OnDevice Research)
Worldwide China
Types of website on which Chinese
netizens surveyed pay attention
0 20 40 60 80 100
E-commerce sites
Search engines
Portal sites
Digital video sites
Social networks/blogs
Microblogs
Verticial sites
Gaming sites
Pay attention (%)
Pay attention (%)
0 10 20 30 40 50 60 70
E-commerce sites
Search engines
Portal sites
Digital video sites
Social networks/blogs
Microblogs
Vertical sites
Gaming sites
Click (%)
Click (%)
Via iResearch Consulting Group ‘2016 Report on China Internet Users Behaviors Toward Digital Advertising’ March 2016 n=1,604
Actions Chinese netizens likely to take when
they have good experience with brand /
company
0 10 20 30 40 50 60 70
Tell friends & family
Search online/offline to learn…
Interact more with company/brand
Follow them on WeChat
Install their mobile app
Buy more, even if less costly…
Share the experience on social…
Post positive comments online
Follow them on Weibo
Subscrible to their email…
Post comments on their social…
Contact them about the experience
Subscribe to the brand's video…
% respndents
% respndents
• Prompted response rather
than observation
• Tier 1 & 2 cities respondents
• 18-64 year olds
Epsilon ‘The Always-On Chinese Consumer Experience’
January 18, 2016
Japanese paid video viewing habits
0 10 20 30 40 50 60 70
Purchase / rent Blu -ray / DVD
Cable TV
Satellite TV (paid)
Paid OTT video services
Nielsen – Japan Video Contents & Ads Report
April 14, 2016 n=2,000 ages 15+
% of respondents
Smartphones
Global mobile device units
0
200
400
600
800
1000
1200
1400
1600
2010 2011 2012 2013 2014 2015 2016
Sales units (millions)
units (millions) tablets units (millions) smartphones
Data: GfK/CTA Digital World via Consumer Technology Association ‘Technology World Tour’ by Steve Koenig January 2016
Global mobile device units
-50
0
50
100
150
200
250
300
2011 2012 2013 2014 2015 2016
Sales units (YoY % change)
units (YoY % change) tablets units (YoY % change) smartphones
Data: GfK/CTA Digital World via Consumer Technology Association ‘Technology World Tour’ by Steve Koenig January 2016
Global smartphone units by geography
0%
10%
20%
30%
40%
50%
60%
70%
80%
90%
100%
2010 2011 2012 2013 2014 2015 2016
Sales units (YoY % change)
Developed market (% units) Emerging markets (% units)
Data: GfK/CTA Digital World via Consumer Technology Association ‘Technology World Tour’ by Steve Koenig January 2016
Global tablet units by geography
0%
10%
20%
30%
40%
50%
60%
70%
80%
90%
100%
2010 2011 2012 2013 2014 2015 2016
Sales units (YoY % change)
Developed market (% units) Emerging markets (% units)
Data: GfK/CTA Digital World via Consumer Technology Association ‘Technology World Tour’ by Steve Koenig January 2016
Smartphone screen size (global)
0
20
40
60
80
100
120
2015 Q1 2016 Q1
% of smartphone population
3 - 4 inch 4 - 4 1/2 inch 4 1/2 - 5 inch 5 - 5 1/2 inch 5 1/2 - 6 inch 6 - 6 1/2 inch
Scientamobil
e
Smartphone screen size (Asia)
0.00
20.00
40.00
60.00
80.00
100.00
120.00
2014 Q4 2015 Q1 2015 Q2 2015 Q3 2015 Q4 2016 Q1 2016 Q2 2016 Q3
% of smartphone population
2 - 3 inch 3 - 4 inch 4 - 4 1/2 inch 4 1/2 - 5 inch 5 - 5 1/2 inch 5 1/2 - 6 inch 6 - 6 1/2 inch 6 1/2 inch +
Scientamobil
e
Smartphone screen size (North America)
0.00
20.00
40.00
60.00
80.00
100.00
120.00
2014 Q4 2015 Q1 2015 Q2 2015 Q3 2015 Q4 2016 Q1 2016 Q2 2016 Q3
% of smartphone population
2 - 3 inch 3 - 4 inch 4 - 4 1/2 inch 4 1/2 - 5 inch 5 - 5 1/2 inch 5 1/2 - 6 inch 6 - 6 1/2 inch 6 1/2 inch +
Scientamobil
e
Smartphone screen size (Europe)
0.00
20.00
40.00
60.00
80.00
100.00
120.00
2014 Q4 2015 Q1 2015 Q2 2015 Q3 2015 Q4 2016 Q1 2016 Q2 2016 Q3
% of smartphone population
2 - 3 inch 3 - 4 inch 4 - 4 1/2 inch 4 1/2 - 5 inch 5 - 5 1/2 inch 5 1/2 - 6 inch 6 - 6 1/2 inch 6 1/2 inch +
Scientamobil
e
Smartphone screen size (South America)
0
20
40
60
80
100
120
2014 Q4 2015 Q1 2015 Q2 2015 Q3 2015 Q4 2016 Q1 2016 Q2 2016 Q3
% of smartphone population
2 - 3 inch 3 - 4 inch 4 - 4 1/2 inch 4 1/2 - 5 inch 5 - 5 1/2 inch 5 1/2 - 6 inch 6 - 6 1/2 inch 6 1/2 inch +
Scientamobil
e
Smartphone screen size (Africa)
0
20
40
60
80
100
120
2014 Q4 2015 Q1 2015 Q2 2015 Q3 2015 Q4 2016 Q1 2016 Q2 2016 Q3
% of smartphone population
2 - 3 inch 3 - 4 inch 4 - 4 1/2 inch 4 1/2 - 5 inch 5 - 5 1/2 inch 5 1/2 - 6 inch 6 - 6 1/2 inch 6 1/2 inch +
Scientamobil
e
Smartphone screen size (Oceania)
0
20
40
60
80
100
120
2014 Q4 2015 Q1 2015 Q2 2015 Q3 2015 Q4 2016 Q1 2016 Q2 2016 Q3
% of smartphone population
2 - 3 inch 3 - 4 inch 4 - 4 1/2 inch 4 1/2 - 5 inch 5 - 5 1/2 inch 5 1/2 - 6 inch 6 - 6 1/2 inch 6 1/2 inch +
Scientamobil
e
Global mobile device ASP (USD)
0
100
200
300
400
500
600
700
800
2010 2011 2012 2013 2014 2015 2016
Average selling price
Tablet USD Smartphone USD
Data: GfK/CTA Digital World via Consumer Technology Association ‘Technology World Tour’ by Steve Koenig January 2016
Wearables
VR headsets: by brand, market share %
(2016)
0
5
10
15
20
25
30
35
40
45
Samsung Gear VR Google Cardboard Sony Playstation VR HTC Vive Oculus Rift Google Daydream Others*
Source: IHS Markit
% share
Wearables by category (millions of units)
0
20
40
60
80
100
120
140
160
180
200
2015 2016 2017
Fitness wearables Head mounted display Body worn camera Bluetooth headset
Fitness wearables (millions of units)
0
10
20
30
40
50
60
70
80
2015 2016 2017
Data by Gartner
Smartwatch Wristband Chest strap Sports watch Other fitness monitor
Wearables versus other mobile devices
(millions of units)
0 200 400 600 800 1000 1200 1400 1600
2015
2016
Smartphones (millions) units Tablets (millions) units Wearables (millions) units
Data: Gartner & GfK/CTA Digital World via Consumer Technology Association ‘Technology World Tour’ by Steve Koenig January 2016
Internet of Things
Countries with highest amount of IoT
devices / person
0 5 10 15 20 25 30 35 40
Korea
Denmark
Switzerland
US
Netherlands
Germany
Sweden
Spain
France
Portugal
Belgium
UK
Data from Shodan and OECD
Devices online per 100 people
Number of connected objects (global)
0
10
20
30
40
50
60
2012 2013 2014 2015 2016 2017 2018 2019 2020
Billions of connected objects
Billions of connected objects Data: Cisco
Drones
Estimated consumer drone shipments
(global)
0
5
10
15
20
25
30
35
2014 2015 2016 2017 2018 2019 2020 2021
millions of units
millions of units
Business Insider Intelligence
estimates. Known unknowns
include:
• When does a toy become a
consmer drone?
• Basis for their estimates
• Murky regulatory environment,
especially in the case
• Domestic security
• Aircraft near-misses
• Dual use military technology in the
hands of non-state actors
Economic data
Mobile and fixed line access
0 10 20 30 40 50 60 70
Mobile
Telecoms services
Asia only % penetration World % penetration
0 20 40 60 80 100
Japan
Singapore
Australia
Thailand
Indonesia
Bangladesh
Pakistan
Broadband penetration by access type
Mobile % penetration Fixed % penetration
‘Advancing Digital Societies in Asia’ GSMA May 2016
Global technology sales (units)
6200
6300
6400
6500
6600
6700
6800
6900
2011 2012 2013 2014 2015 2016
units (millions)
units (millions)
Data: GfK/CTA Digital World via Consumer Technology Association ‘Technology World Tour’ by Steve Koenig January 2016
Global technology sales (units)
-5
-4
-3
-2
-1
0
1
2
3
4
5
2011 2012 2013 2014 2015 2016
YoY % change in units sold
Data: GfK/CTA Digital World via Consumer Technology Association ‘Technology World Tour’ by Steve Koenig January 2016
Global technology units sold by category
-100
-50
0
50
100
150
Unit % change
2014 YoY % 2015 YoY % 2016 YoY %
Data: GfK/CTA Digital World via Consumer Technology Association ‘Technology World Tour’ by Steve Koenig January 2016
Global technology sales revenue
900
920
940
960
980
1000
1020
1040
1060
2011 2012 2013 2014 2015 2016
Sales (billions USD)
USD (billions)
Data: GfK/CTA Digital World via Consumer Technology Association ‘Technology World Tour’ by Steve Koenig January 2016
Global technology sales (revenue)
geographic split
0%
10%
20%
30%
40%
50%
60%
70%
80%
90%
100%
2012 2013 2014 2015 2016
Revenue USD (% split)
Developed markets Developing markets
Data: GfK/CTA Digital World via Consumer Technology Association ‘Technology World Tour’ by Steve Koenig January 2016
Global technology sales (revenue)
geographic split
0
20
40
60
80
100
120
2011 2012 2013 2014 2015 2016
Revenue USD (% split)
Developed Asia Western Europe Middle East & Africa Emerging Asia North America C&E Europe / CIS Latin America
Data: GfK/CTA Digital World via Consumer Technology Association ‘Technology World Tour’ by Steve Koenig January 2016
Global technology sales revenue (USD)
-10
-8
-6
-4
-2
0
2
4
6
8
10
2011 2012 2013 2014 2015 2016
YoY % change in sales revenue (USD)
Data: GfK/CTA Digital World via Consumer Technology Association ‘Technology World Tour’ by Steve Koenig January 2016
Economic data
-2
-1
0
1
2
3
4
5
6
7
8
9
2012 2013 2014 2015 2016 2017 2018
GDP Forecast (World Bank)
Global
China
U.S .
Eurozone
Developing World excluding BRICs
-3
-2
-1
0
1
2
3
4
5
6
2012 2013 2014 2015 2016 2017
Retail sales (various sources)
Global U.K. U.S. Eurozone
Consumer sectors CPG (as bellwether),
consumer technology as (former?) shooting
star
-5
-4
-3
-2
-1
0
1
2
3
2010 2011 2012 2013 2014 2015
CPG % growth (Euromonitor data)
Packaged Foods Home Care Personal Care | Beauty
-20
0
20
40
60
80
100
2010 2011 2012 2013 2014 2015 2016 2017 2018 2019
Consumer Technology % growth
(Various)
Smartphones Tablets Smart TVs
About me
Amazon author page: amzn.to/1SeO5Il
LinkedIn page: linkedin.com/in/gedcarroll
About: renaissancechambara.jp/about
Blog: renaissancechambara.jp
Email address found here: scr.im/renaissance
Twitter account: @r_c
Sina Weibo: renaissancechambara
WeChat
thank you | 谢谢 | míle buíochas! |
감사합니다 | danke | ありがとう |
merci | спасибо | cám ơn |
whakawhetai | takk | ขอขอบคุณคุณ |
terima kasih | σας ευχαριστώ |
grazie | ‫|شكرا‬ þakka þér | დიდი
მადლობა | kiitos | நன்றி | gracias

1701 online-marketing-and-technology-data-points

  • 1.
    Online marketing & technologydata points January 2017 Ged Carroll renaissancechambara.jp
  • 2.
    About presentation Over time,I have had to compile data and visualise it based on desk and primary research. I thought that these slides may be of use to other people so have compiled them here. As I have time I will update them with data. Each diagram has an accompanying slide with an explanation where appropriate.
  • 3.
  • 4.
  • 5.
    Communications services adoption Goingthrough publicly declared data, I pulled together adoption data across email providers and OTT messaging platforms. Key watch outs on the data is that it’s largely self-declared and active users is broad church. Usage data is also very important - what does active really mean? Regardless one can see that mobile devices became an accelerant of adoption for newer services.
  • 6.
    Income and onlinebehaviour 0 200 400 600 800 1000 1200 0-15K 15-25K 25-35K 35-50K 50-75K 75-100K 100K+ Average monthly minutes vs household income ($US) 2008 2013 The Empirical Economics of Online Attention by Boik, Greenstein & Prince, NBER (July, 2016)
  • 7.
    US most popularmobile apps (2016) 0 20 40 60 80 100 120 140 160 Facebook YouTube Facebook Messenger Google Search Google Play Google Maps Gmail Instagram Apple Music Amazon app millions of unique users millions of unique users Data: Nielsen - Tops of 2016: Digital
  • 8.
    Mobile app-install advertisingrevenue (US) 0 1 2 3 4 5 6 7 8 2014 2015 2016 2017 2018 2019 2020 Billions ($US) Billions ($US) Business Insider Intelligence: The Mobile App-Install Ad Report
  • 9.
    Mobile app growth(global) 0 50 100 150 200 250 300 350 2015 2016 2017 2018 2019 2020 Billions of downloads – App Annie APAC EMEA Americas
  • 10.
    Chinese web platforms 0100 200 300 400 500 600 700 800 WeChat QQ Taobao Tencent Video Baidu Alipay Weibo iQiyi QQ Browser Kugou Music Data Quest Mobile (March 2016) Millions of MAUs (monthly active users)
  • 11.
    Global search advertisingrevenue 0 10 20 30 40 50 60 70 80 90 100 2014 2015 2016 Search revenue billions (USD) Google Baidu Microsoft (Bing) Yahoo! Sohu Other eMarketer March, 2016
  • 12.
    Google global searchvolume 0 500,000,000,000 1,000,000,000,000 1,500,000,000,000 2,000,000,000,000 2,500,000,000,000 1999 2000 2001 2002 2003 2004 2005 2006 2007 2008 2009 2010 2011 2012 2013 2014 2015 2016 Number of Searches Number of Searches Source: SearchEngineLand - Google now handles at least 2 trillion searches per year (May 24, 2016)
  • 13.
    App Constellations 0 10 20 30 40 50 60 70 Daum Kakao Corp DropboxFacebook Google LINE (Naver Japan) Microsoft Naver (Korea) Netease Tencent ‘Mobile apps that share a single login and have app-to-app linking built in’ – Fred Wilson, Union Square Ventures 2014 2016 Data: renaissancechambara.jp April 2014, April 2016 – audit of Apple iTunes app store
  • 14.
    YouTube subcribers don’toften make for regular viewers 0 10 20 30 40 50 60 70 80 90 GoPro Home Depot Chevrolet Toyota USA Adidas Football Nike Football Dove Chanel Burberry Delta Airlines Virgin America Oreo Chipotle Xbox Budweiser Starbucks Kentucky Fried Chicken (KFC) Mastercard Visa Lego Average views / Subcribers x 100(%) Forrester Research
  • 15.
    When Video ViewsPeak 0 5 10 15 20 25 30 35 40 45 50 24 hours 48 hours 72 hours 96 hours 120 hours 144 hours 168 hours 192 hours 216 hours 240 hours YouTube has a ‘long tail’ of views, Facebook is more immediate YouTube video (% total views) Facebook video (% total views ChannelMeter via The Information
  • 16.
    Time-shifted TV watching 010 20 30 40 50 60 As it is recording or shortly thereafter 1 day 2-3 days 4-7 days More than 7 days I never watch recorded programmes (%) using a DVR to record TV programming, how long do respondents typically wait to view it 0 10 20 30 40 As it is recording or shortly thereafter 1 day 2-3 days 4-7 days More than 7 days (%) minus non-DVR users Civic Science
  • 17.
    Unique ads observedby vertical 0 5 10 15 20 25 30 35 Automotive Active wear Beauty Beverages Consumer electronics CPG Fashion Financial services Food Insurance Personal care Retail Travel Watches & jewelery Instagram (%) 0 5 10 15 20 25 Automotive Active wear Beauty Beverages Consumer electronics CPG Fashion Financial services Food Insurance Personal care Retail Travel Watches & jewelery Snapchat (%) L2 ‘Instagram vs. Snapchat’ report
  • 18.
    Snapchat usage bygender 0 10 20 30 40 50 60 YouGov BrandIndex Survey % Male millennial respondents % Female millennial respondents • Prompted recall of Snapchat usage rather than off-app data • Change in women likely due to surge of fashion bloggers and celebrities looking to cash in on brand interest
  • 19.
    Snapchat growth 0 20 40 60 80 100 120 140 160 May 2014June 2014 September 2014 December 2014 March 2015 June 2015 September 2015 December 2015 May 2016 June 2016 Millions of daily users (Statista) Global
  • 20.
    Snapchat user behaviour 020 40 60 80 Snap/stories from people you know Chat with people you know Snap/stories from celebrities Snap/stories from people you don't know Snap/stories from brands (not Discover) Discover stories Chat with people you don't know Live stories (local and events) % surveyed who used feature at least daily, if not more % surveyed who used feature at least daily, if not more US-based survey (18-24 year olds) by Defy Media for Variety magazine Sample size 1,117 respondents
  • 21.
    Snapchat user behaviour 010 20 30 40 50 60 Buzzfeed Comedy Central iHeart Radio Food Network ESPN People Cosmopolitan CNN National Geographic IGN Daily Mail sweet Vice Mashable Tastemade Vox Fusion Refinery 29 WSJ None Which Discover stories do you usually view? (%) Which Discover stories do you usually view? (%) 0 10 20 30 40 50 60 70 Messaging friends Short videos Keeping up with celebrities Entertainment news Current news events Snapchat is my primary source for… (%) Snapchat is my primary source for… (%)
  • 22.
    Facebook Post Reactions 020 40 60 80 100 120 Like Angry Sad Wow Haha Love Quintly: Facebook Reactions Study (May 3, 2016) % of Reactions
  • 23.
    Facebook interaction ratesby industry 0 0.5 1 1.5 2 2.5 3 3.5 4 Retailing Media & entertainment Travel Automotive Technology Financial services Facebook interaction rate (%) via Adobe Digital Index – US Best of the Best 2015 Total industry average Top performers
  • 24.
    B2B social mediaengagement rates 0 5 10 15 20 25 30 35 40 Facebook Instagram LinkedIn Pinterest Twitter B2B overall B2B overall Engagement rate defined as number of interactions per post per 1,000 followers Sample size 316 brands (I presume it skews US-centric), research done by TrackMaven in 2015 Watchouts: sample size, engagement rate is partly platform design and partly content. Engagement doesn’t necessarily mean anything to do with likely purchase
  • 25.
    B2B social mediaengagement rates 0 5 10 15 20 25 30 35 40 45 50 Facebook engagement rate Facebook engagement rate 0 5 10 15 20 25 30 35 40 45 50 Instagram engagement rate Instagram engagement rate
  • 26.
    B2B social mediaengagement rates 0 0.5 1 1.5 2 2.5 3 LinkedIn engagement rate LinkedIn engagement rate 0 10 20 30 40 50 60 70 80 Pinterest engagement rate Pinterest engagement rate
  • 27.
    B2B social mediaengagement rates 0 0.5 1 1.5 2 2.5 Twitter engagement rate Twitter engagement rate
  • 28.
    Social media engagementand how television advertising affects it
  • 29.
    Social media engagementand television Social engagement drivers (%) TV advertising Social platform advertising Combined TV and social platform advertising All other advertising Social engagement drivers (%) minus other advertising Social platform advertising TV advertising Combined TV and social platform advertising Turner & 4C: Television Advertising is a Key Driver of Social Media Engagement for Brands
  • 30.
    Social media engagementand television TV advertising impressions (%) Premium content (sports, live and original) Non-premium content % TV advertising impact on social brand engagement Premium content Non-premium content Turner & 4C: Television Advertising is a Key Driver of Social Media Engagement for Brands
  • 31.
    Engagement to impressionsindex 0 50 100 150 200 250 Premium content Non-premium content Engagement to impressions index Engagement to impressions index 0 100 200 300 400 Original content Sports Live Expressions to Impressions Index for premium TV content types Expressions to Impressions Index for premium TV content types Turner & 4C: Television Advertising is a Key Driver of Social Media Engagement for Brands
  • 32.
    Engagement to costindex 0 50 100 150 200 Premium content Non-premium content Engagement to cost index Engagement to cost index 0 50 100 150 200 250 300 Original content Sports Live Reaility Expressions to Impressions Index for premium content types Expressions to Impressions Index Turner & 4C: Television Advertising is a Key Driver of Social Media Engagement for Brands
  • 33.
  • 34.
    UK aggregate adagency billings suffering from ‘lost decade’ of growth 0 5 10 15 20 25 30 35 2008 2009 2010 2011 2012 2013 2014 2015 2016 2017 2018 2019 2020 Source: Statista.com billions USD 24/05/16 Initial presentation for SteelHouse 34
  • 35.
    Optimium number ofadvertising channels • Careful channel selection • Datapoint is contrary to the trend towards complex programmatic based advertising mixes 0 10 20 30 40 50 60 70 80 1 channel 2 channels 3 channels 4 channels 5 channels Average effectiveness success rate (IPA 2012) Average effectiveness success rate
  • 36.
    Audience time spentv. advertising spend share 0 5 10 15 20 25 30 35 40 45 50 Television Out of Home (OOH) Radio Internet National newspaper Regional newspaper Magazines % media time share % advertising spend share Guardian Publishing Trends 2016 drawing on: AA, Barb, Rajar, ComScore, NRS,
  • 37.
    Audience time spentv. advertising spend share - China 0 5 10 15 20 25 30 35 40 45 50 Mobile (non-voice) Desktop / laptop computing Television Radio Newspapers Magazines % media time share % advertising spend share eMarketer April 2016
  • 38.
    Digital ad spendby region (2016) 0 20 40 60 80 100 120 140 160 180 North America Western Europe Latin America Asia Pacific Central & Eastern Europe Middle East & Africa (US$ per capita) (US$ per capita) Strategy Analytics
  • 39.
    Advertising spend trends 0 5 10 15 20 25 30 35 40 45 50 20142015 2016 2017 2018 2019 2020 Share of US advertising spend TV Digital Print Radio Out-of-home Directories 0 2 4 6 8 10 12 14 16 18 20 2014 2015 2016 2017 2018 2019 2020 Share of US advertising spend for print categories Pinrt (overall) Newspapers (print only) Magazines (print editions only) Directories (print only) eMarketer.com March, 2016
  • 40.
    Advertising spend trends 0 5 10 15 20 25 30 35 40 45 50 20142015 2016 2017 2018 2019 2020 Share of US advertising spend for digital channels Digital Mobile 0 5 10 15 20 25 30 35 40 45 2014 2015 2016 2017 2018 2019 2020 Share of US advertising spend for broadcast categories Television Radio (excluding catch-up and digital eMarketer.com March, 2016
  • 41.
    Desktop display adviewability by market 0 10 20 30 40 50 60 Australia Brazil Canada France Italy Germany Spain UK US comScore vCE Benchmarks, Global, Q1 2016 % Viewable
  • 42.
    Video ad viewabilityrates 0 10 20 30 40 50 60 70 80 90 100 YouTube Rest of web and apps Tablet Tablet % viewability Google DoubleClick Global State of Play report (July 2016)
  • 43.
    Video ad viewabilityrates 0 10 20 30 40 50 60 70 80 90 100 YouTube Rest of web and apps Desktop Desktop % viewability 0 10 20 30 40 50 60 70 80 90 100 YouTube Rest of web and apps Mobile Mobile % viewability
  • 44.
    Video has lowerviewability than display 36 38 40 42 44 46 48 50 US desktop display US desktop video comScore vCE Benchmarks, US, Q1 2016 % Viewability Apparently due to high invalid traffic on programmatic exchanges where video is commonly traded.
  • 45.
    Programmatic magnifies invalidtraffic problem 0 1 2 3 4 5 6 7 Direct Programmatic % Invalid traffic US desktop display ads % Invalid traffic US desktop display ads 0 2 4 6 8 10 Direct Programmatic % invalid traffic US desktop video ads % invalid traffic US desktop video ads comScore vCE Benchmarks, US, Q1 2016
  • 46.
    Ad targeting andad blocking
  • 47.
    Attitudes to ad-targetingby generation 0 10 20 30 40 It's about time advertisers recognised that my generation shops too I am more likely to click on an advertisement aimed specifically at my generation I feel like my generation is often forgotten about by advertisers I am more likely to purchase a product from a brand whose ad is targeted specifically at my generation Millennial respondents (%) Millenial respondents (%) 0 5 10 15 20 25 30 35 I am more likely to purchase a product from a brand whose ad is targeted specifically at my generation I am more likely to click on an advert aimed specifically at my generation I feel like my generation is often forgotten about by advertisers I am more likely to purchase a product from a brand whose ad is targeted specifically at my generation Boomer respondents (%) Boomer respondents (%) Audience Theory / Yahoo! Quantative November 2015 – Yahoo! /Ipsos Gen X Survey Adults 35-54 n=853 US
  • 48.
    Attitudes to ad-targetingby generation 0 10 20 30 40 It's about time advertisers recognised that my generation shops too I am more likely to click on an advertisement aimed specifically at my generation I feel like my generation is often forgotten about by advertisers I am more likely to purchase a product from a brand whose ad is targeted specifically at my generation Generation-X respondents (%) Generation-X respondents (%) 0 10 20 30 40 50 I am more likely to purchase a product from a brand whose ad is targeted specifically at my generation I am more likely to click on an advert aimed specifically at my generation I feel like my generation is often forgotten about by advertisers I am more likely to purchase a product from a brand whose ad is targeted specifically at my generation Generation-X parents respondents (%) Generation-X parents respondents (%) Audience Theory / Yahoo! Quantative November 2015 – Yahoo! /Ipsos Gen X Survey Adults 35-54 n=853 US
  • 49.
    Ad blocking software 0 20000000 40000000 60000000 80000000 100000000 120000000 140000000 160000000 180000000 200000000 Jan-10Jan-11 Jan-12 Jan-13 Jan-14 Jan-15 Installed base of ad blockers Installed base of ad blockers Data from Pagefair & Adobe, 2015 Ad Blocking Report via Guardian Publishing Trends 2016. 800% growth in user base over a 5 year period.
  • 50.
    Ad blocking millennials 020 40 60 80 100 120 Male millennial Female millennial % likelihood to ad block compared to population as a whole % likelihood to ad block comScore Custom Analytics, US, 2015
  • 51.
    Internet users worldwidewho have blocked an advert 0 5 10 15 20 25 30 35 40 Q1 2015 Q2 2015 Q3 2015 Q4 2015 Respondents aged 16-64, in the past month on their main computer (GlobalWebIndex Blog January 22 2016) % respondents
  • 52.
    Share of timespent viewing video content in selected countries using ad blockers 0 10 20 30 40 50 60 70 Germany Canada UK France US Russia % of total time spent viewing desktop video content via JW Player (Q2, 2015) % of total time spent viewing desktop video content Secret Media & JW Player “Adblock & the Global Video Market September 14, 2015
  • 53.
    Adblocker installed baseby country 0 5 10 15 20 25 30 35 Turkey Latvia Spain Canada Denmark Brazil (mid-point estimate) Greece Hungary Netherlands UK Argentina Czech Republic (mid-point estimate) Germany USA (mid-point estimate) Chile Italy (any device) France (desktop) Poland Austria (any device) % Users with adblocking installed % Users with adblocking installed Group M ‘Interaction 2016 report’ April 25, 2016
  • 54.
    Ad blocking skewstowards higher income segments across markets 0 5 10 15 20 25 30 USA Canada UK Germany % increase in blocking for highest income segments in comparison to average user % increase in blocking for highest income segments in comparison to average user comScore Custom Analytics, Global, 2015
  • 55.
    Page load times 0 5 10 15 20 25 30 35 40 45 Loadtime in seconds Editoral content Advertising content Guardian Publishing Trends 2016 drawing on analysis by comScore, Pew Research Center & New York Times
  • 56.
  • 57.
    Global e-commerce 0 0.2 0.4 0.6 0.8 1 1.2 1.4 1.6 1.8 2 2013 20152016 Global e-commerce by value including travel Trillions USD • Equivalent of 8% of global retail sales • CAGR 13.96% since 2013 • All platforms (mobile web, app and desktop) Data from Group M reports ‘Interaction 2015’ and ’Interaction 2016’
  • 58.
    Online shopping cartabandonment 69 70 71 72 73 74 75 76 77 Asia-Pacific Middle East & Africa Latin America North America§ Europe SaleCycle, “The Remarketing Report – Q1, 2016 % digital shopping cart abandonment
  • 59.
    Digital showroom andretailing 0 10 20 30 40 50 60 0 5 10 15 20 25 30 35 40 45 50 Category purchase online versus research online Purchased online Researched online Computer software & hardware DVDs / videos Electronics Video games Books Furniture Clothing Groceries Household products Office supplies Health & Beauty McKinsey iConsumer (Europe 2011) via iConsumers: Life Online by McKinsey & Company (January 2013)
  • 60.
    US e-tailing growth 010 20 30 40 50 Video games, consoles & accessories Toys & hobbies Sport & fitness Jewelery & watches Event tickets Music, movies & videos Flowers, greetings & misc gifts Apparel & accessories Home & garden Furniture, appliances & equipment Computer software Books & magazines Consumer electronics Consumer packaged goods Office supplies Digital content & subscriptions Computers & peripherals year-on-year % change in total dollars (US retailers only) year-on-year % change in total dollars (US retailers only) • Data from comScore (2016 U.S. Cross-Platform Future in Focus) • Markets being compared vary in digital maturity and overall growth rate – regardless of channel
  • 61.
    Purchases on WeChat(China) Volume of purchases initiated JD.com entrances WeChat Public accounts Links to other apps Moments or chat groups 0 5 10 15 20 25 30 35 2015 2016 % users who have shopped from WeChat % users who have shopped from WeChat How savvy, social shoppers are transforming Chinese e-commerce – McKinsey & Company April, 2016 (n=525)
  • 62.
    China – mobilemusic revenues 0 2 4 6 8 10 12 14 16 18 2013 2014 2015 2016 2017 2018 Billions of yuanAnalysys International ‘Q4 2015 China Music Market Report
  • 63.
    Formal bank accounts 020 40 60 80 100 120 Japan Singapore Australia Thailand Indonesia Bangladesh Pakistan % population with formal bank account % population with formal bank account
  • 64.
    Mobile payments indeveloping countries 0 20 40 60 80 100 Europe & Central Asia Middle East & North Africa East Asia & Pacific Latin American & Caribbean South Asia Sub-Saharan Africa % of population with access to mobile payments % of population with access to mobile payments 0 20 40 60 80 100 Lower income economies Low-middle-income economies Upper-middle-income economies % population with access to mobile payments % population with access to mobile payments Data from: ‘Advancing Digital Societies in Asia’ GSMA (May 2016)
  • 65.
  • 66.
    UK adult dailymedia consumption 0 2 4 6 8 10 12 2012 2013 2014 2015 2016 2017 2018 UK adults: average time spent per day on media Digital TV (non digital) Radio (non digital) Print 0 1 2 3 4 5 6 2012 2013 2014 2015 2016 2017 2018 UK adults: average time spent per day on digital media Smartphone Tablet Featurephone Desktop / laptop Source: eMarketer, April 2016
  • 67.
    US digital videoadvertising 0 20 40 60 80 100 YouTube Cable / satellite TV Instagram Blu-ray / DVD Hulu Amazon Prime Video Tumblr Twitch Sling TV Platforms on which US 13-24 yr olds view video (Defy Media Acumen Report: Youth Video diet March 31, 2016) % of respondents 0 20 40 60 80 Google / YouTube Facebook Hulu ABC Yahoo! ESPN Twitter NBC A&E CN iAd Where US marketers intend to use for digital video advertising (Advertiser Perceptions , Video Advertising Report Wave 4, Winder 2016 – April 13, 2016) % Respondents
  • 68.
    Share of contentcategory time spent by platform 0% 10% 20% 30% 40% 50% 60% 70% 80% 90% 100% comScore Media Metrix Multi-Platform US December, 2015 Desktop Mobile
  • 69.
    Share of timespend on their top apps for US mobile users 0 20 40 60 80 100 Most used app Top two apps Top three Top four Top five Smartphone % of time spent 0 20 40 60 80 100 Most used app Top two apps Top three Top four Top five Tablet % of time Data: comScore Mobile App Report 2015
  • 70.
    Growth in DigitalMedia Time Spent in Minutes (MM) 0 200000 400000 600000 800000 1000000 1200000 1400000 1600000 Dec 2013 Dec 2014 Dec 2015 comScore Media Metrix Multi-Platform & Mobile Metrix US Dec 2015 vs. Dec 2014 vs. Dec 2013 Desktop Smartphone Tablet
  • 71.
    Which app notificationsusers tune out 0 10 20 30 40 50 60 70 80 90 Shopping Social networking Finance News Food & drink Data by Apptentive based on a panel of 7,000 mobile apps % of users who interacted with notification sent via app
  • 72.
    Global smartphone ownership 0 10 20 30 40 50 60 70 80 90 100 Datafrom Pew Research Spring 2015 Global Attitudes survey Q71 & Q72 % of survey respondents who claim to own a smartphone
  • 73.
    US Consumers’ mostfrequently-used mobile app types 0 10 20 30 40 50 60 70 Smartphone % respondents used app types frequently 0 5 10 15 20 25 30 35 40 45 Tablet % respondents used app types frequently Data from Deloitte via MarketingCharts.com
  • 74.
    Generation X mobileengagement 0 20 40 60 80 100 120 140 160 7am-10am 11am-2pm 3pm-6pm7pm-10pm 11pm-6am Generation X time of day usage by category indexed vs. general population News & Magazines Health & Fitness Lifestyle & Shopping Music, media & entertainment Games Messaging & Social Sports Utilities & Productivity Flurry by Yahoo! Analytics (mapped devices only. May 2015)
  • 75.
    US mobile consumerbehaviour 0 0.5 1 1.5 2 2.5 3 3.5 4 4.5 2011 2012 2013 2014 2015 2016 2017 Hours per day usage In-app time Mobile web time 0 0.5 1 1.5 2 2.5 3 3.5 4 4.5 2011 2012 2013 2014 2015 2016 2017 Hours per day usage Smartphone time Tablet time
  • 76.
    US mobile consumerbehaviour 0 1 2 3 4 5 6 2011 2012 2013 2014 2015 2016 2017 In-app usage hours per day usage Smartphone time Tablet time 0 0.1 0.2 0.3 0.4 0.5 0.6 0.7 0.8 0.9 1 2011 2012 2013 2014 2015 2016 2017 Mobile web hours per day usage Smartphone time Tablet time
  • 77.
    Daily time spenton Facebook (US consumers) 0 0.05 0.1 0.15 0.2 0.25 0.3 0.35 0.4 0.45 2013 2014 2015 2016 2017 2018 Hours/day Desktop usage Mobile usage eMarketer, April 2016
  • 78.
    US digital users2014-2020 0 50 100 150 200 250 300 2014 2015 2016 2017 2018 2019 2020 Millions US internet users Desktop / laptop only users Dual desktop / laptop and mobile internet users Mobile only internet users eMarketer February, 2016
  • 79.
    US TV multitaskingbehaviour 0 10 20 30 40 50 60 Browse & surf the web Use a social network Read email Text message Browse for products/services online Play video games Don't multitask - just watch TV 26-32 year olds 19-25 year olds 14-18 year olds Data from MarketingCharts.com via Deliotte from a behaviour survey they had commissioned in 2015 Watchouts: data is based on recalled behaviour rather than observation Millennials
  • 80.
    US simultaneous internet& TV user penetration (% by device) 0.00% 10.00% 20.00% 30.00% 40.00% 50.00% 60.00% 70.00% 80.00% 90.00% 2014 2015 2016 2017 2018 Source: eMarketer, May 2016 Smartphone internet & TV users Desktop/laptop internet & TV users Tablet internet & TV users
  • 81.
    US TV multitaskingbehaviour 0 5 10 15 20 25 30 35 Browse & surf the web Use a social network Read email Text message Browse for products / services online Play video games Don't multitask - just watch TV Generation X (33-49 year olds) Generation X (33-49 year olds) 0 5 10 15 20 25 30 Browse & surf the web Use a social network Read email Text message Browse for products / services online Play video games Don't multitask - just watch TV Baby boomers (50-68 year olds) Baby boomers (50-68 year olds)
  • 82.
    Reasons for shoppingvia mobile phone amongst APAC internet users 0 10 20 30 40 50 60 70 80 Convenience Shopping can be done on- the-go More and more apps that make it easy to shop online Good way to pass time Common amongst friends % of respondents China Hong Kong Japan South Korea Taiwan MasterCard ‘Mobile Shopping Survey 2016 Asia Pacific’ February 18, 2016
  • 83.
    Average time spentwith media/day by Chinese adults 0 1 2 3 4 5 6 7 2012 2013 2014 2015 2016 2017 Time in hours Digital TV (excluding digital) Radio (excluding digital) Print 0 0.5 1 1.5 2 2.5 3 3.5 2012 2013 2014 2015 2016 2017 Time in hours spent on digital media Smartphone Tablet Feature phone Desktop / laptop computer
  • 84.
    Device adoption amongstChinese digital consumers 0 20 40 60 80 100 120 2015 2016 Online shopping PC only users PC& mobile device users Mobile only users 0 20 40 60 80 100 120 2015 2016 Social network usage PC only users PC and mobile users Mobile only users How savvy, social shopppers are transforming Chinese e-commerce – McKinsey April, 2016
  • 85.
    Chinese mobile use -500 50 100 150 200 250 300 Photography Health & Fitness Travel & Navigation Lifestyle & Shopping Messaging & Social Utilities & Productivity Music, Media & Entertainment Games Data at Flurry Analytics % incease (year-on-year)
  • 86.
    Most often usedpayment methods by Chinese netizens 0 10 20 30 40 50 60 70 Third-party online payment Third-party mobile payment E-bank PoS machine Mobile banking WeChat bank Pre-paid card payment Research from Tencent (2014) % of netizens
  • 87.
    Frequency with WhichChinese Smartphone Users Use Mobile Payments for In-Store Purchases 0 5 10 15 20 25 30 35 40 45 50 Only when I have a promotional discount Never Always Most of the time Sometimes Economist Corporate Network (ECN) / Admaster – The Road to Everywhere: The Omni- Journey’ of the Chinese Consumer March 16, 2016 % respondents
  • 88.
    Chinese online population 0 10 20 30 40 50 60 70 20142015 2016 2017 2018 2019 2020 % population online (eMarketer, April 2016) Male population online % Female population online % Overall population online %
  • 89.
    China penetration ofsocial media platforms 0 10 20 30 40 50 60 2014 2015 % of Chinese internet users % of Chinese internet users 0 10 20 30 40 50 60 70 80 16-25 26-35 36-45 46-55 >55 % of Chinese internet users by age 2014 2015 Source: China Internet Watch
  • 90.
    China vs WorldwideVideo Ad Receptiveness 0 5 10 15 20 25 30 35 Live TV via TV set On demand / connected TV - set-top box Desktop/laptop Smartphone Tablet Receptivity to video ads by channel / device – (AdReaction: Video Creative in a Digital World Kantar Millward Brown / OnDevice Research) Worldwide China
  • 91.
    Types of websiteon which Chinese netizens surveyed pay attention 0 20 40 60 80 100 E-commerce sites Search engines Portal sites Digital video sites Social networks/blogs Microblogs Verticial sites Gaming sites Pay attention (%) Pay attention (%) 0 10 20 30 40 50 60 70 E-commerce sites Search engines Portal sites Digital video sites Social networks/blogs Microblogs Vertical sites Gaming sites Click (%) Click (%) Via iResearch Consulting Group ‘2016 Report on China Internet Users Behaviors Toward Digital Advertising’ March 2016 n=1,604
  • 92.
    Actions Chinese netizenslikely to take when they have good experience with brand / company 0 10 20 30 40 50 60 70 Tell friends & family Search online/offline to learn… Interact more with company/brand Follow them on WeChat Install their mobile app Buy more, even if less costly… Share the experience on social… Post positive comments online Follow them on Weibo Subscrible to their email… Post comments on their social… Contact them about the experience Subscribe to the brand's video… % respndents % respndents • Prompted response rather than observation • Tier 1 & 2 cities respondents • 18-64 year olds Epsilon ‘The Always-On Chinese Consumer Experience’ January 18, 2016
  • 93.
    Japanese paid videoviewing habits 0 10 20 30 40 50 60 70 Purchase / rent Blu -ray / DVD Cable TV Satellite TV (paid) Paid OTT video services Nielsen – Japan Video Contents & Ads Report April 14, 2016 n=2,000 ages 15+ % of respondents
  • 94.
  • 95.
    Global mobile deviceunits 0 200 400 600 800 1000 1200 1400 1600 2010 2011 2012 2013 2014 2015 2016 Sales units (millions) units (millions) tablets units (millions) smartphones Data: GfK/CTA Digital World via Consumer Technology Association ‘Technology World Tour’ by Steve Koenig January 2016
  • 96.
    Global mobile deviceunits -50 0 50 100 150 200 250 300 2011 2012 2013 2014 2015 2016 Sales units (YoY % change) units (YoY % change) tablets units (YoY % change) smartphones Data: GfK/CTA Digital World via Consumer Technology Association ‘Technology World Tour’ by Steve Koenig January 2016
  • 97.
    Global smartphone unitsby geography 0% 10% 20% 30% 40% 50% 60% 70% 80% 90% 100% 2010 2011 2012 2013 2014 2015 2016 Sales units (YoY % change) Developed market (% units) Emerging markets (% units) Data: GfK/CTA Digital World via Consumer Technology Association ‘Technology World Tour’ by Steve Koenig January 2016
  • 98.
    Global tablet unitsby geography 0% 10% 20% 30% 40% 50% 60% 70% 80% 90% 100% 2010 2011 2012 2013 2014 2015 2016 Sales units (YoY % change) Developed market (% units) Emerging markets (% units) Data: GfK/CTA Digital World via Consumer Technology Association ‘Technology World Tour’ by Steve Koenig January 2016
  • 99.
    Smartphone screen size(global) 0 20 40 60 80 100 120 2015 Q1 2016 Q1 % of smartphone population 3 - 4 inch 4 - 4 1/2 inch 4 1/2 - 5 inch 5 - 5 1/2 inch 5 1/2 - 6 inch 6 - 6 1/2 inch Scientamobil e
  • 100.
    Smartphone screen size(Asia) 0.00 20.00 40.00 60.00 80.00 100.00 120.00 2014 Q4 2015 Q1 2015 Q2 2015 Q3 2015 Q4 2016 Q1 2016 Q2 2016 Q3 % of smartphone population 2 - 3 inch 3 - 4 inch 4 - 4 1/2 inch 4 1/2 - 5 inch 5 - 5 1/2 inch 5 1/2 - 6 inch 6 - 6 1/2 inch 6 1/2 inch + Scientamobil e
  • 101.
    Smartphone screen size(North America) 0.00 20.00 40.00 60.00 80.00 100.00 120.00 2014 Q4 2015 Q1 2015 Q2 2015 Q3 2015 Q4 2016 Q1 2016 Q2 2016 Q3 % of smartphone population 2 - 3 inch 3 - 4 inch 4 - 4 1/2 inch 4 1/2 - 5 inch 5 - 5 1/2 inch 5 1/2 - 6 inch 6 - 6 1/2 inch 6 1/2 inch + Scientamobil e
  • 102.
    Smartphone screen size(Europe) 0.00 20.00 40.00 60.00 80.00 100.00 120.00 2014 Q4 2015 Q1 2015 Q2 2015 Q3 2015 Q4 2016 Q1 2016 Q2 2016 Q3 % of smartphone population 2 - 3 inch 3 - 4 inch 4 - 4 1/2 inch 4 1/2 - 5 inch 5 - 5 1/2 inch 5 1/2 - 6 inch 6 - 6 1/2 inch 6 1/2 inch + Scientamobil e
  • 103.
    Smartphone screen size(South America) 0 20 40 60 80 100 120 2014 Q4 2015 Q1 2015 Q2 2015 Q3 2015 Q4 2016 Q1 2016 Q2 2016 Q3 % of smartphone population 2 - 3 inch 3 - 4 inch 4 - 4 1/2 inch 4 1/2 - 5 inch 5 - 5 1/2 inch 5 1/2 - 6 inch 6 - 6 1/2 inch 6 1/2 inch + Scientamobil e
  • 104.
    Smartphone screen size(Africa) 0 20 40 60 80 100 120 2014 Q4 2015 Q1 2015 Q2 2015 Q3 2015 Q4 2016 Q1 2016 Q2 2016 Q3 % of smartphone population 2 - 3 inch 3 - 4 inch 4 - 4 1/2 inch 4 1/2 - 5 inch 5 - 5 1/2 inch 5 1/2 - 6 inch 6 - 6 1/2 inch 6 1/2 inch + Scientamobil e
  • 105.
    Smartphone screen size(Oceania) 0 20 40 60 80 100 120 2014 Q4 2015 Q1 2015 Q2 2015 Q3 2015 Q4 2016 Q1 2016 Q2 2016 Q3 % of smartphone population 2 - 3 inch 3 - 4 inch 4 - 4 1/2 inch 4 1/2 - 5 inch 5 - 5 1/2 inch 5 1/2 - 6 inch 6 - 6 1/2 inch 6 1/2 inch + Scientamobil e
  • 106.
    Global mobile deviceASP (USD) 0 100 200 300 400 500 600 700 800 2010 2011 2012 2013 2014 2015 2016 Average selling price Tablet USD Smartphone USD Data: GfK/CTA Digital World via Consumer Technology Association ‘Technology World Tour’ by Steve Koenig January 2016
  • 107.
  • 108.
    VR headsets: bybrand, market share % (2016) 0 5 10 15 20 25 30 35 40 45 Samsung Gear VR Google Cardboard Sony Playstation VR HTC Vive Oculus Rift Google Daydream Others* Source: IHS Markit % share
  • 109.
    Wearables by category(millions of units) 0 20 40 60 80 100 120 140 160 180 200 2015 2016 2017 Fitness wearables Head mounted display Body worn camera Bluetooth headset
  • 110.
    Fitness wearables (millionsof units) 0 10 20 30 40 50 60 70 80 2015 2016 2017 Data by Gartner Smartwatch Wristband Chest strap Sports watch Other fitness monitor
  • 111.
    Wearables versus othermobile devices (millions of units) 0 200 400 600 800 1000 1200 1400 1600 2015 2016 Smartphones (millions) units Tablets (millions) units Wearables (millions) units Data: Gartner & GfK/CTA Digital World via Consumer Technology Association ‘Technology World Tour’ by Steve Koenig January 2016
  • 112.
  • 113.
    Countries with highestamount of IoT devices / person 0 5 10 15 20 25 30 35 40 Korea Denmark Switzerland US Netherlands Germany Sweden Spain France Portugal Belgium UK Data from Shodan and OECD Devices online per 100 people
  • 114.
    Number of connectedobjects (global) 0 10 20 30 40 50 60 2012 2013 2014 2015 2016 2017 2018 2019 2020 Billions of connected objects Billions of connected objects Data: Cisco
  • 115.
  • 116.
    Estimated consumer droneshipments (global) 0 5 10 15 20 25 30 35 2014 2015 2016 2017 2018 2019 2020 2021 millions of units millions of units Business Insider Intelligence estimates. Known unknowns include: • When does a toy become a consmer drone? • Basis for their estimates • Murky regulatory environment, especially in the case • Domestic security • Aircraft near-misses • Dual use military technology in the hands of non-state actors
  • 117.
  • 118.
    Mobile and fixedline access 0 10 20 30 40 50 60 70 Mobile Telecoms services Asia only % penetration World % penetration 0 20 40 60 80 100 Japan Singapore Australia Thailand Indonesia Bangladesh Pakistan Broadband penetration by access type Mobile % penetration Fixed % penetration ‘Advancing Digital Societies in Asia’ GSMA May 2016
  • 119.
    Global technology sales(units) 6200 6300 6400 6500 6600 6700 6800 6900 2011 2012 2013 2014 2015 2016 units (millions) units (millions) Data: GfK/CTA Digital World via Consumer Technology Association ‘Technology World Tour’ by Steve Koenig January 2016
  • 120.
    Global technology sales(units) -5 -4 -3 -2 -1 0 1 2 3 4 5 2011 2012 2013 2014 2015 2016 YoY % change in units sold YoY % change in units sold Data: GfK/CTA Digital World via Consumer Technology Association ‘Technology World Tour’ by Steve Koenig January 2016
  • 121.
    Global technology unitssold by category -100 -50 0 50 100 150 Unit % change 2014 YoY % 2015 YoY % 2016 YoY % Data: GfK/CTA Digital World via Consumer Technology Association ‘Technology World Tour’ by Steve Koenig January 2016
  • 122.
    Global technology salesrevenue 900 920 940 960 980 1000 1020 1040 1060 2011 2012 2013 2014 2015 2016 Sales (billions USD) USD (billions) Data: GfK/CTA Digital World via Consumer Technology Association ‘Technology World Tour’ by Steve Koenig January 2016
  • 123.
    Global technology sales(revenue) geographic split 0% 10% 20% 30% 40% 50% 60% 70% 80% 90% 100% 2012 2013 2014 2015 2016 Revenue USD (% split) Developed markets Developing markets Data: GfK/CTA Digital World via Consumer Technology Association ‘Technology World Tour’ by Steve Koenig January 2016
  • 124.
    Global technology sales(revenue) geographic split 0 20 40 60 80 100 120 2011 2012 2013 2014 2015 2016 Revenue USD (% split) Developed Asia Western Europe Middle East & Africa Emerging Asia North America C&E Europe / CIS Latin America Data: GfK/CTA Digital World via Consumer Technology Association ‘Technology World Tour’ by Steve Koenig January 2016
  • 125.
    Global technology salesrevenue (USD) -10 -8 -6 -4 -2 0 2 4 6 8 10 2011 2012 2013 2014 2015 2016 YoY % change in sales revenue (USD) YoY % change in sales revenue (USD) Data: GfK/CTA Digital World via Consumer Technology Association ‘Technology World Tour’ by Steve Koenig January 2016
  • 126.
    Economic data -2 -1 0 1 2 3 4 5 6 7 8 9 2012 20132014 2015 2016 2017 2018 GDP Forecast (World Bank) Global China U.S . Eurozone Developing World excluding BRICs -3 -2 -1 0 1 2 3 4 5 6 2012 2013 2014 2015 2016 2017 Retail sales (various sources) Global U.K. U.S. Eurozone
  • 127.
    Consumer sectors CPG(as bellwether), consumer technology as (former?) shooting star -5 -4 -3 -2 -1 0 1 2 3 2010 2011 2012 2013 2014 2015 CPG % growth (Euromonitor data) Packaged Foods Home Care Personal Care | Beauty -20 0 20 40 60 80 100 2010 2011 2012 2013 2014 2015 2016 2017 2018 2019 Consumer Technology % growth (Various) Smartphones Tablets Smart TVs
  • 128.
    About me Amazon authorpage: amzn.to/1SeO5Il LinkedIn page: linkedin.com/in/gedcarroll About: renaissancechambara.jp/about Blog: renaissancechambara.jp Email address found here: scr.im/renaissance Twitter account: @r_c Sina Weibo: renaissancechambara WeChat
  • 129.
    thank you |谢谢 | míle buíochas! | 감사합니다 | danke | ありがとう | merci | спасибо | cám ơn | whakawhetai | takk | ขอขอบคุณคุณ | terima kasih | σας ευχαριστώ | grazie | ‫|شكرا‬ þakka þér | დიდი მადლობა | kiitos | நன்றி | gracias

Editor's Notes

  • #8 http://www.nielsen.com/us/en/insights/news/2016/tops-of-2016-digital.html
  • #9 http://uk.businessinsider.com/mobile-app-install-add-report-2016-4-28?utm_source=feedburner&utm_medium=feed&utm_campaign=Feed%3A+typepad%2Falleyinsider%2Fsilicon_alley_insider+%28Silicon+Alley+Insider%29&r=US&IR=T
  • #10 https://www.techinasia.com/app-annie-predicts-worldwide-app-downloads-hit-280-billion-2020
  • #11 https://www.techinasia.com/wechat-blasts-700-million-monthly-active-users-tops-chinas-popular-apps
  • #12 http://www.emarketer.com/Article/Microsoft-Ad-Revenues-Continue-Rebound/1013854?ecid=NL1007
  • #13 http://searchengineland.com/google-now-handles-2-999-trillion-searches-per-year-250247
  • #15 http://blogs.forrester.com/ryan_skinner/16-03-21-dont_bet_on_your_video_subscribers
  • #16 https://www.theinformation.com/facebook-videos-live-fast-die-young?token=883b955ab34f1befaf792511204ac5ac9644f790 Facebook’s quick peak makes it more attractive for say film companies, YouTube’s content makes more sense for always on content
  • #17 https://civicscience.com/watch-now-watch-later-depth-look-dvr-play-back-behavior/
  • #18 https://www.l2inc.com/retail-fashion-beauty-brands-purchase-most-ads-on-instagram/2016/blog
  • #19 http://www.adweek.com/news/technology/snapchat-suddenly-attracting-lot-more-millennial-women-men-170560
  • #20 http://techcrunch.com/2016/05/26/snapchat-series-f/
  • #21 http://variety.com/2016/data/news/snapchat-content-survey-how-much-millennials-actually-use-live-stories-discover-and-more-1201736616/
  • #22 http://variety.com/2016/data/news/snapchat-content-survey-how-much-millennials-actually-use-live-stories-discover-and-more-1201736616/
  • #24 Includes likes shares comments and other interactions http://www.emarketer.com/Article/Leading-Retailers-See-Best-Facebook-Interaction-Rates/1013761
  • #25 http://www.marketingcharts.com/online/b2b-social-media-brand-post-engagement-rates-by-industry-and-platform-66699/attachment/trackmaven-b2b-social-media-engagement-rates-in-2015-apr2016/
  • #30 US orientated data by Turner Broadcasting and 4C
  • #31 US orientated data by Turner Broadcasting and 4C
  • #38 http://www.emarketer.com/Article/Digital-Overtakes-Traditional-Media-China-TV-Consumption-Holds-Strong/1013881?ecid=NL1007
  • #39 https://www.strategyanalytics.com/strategy-analytics/news/strategy-analytics-press-releases/strategy-analytics-press-release/2016/07/13/apac-to-overtake-north-america-as-world-s-biggest-digital-ad-market#.WGq19T2cbUK
  • #45 http://www.comscore.com/Insights/Data-Mine/comScore-Q1-2016-Advertising-Benchmarks?utm_source=feedburner&utm_medium=%24%7Bdatamine%7D&utm_campaign=Feed%3A+comscoredatagems+%28comScore+Data+Mine%29#imageview[comscore-advertising-benchmarks2]/6/
  • #50 http://www.slideshare.net/JessMorton/guardian-publishing-trends-2016-58097540
  • #51 http://www.comscore.com/Insights/Data-Mine/comScore-Q1-2016-Advertising-Benchmarks?utm_source=feedburner&utm_medium=%24%7Bdatamine%7D&utm_campaign=Feed%3A+comscoredatagems+%28comScore+Data+Mine%29#imageview[comscore-advertising-benchmarks2]/0/
  • #54 http://www.prnewswire.com/news-releases/groupms-interaction-2016-viewability-fraud-adblocking-and-mobilization-require-industry-solutions-for-160b-global-digital-ad-market-300256105.html
  • #56 http://www.slideshare.net/JessMorton/guardian-publishing-trends-2016-58097540
  • #58 http://www.prnewswire.com/news-releases/groupms-interaction-2016-viewability-fraud-adblocking-and-mobilization-require-industry-solutions-for-160b-global-digital-ad-market-300256105.html https://groupmp6160223111045.blob.core.windows.net/cmscontent/admin.groupm.com/api/file/710
  • #59 http://www.emarketer.com/Article.aspx?R=1013966&ecid=NL1014&mkt_tok=eyJpIjoiWVRsbFlUZGhaV1pqWlRnMyIsInQiOiI2T0h0QTdoNVlhcUFoaEN2cE8xeVRhcEVhTkVPZEZrZk5JSDlKNWN2TnJnR0JaanpcL2kwd05TUUVSR2lIdEdOVTlLUHJITldqcVNnbEZTYTRSTXFpVnY3MldnRTB2TlFma3ZVcU9IZGZ6V1U9In0%3D
  • #60 https://tmt.mckinsey.com/content/publications/all/view/iConsumers-Lifeonline_2013-01
  • #61 https://www.comscore.com/Insights/Presentations-and-Whitepapers/2016/2016-US-Cross-Platform-Future-in-Focus
  • #62 http://www.mckinsey.com/industries/retail/our-insights/how-savvy-social-shoppers-are-transforming-chinese-e-commerce
  • #63 http://www.emarketer.com/Article/Big-Growth-Mobile-Music-Revenues-China/1013860?ecid=NL1013
  • #65 https://www.gsmaintelligence.com/research/?file=9f48d32ff0671fb7dbbcb4efb84eabc0&download
  • #67 http://www.emarketer.com/Article/Daily-Media-Time-Still-Increasing-UK/1014000?ecid=NL1002
  • #68 http://www.emarketer.com/Article/Video-Ad-Spending-on-Social-Platforms-Rising-Fast/1013977?ecid=NL1002
  • #70 http://qz.com/691964/attention-starved-app-makers-are-trying-this-side-door-to-get-noticed-by-users/
  • #71 http://venturebeat.com/2016/03/30/mobile-now-captures-2-out-of-every-3-digital-media-minutes-in-u-s/?utm_source=feedburner&utm_medium=feed&utm_campaign=Feed%3A+Venturebeat+%28VentureBeat%29
  • #72 https://www.theinformation.com/spam-or-high-value-the-app-choice?token=895c6a5fd756e1ab4167e2fe082ee1f2f0b92e38 (paywall)
  • #74 http://www.marketingcharts.com/online/us-consumers-most-frequently-used-mobile-app-types-66713/attachment/deloitte-us-consumers-most-frequently-used-mobile-app-types-apr2016/
  • #76 http://hello.emarketer.com/dc/m-96XYT8JrwgmB9tQxAvO8NiatRjb1qFbjs0Q57DCzRzlQjMeaUfVIhG-qoqRSwuhd3JJPm8-fl6wUhvnmNQgQh4V7-eHp62GWPyY4B0_zVd_dXzWSquAvMKPEuLyIL4jS5i88EGXbxmkFgpA1dthBXJQ3rGfMprtqvFBT1XGig=/ZLMKv0LMD000080rX30pGS6
  • #77 http://hello.emarketer.com/dc/m-96XYT8JrwgmB9tQxAvO8NiatRjb1qFbjs0Q57DCzRzlQjMeaUfVIhG-qoqRSwuhd3JJPm8-fl6wUhvnmNQgQh4V7-eHp62GWPyY4B0_zVd_dXzWSquAvMKPEuLyIL4jS5i88EGXbxmkFgpA1dthBXJQ3rGfMprtqvFBT1XGig=/ZLMKv0LMD000080rX30pGS6
  • #78 http://www.emarketer.com/Article/Time-Spent-with-Facebook-Still-Growing-Not-by-Much/1013903?ecid=NL1007
  • #79 https://www.emarketer.com/go2016/newsletter_reader?ecid=NL1007
  • #80 http://www.marketingcharts.com/television/tv-multitasking-binge-viewing-increasingly-widespread-66671/
  • #81 http://www.emarketer.com/Article/Even-During-TV-Time-Digital-Devices-Play-Prominent-Role/1013997?ecid=NL1002
  • #83 http://www.emarketer.com/Article/Mcommerce-Means-Convenience-Asia-Pacific/1013870?ecid=NL1007
  • #84 http://www.emarketer.com/Article/Digital-Overtakes-Traditional-Media-China-TV-Consumption-Holds-Strong/1013881?ecid=NL1007
  • #85 http://www.mckinsey.com/industries/retail/our-insights/how-savvy-social-shoppers-are-transforming-chinese-e-commerce
  • #86 http://flurrymobile.tumblr.com/post/141939093780/china-the-mobile-20-x-factor
  • #88 http://www.emarketer.com/Article/Apple-Pay-Seen-Luxury-Niche-Service-China/1013887?ecid=NL1007
  • #91 http://www.emarketer.com/Article/Chinas-Mobile-Users-Not-Keen-on-Video-Ads/1013782
  • #92 http://www.emarketer.com/Article/What-Attracts-Ad-Clicks-China/1013827
  • #94 http://www.emarketer.com/Article/Paid-OTT-Video-Not-Yet-Mainstream-Way-View-Content-Japan/1013896?ecid=NL1007
  • #96 http://www.cta.tech/CorporateSite/media/Research-Media/Products%20Services/CES-2016-Global-Tech-Spending-Update_MEDIA-COPY.PDF
  • #97 http://www.cta.tech/CorporateSite/media/Research-Media/Products%20Services/CES-2016-Global-Tech-Spending-Update_MEDIA-COPY.PDF
  • #98 http://www.cta.tech/CorporateSite/media/Research-Media/Products%20Services/CES-2016-Global-Tech-Spending-Update_MEDIA-COPY.PDF
  • #99 http://www.cta.tech/CorporateSite/media/Research-Media/Products%20Services/CES-2016-Global-Tech-Spending-Update_MEDIA-COPY.PDF
  • #107 http://www.cta.tech/CorporateSite/media/Research-Media/Products%20Services/CES-2016-Global-Tech-Spending-Update_MEDIA-COPY.PDF
  • #109 http://www.economist.com/blogs/graphicdetail/2016/10/daily-chart-8
  • #110 Data from Gartner http://electroiq.com/blog/2016/02/gartner-says-worldwide-wearable-devices-sales-to-grow-18-4-percent-in-2016/
  • #112 Data from Gartner http://electroiq.com/blog/2016/02/gartner-says-worldwide-wearable-devices-sales-to-grow-18-4-percent-in-2016/ http://www.cta.tech/CorporateSite/media/Research-Media/Products%20Services/CES-2016-Global-Tech-Spending-Update_MEDIA-COPY.PDF
  • #114 https://twitter.com/magicnode/status/716018796050382848
  • #115 http://www.eetimes.com/document.asp?doc_id=1329443&_mc=NL_EET_EDT_EET_daily_20160415&cid=NL_EET_EDT_EET_daily_20160415&elqTrackId=9a303bcc2ab546668af6d4355d39243e&elq=6859ddd2986b4eb0ac64bdeff3077303&elqaid=31875&elqat=1&elqCampaignId=27806
  • #117 http://www.businessinsider.com/faa-wont-change-airspace-rules-for-drones-until-2019-2016-5?utm_source=feedburner&utm_medium=feed&utm_campaign=Feed%3A+typepad%2Falleyinsider%2Fsilicon_alley_insider+%28Silicon+Alley+Insider%29&IR=T
  • #119 https://www.gsmaintelligence.com/research/?file=9f48d32ff0671fb7dbbcb4efb84eabc0&download
  • #120 http://www.cta.tech/CorporateSite/media/Research-Media/Products%20Services/CES-2016-Global-Tech-Spending-Update_MEDIA-COPY.PDF
  • #121 http://www.cta.tech/CorporateSite/media/Research-Media/Products%20Services/CES-2016-Global-Tech-Spending-Update_MEDIA-COPY.PDF
  • #122 http://www.cta.tech/CorporateSite/media/Research-Media/Products%20Services/CES-2016-Global-Tech-Spending-Update_MEDIA-COPY.PDF
  • #123 http://www.cta.tech/CorporateSite/media/Research-Media/Products%20Services/CES-2016-Global-Tech-Spending-Update_MEDIA-COPY.PDF
  • #124 http://www.cta.tech/CorporateSite/media/Research-Media/Products%20Services/CES-2016-Global-Tech-Spending-Update_MEDIA-COPY.PDF
  • #125 http://www.cta.tech/CorporateSite/media/Research-Media/Products%20Services/CES-2016-Global-Tech-Spending-Update_MEDIA-COPY.PDF
  • #126 http://www.cta.tech/CorporateSite/media/Research-Media/Products%20Services/CES-2016-Global-Tech-Spending-Update_MEDIA-COPY.PDF
  • #127 Worldbank.org data bank Retail sales data, where possible I have tried to exclude petrol station sales and remove fuel price volatility – which is a measure of external circumstances rather than economic health.