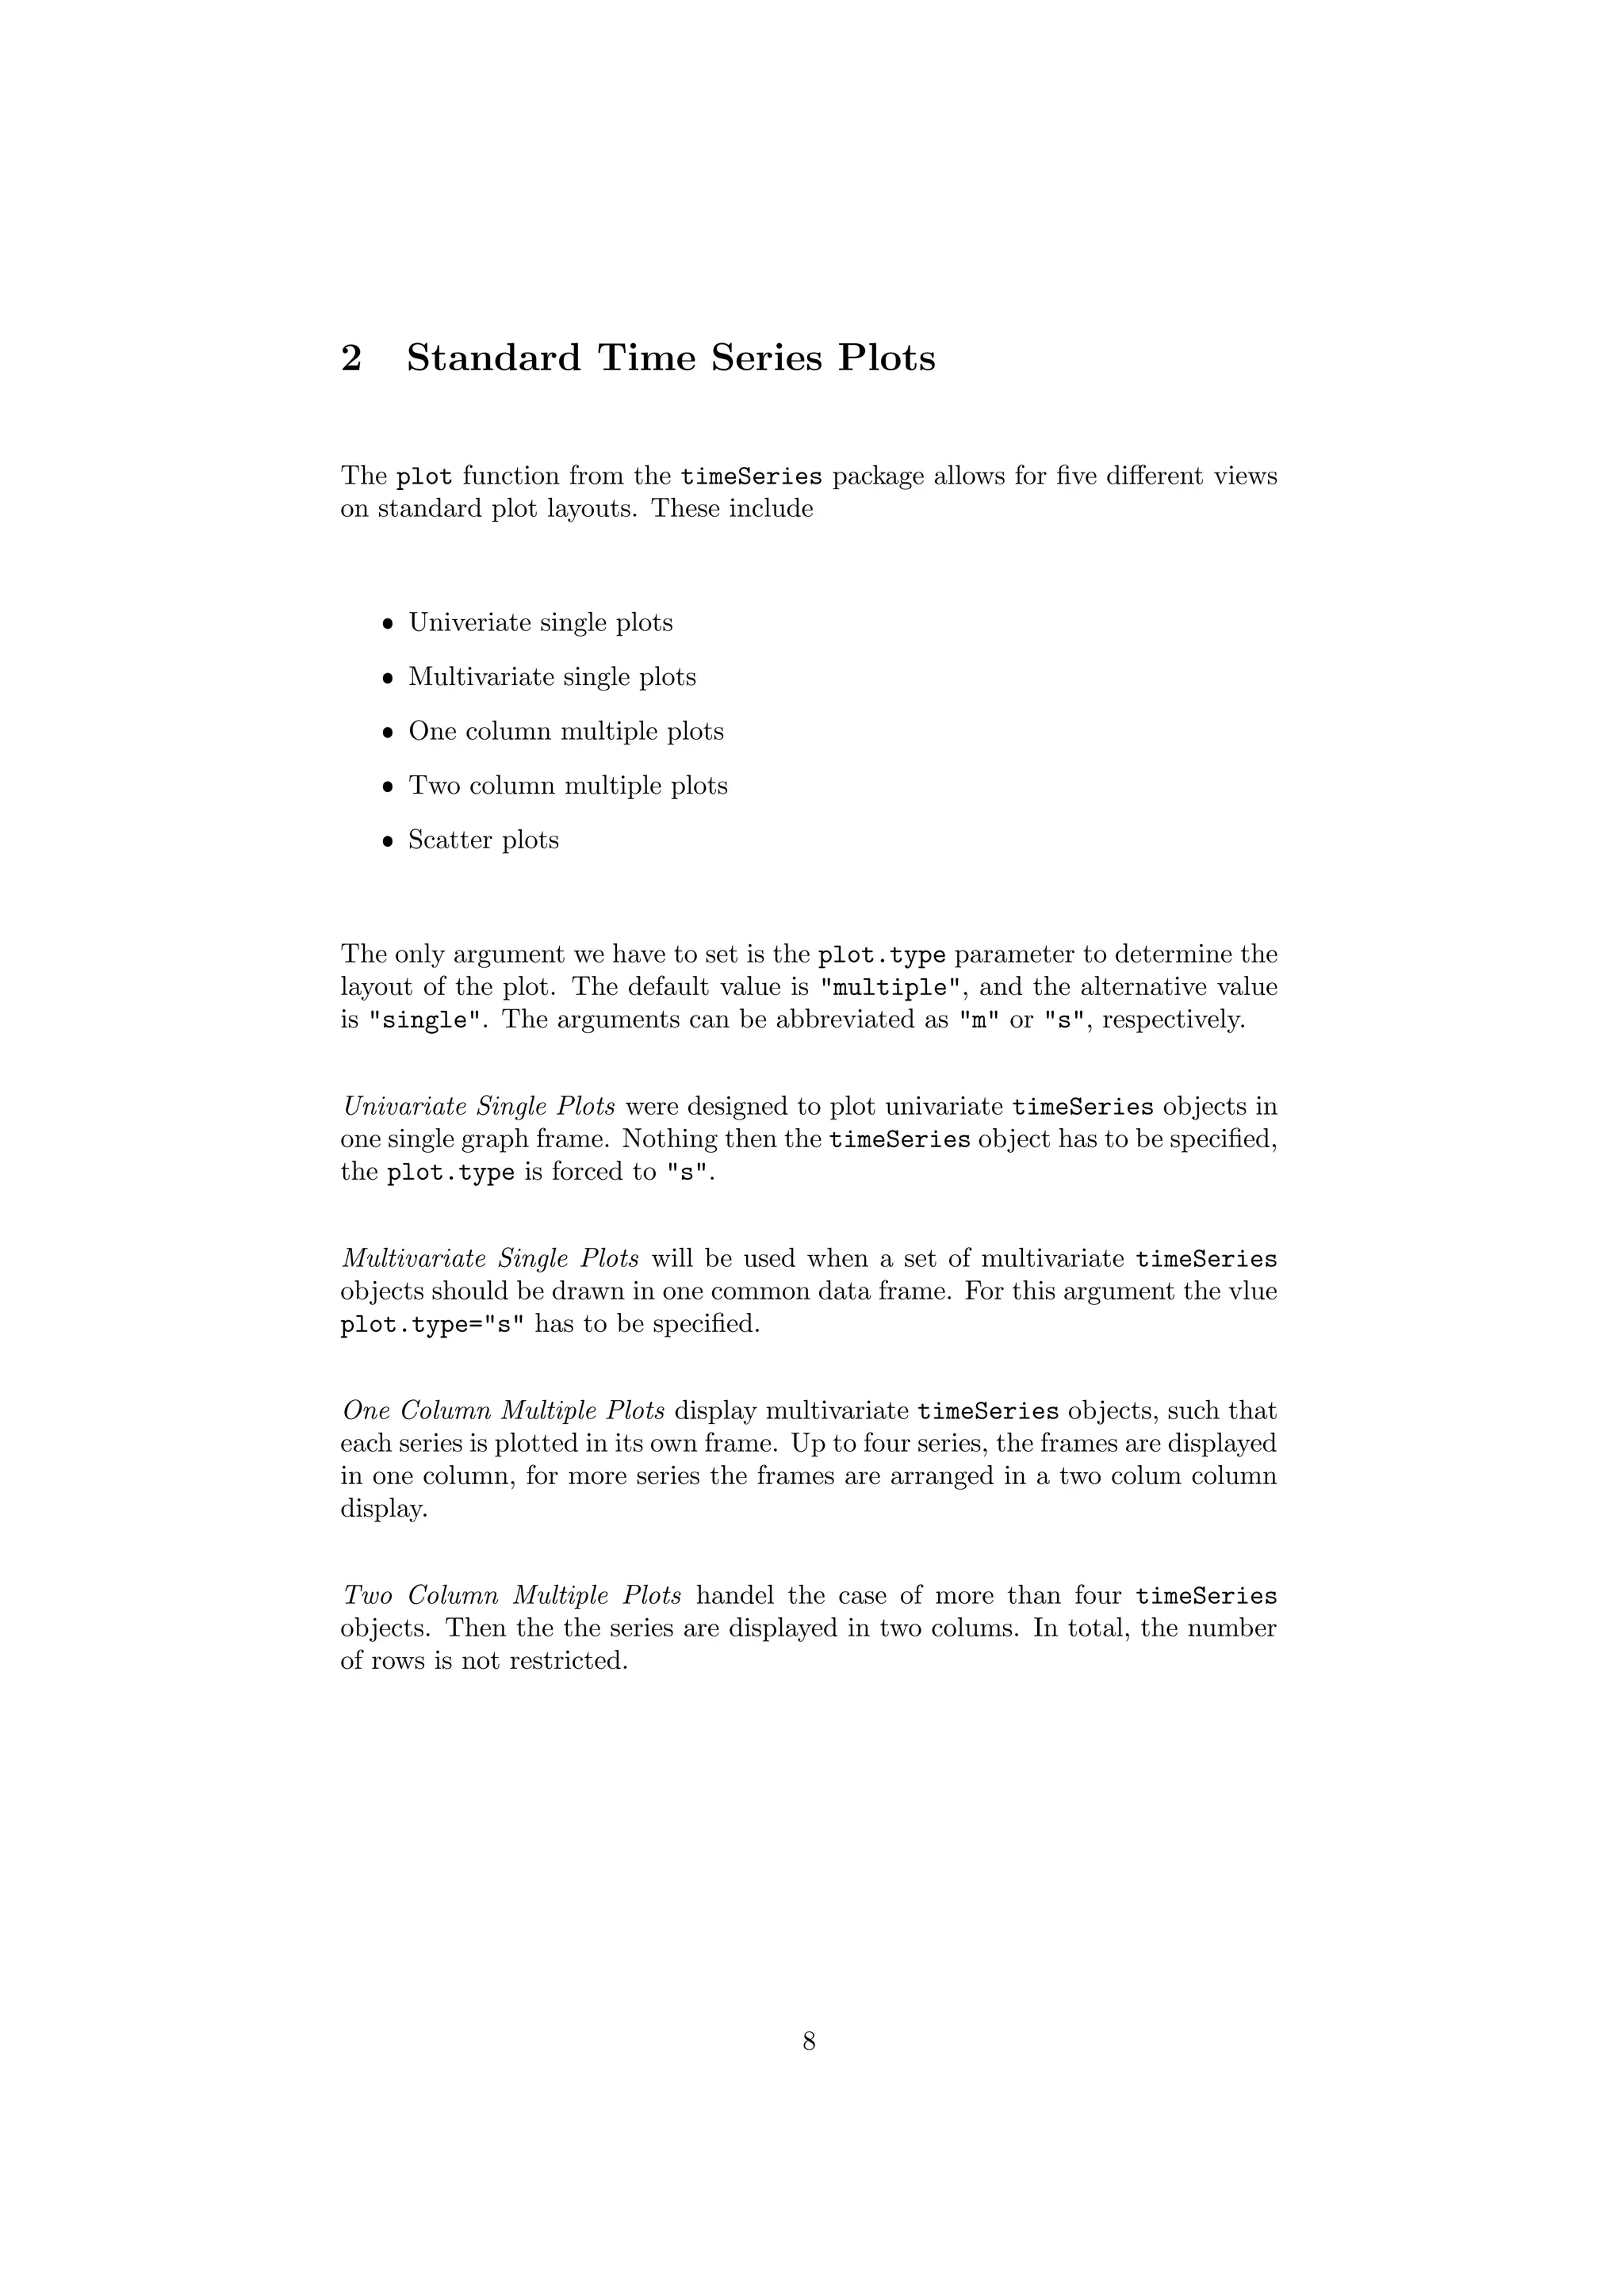
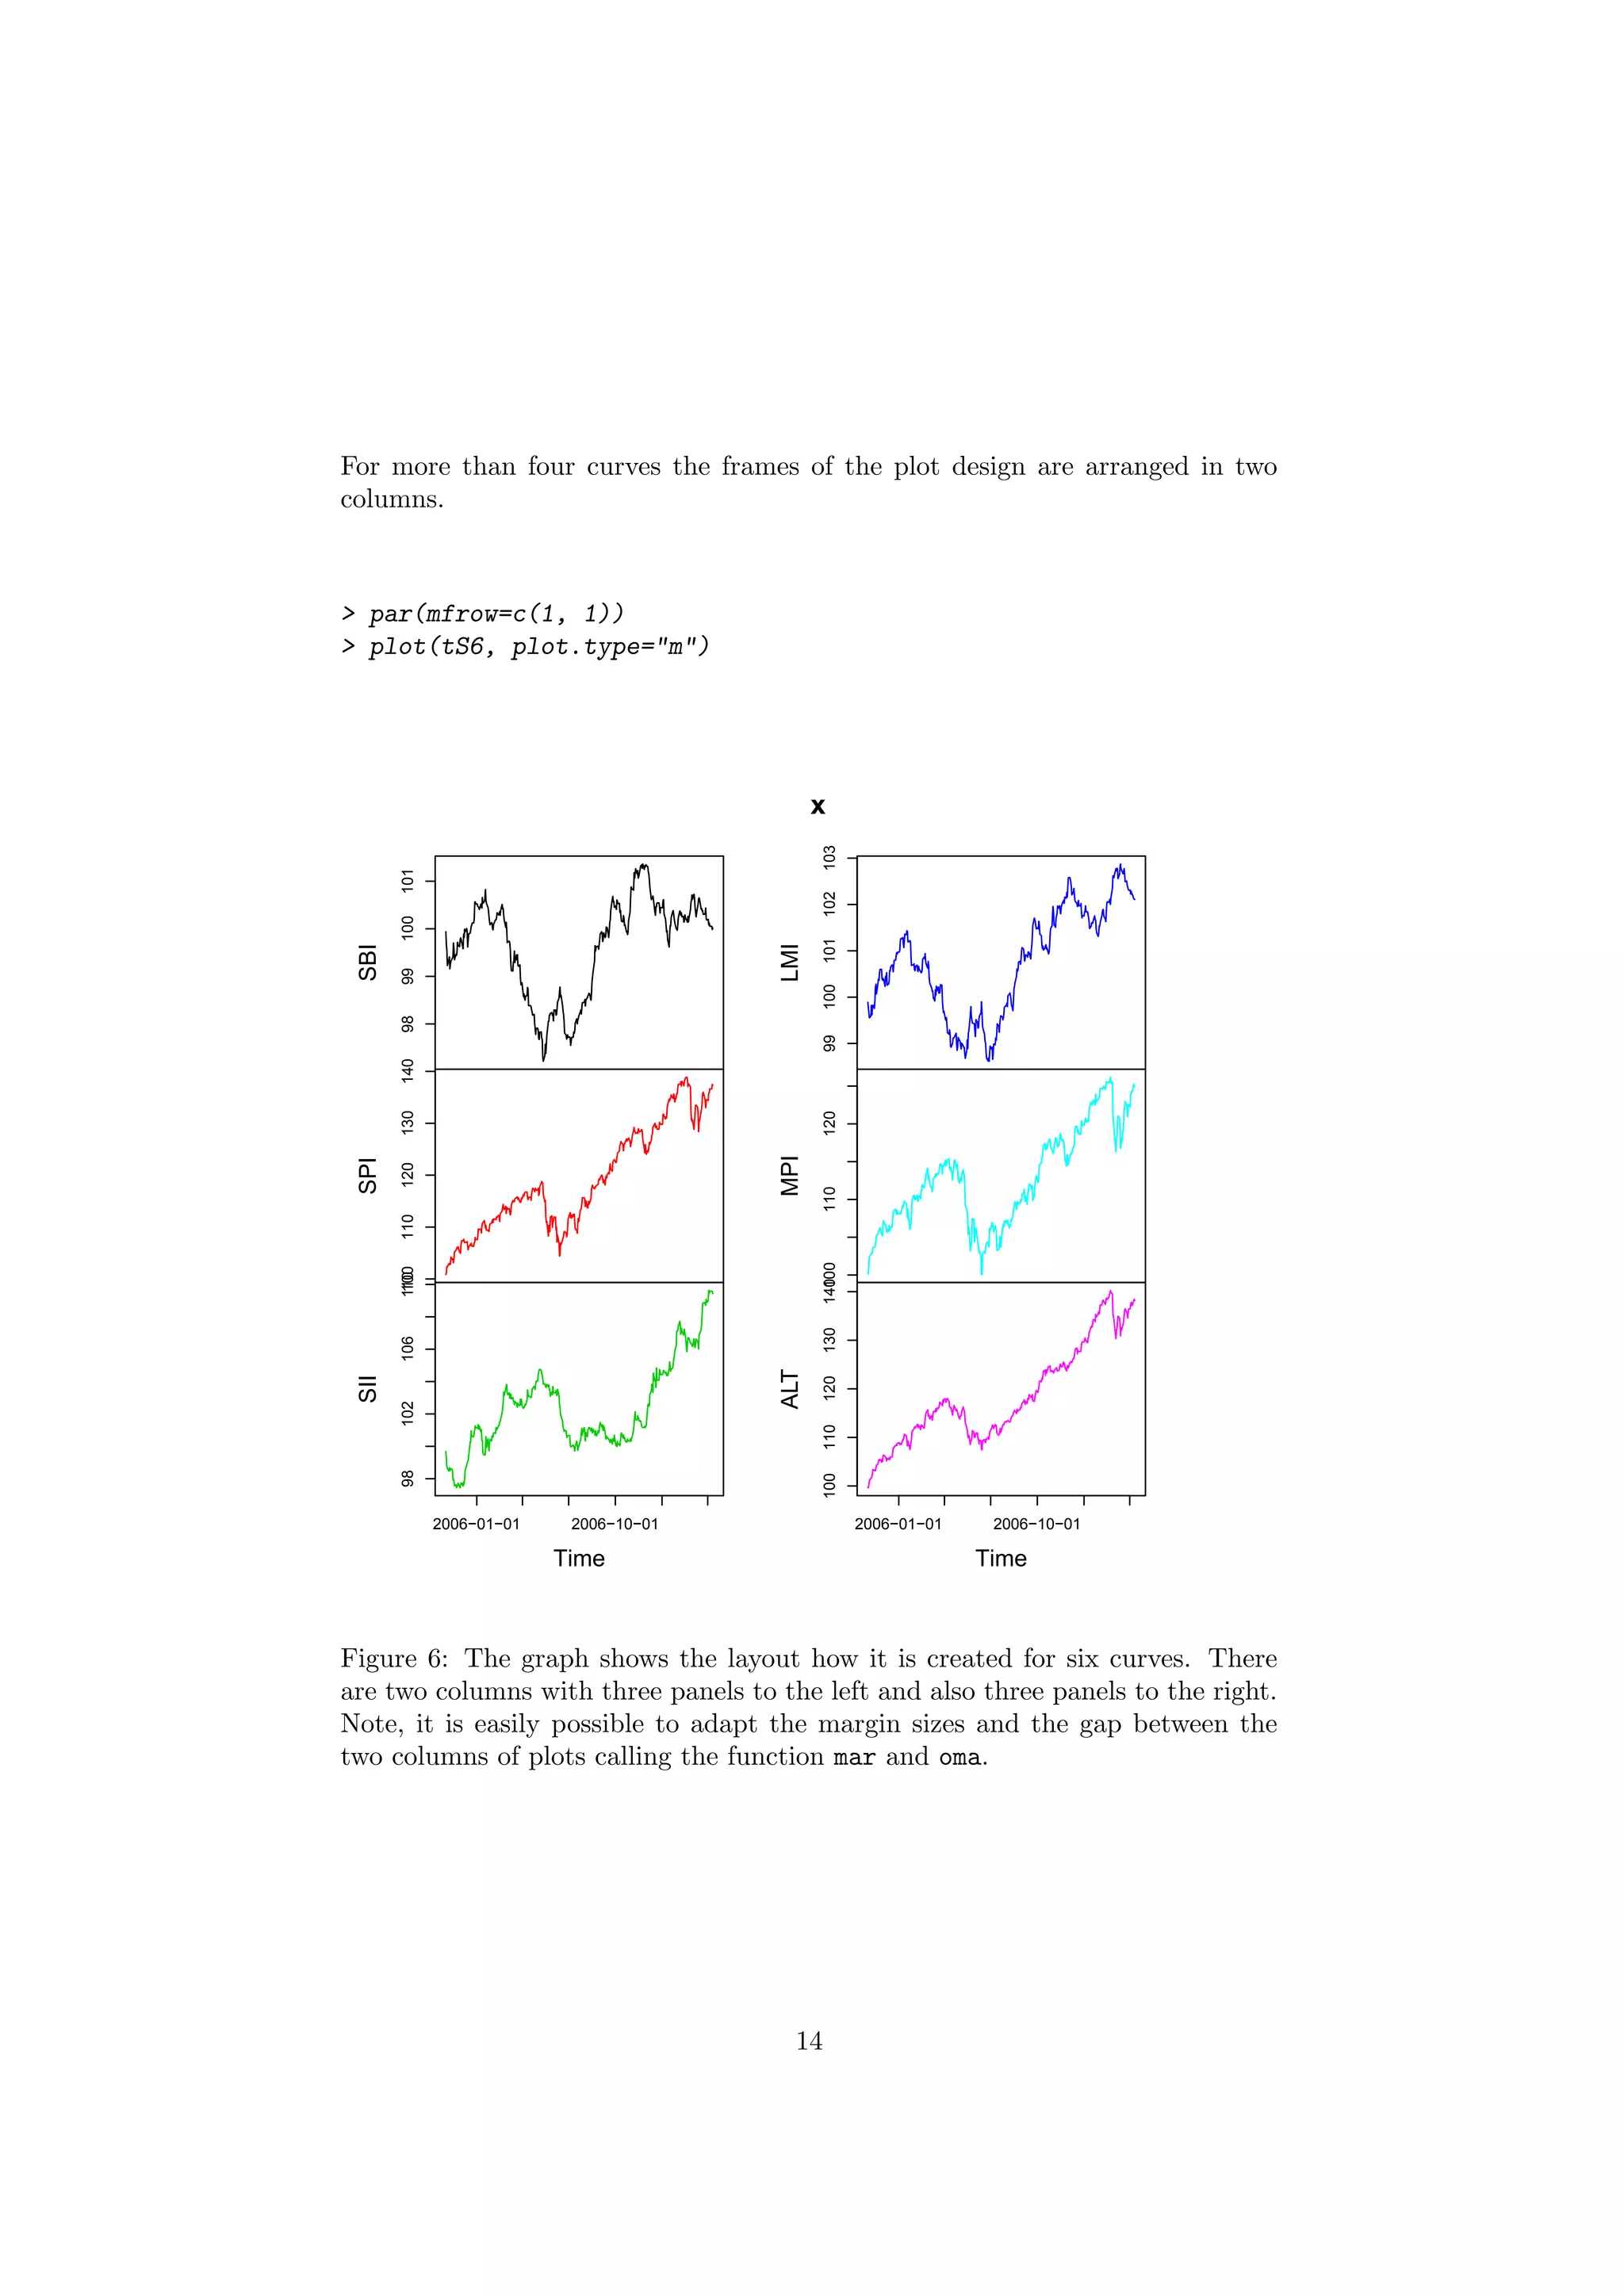
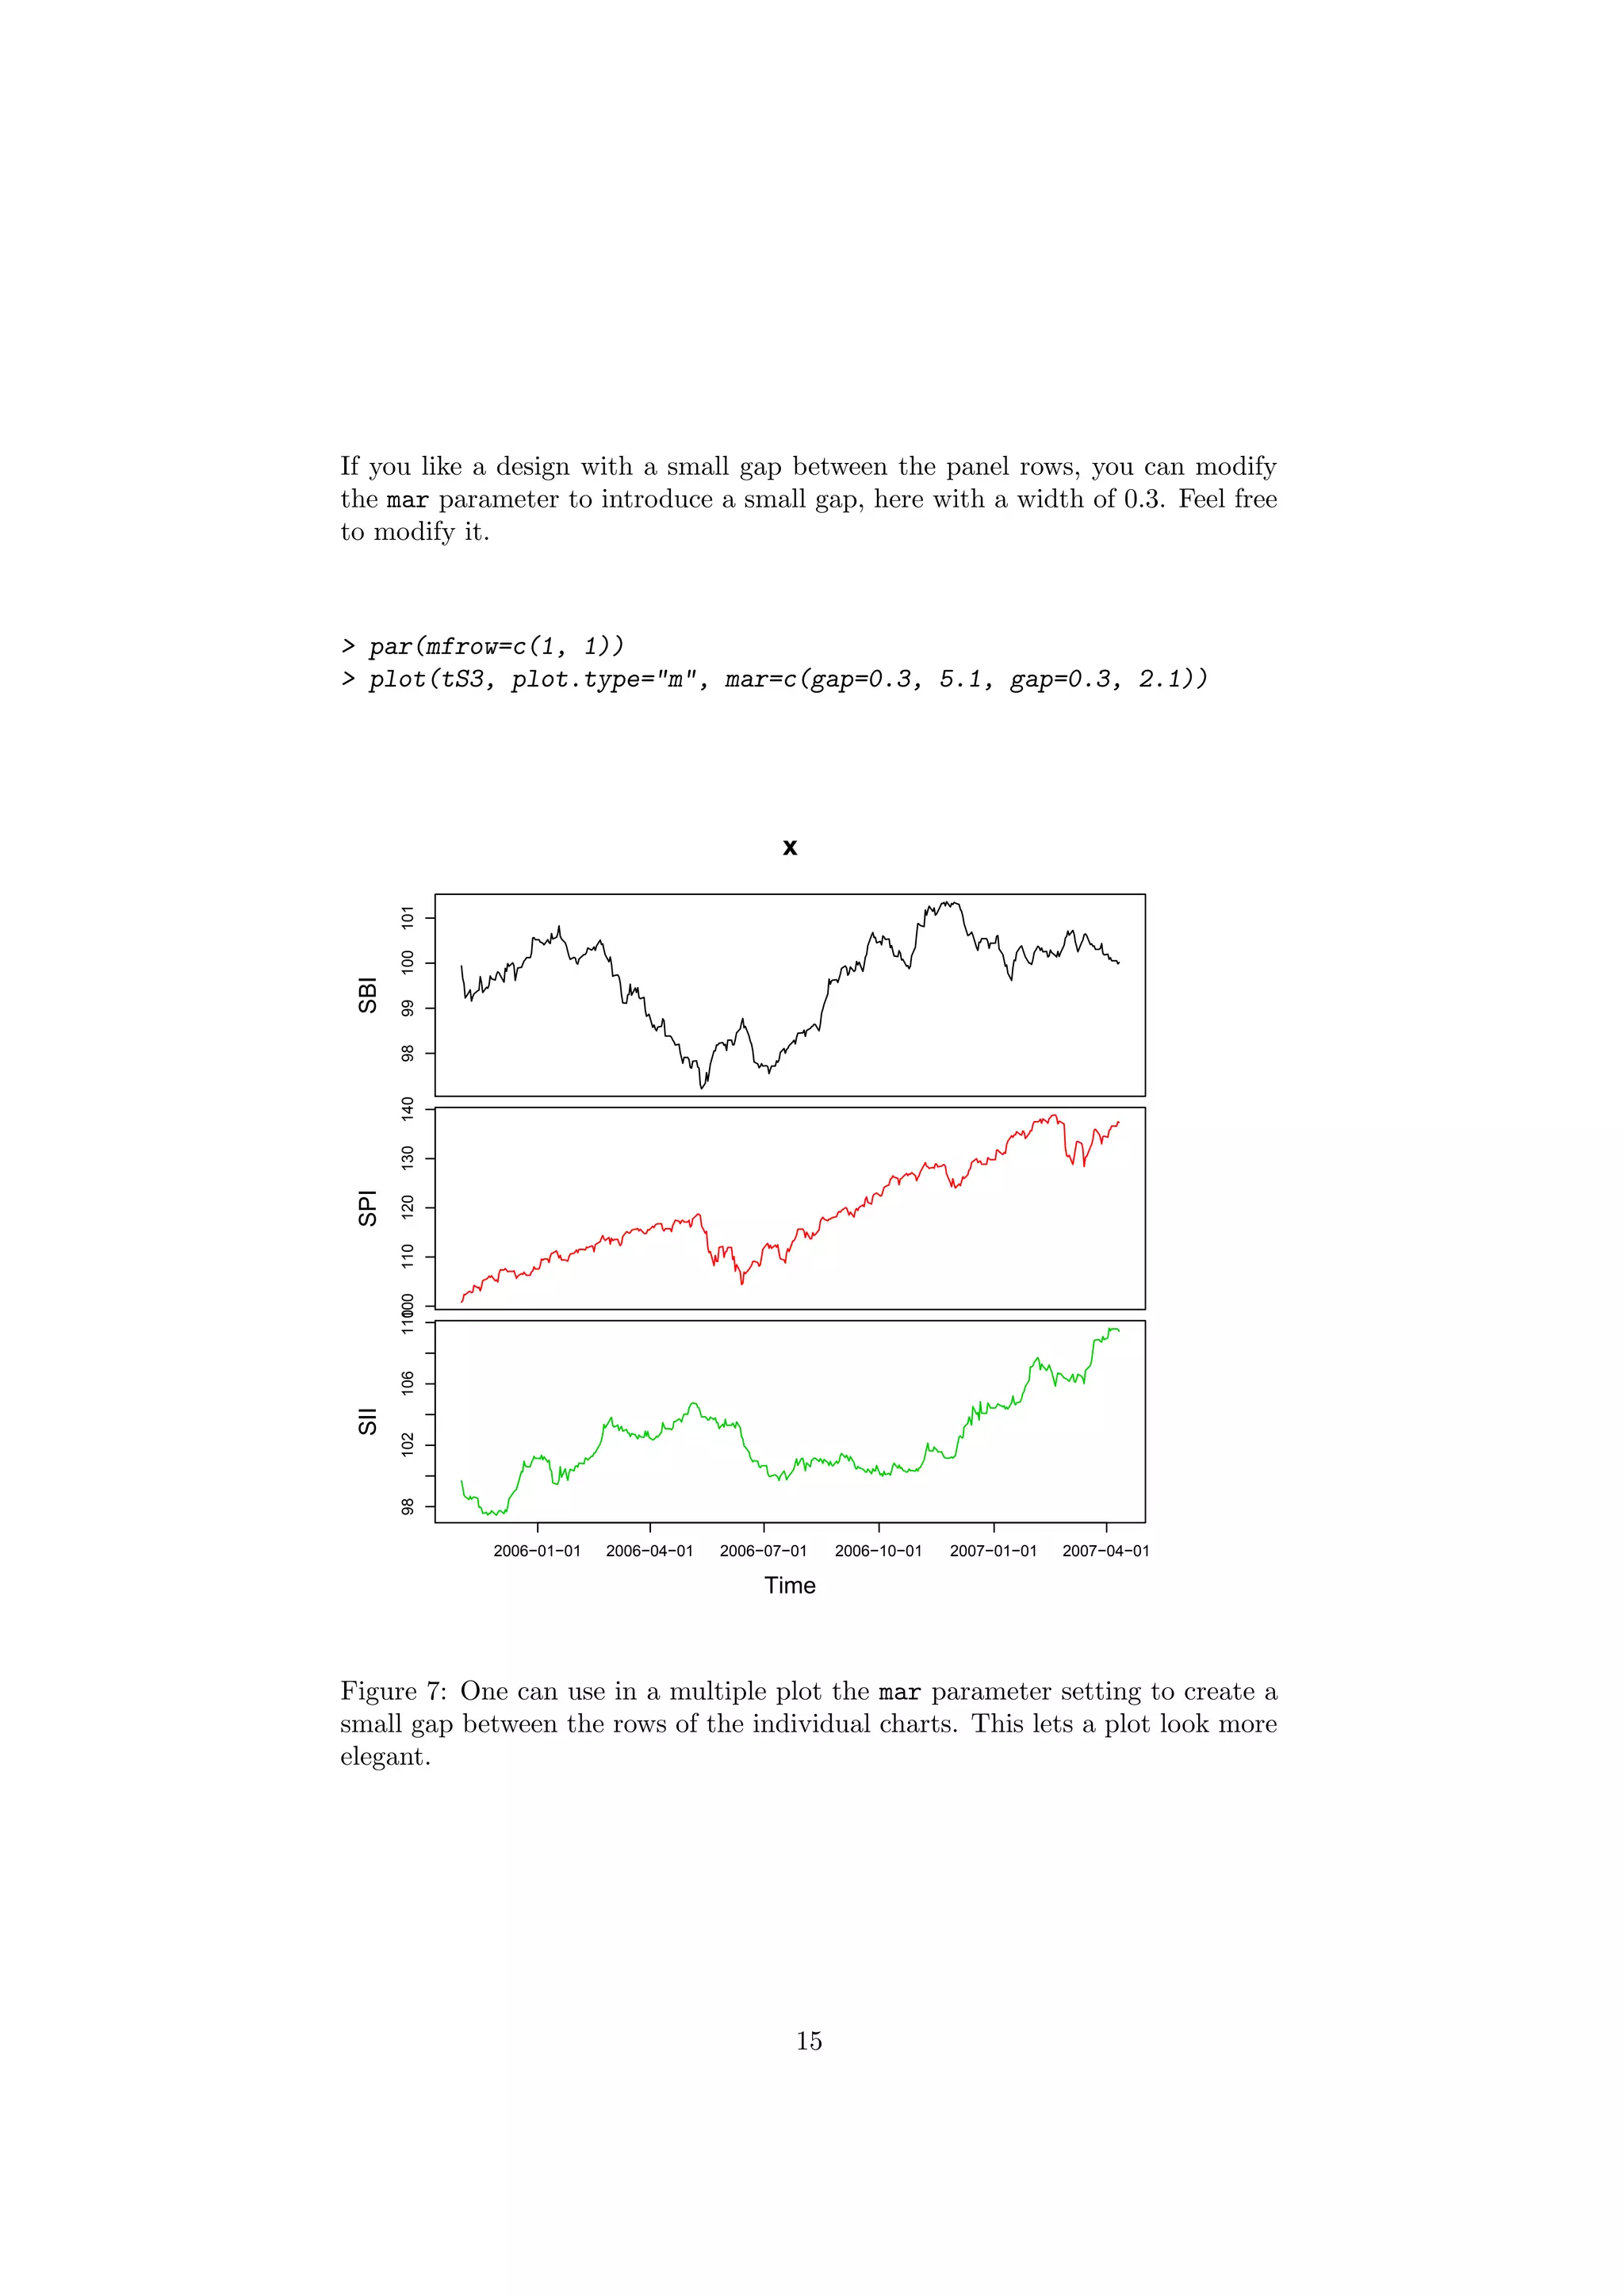
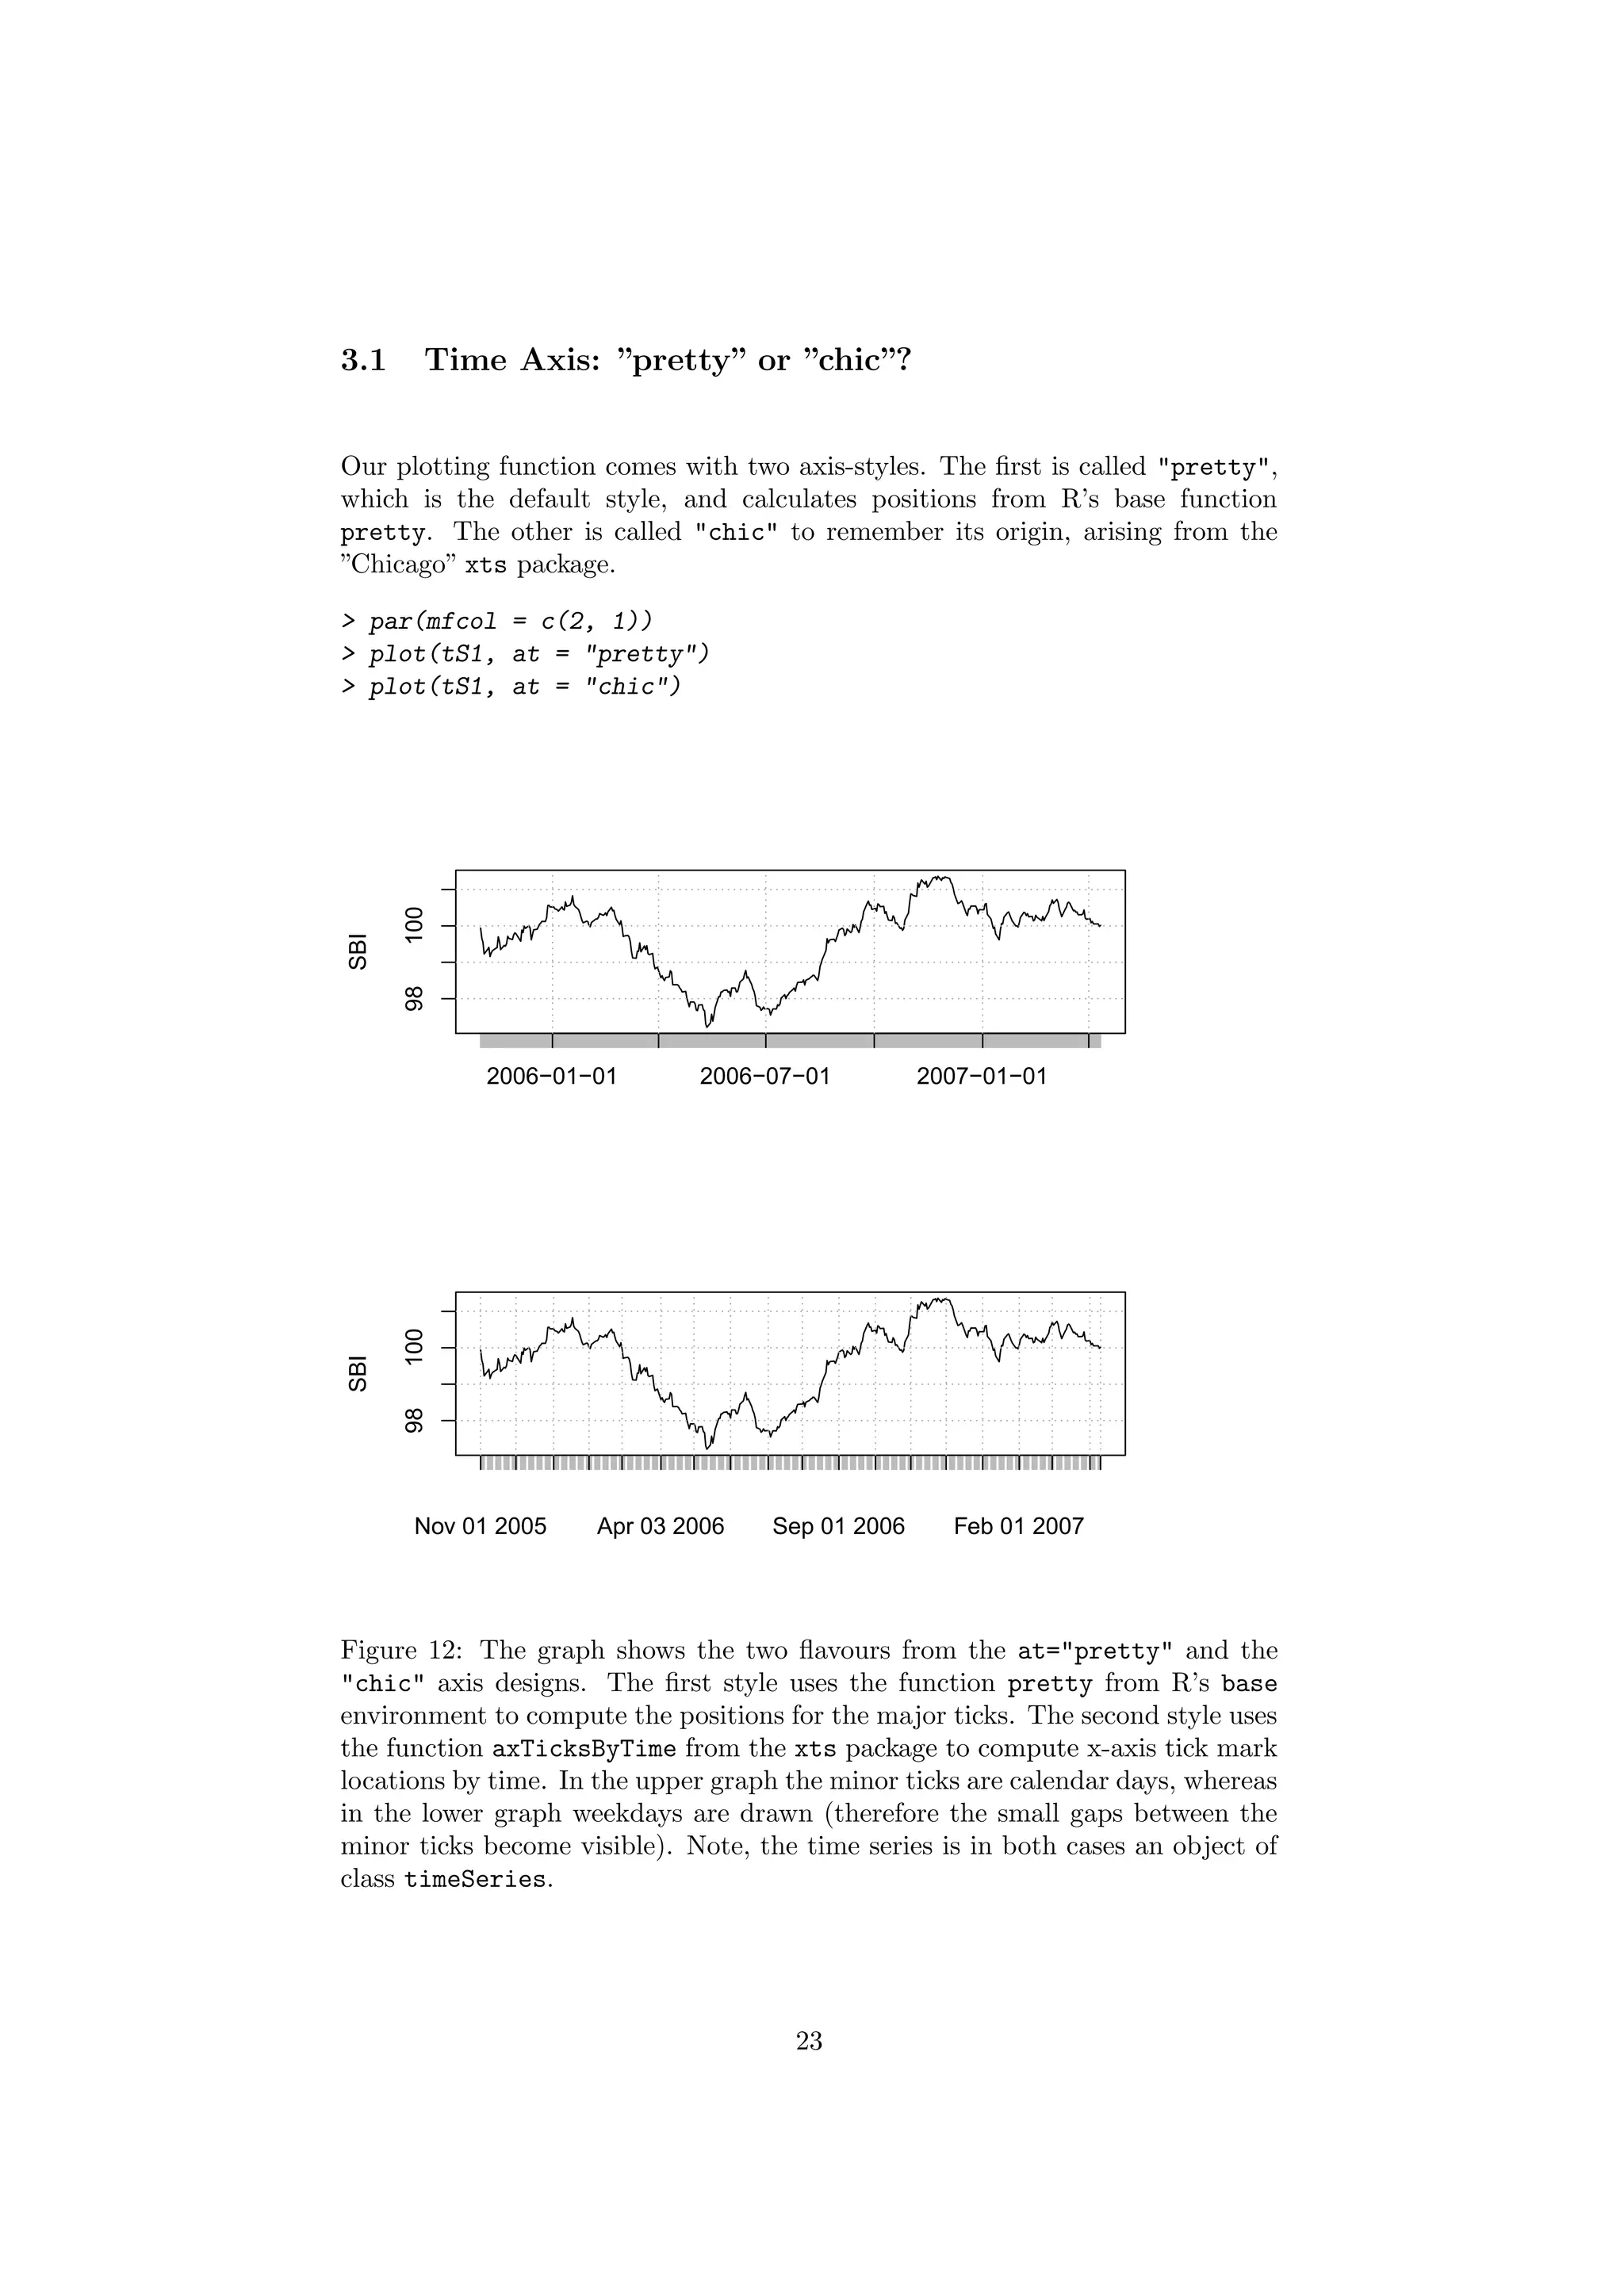
The document describes plotting time series objects in R. It outlines the main types of standard time series plots including univariate single plots, multivariate single plots, multiple plots arranged in one or two columns, and scatter plots. It discusses options for customizing plots, such as changing colors, line styles, axes layout and formatting. Panel functions can be used to add additional elements like reference lines or indicators to individual plot panels when displaying multiple time series. Examples using Swiss market index data demonstrate how to produce the different types of plots.

![user the freedom to have full control about his views how the plot should be look
like. Note, multivariate time series in single plots show the string "Values" as
label on the y-axis. Main title, sub title, and the x-label on the time axis are not
shown by default. We prefer and recommend to add these decorations calling
the function title. This allows also much more flexibility compared to passing
the arguments through the plot functions. All default annotations (including
the y-label) can be suppressed setting the plot function argument to ann=FALSE.
The argument axes=FALSE suppresses to draw both axes on the plot frame.
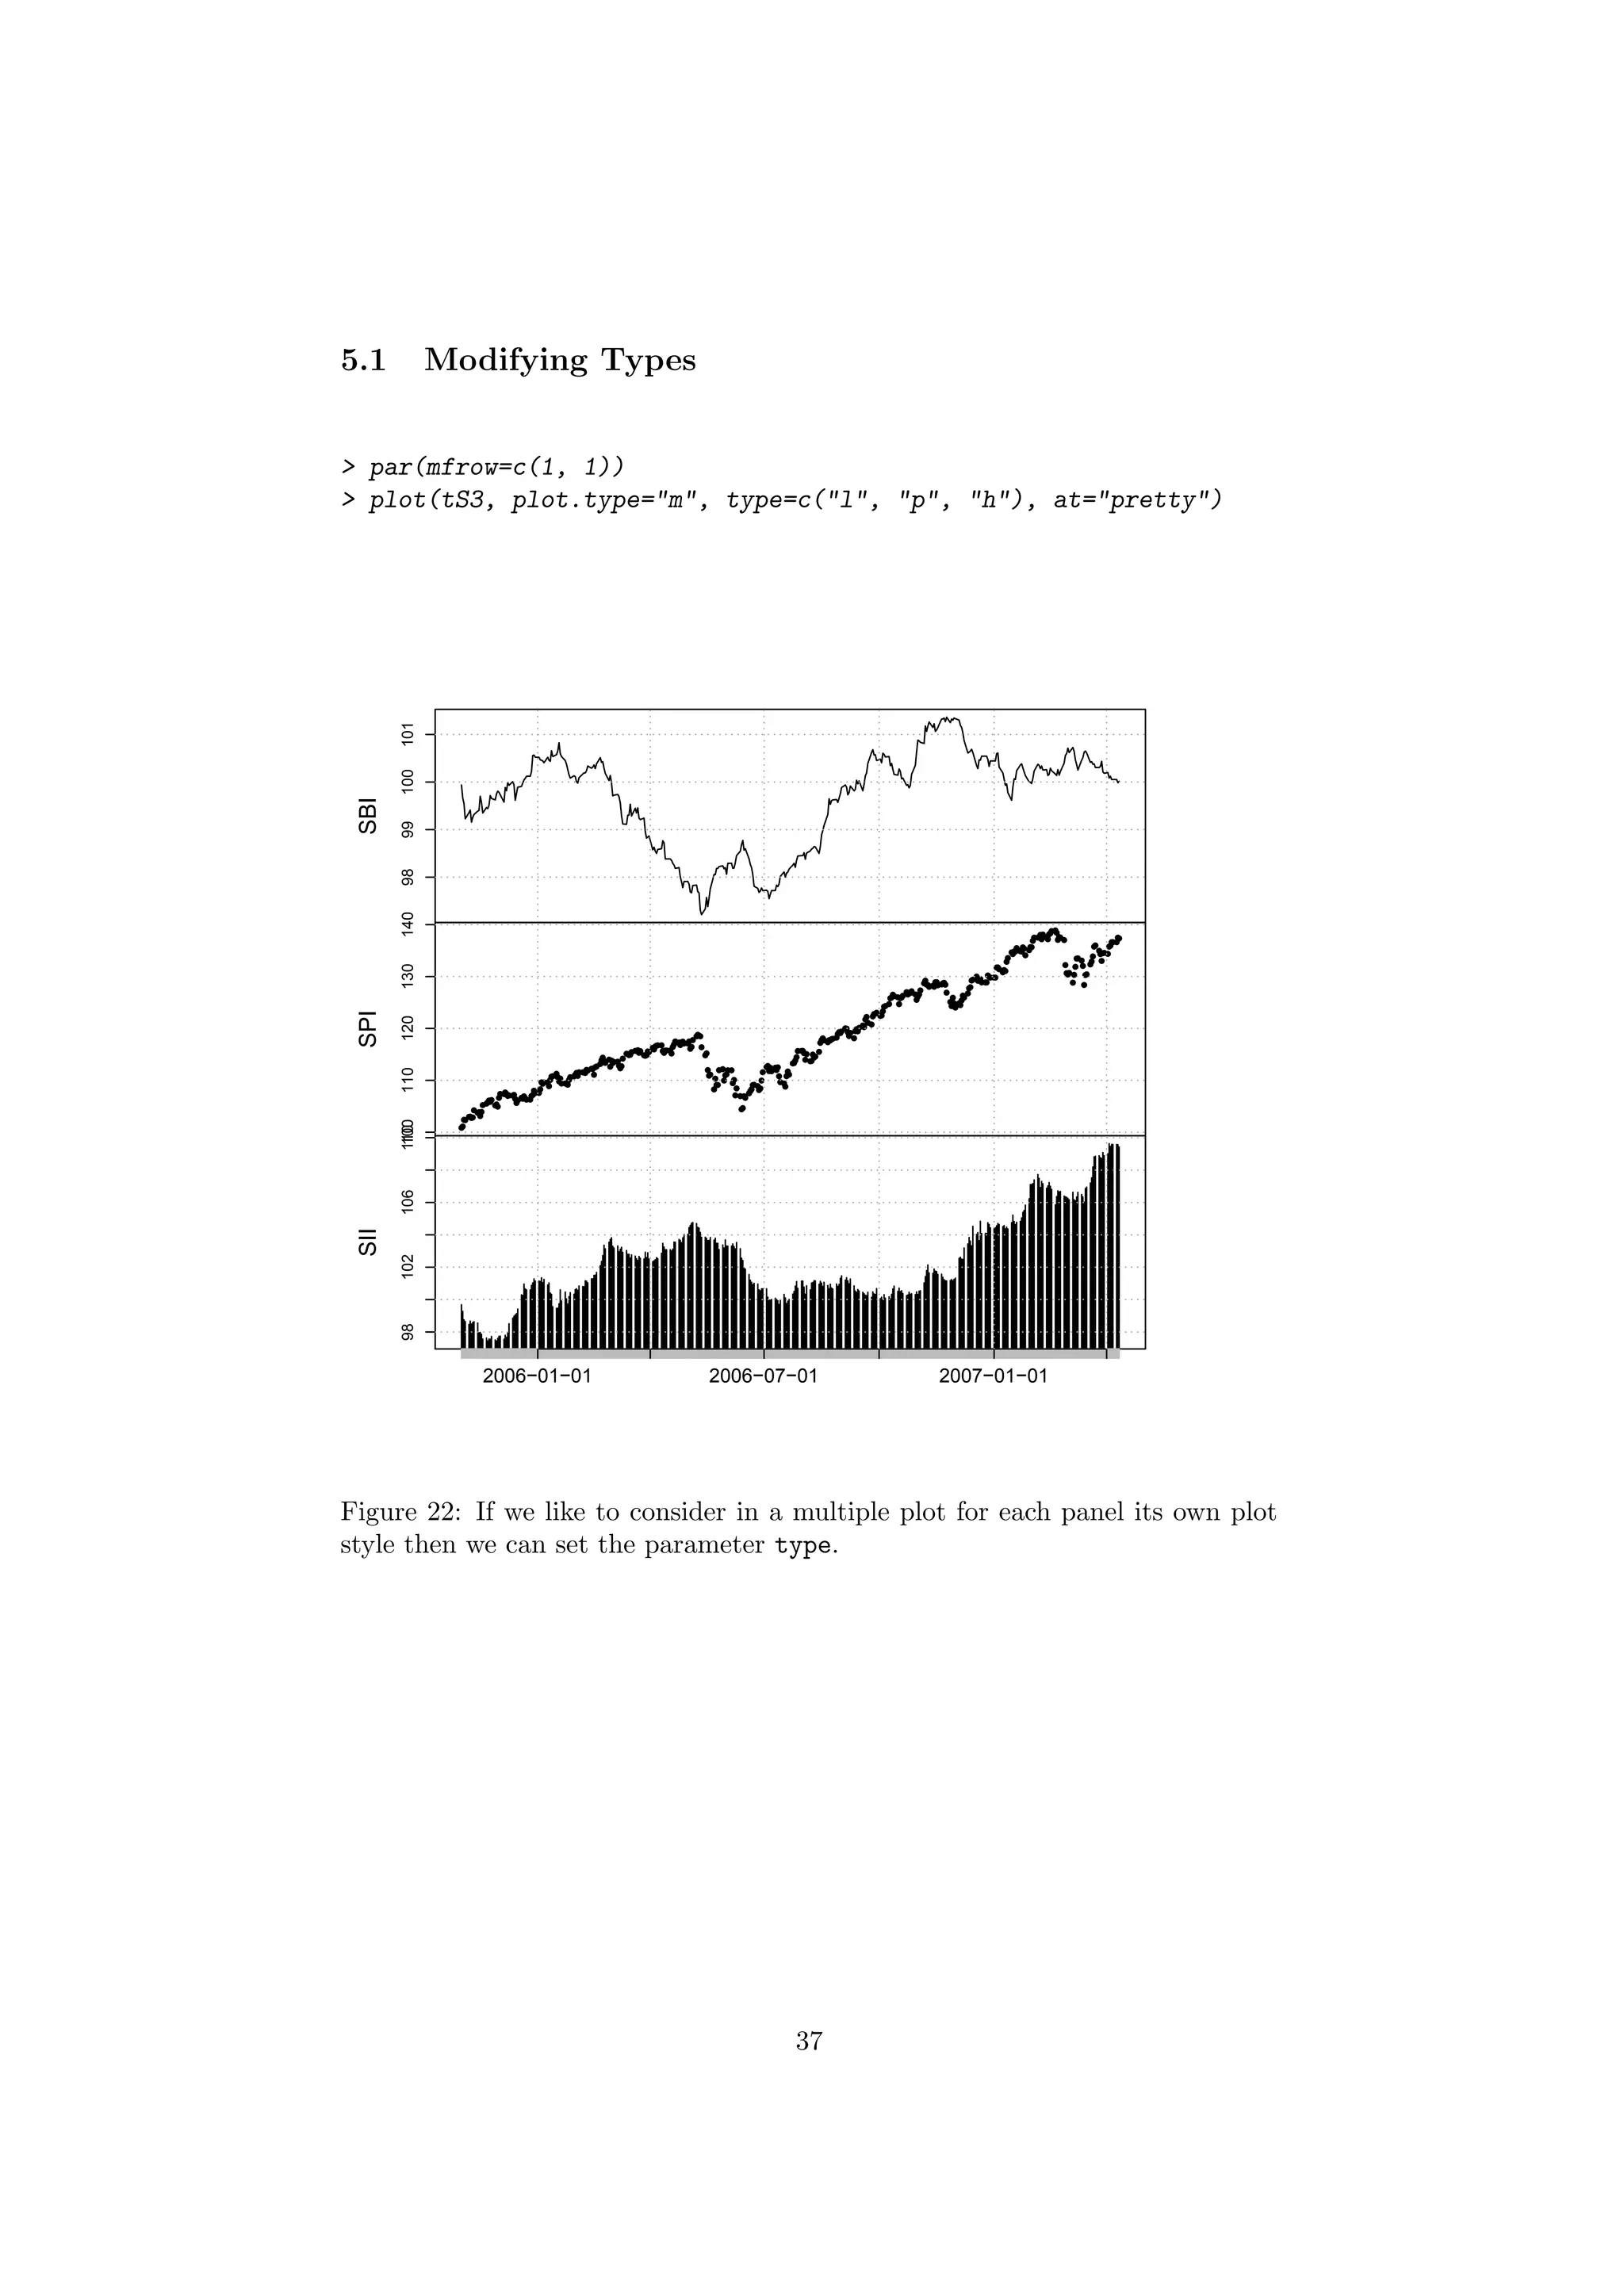
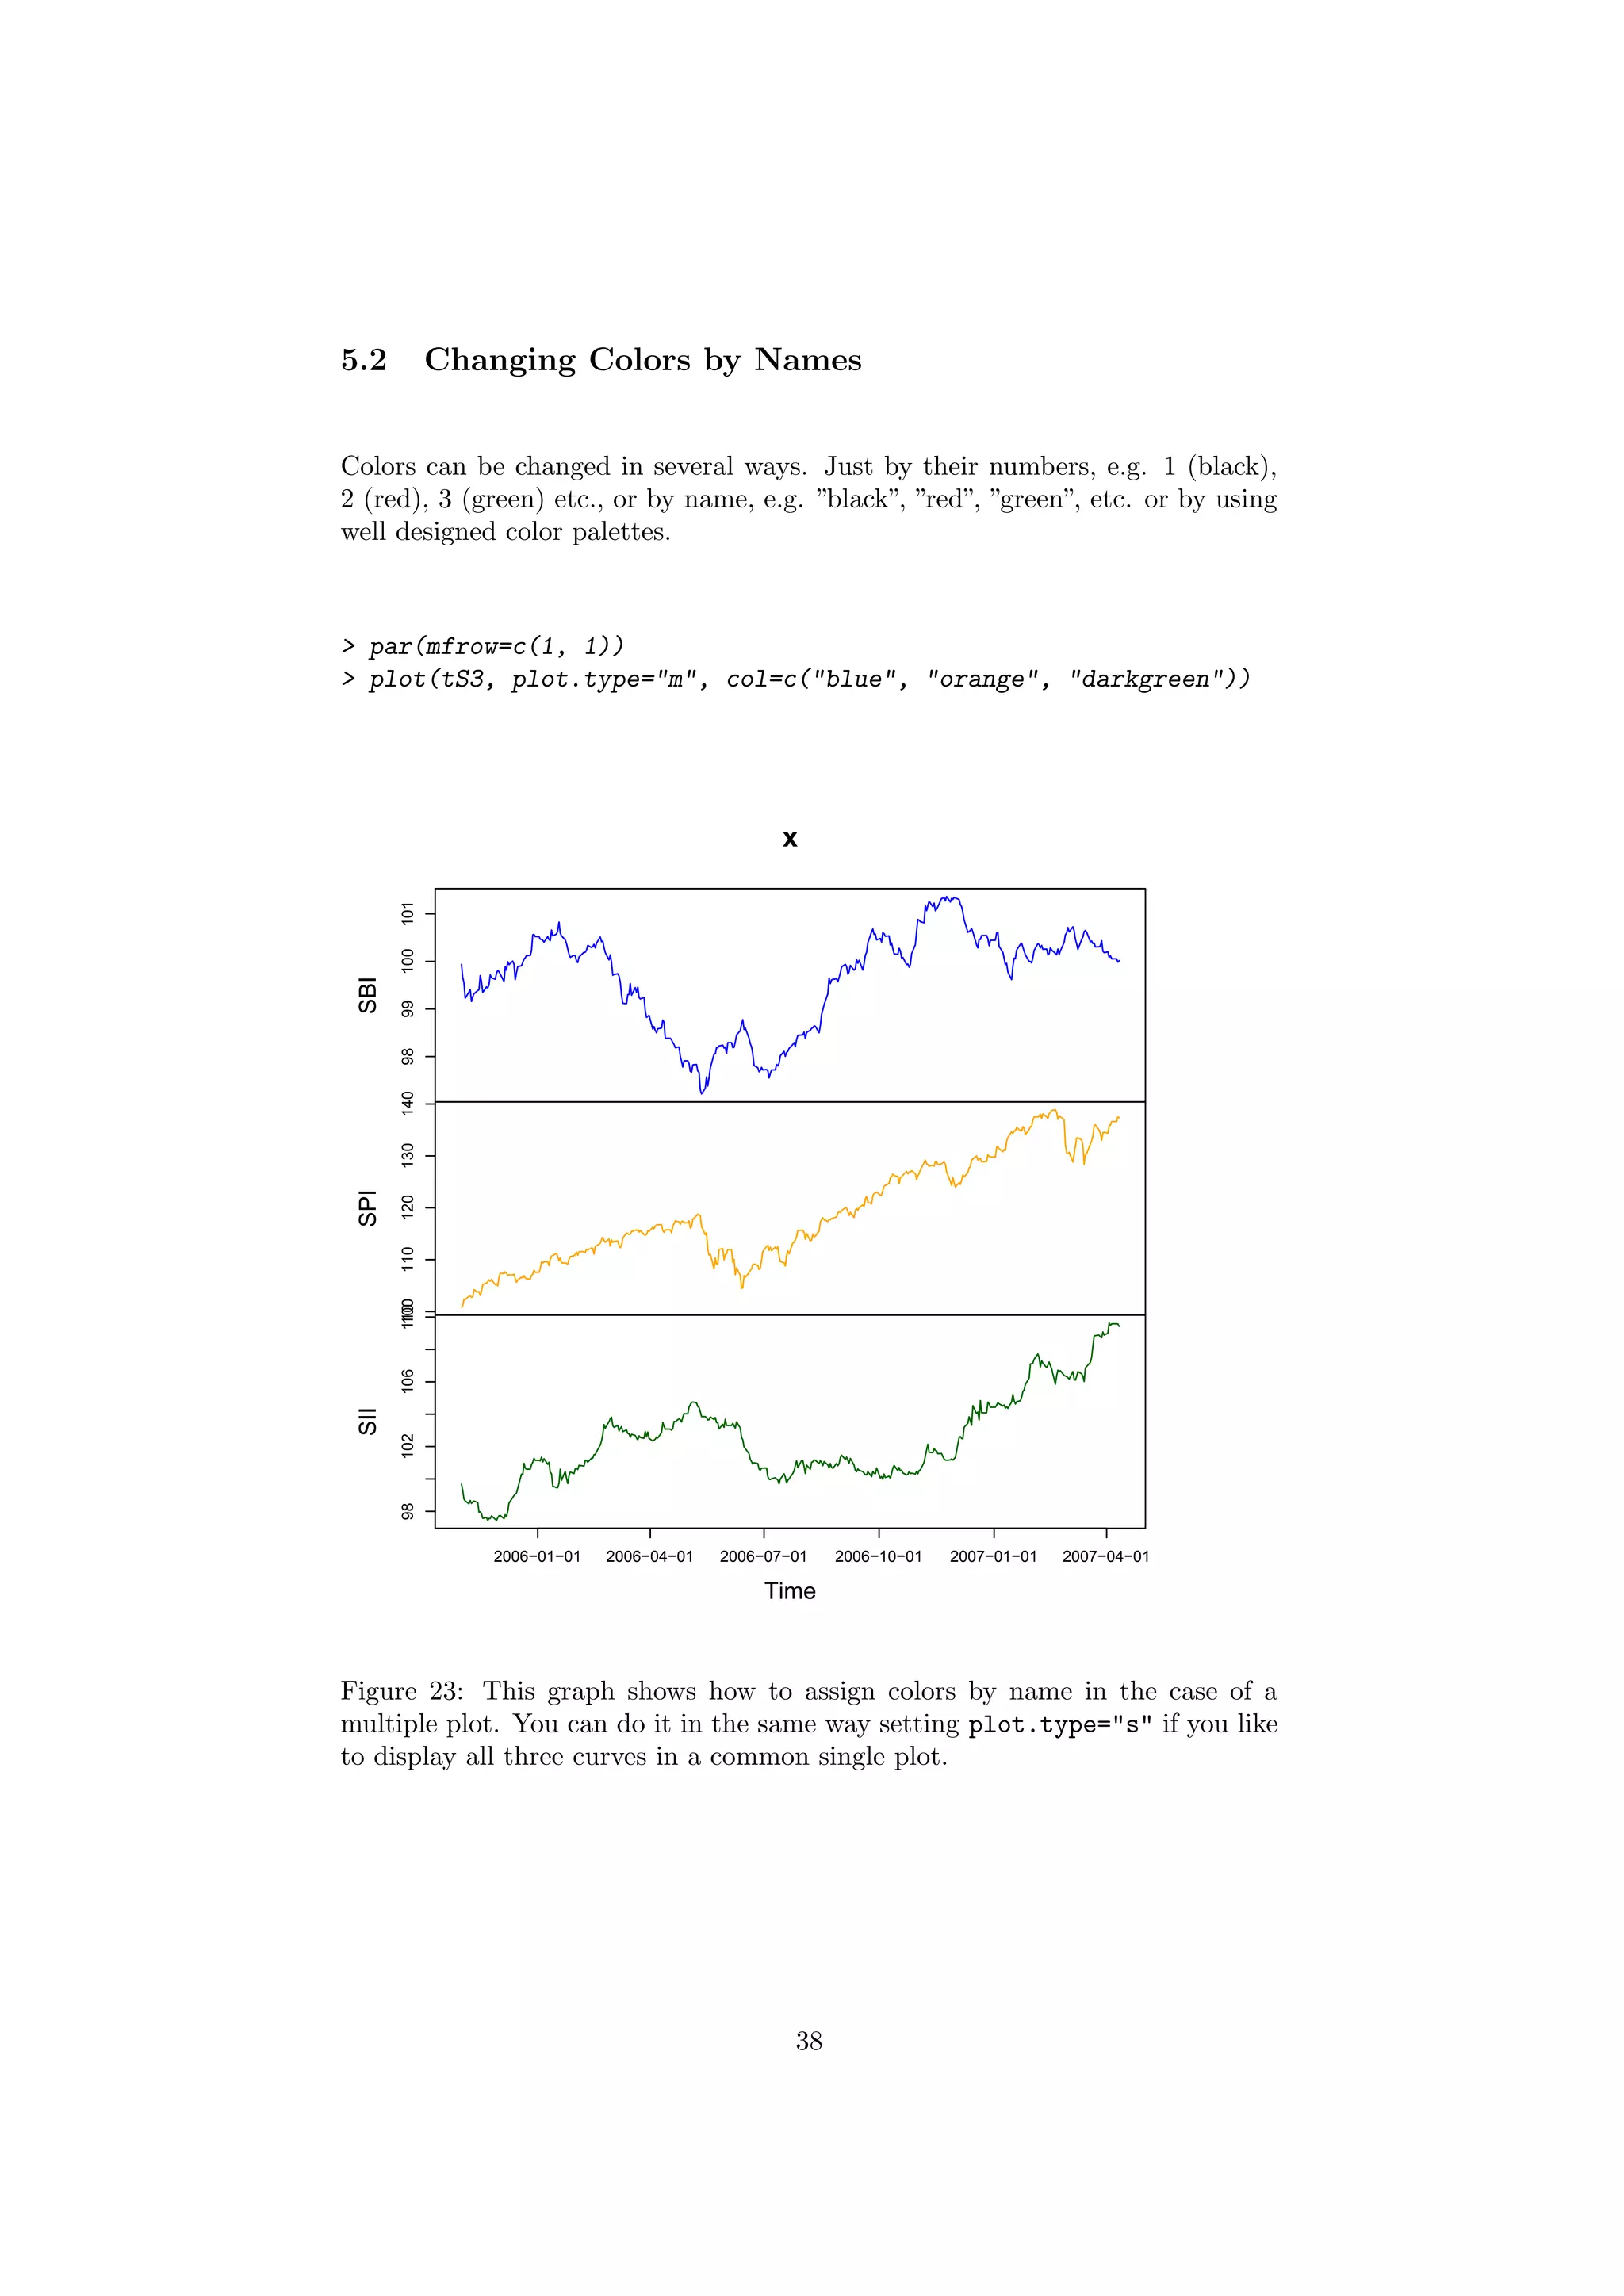
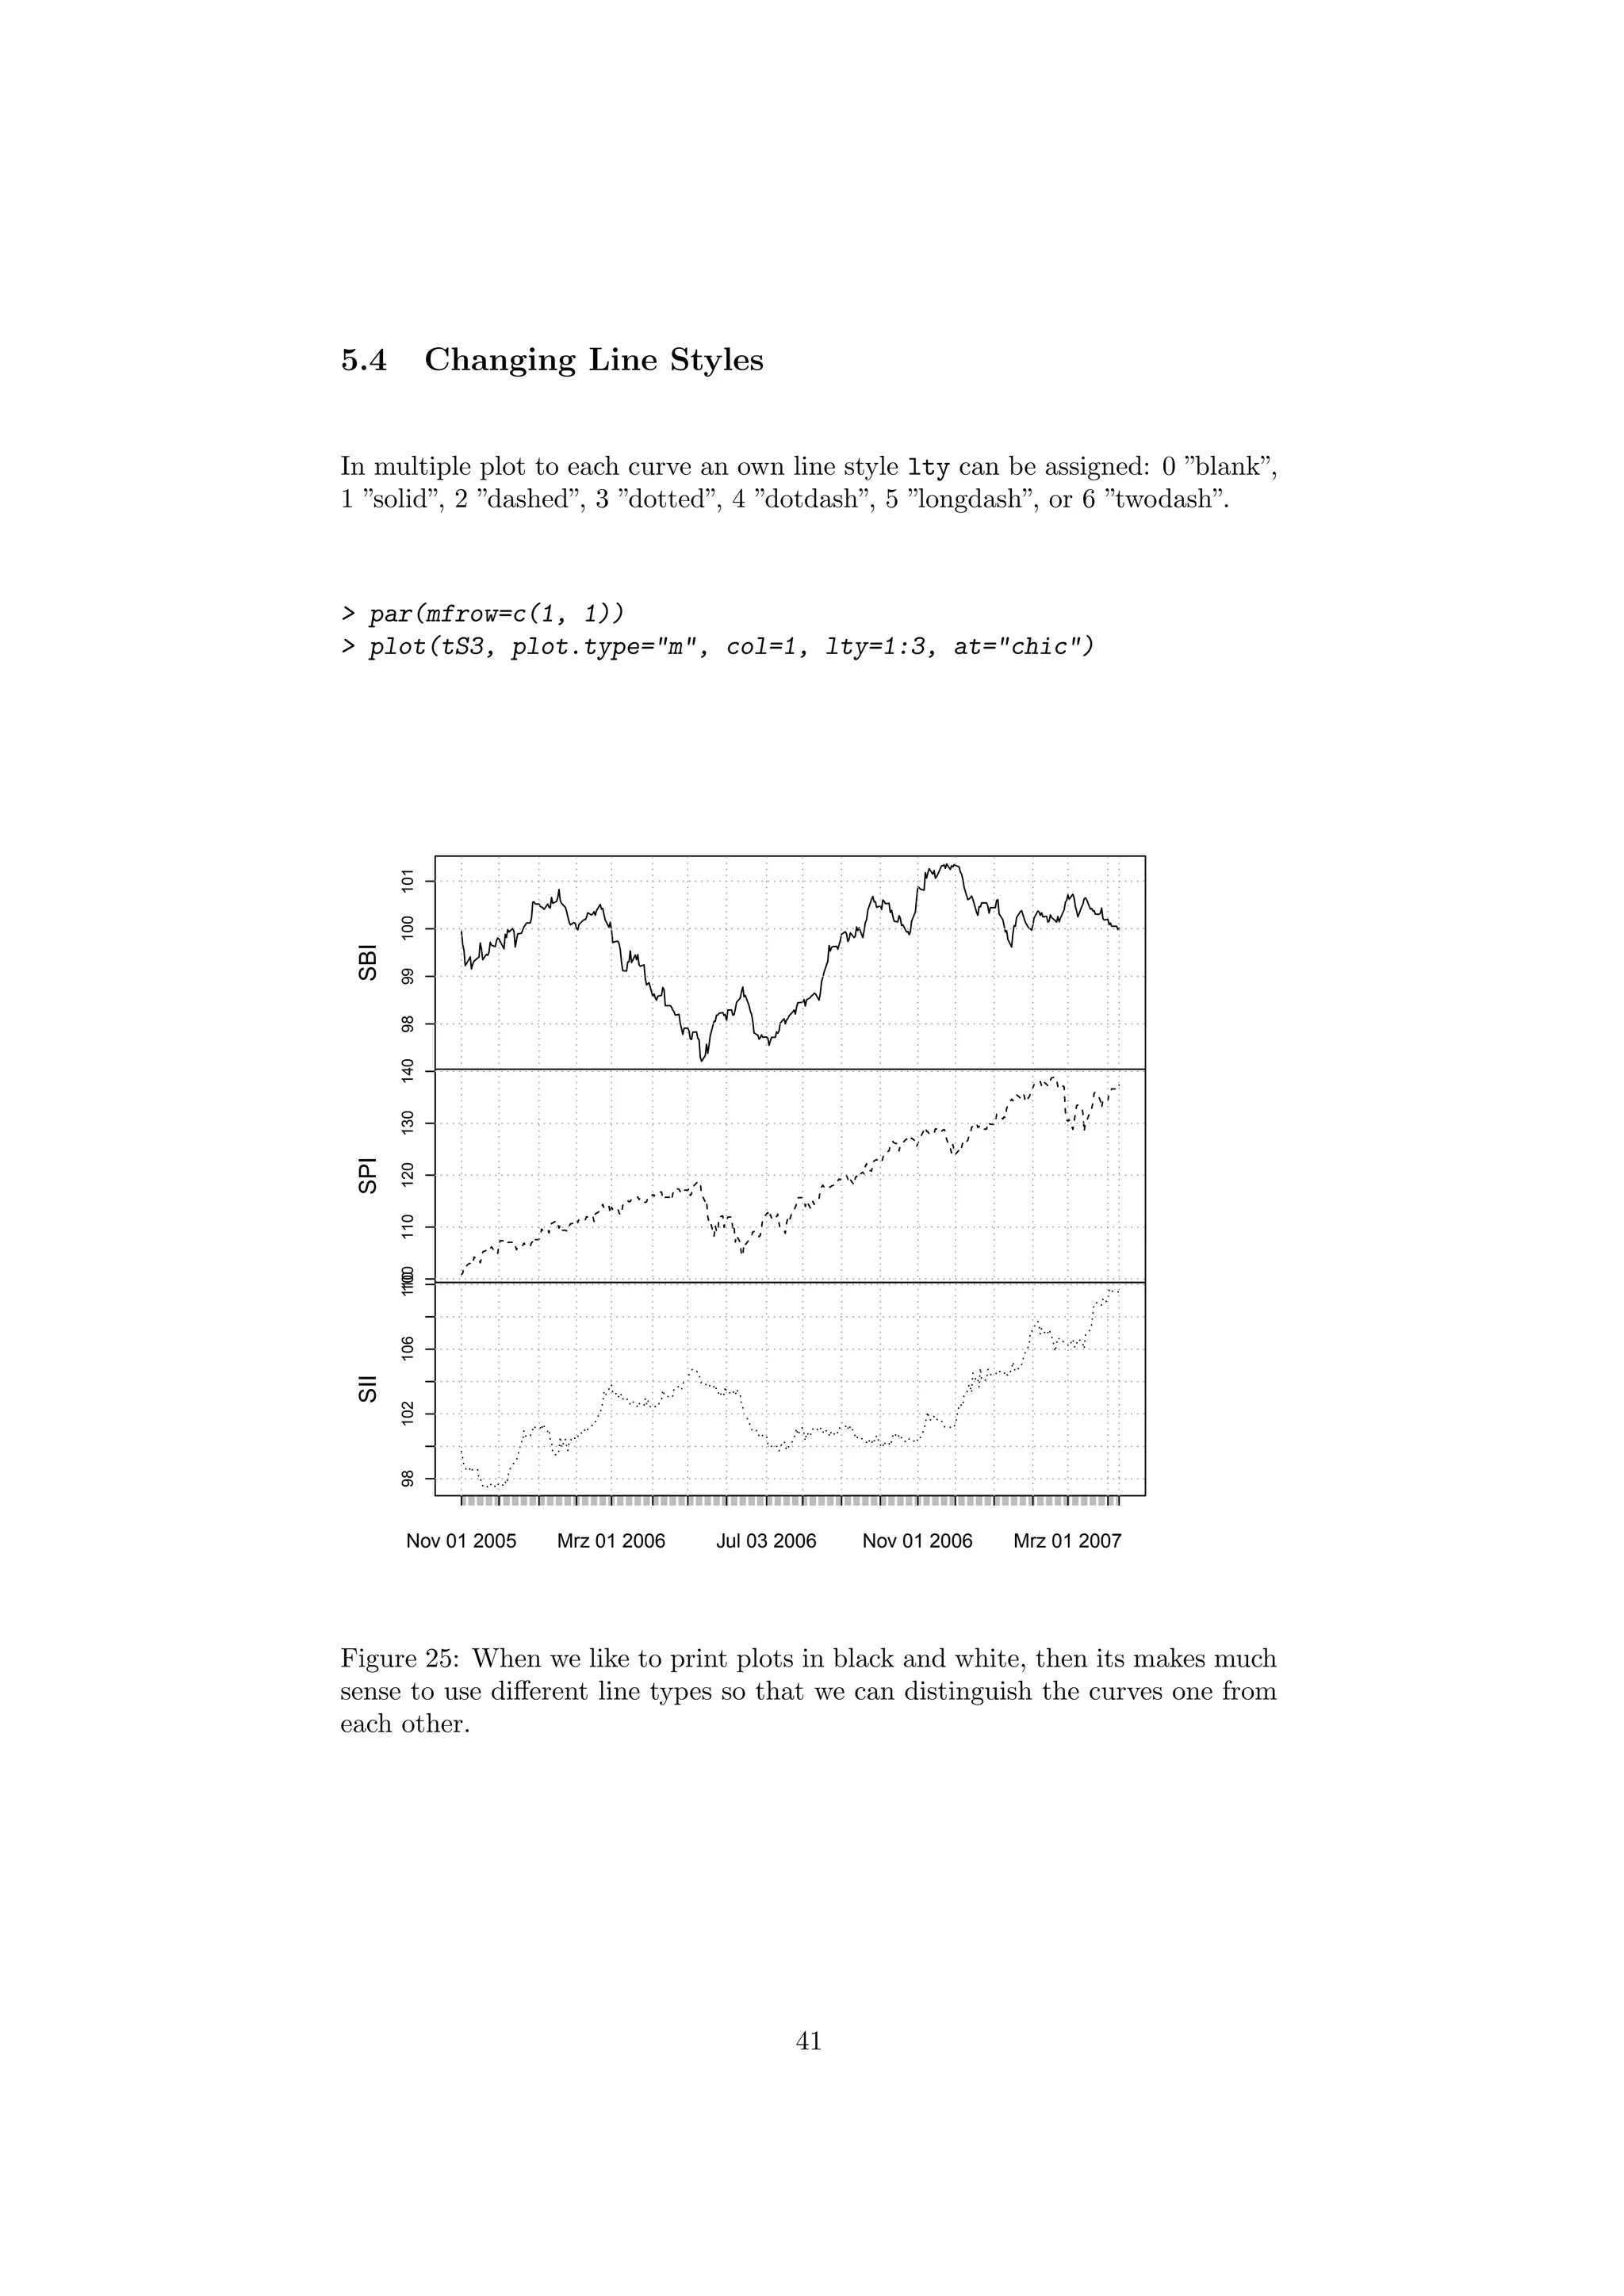
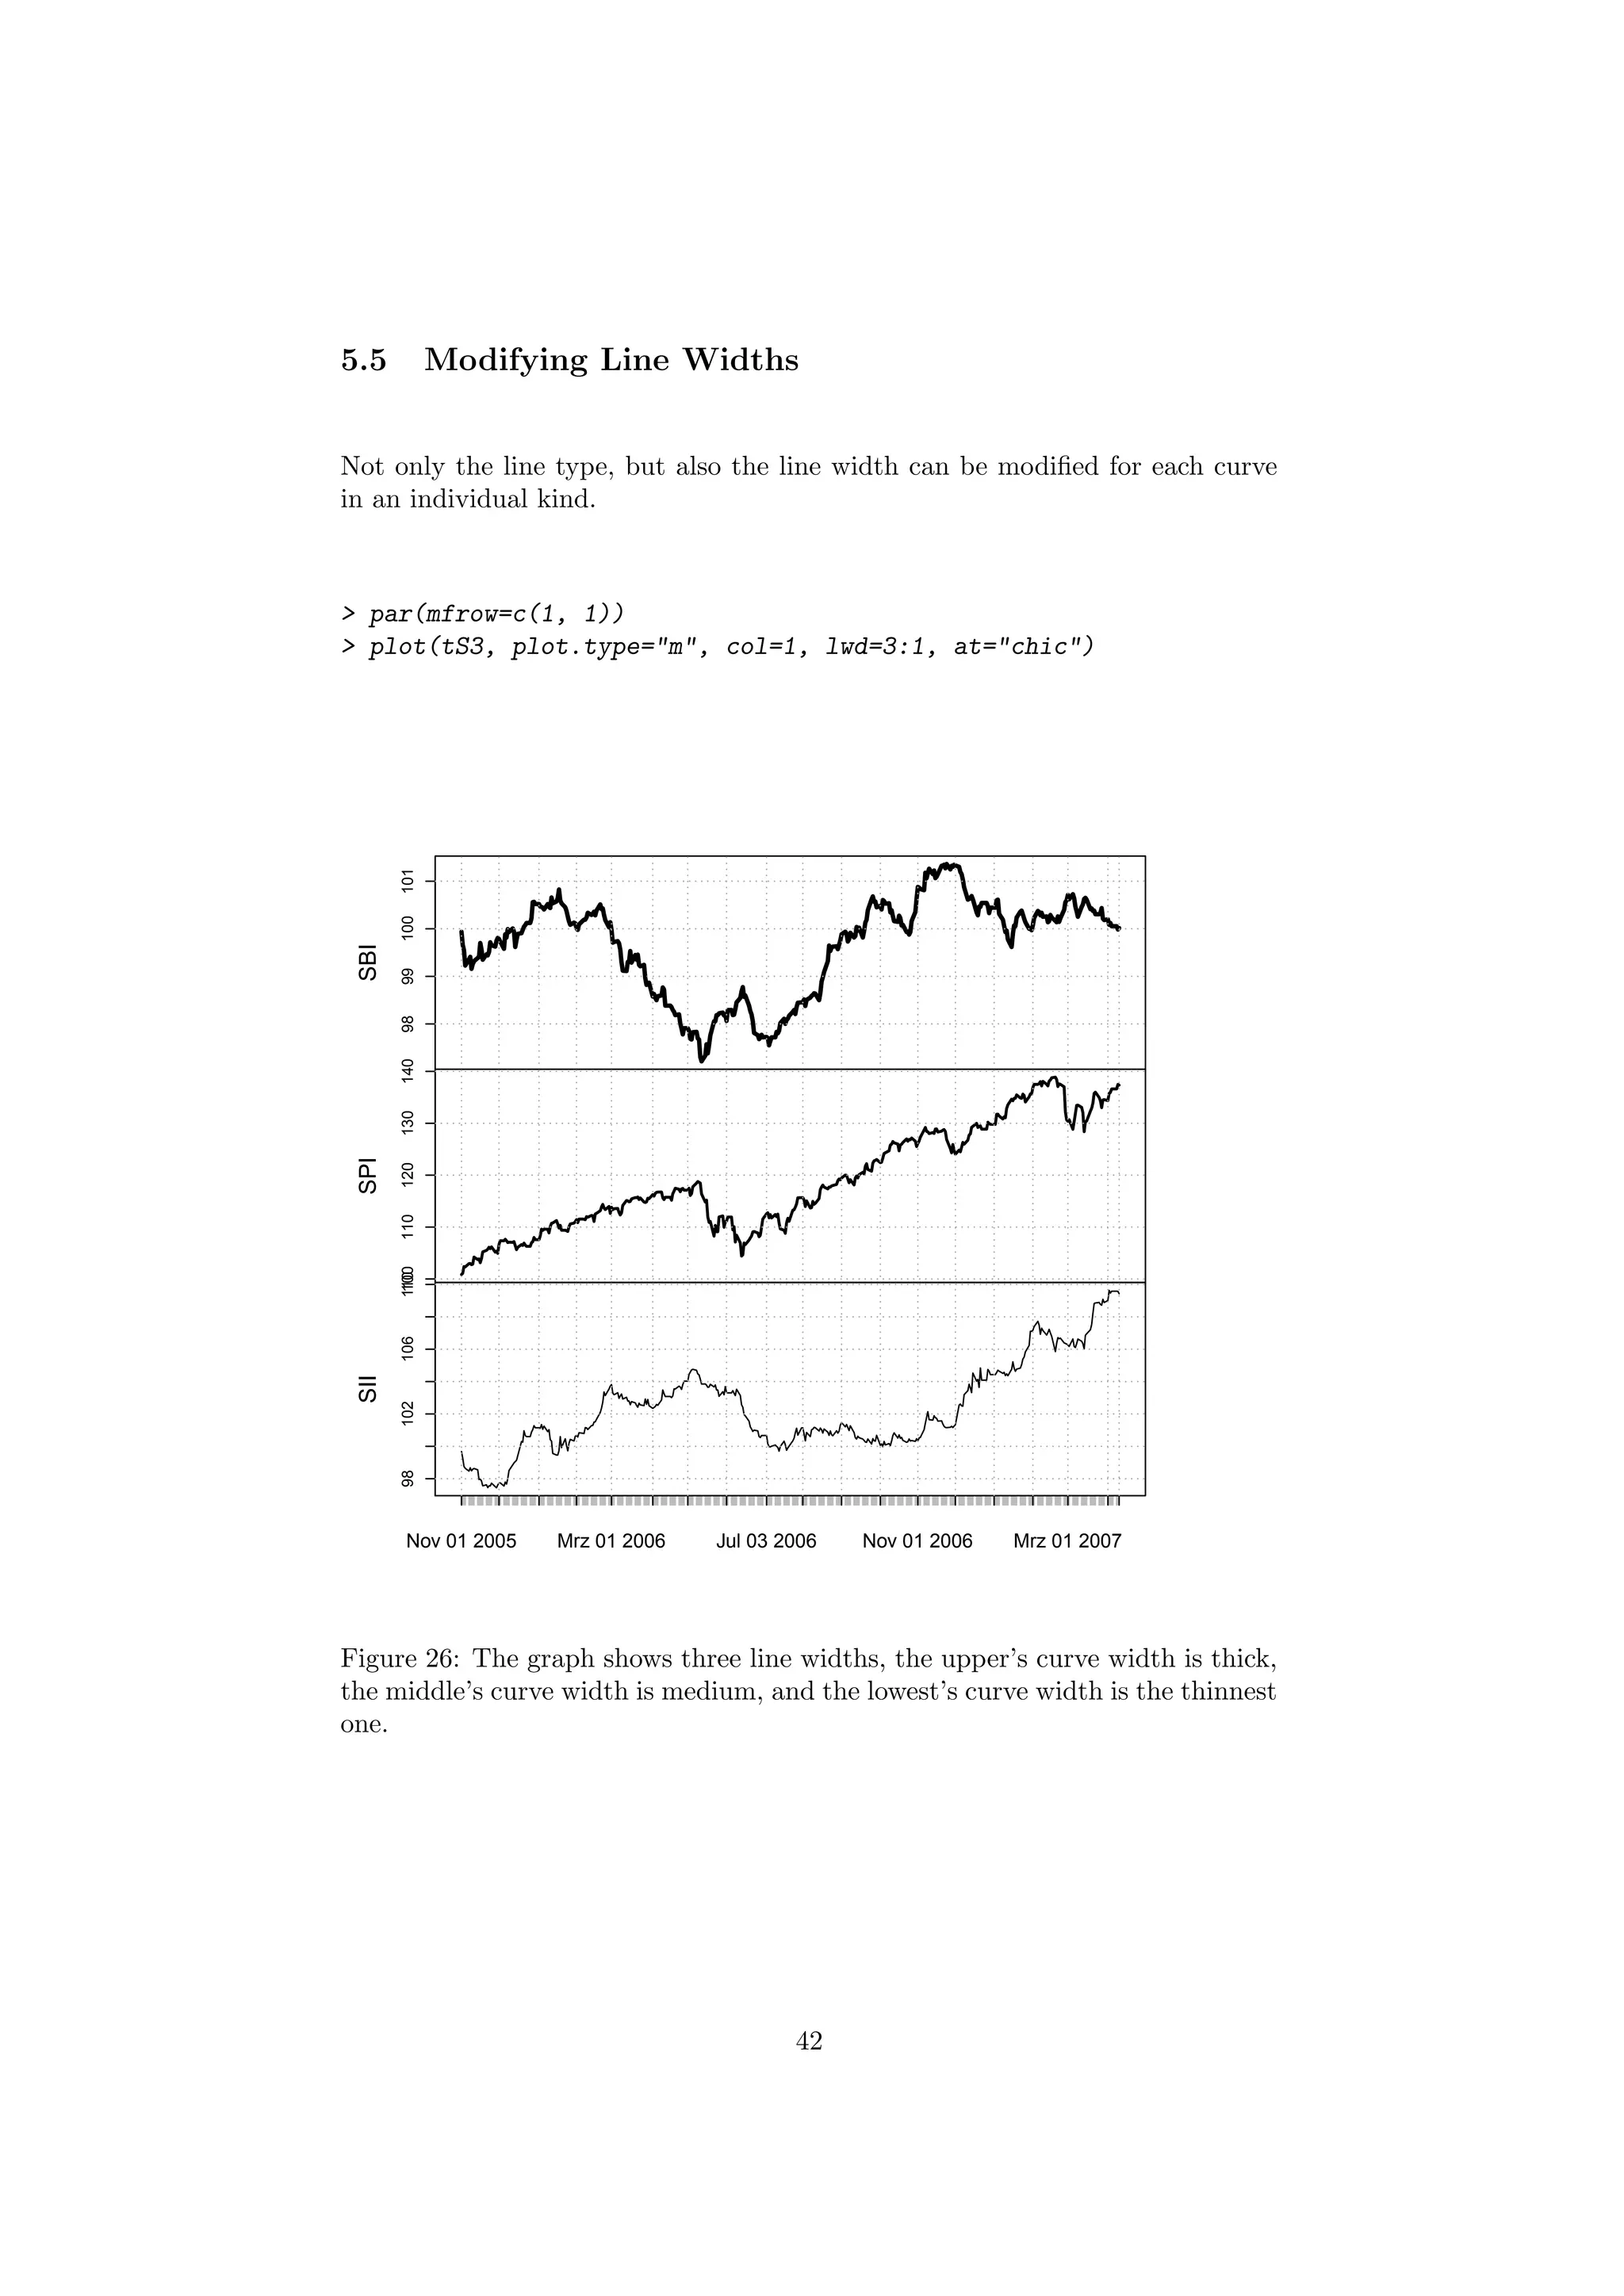
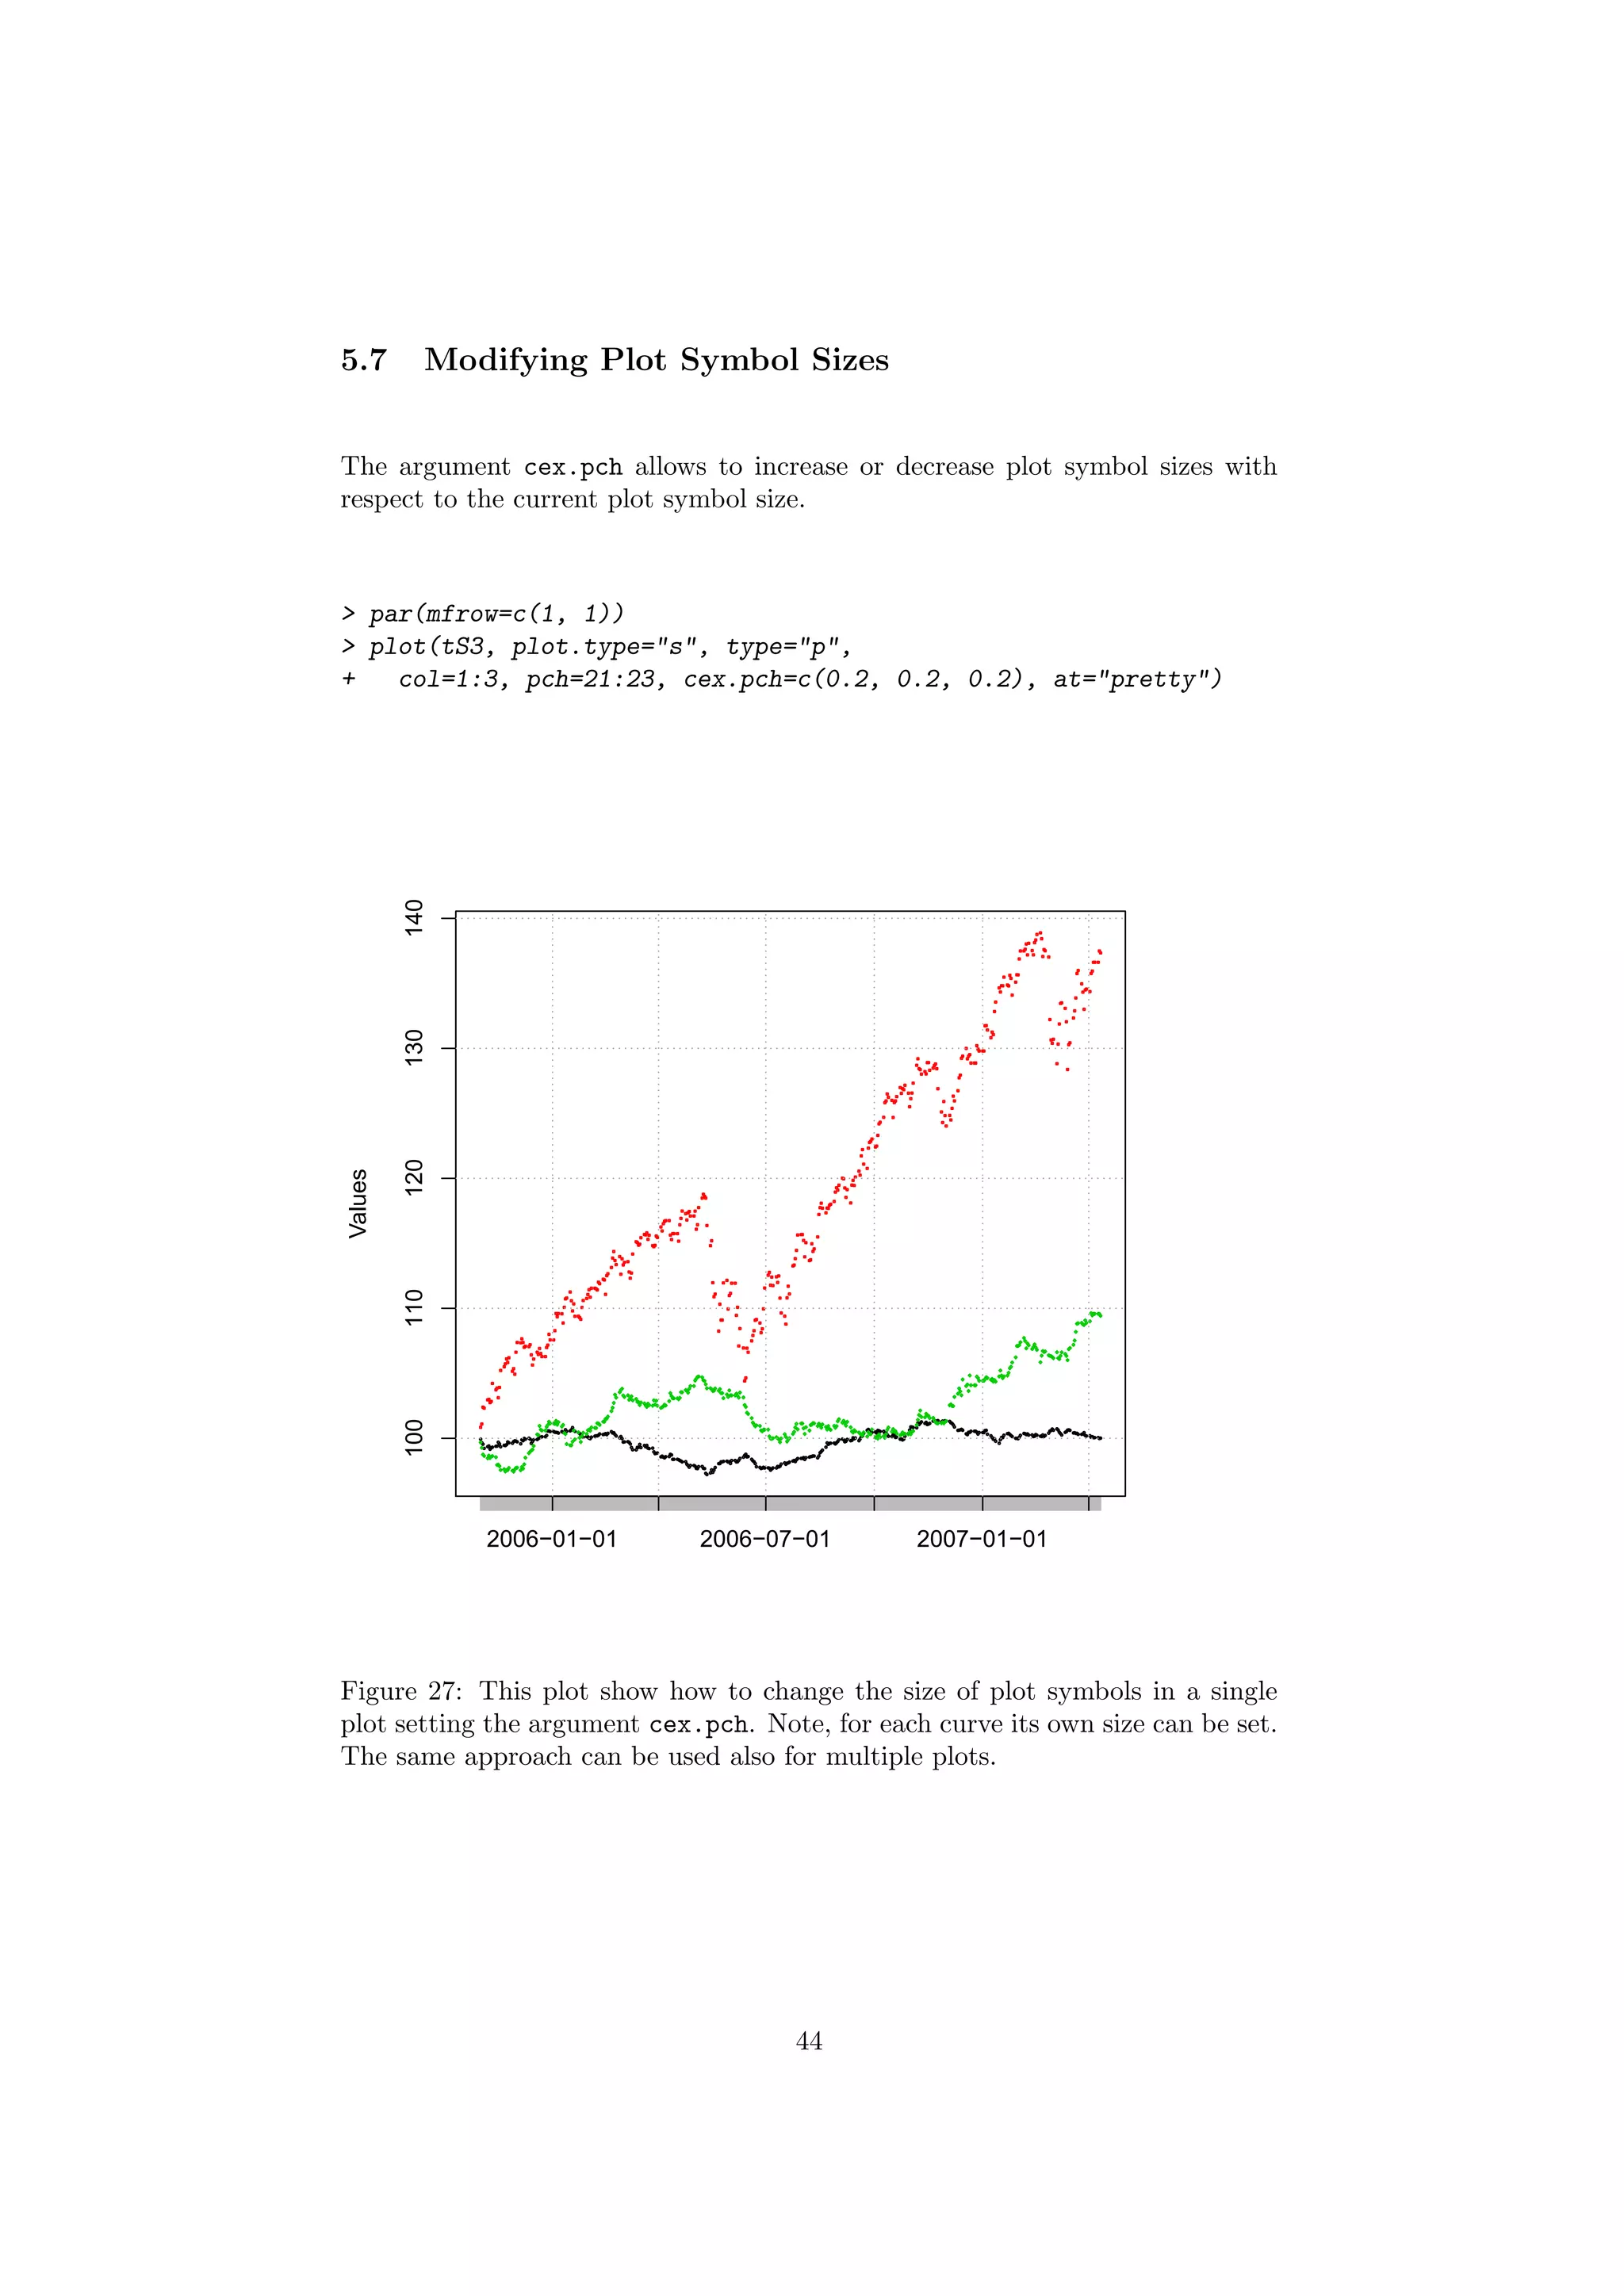
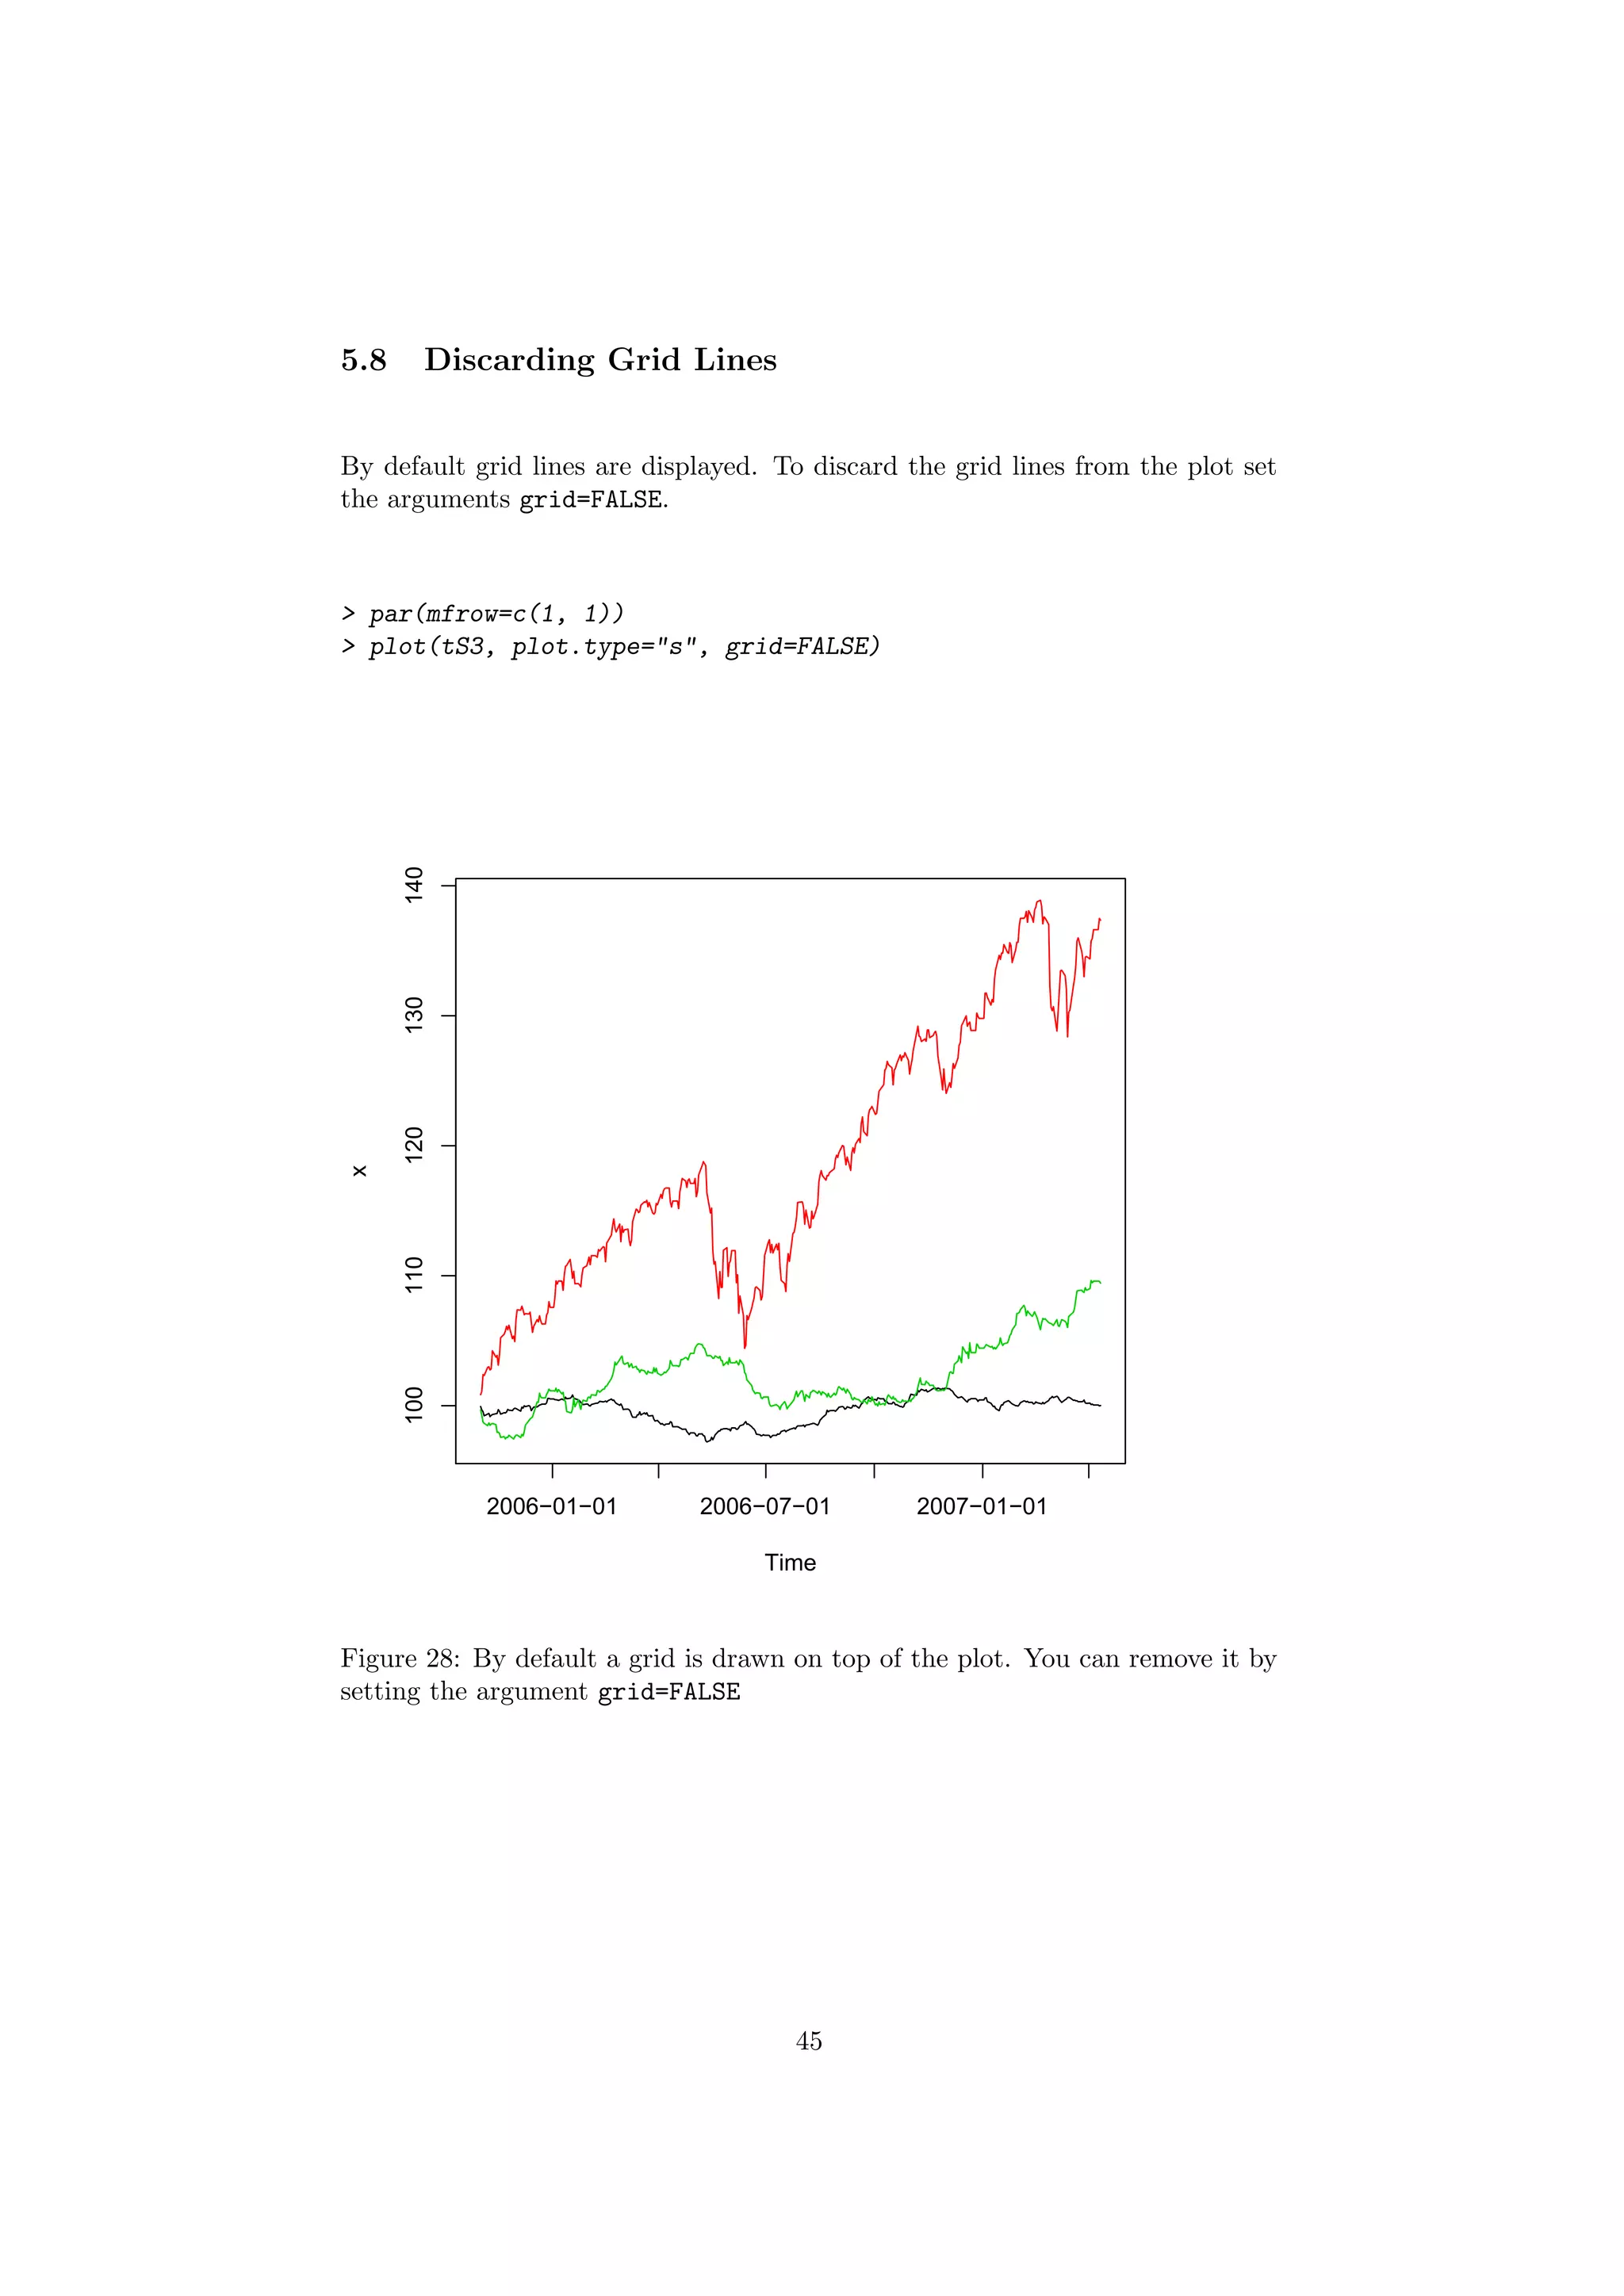
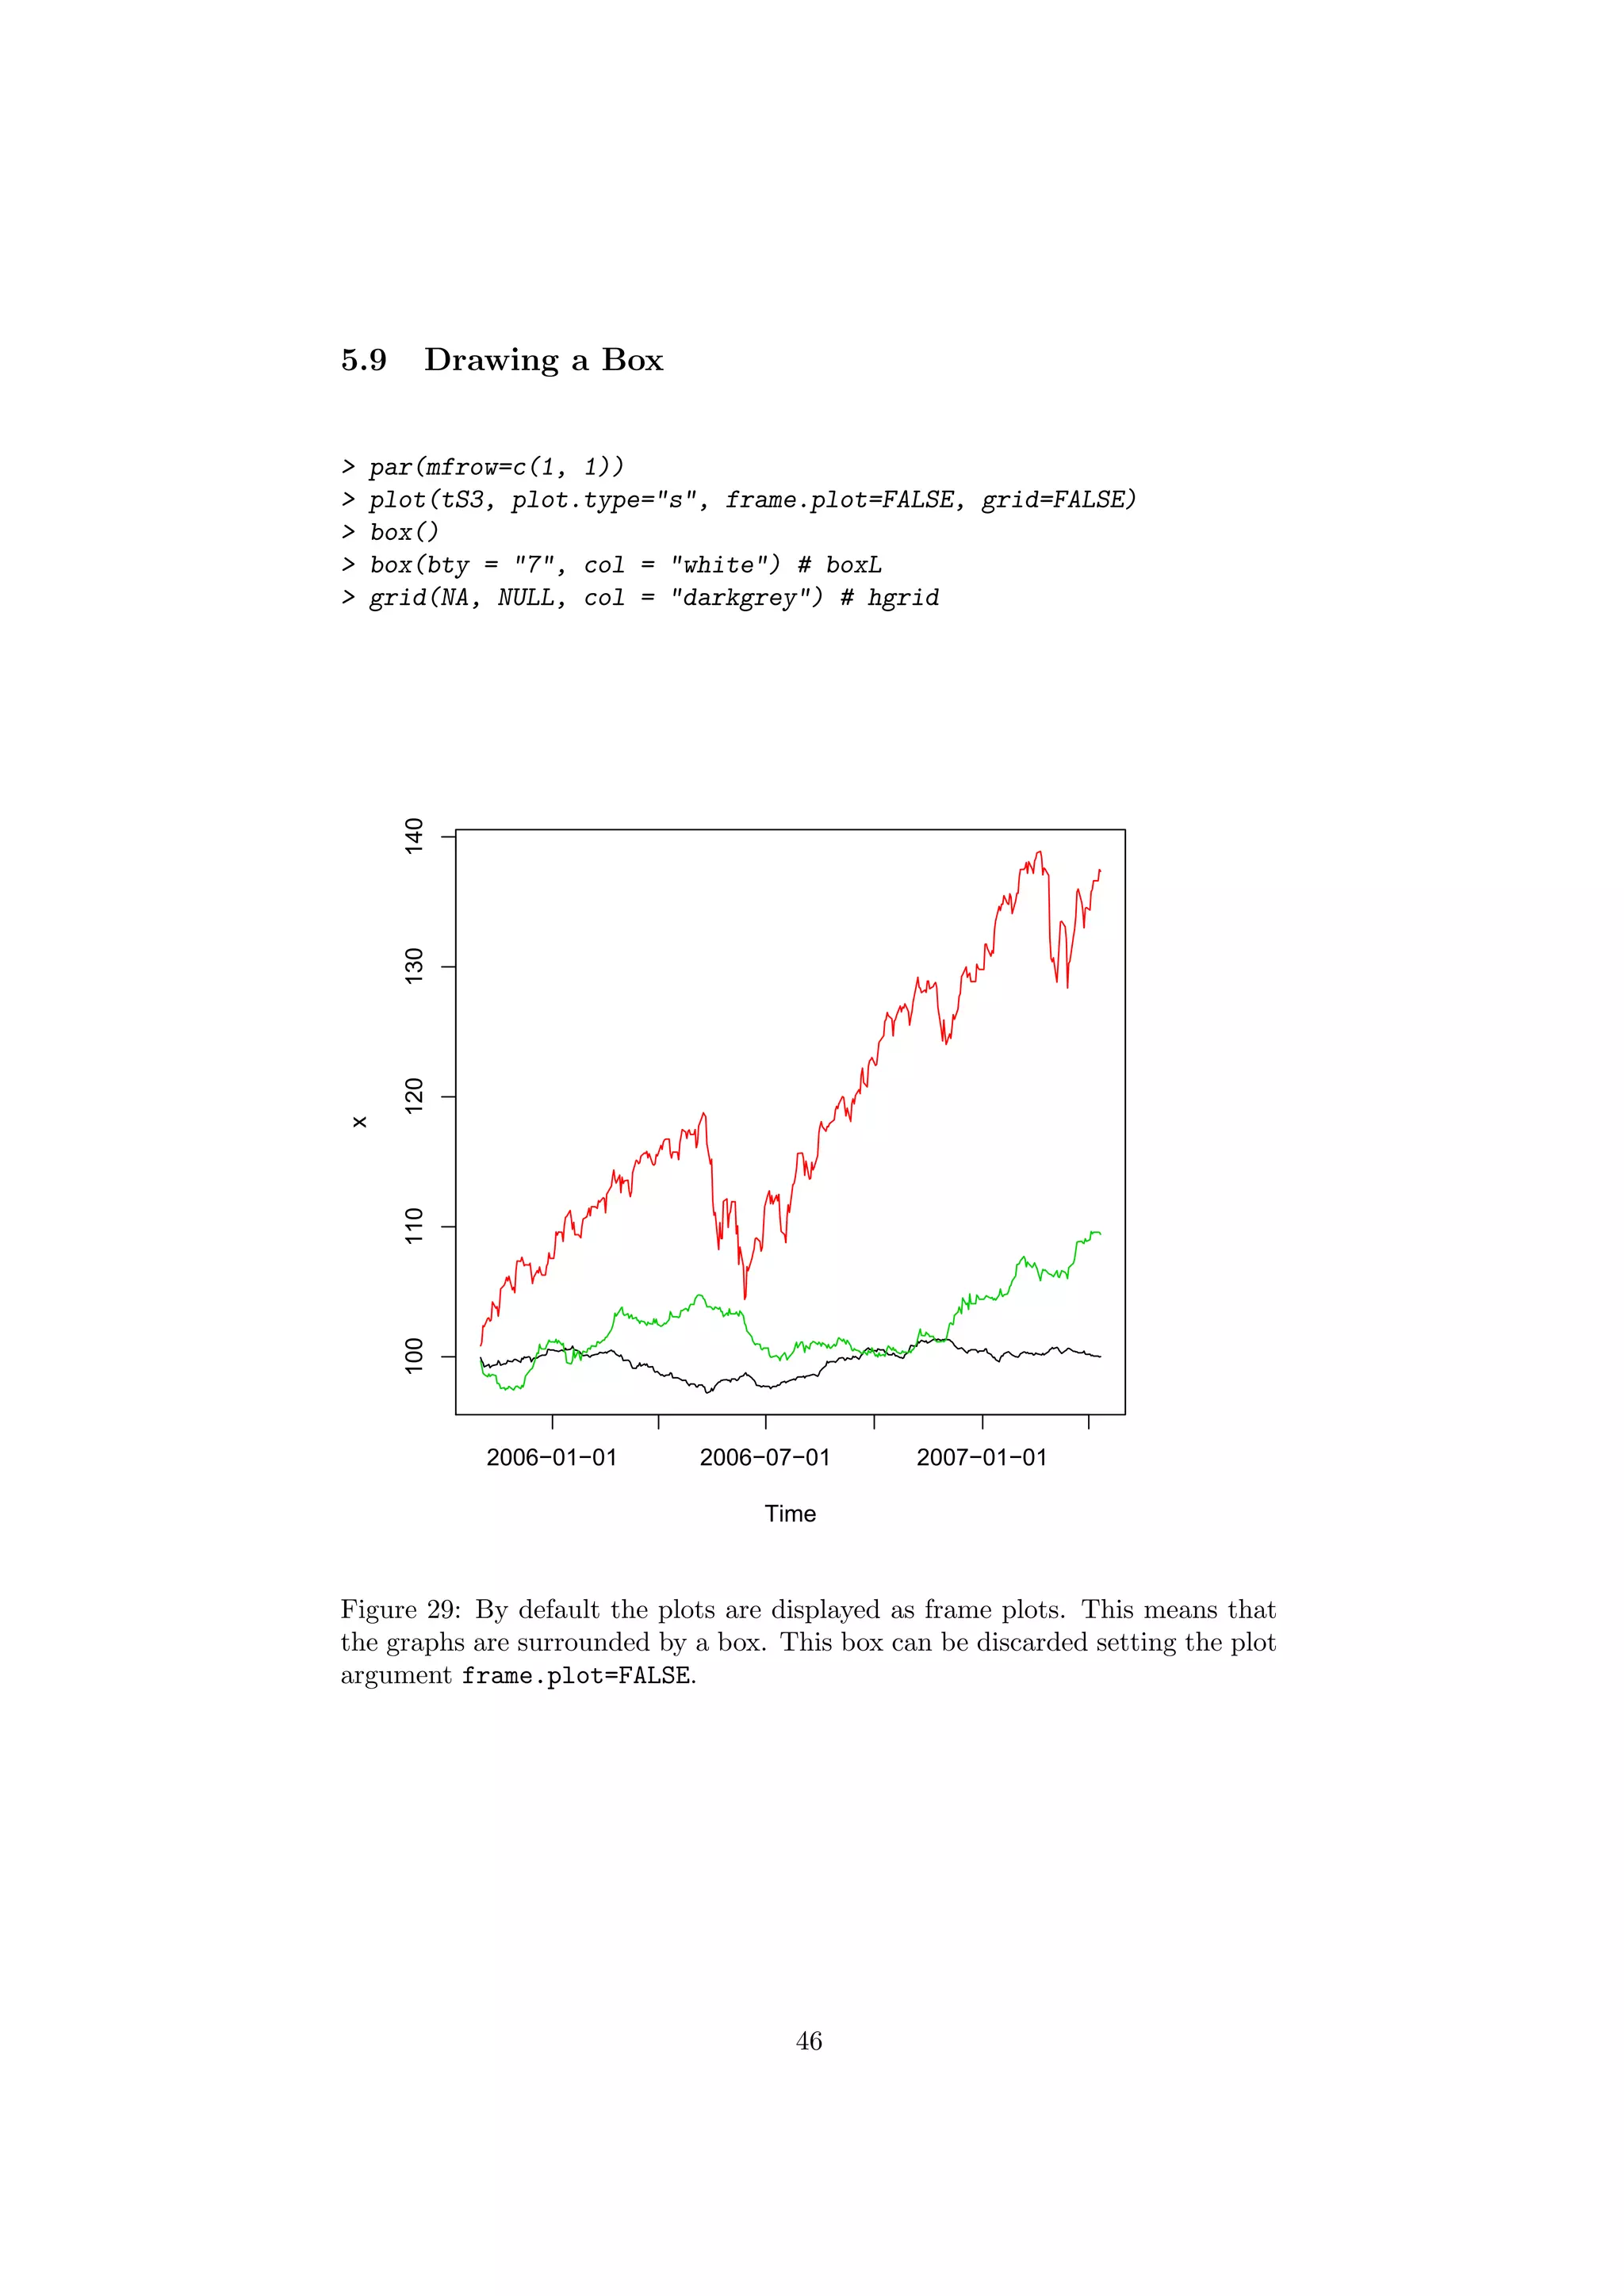
Decorations: There are several options to decorate the plot: These include colors
(col), plotting symbols (pch), scaling factor of plotting characters and symbols
(cex), line types (lty), and lindwidths (lwd). Note, all these parameters may
be vectors of the same length as the number of time series, so that each series
can be addressed to its own individual style, color, and size. A grid and the
plot frame (box) can be added or suppresse specifying the arguments grid and
frame.plot in the argument list of the plot function.
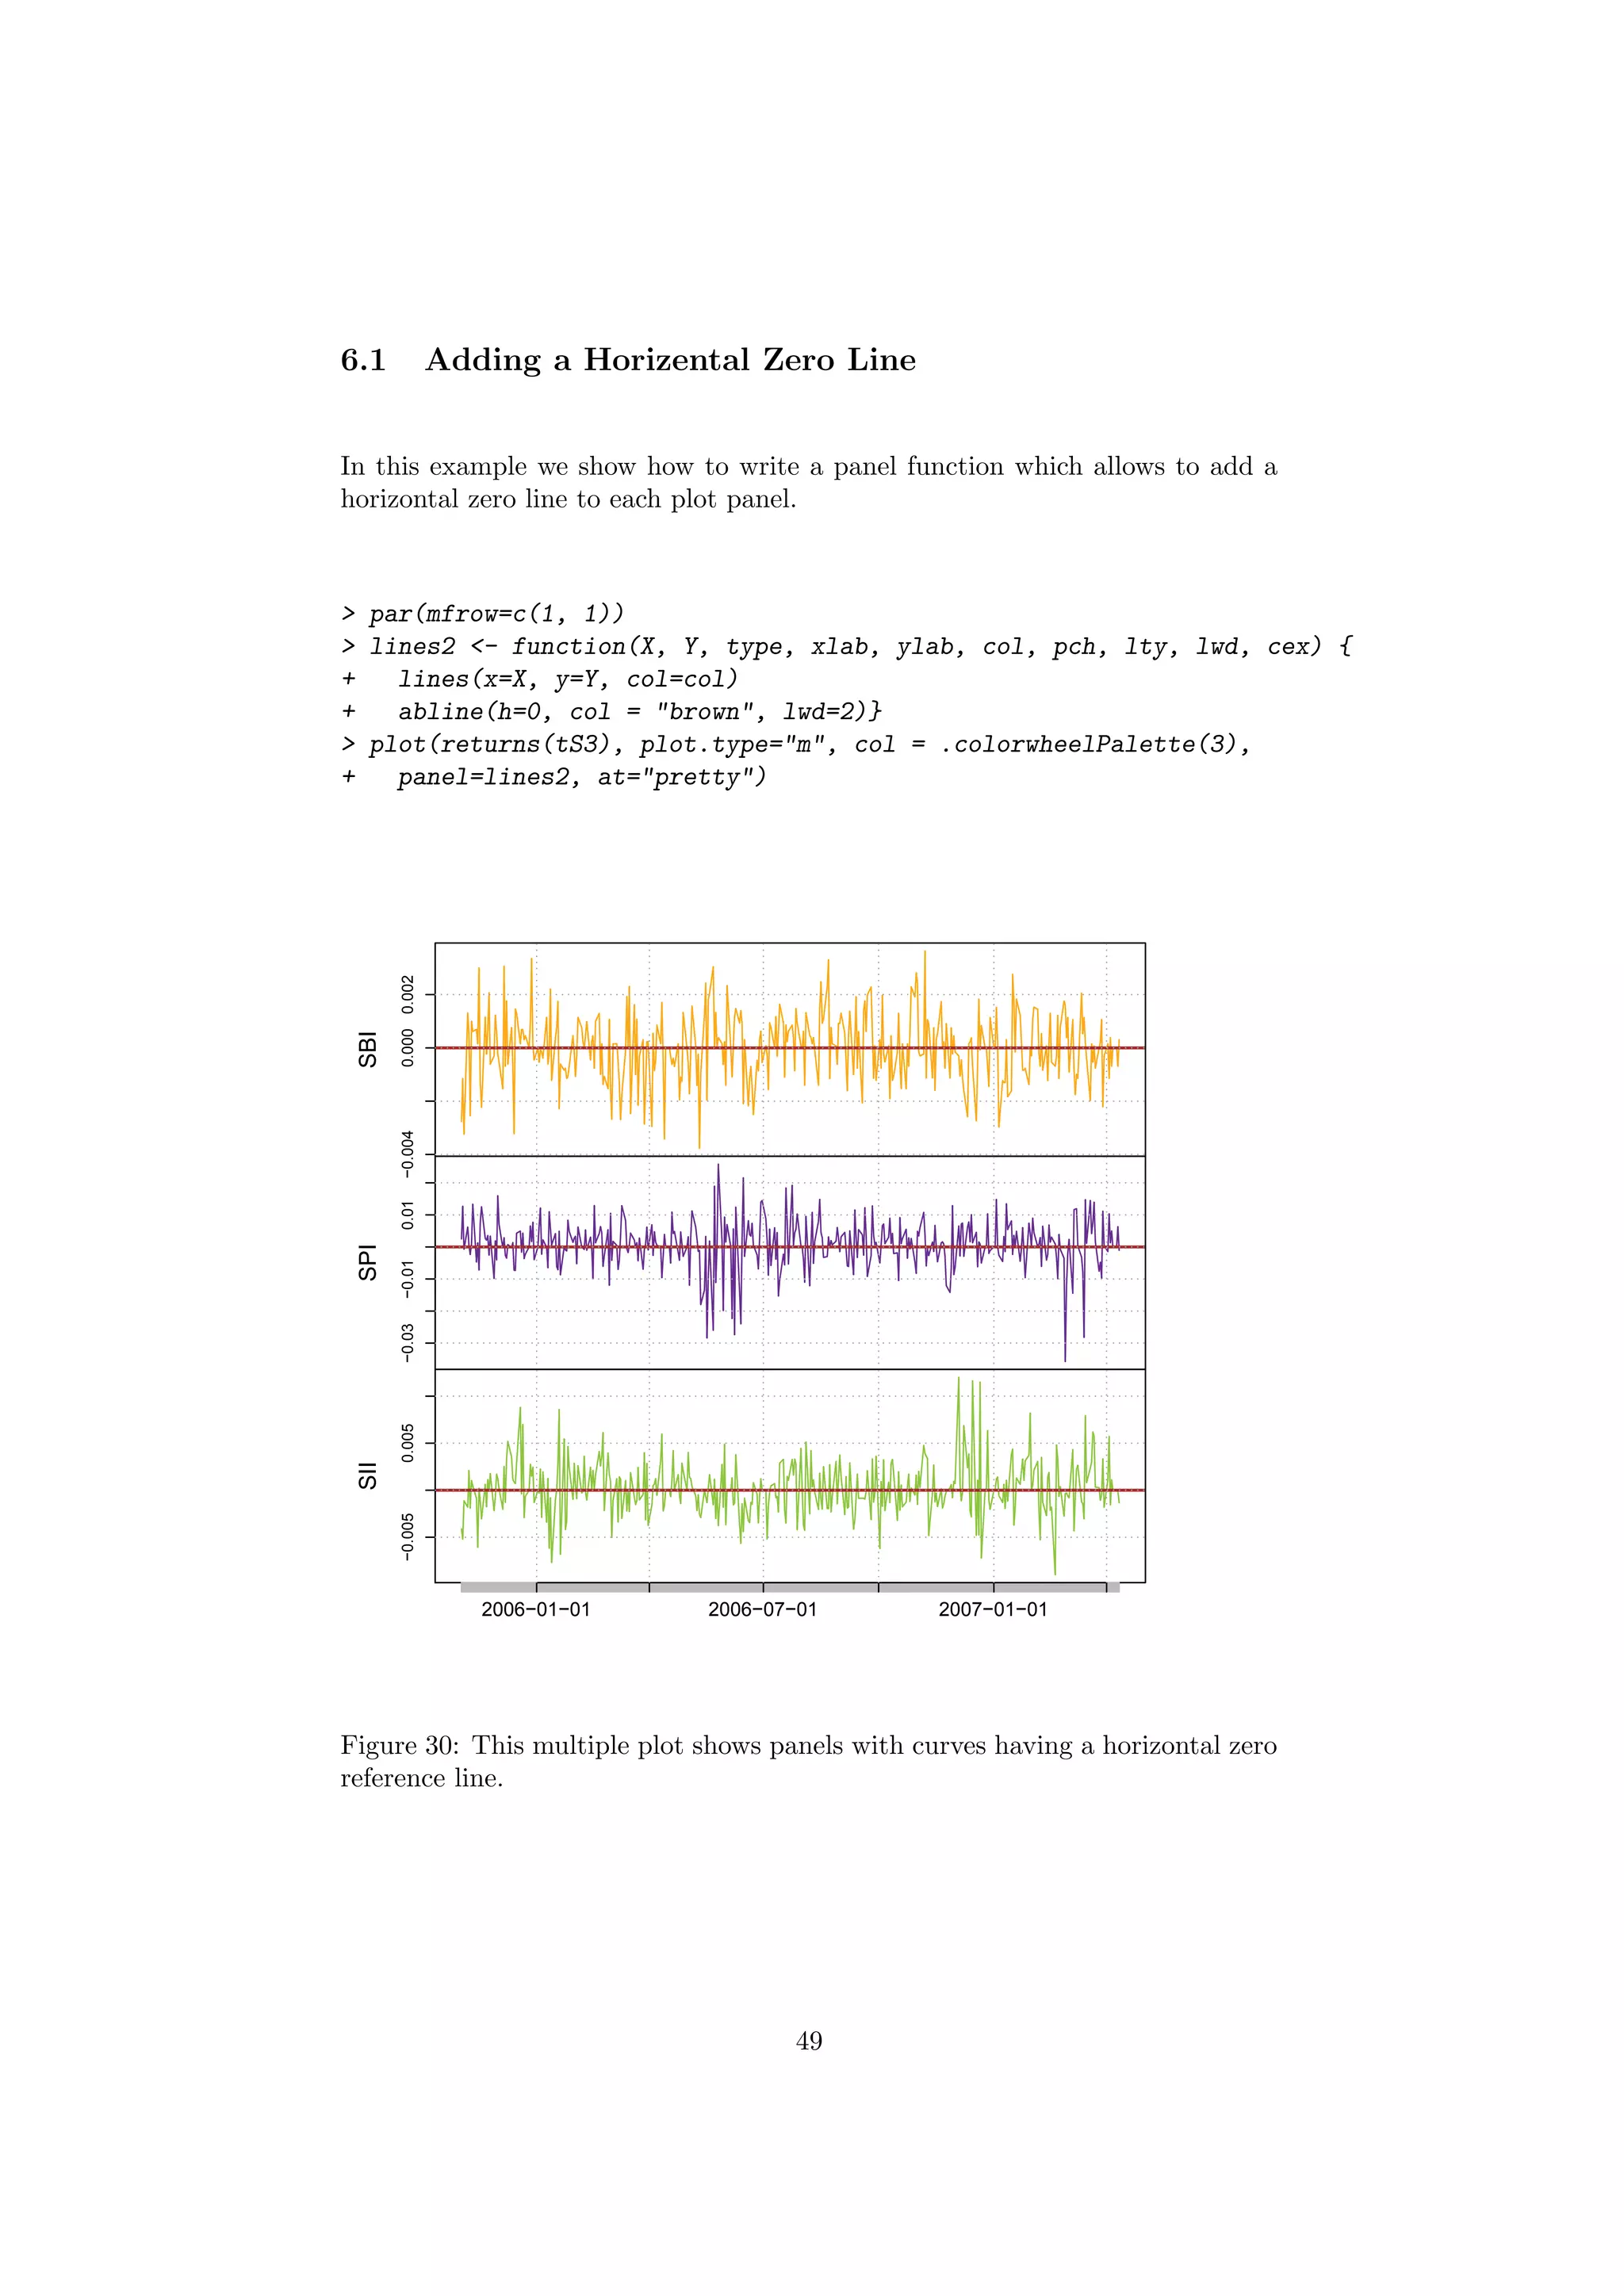
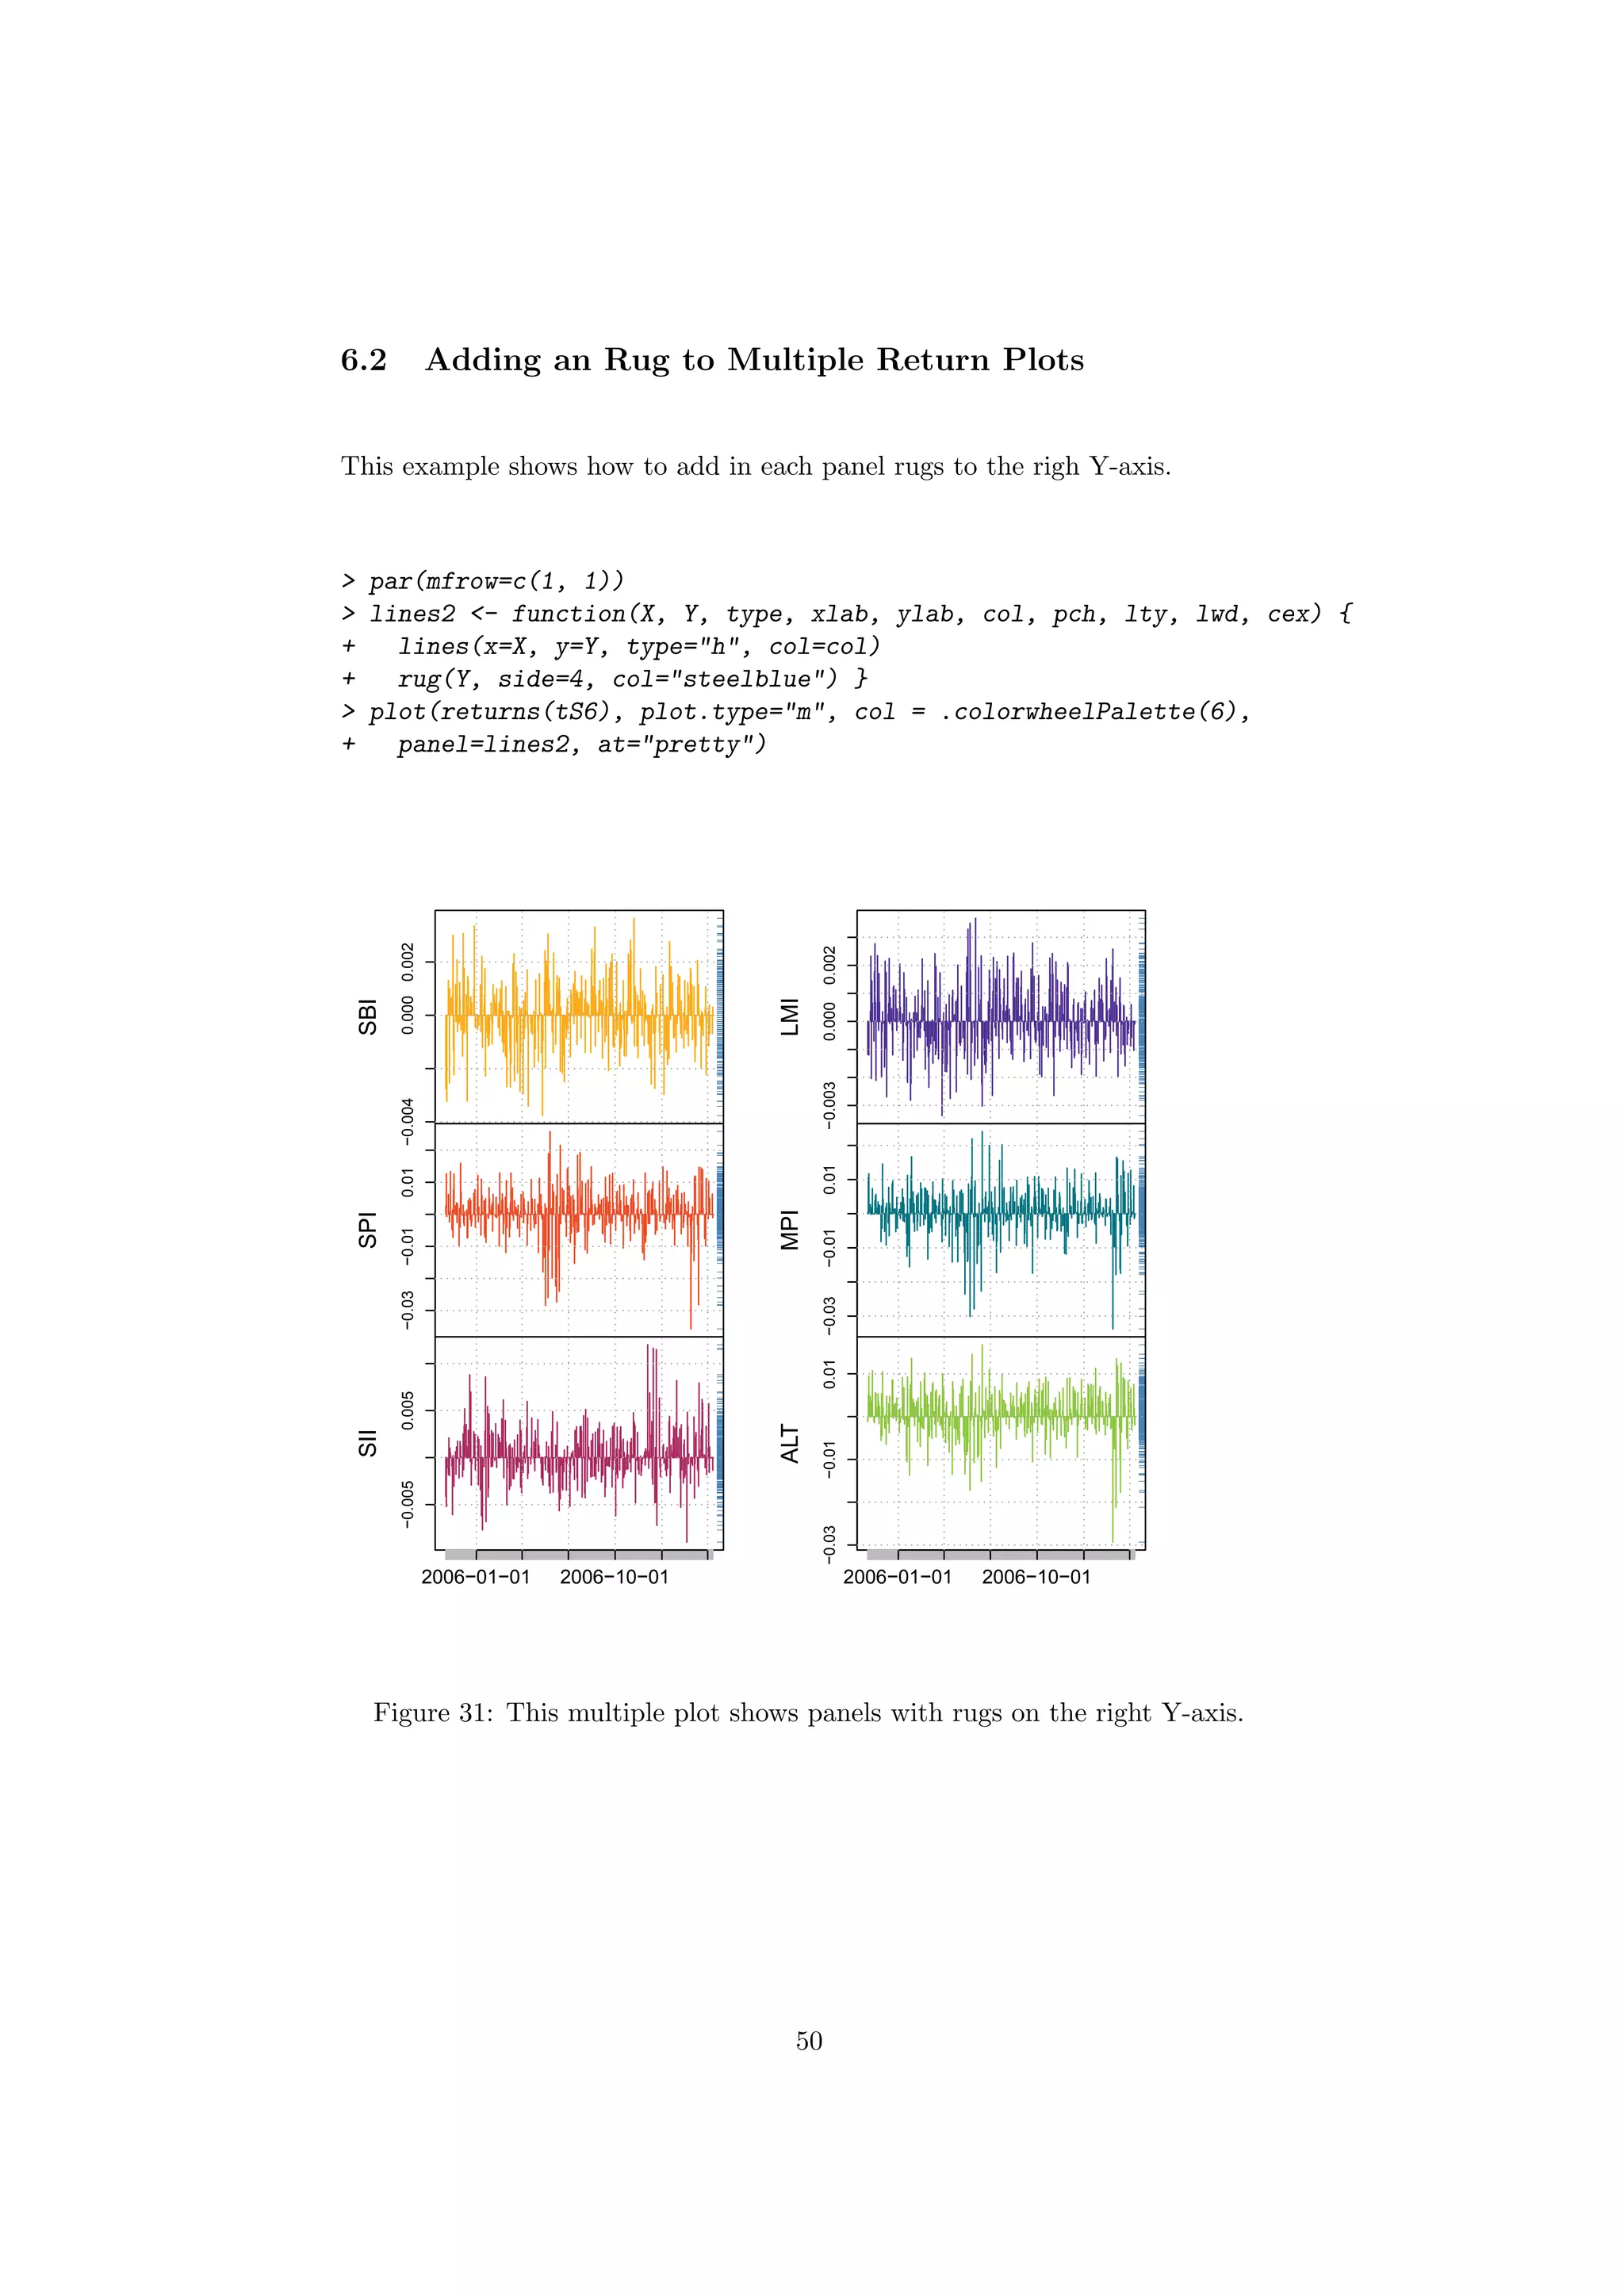
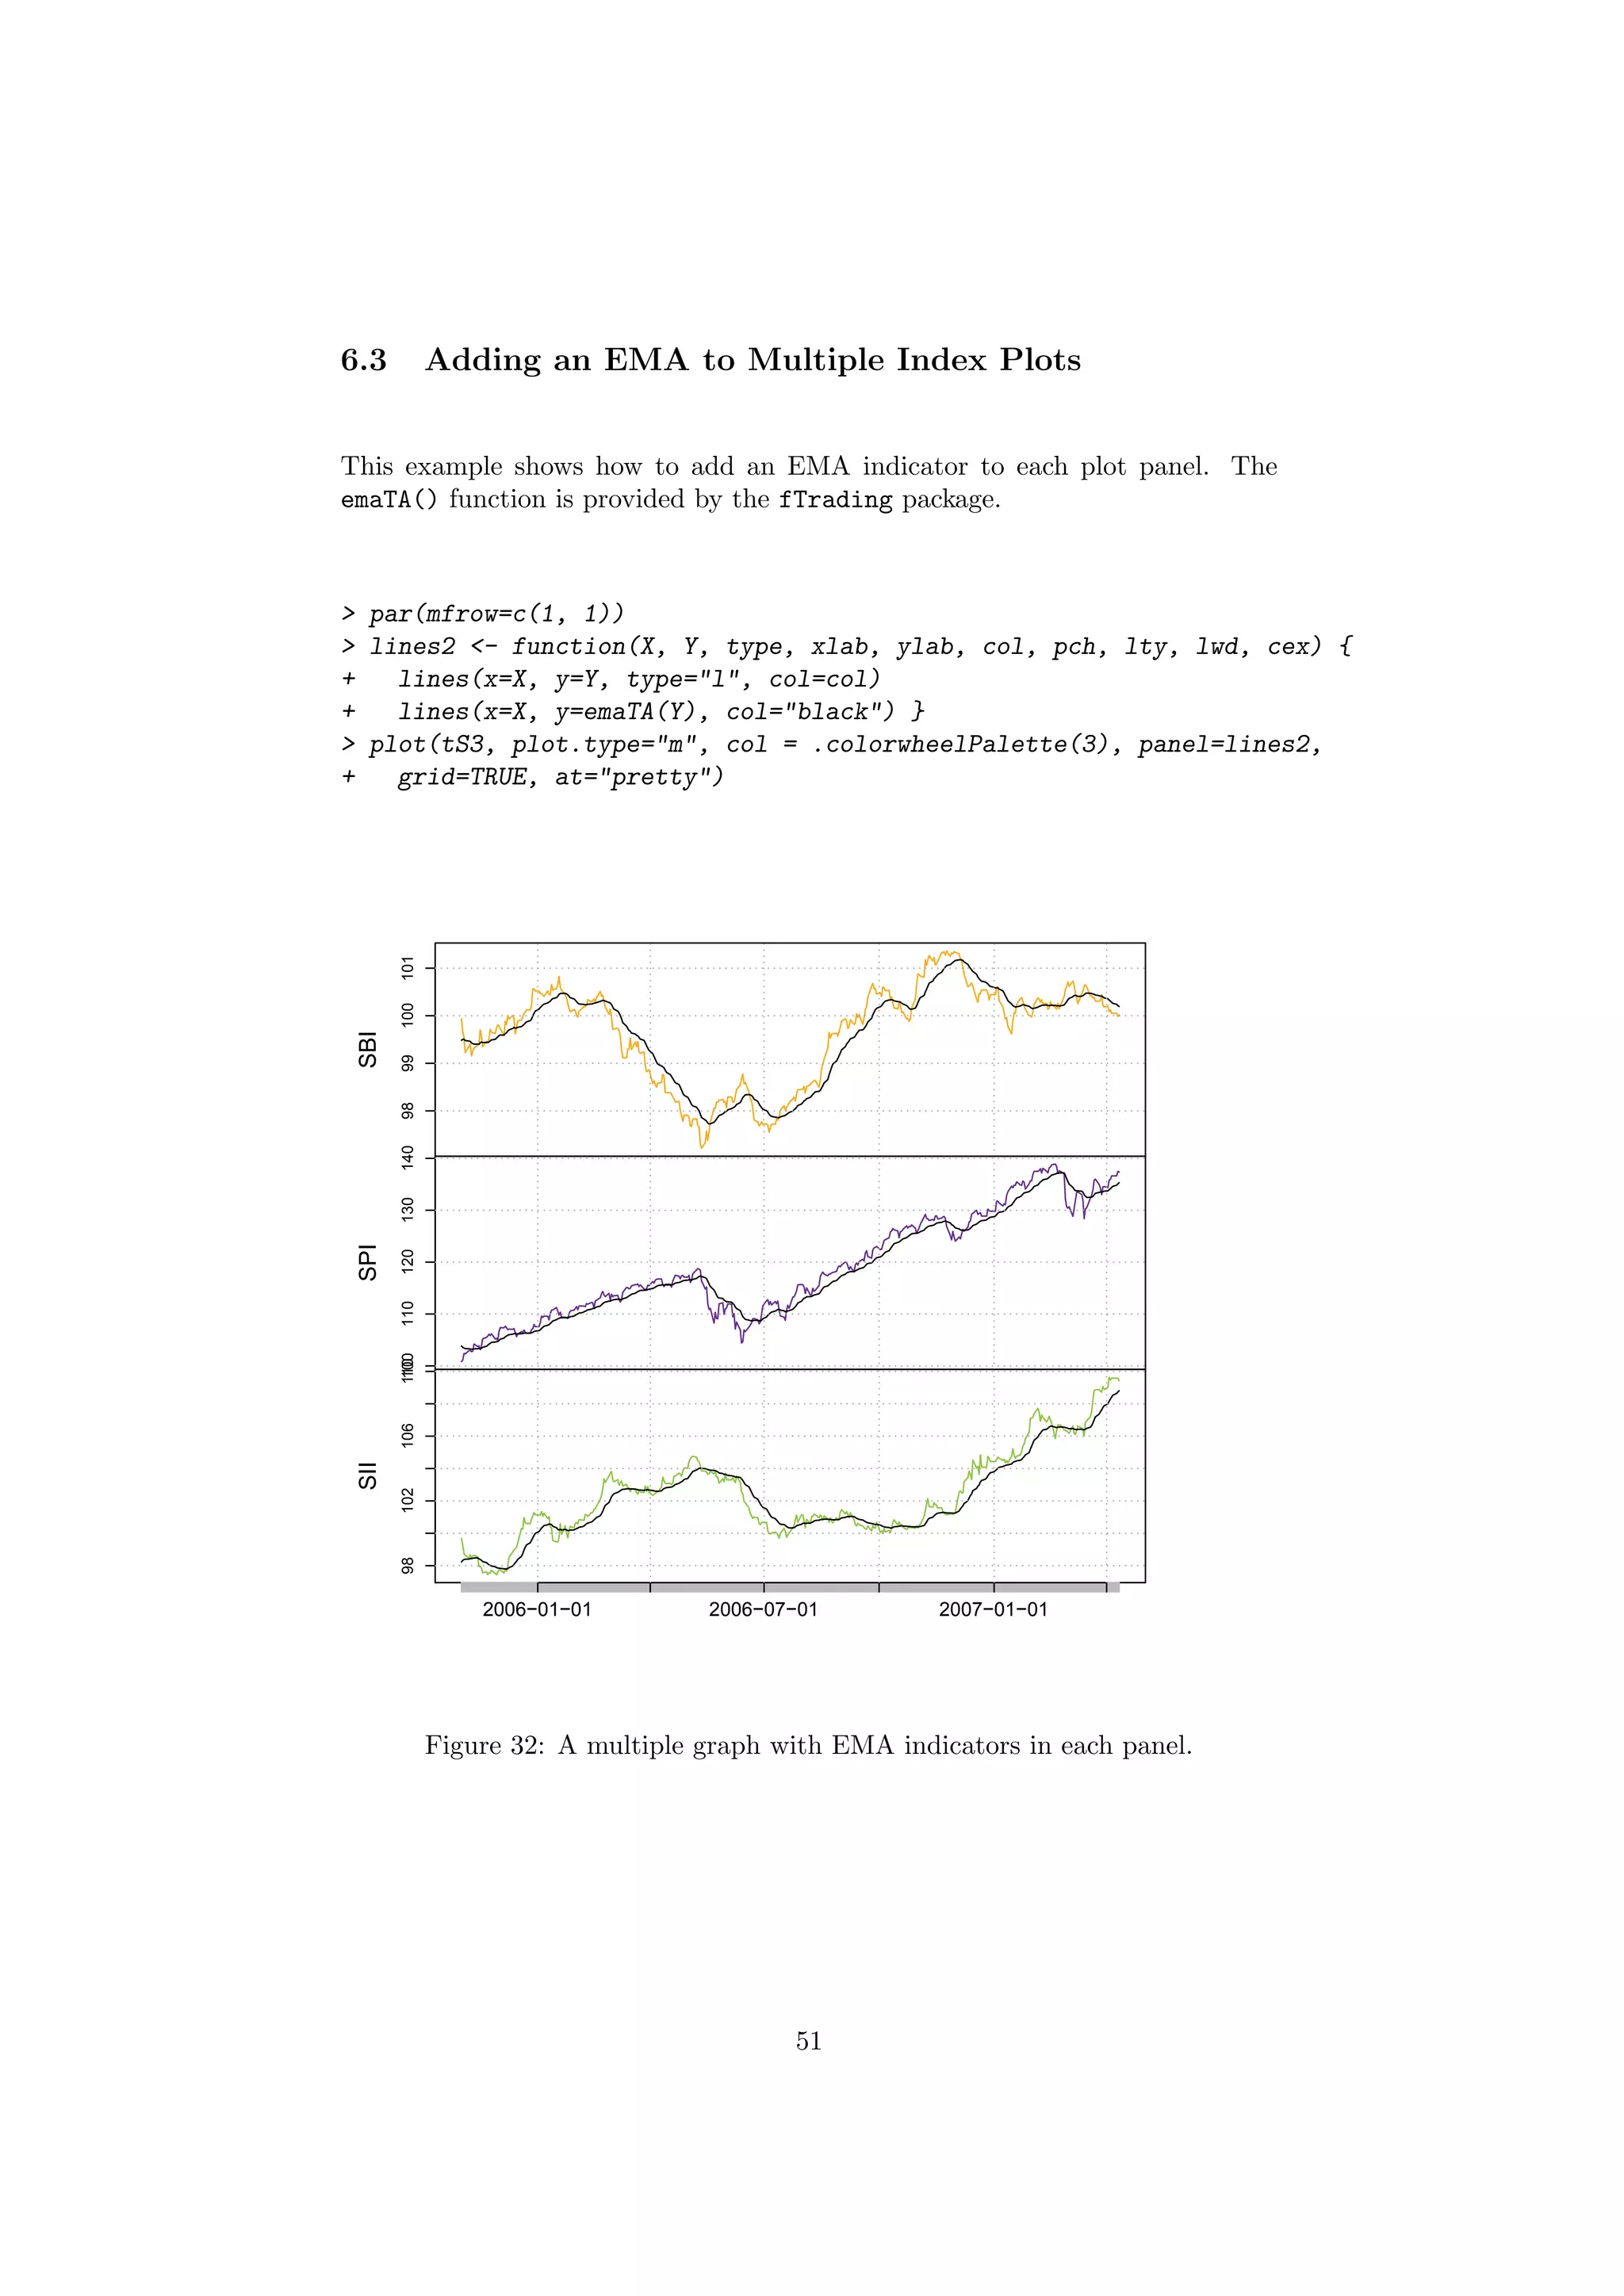
Panel Function: In the case of multiple plots the plot frames, are also called
panels. By default in each panel the appropriate curve is drawn calling R’s
lines function panel=lines. This function can be replaced by a user defined
function. This offers a wide range of new views on your time series. So for
example yo can show zero or any other reference lines on the panels, or you can
add rugs to (return) charts, or you can add for an example an EMA indicator
(or any other kind of indicator) to curves shown in individual panels.
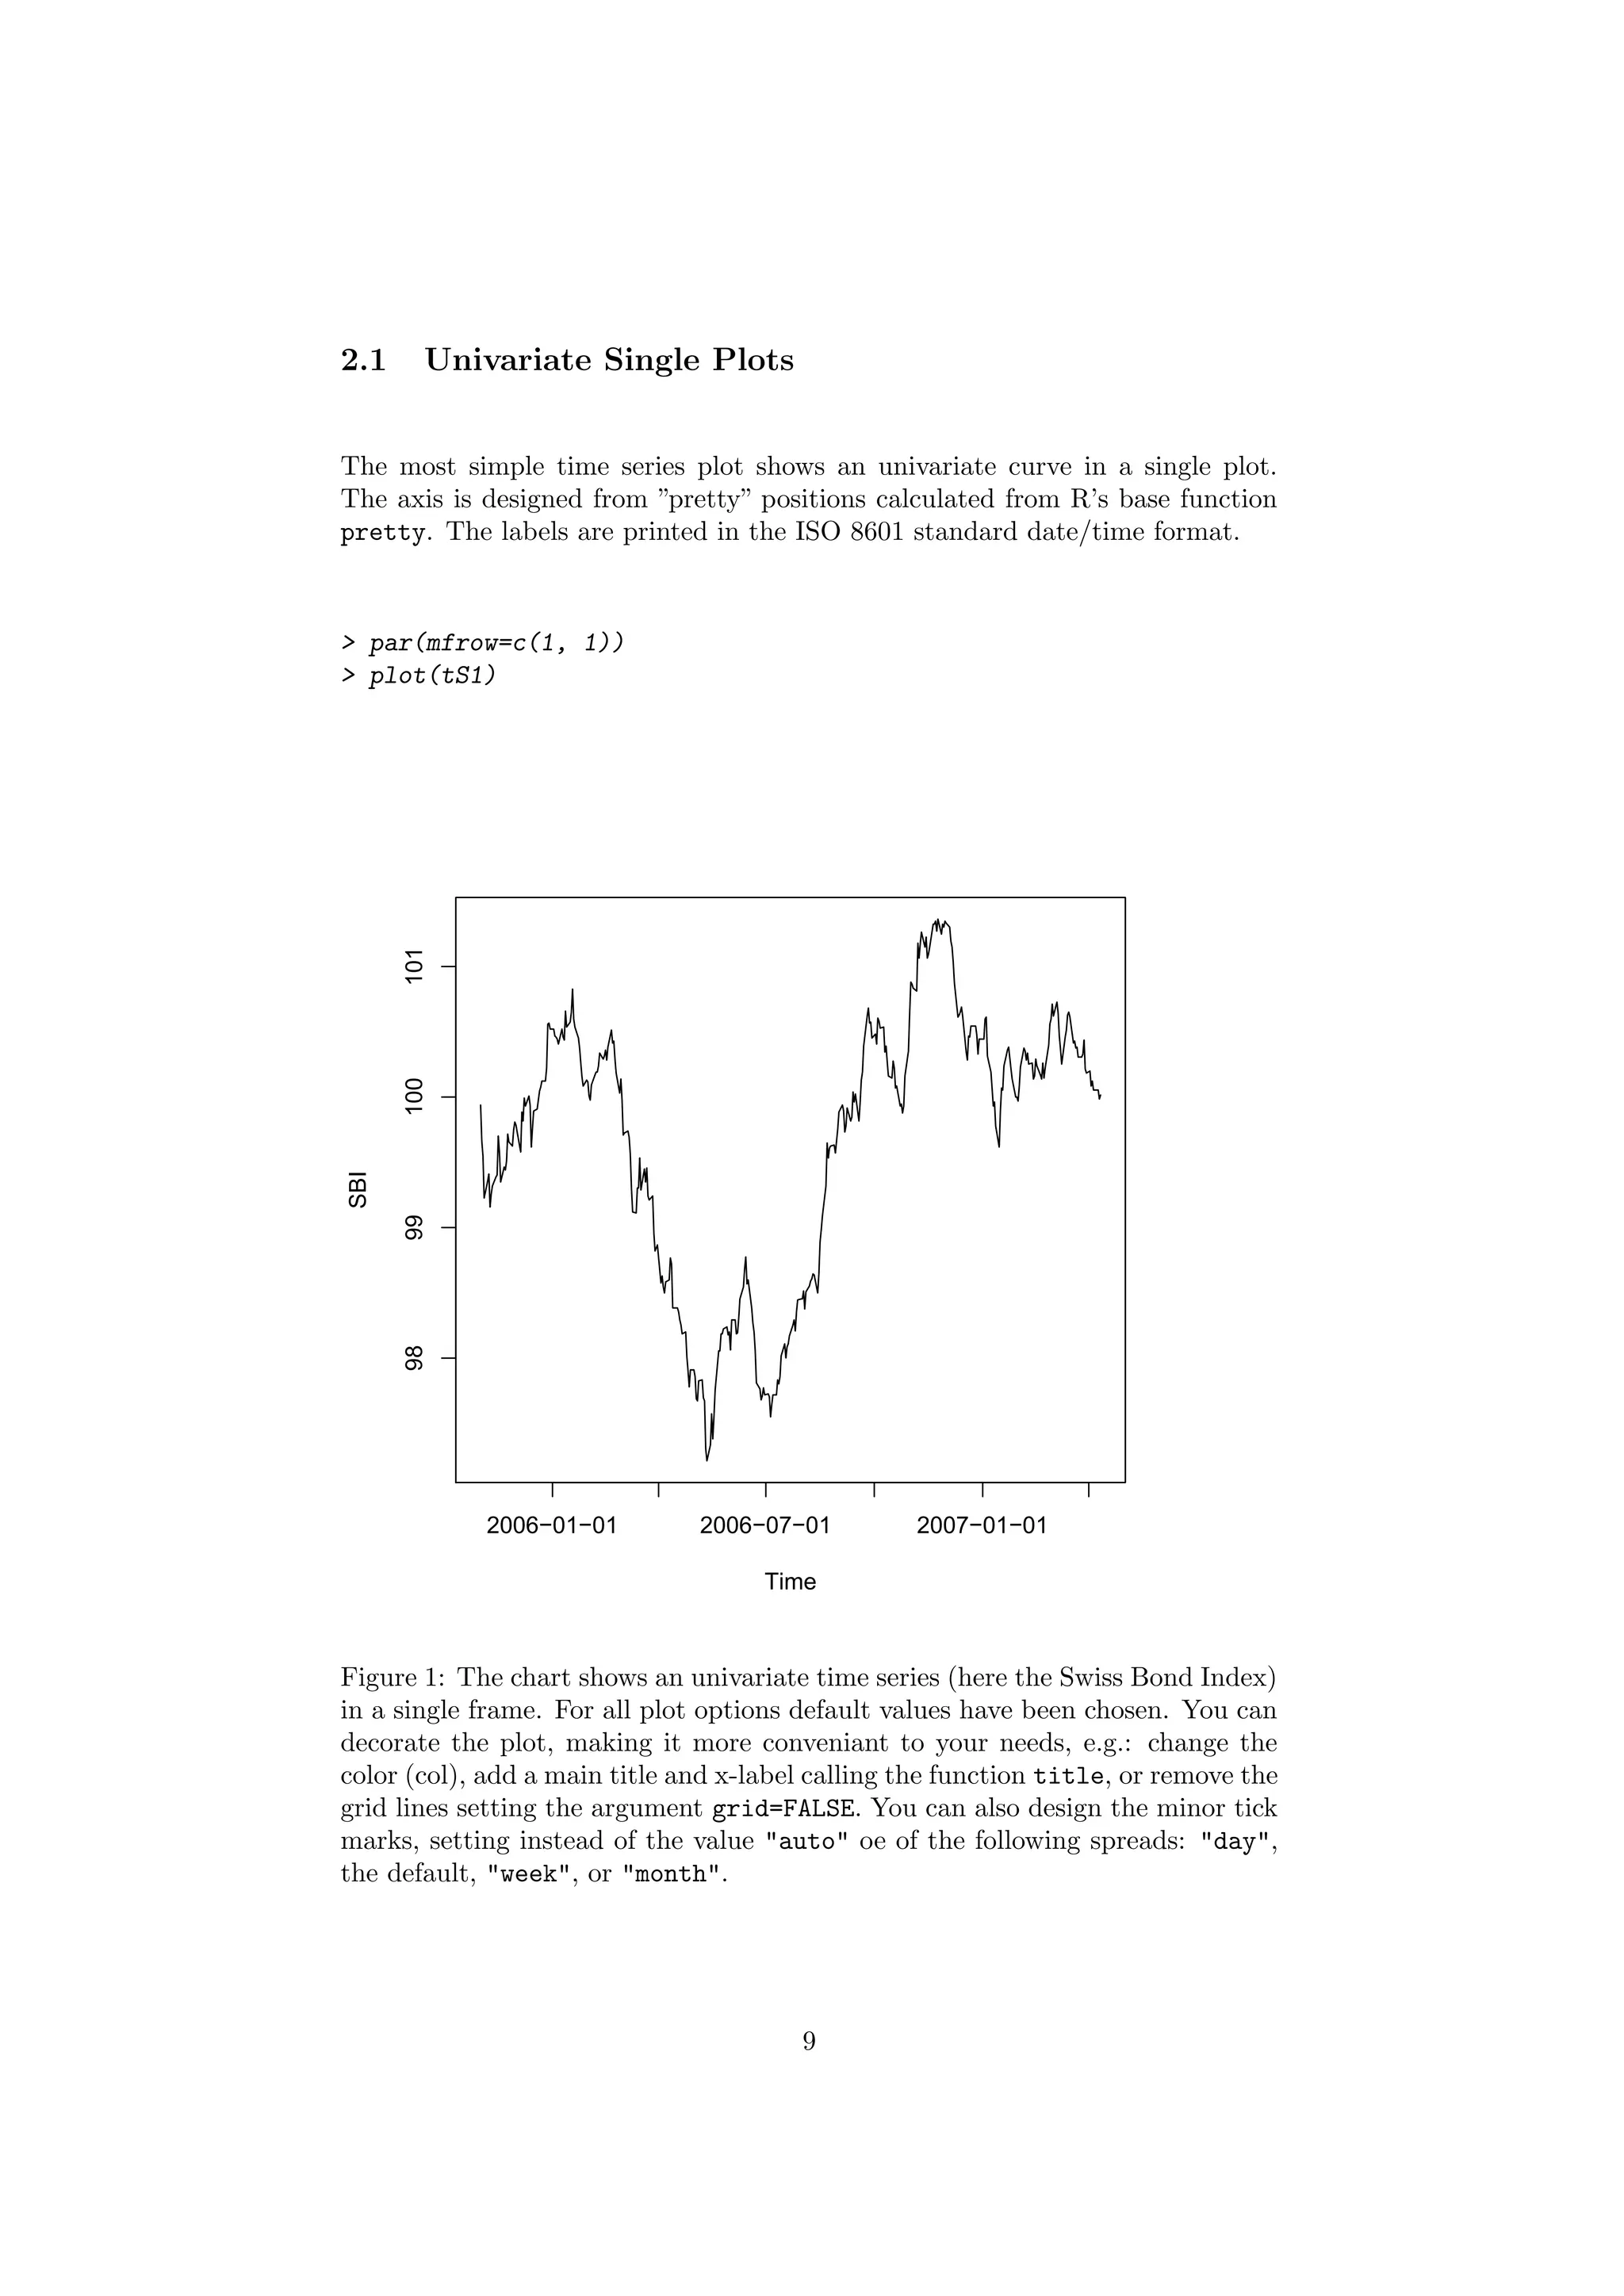
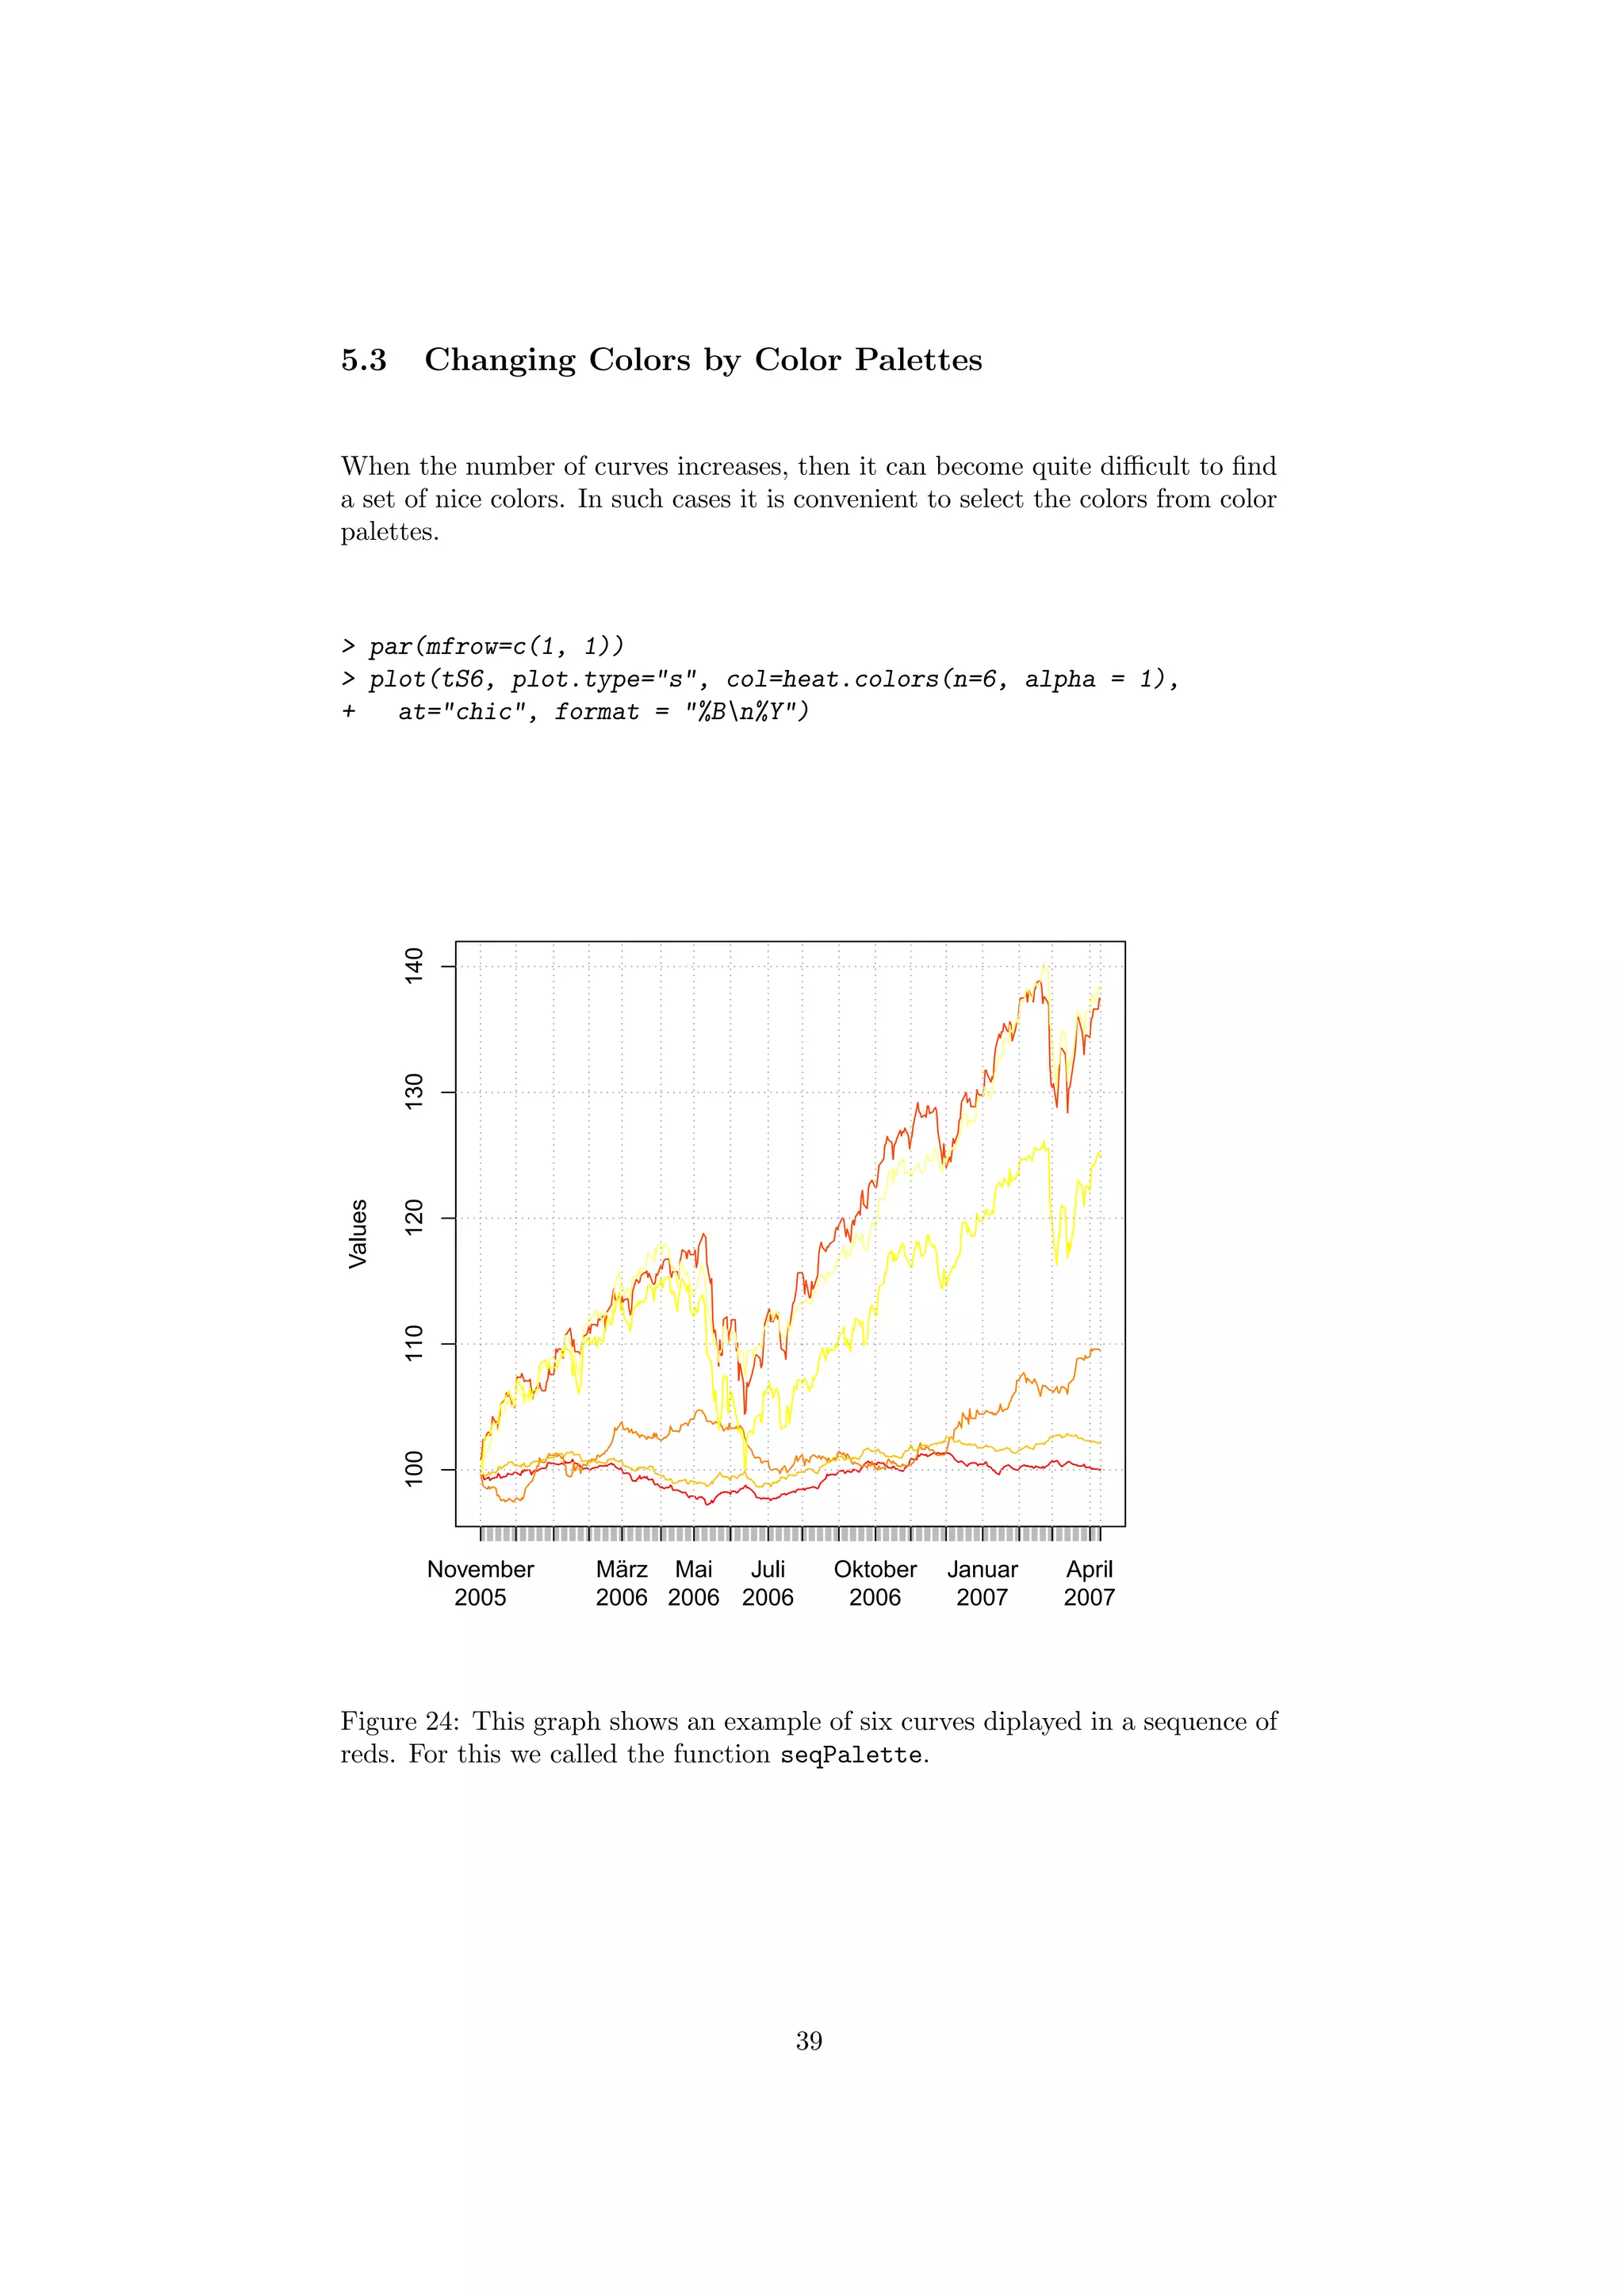
Example ”timeSeries” Objects: To demonstrate the wide range of options to
dispaly S4 timeSeries objects, we use the the daily index values from the Swiss
Pension Fund Benchmark LPP2005. The time series is part of the timeSeries
package. For this we have introduced some abbreviations:
> require(timeSeries)
> require(xts)
> require(PerformanceAnalytics)
> require(fTrading)
> tS1 <- 100 * cumulated(LPP2005REC[, 1]) # SBI (univariate)
> tS2 <- 100 * cumulated(LPP2005REC[, 1:2]) # SBI & SPI (bivariate)
> tS3 <- 100 * cumulated(LPP2005REC[, 1:3]) # SBI, SPI, SWIIT (Swiss Market)
> tS6 <- 100 * cumulated(LPP2005REC[, 1:6]) # Swiss and Foreign Market Indexes
5](https://image.slidesharecdn.com/timeseriesplot-150726004458-lva1-app6892/75/Time-seriesplot-5-2048.jpg)


![2.4 Combining Single Plots
You can also create your own multiple panel plots. Just combine single panels
in an array of rows and columns using the parameter settings for mfrow, mfcol,
and mar.
> par(mfrow=c(2, 1))
> par(mar = c(bottom=1.5, 5.1, top=4, 2.1))
> plot(tS2[, 1])
> par(mar = c(bottom=4, 5.1, top=1.5, 2.1))
> plot(tS2[, 2])
Time
SBI
2006−01−01 2006−07−01 2007−01−01
9899100101
Time
SPI
2006−01−01 2006−07−01 2007−01−01
100110120130140
Figure 8: One can use in single plots the mfrow and mar parameter settings to
place single plots either row by row or column by column. Here, mfrow and
mfcol to the job. In this case a vector of the form c(nr, nc) draws subsequent
figures in an nr-by-nc array on the device by columns (mfcol) or rows (mfrow),
respectively.
16](https://image.slidesharecdn.com/timeseriesplot-150726004458-lva1-app6892/75/Time-seriesplot-16-2048.jpg)
![2.5 Layout of Single Plots
There is another option in R to create panel layouts, not necessarilly in an
rectangular array. Have a look to the help page of the function layout, her
comes a simple example.
> nf <- layout(mat=matrix(c(1, 1, 2, 3), byrow = TRUE, nrow=2))
> par(mar = c(bottom=2, 5.1, top=3, 2.1))
> plot(tS3[, 1])
> par(mar = c(bottom=3, 5.1, top=2, 1.1))
> plot(tS3[, 2])
> par(mar = c(bottom=3, 4.1, top=2, 2.1))
> plot(tS3[, 3])
Time
SBI
2006−01−01 2006−07−01 2007−01−01
9899100101
SPI
2006−01−01 2006−10−01
100110120130140
SII
2006−01−01 2006−10−01
98100104108
Figure 9: With the function layout you can devide the plot device in rows and
columns expressed in matrix form defined by the argument mat.
17](https://image.slidesharecdn.com/timeseriesplot-150726004458-lva1-app6892/75/Time-seriesplot-17-2048.jpg)
![In addition widths and heights of the layout can be different from row to row,
and/or from column to column. The sizes are expressed by the arguments
widths and heights of the function layout.
> nf <- layout(mat=matrix(c(1, 1, 2, 3), byrow=TRUE, nrow=2), heights=c(2.5,1))
> par(mar = c(bottom=2, 5.1, top=3, 2.1))
> plot(tS3[, 1])
> par(mar = c(bottom=3, 5.1, top=1.5, 1.1))
> plot(tS3[, 2])
> par(mar = c(bottom=3, 4.1, top=1.5, 2.1))
> plot(tS3[, 3])
Time
SBI
2006−01−01 2006−07−01 2007−01−01
9899100101
SPI
2006−01−01 2006−10−01
100120140
SII
2006−01−01 2006−10−01
98104110
Figure 10: With the function layout one can also define the widths and heights
of the columns and rows.
18](https://image.slidesharecdn.com/timeseriesplot-150726004458-lva1-app6892/75/Time-seriesplot-18-2048.jpg)
![2.6 Bivariate Scatter Plots
For historical reasons, like in the function plot.ts, there is also the option to
create an scatter plot from two univariaye time series. Since this is not a ”true”
time series plot, we will not go in further detail for this display.
> par(mfrow=c(1,1))
> plot(tS2[, 1], tS2[, 2])
qq
qq
qqq q
qqq
q
q
q qqq qq
q qq
q
qq qq qqqq
q
q q
qqqqqq
q q
qqq
q
qqq q
q
q
qqq
q
q
q
qqqq
q
qqqq
q
qqqq
q qqq
q
q q q
qq
qq
q
q
qqqq
qqq
q
q qq qq qq qqq
qqq
qq
qq
qqqq
qqqqq
q
qq
qqq
qq qqq
qq
q
qqqq
q
q q
q
q q
q
q
qq
qq
q
qq
qq
q
q
q
q
q
qq
qq
qqq
qqq
qq
q
q
qq
q
q
q
q qq
q
qq
q
q
q
q
qqq
q
qqqq
q
q
qq
q
qq
q
q
qq q q qqqqq
qqq q
qq
q
q
q
q
q qq
qq q
qq
q q
qqqq
qq
q
qqq
qq
qqq
q
qqq
qqqq q
q
q
qq
q
q q
q qqqq
qq
q qqqq
q
q
q
q
q
q
qq
q
qq
q
qq
qq
q
q qq
qqq
qq qqq
qqq
qqq
q
q
q q qq
q
qq
qq
q
q
qq
q
q qqq
q
q
qq
q qqqq
q
qq q
q
q qq
q
q
q
qq q
q
q
qq
q
q
q
qq
q
q
q
qqq
qq
qqq
qq
98 99 100 101
100110120130140
x
y
Figure 11: If (x) and (y) are univariate time series, then the plot function will
display a scatter plot.
19](https://image.slidesharecdn.com/timeseriesplot-150726004458-lva1-app6892/75/Time-seriesplot-19-2048.jpg)


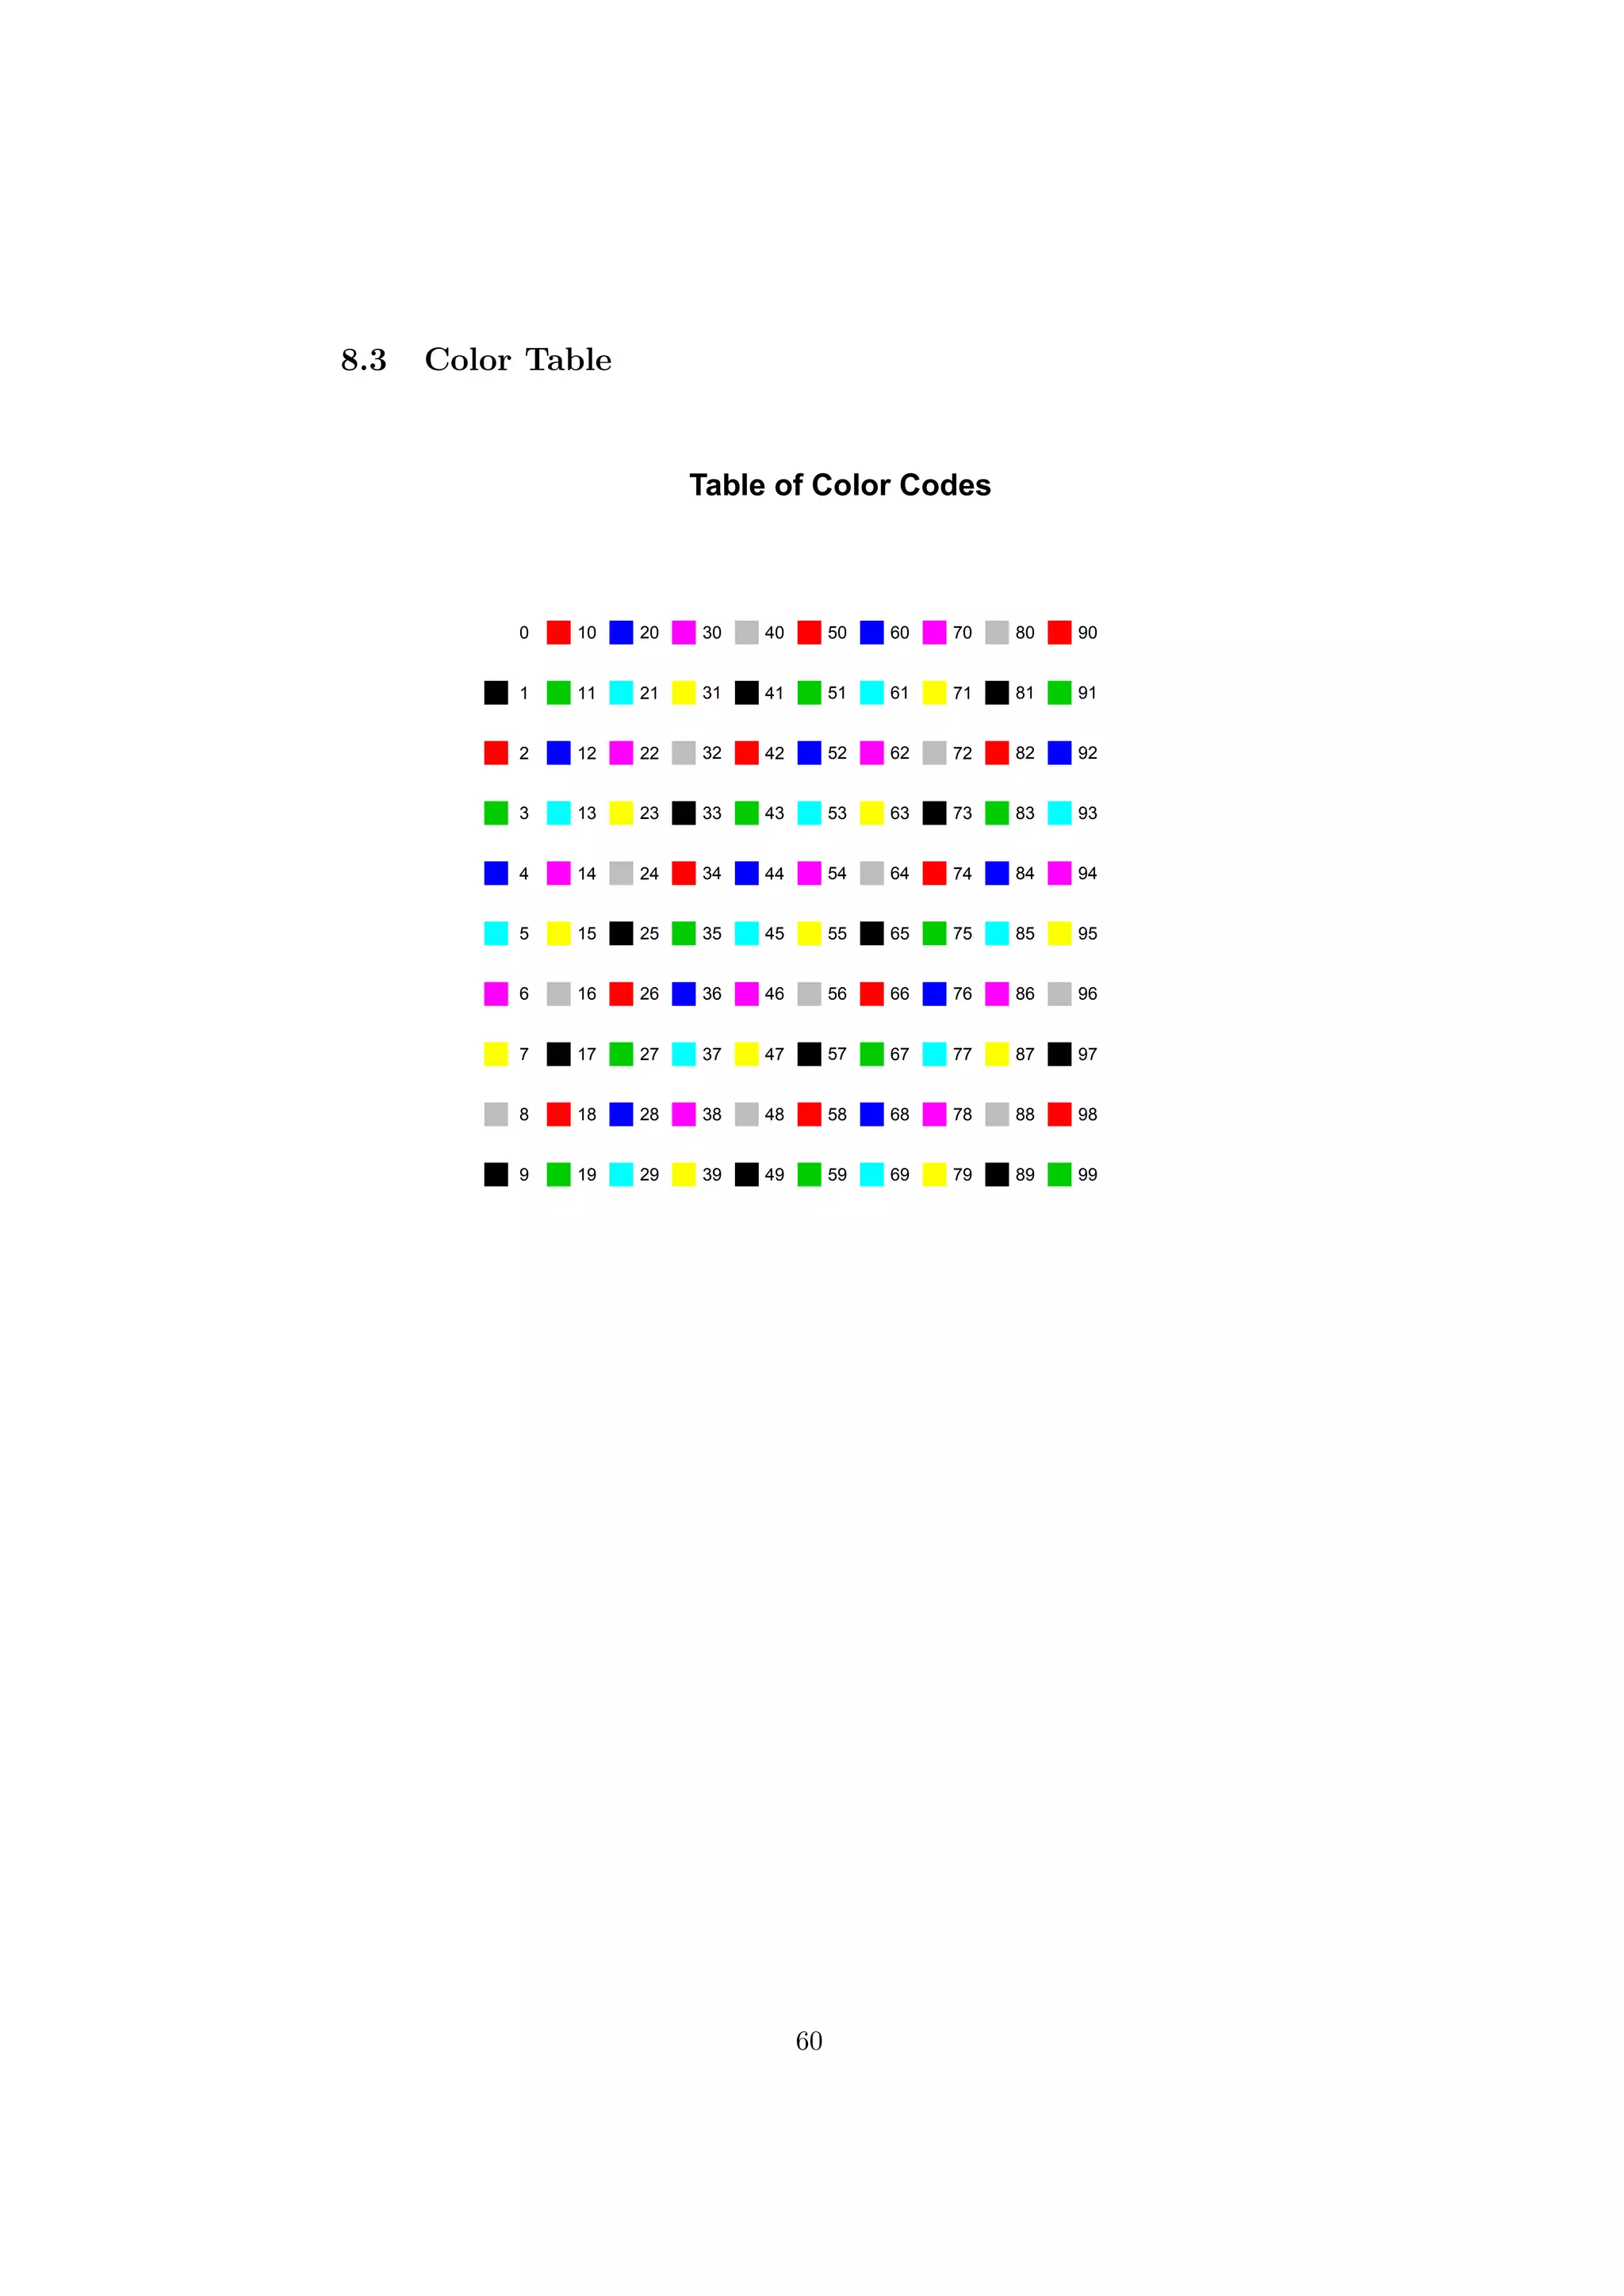
![8.2 Character Table
Table of Characters
!! ∀∀ ## ∃∃ %% && ∋∋
(( )) ∗∗ ++ ,, −− .. //
00 11 22 33 44 55 66 77
88 99 :: ;; << == >> ??
≅≅ ΑΑ ΒΒ ΧΧ ∆∆ ΕΕ ΦΦ ΓΓ
ΗΗ ΙΙ ϑϑ ΚΚ ΛΛ ΜΜ ΝΝ ΟΟ
ΠΠ ΘΘ ΡΡ ΣΣ ΤΤ ΥΥ ςς ΩΩ
ΞΞ ΨΨ ΖΖ [[ ∴∴ ]] ⊥⊥ __
αα ββ χχ δδ εε φφ γγ
ηη ιι ϕϕ κκ λλ µµ νν οο
ππ θθ ρρ σσ ττ υυ ϖϖ ωω
ξξ ψψ ζζ {{ || }} ∼∼
ϒϒ ′′ ≤≤ ⁄⁄ ∞∞ ƒƒ ♣♣
♦♦ ♥♥ ♠♠ ↔↔ ←← ↑↑ →→ ↓↓
°° ±± ″″ ≥≥ ×× ∝∝ ∂∂ ••
÷÷ ≠≠ ≡≡ ≈≈ …… ↵↵
ℵℵ ℑℑ ℜℜ ℘℘ ⊗⊗ ⊕⊕ ∅∅ ∩∩
∪∪ ⊃⊃ ⊇⊇ ⊄⊄ ⊂⊂ ⊆⊆ ∈∈ ∉∉
∠∠ ∇∇ ®® ©© ™™ ∏∏ √√ ⋅⋅
¬¬ ∧∧ ∨∨ ⇔⇔ ⇐⇐ ⇑⇑ ⇒⇒ ⇓⇓
◊◊ 〈〈 ®® ©© ™™ ∑∑
〉〉 ∫∫ ⌠⌠ ⌡⌡
0 1 2 3 4 5 6 7
4
5
6
7
10
11
12
13
14
15
16
17
20
21
22
23
24
25
26
27
30
31
32
33
34
35
36
37
59](https://image.slidesharecdn.com/timeseriesplot-150726004458-lva1-app6892/75/Time-seriesplot-59-2048.jpg)
![8.6 Symbol Table
Table of Plot Characters
0
q 1
2
3
4
5
6
7
8
9
q 10
11
12
q 13
14
15
q 16
17
18
q 19
q 20
q 21
22
23
24
25
26
27
28
29
30
31
32
! 33
" 34
# 35
$ 36
% 37
& 38
' 39
( 40
) 41
* 42
+ 43
, 44
− 45
46
/ 47
0 48
1 49
2 50
3 51
4 52
5 53
6 54
7 55
8 56
9 57
: 58
; 59
< 60
= 61
> 62
? 63
@ 64
A 65
B 66
C 67
D 68
E 69
F 70
G 71
H 72
I 73
J 74
K 75
L 76
M 77
N 78
O 79
P 80
Q 81
R 82
S 83
T 84
U 85
V 86
W 87
X 88
Y 89
Z 90
[ 91
92
] 93
^ 94
_ 95
‘ 96
a 97
b 98
c 99
d 100
e 101
f 102
g 103
h 104
i 105
j 106
k 107
l 108
m 109
n 110
o 111
p 112
q 113
r 114
s 115
t 116
u 117
v 118
w 119
x 120
y 121
z 122
{ 123
| 124
} 125
~ 126
• 127
128
129
130
131
132
133
134
135
136
137
138
139
140
141
142
143
144
145
146
147
148
149
150
151
152
153
154
155
156
157
158
159
160
161
162
163
164
165
166
167
168
169
170
171
172
173
174
175
176
177
178
179
180
181
182
183
184
185
186
187
188
189
190
191
192
193
194
195
196
197
198
199
200
201
202
203
204
205
206
207
208
209
210
211
212
213
214
215
216
217
218
219
220
221
222
223
224
225
226
227
228
229
230
231
232
233
234
235
236
237
238
239
240
241
242
243
244
245
246
247
248
249
250
251
252
253
254
255
63](https://image.slidesharecdn.com/timeseriesplot-150726004458-lva1-app6892/75/Time-seriesplot-63-2048.jpg)
![8.7 Axis Style ”pretty”
> FORMAT <- tS1@format
> FORMAT
[1] "%Y-%m-%d"
> POSITIONS <- pretty(tS1)
> POSITIONS
GMT
[1] [2006-01-01] [2006-04-01] [2006-07-01] [2006-10-01] [2007-01-01]
[6] [2007-04-01]
> LABELS <- pretty(tS1)
> LABELS
GMT
[1] [2006-01-01] [2006-04-01] [2006-07-01] [2006-10-01] [2007-01-01]
[6] [2007-04-01]
64](https://image.slidesharecdn.com/timeseriesplot-150726004458-lva1-app6892/75/Time-seriesplot-64-2048.jpg)
![8.8 Axis Style ”chic”
> axTicksByTime <-
+ function (x, ticks.on = "auto", k = 1, labels = TRUE, format.labels = TRUE,
+ ends = TRUE, gt = 2, lt = 30)
+ {
+ if (timeBased(x)) x <- xts(rep(1, length(x)), x)
+ tick.opts <- c("years", "months", "weeks", "days", "hours", "minutes", "seconds")
+ tick.k.opts <- c(10, 5, 2, 1, 6, 1, 1, 1, 4, 2, 1, 30, 15, 1, 1)
+ if (ticks.on %in% tick.opts) {
+ cl <- ticks.on[1]
+ ck <- k
+ } else {
+ tick.opts <- paste(rep(tick.opts, c(4, 2, 1, 1, 3, 3, 1)), tick.k.opts)
+ is <- structure(rep(0, length(tick.opts)), .Names = tick.opts)
+ for (i in 1:length(tick.opts))
+ {
+ y <- strsplit(tick.opts[i], " ")[[1]]
+ ep <- endpoints(x, y[1], as.numeric(y[2]))
+ is[i] <- length(ep) - 1
+ if (is[i] > lt) break
+ }
+ nms <- rev(names(is)[which(is > gt & is < lt)])[1]
+ cl <- strsplit(nms, " ")[[1]][1]
+ ck <- as.numeric(strsplit(nms, " ")[[1]][2])
+ }
+ if (is.null(cl)) ep <- NULL else ep <- endpoints(x, cl, ck)
+ if (ends) ep <- ep + c(rep(1, length(ep) - 1), 0)
+ if (labels)
+ {
+ if (is.logical(format.labels) || is.character(format.labels))
+ {
+ unix <- ifelse(.Platform$OS.type == "unix", TRUE, FALSE)
+ time.scale <- periodicity(x)$scale
+ fmt <- ifelse(unix, "%n%b%n%Y", "%b %Y")
+ if (time.scale == "weekly" | time.scale == "daily")
+ fmt <- ifelse(unix, "%b %d%n%Y", "%b %d %Y")
+ if (time.scale == "minute" | time.scale == "hourly")
+ fmt <- ifelse(unix, "%b %d%n%H:%M", "%b %d %H:%M")
+ if (time.scale == "seconds")
+ fmt <- ifelse(unix, "%b %d%n%H:%M:%S", "%b %d %H:%M:%S")
+ if (is.character(format.labels))
+ fmt <- format.labels
+ names(ep) <- format(index(x)[ep], fmt)
+ } else {
+ names(ep) <- as.character(index(x)[ep])
+ }
+ ep
65](https://image.slidesharecdn.com/timeseriesplot-150726004458-lva1-app6892/75/Time-seriesplot-65-2048.jpg)
![References
[1] Achim Zeileis and Gabor Grothendieck (2005): zoo: S3 Infrastructure for
Regular and Irregular Time Series. Journal of Statistical Software, 14(6),
1-27. URL http://www.jstatsoft.org/v14/i06/
[2] Adrian Trapletti and Kurt Hornik (2007): tseries: Time Series Analysis
and Computational Finance. R package version 0.10-11.
[3] Diethelm W¨urtz et al. (2007): Rmetrics: Rmetrics - Financial
Engineering and Computational Finance. R package version 260.72.
http://www.rmetrics.org
[4] International Organization for Standardization (2004): ISO 8601: Data
elements and interchage formats — Information interchange — Represen-
tation of dates and time URL http://www.iso.org
[5] R Development Core Team: R: A Language and Environment for Statisti-
cal Computing, R Foundation for Statistical Computing, Vienna, Austria.
ISBN 3-900051-07-0, URL http://www.R-project.org
[6] Jeffrey A. Ryan (2008): quantmod: Quantitative Financial Modelling
Framework. R package version 0.3-5. URL http://www.quantmod.com
URL http://r-forge.r-project.org/projects/quantmod
69](https://image.slidesharecdn.com/timeseriesplot-150726004458-lva1-app6892/75/Time-seriesplot-69-2048.jpg)